
94% of researchers rate our articles as excellent or good
Learn more about the work of our research integrity team to safeguard the quality of each article we publish.
Find out more
ORIGINAL RESEARCH article
Front. Signal Process., 05 October 2022
Sec. Biomedical Signal Processing
Volume 2 - 2022 | https://doi.org/10.3389/frsip.2022.986293
This article is part of the Research TopicTime-Frequency and Machine Learning Applications for Biomedical SignalsView all 4 articles
 Leticia Silva2,3*
 Carlos Valadão2Lucas Lampier2
 Denis Delisle-Rodríguez4Eliete Caldeira1Teodiano Bastos-Filho1,2
 Sridhar Krishnan3
Since the COVID-19 outbreak, a major scientific effort has been made by researchers and companies worldwide to develop a digital diagnostic tool to screen this disease through some biomedical signals, such as cough, and speech. Joint time–frequency feature extraction techniques and machine learning (ML)-based models have been widely explored in respiratory diseases such as influenza, pertussis, and COVID-19 to find biomarkers from human respiratory system-generated acoustic sounds. In recent years, a variety of techniques for discriminating textures and computationally efficient local texture descriptors have been introduced, such as local binary patterns and local ternary patterns, among others. In this work, we propose an audio texture analysis of sounds emitted by subjects in suspicion of COVID-19 infection using time–frequency spectrograms. This approach of the feature extraction method has not been widely used for biomedical sounds, particularly for COVID-19 or respiratory diseases. We hypothesize that this textural sound analysis based on local binary patterns and local ternary patterns enables us to obtain a better classification model by discriminating both people with COVID-19 and healthy subjects. Cough, speech, and breath sounds from the INTERSPEECH 2021 ComParE and Cambridge KDD databases have been processed and analyzed to evaluate our proposed feature extraction method with ML techniques in order to distinguish between positive or negative for COVID-19 sounds. The results have been evaluated in terms of an unweighted average recall (UAR). The results show that the proposed method has performed well for cough, speech, and breath sound classification, with a UAR up to 100.00%, 60.67%, and 95.00%, respectively, to infer COVID-19 infection, which serves as an effective tool to perform a preliminary screening of COVID-19.
COVID-19 (coronavirus disease 2019) is a contagious infectious disease caused by the new SARS-CoV-2 (severe acute respiratory syndrome coronavirus 2) virus, which was declared a global pandemic on 11 February 2020, by the World Health Organization (WHO) (World Health Organization, 2020). According to information provided by the Center for Systems Science and Engineering (CSSE) at Johns Hopkins University (JHU), accessed on 31 July 2022, almost 548 million people have been infected and more than 6.4 million people have died in the last two years. In Brazil, more than 33 million cases have been reported (with more than 678,000 deaths), and in Canada, more than 4 million cases have been reported (and almost 43,000 deaths) (Johns Hopkins University, 2022).
Clinical manifestations of COVID-19 infection vary from asymptomatic to symptomatic. This infection affects the respiratory system and includes symptoms such as fever, dry cough, dyspnea, headache, sputum production, hemoptysis, myalgia, fatigue, nausea, vomiting, diarrhea, abdominal pain, and loss of smell and taste (Oliveira et al., 2020; Rai et al., 2021). About 25% of patients with mild-to-moderate COVID-19 have been found to have dysphonia since multiple body structures are linked to human voice generation, such as the lungs, vocal folds, and laryngeal muscle (Suppakitjanusant et al., 2021). Thus, respiratory sounds such as cough, speech, and breath may be an important biomarker for COVID-19 diagnosis.
Audio signals generated by body structures and organs have been widely explored for diagnosis and monitoring of diseases by clinicians and clinical researchers (Brown et al., 2020). In Pramono et al. (2016), a pertussis identification algorithm is proposed by using cough and whoop sounds. They extracted several features, such as Mel-frequency cepstral coefficients (MFCCs) and the zero crossing rate (ZCR), and further used a logistic regression (LR) model-based classifier. Pahar et al. (2021) utilized cough sounds produced by patients with tuberculosis and other lung ailments to distinguish both diseases by MFCCs and the ZCR.
In the same direction, various research studies employing respiratory sounds were conducted for COVID-19 screening (Brown et al., 2020; Casanova et al., 2021; Schuller et al., 2021; Verde et al., 2021; Pahar et al., 2022; Pleva et al., 2022; Sharma et al., 2022; Villa-Parra et al., 2022). Cough and breathing sounds from COVID-19, asthmatic, and healthy individuals were utilized by Brown et al. (2020). A total of 733 dimensional features were extracted by several methods, including MFCCs and the ZCR, which were reduced afterward by principal component analysis (PCA) and tested in classifiers such as LR, gradient boosting trees, and support vector machines (SVMs). In Verde et al. (2021), only voice alterations due to COVID-19 infection were estimated by the main discriminant features used in clinical practice to assess the voice quality and for voice classification, such as MFCCs and spectral roll-off (SR). Experimental research is presented by Pahar et al. (2022) to detect COVID-19 with cough, breath, and speech sounds by using deep transfer learning and bottleneck features, employing the convolution neural network (CNN), long short-term memory network (LSTM), and ResNet50 architecture for classification. On the other hand, in Sharma et al. (2022), a model from textural features and the k-nearest neighbor (KNN) classifier was utilized in COVID-19 screening.
In this work, we propose a texture-based method for COVID-19 respiratory sound classification, which captures texture-related information from its spectrogram representation. We hypothesize that using texture-based features may increase class discrimination with low computational complexity. Although texture-based approaches are widely used in image classification, a lack of research using them in biomedical signal processing is observed. It is to be noted that the various aforementioned research studies utilized acoustic (i.e., ZCR) or deep features (i.e., deep transfer learning) (Sharma et al., 2022). Our study utilized cough, speech, and breath sounds from three different databases to evaluate our proposed methodology. The textural information is captured by employing local binary patterns and local ternary patterns.
This study is structured into four sections as follows. Section 2 describes the dataset, followed by the proposed system to detect the presence of SARS-CoV-2 through cough, speech, and breath analysis. Afterward, the results and discussions are presented in Section 3 and Section 4, respectively, in which the performance of our approach is analyzed. Finally, the conclusions about the proposed method are given in Section 5.
As shown in Figure 1, the workflow of our proposed system to infer COVID-19 by cough, speech, and breath sounds is presented. The following sections will detail each step.
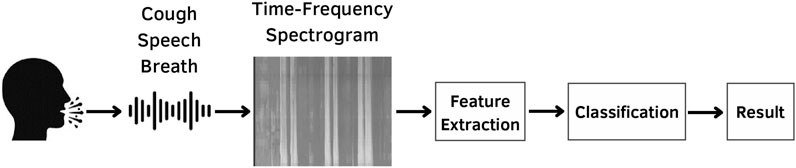
FIGURE 1. Proposed scheme for COVID-19 screening using cough, speech, and breath sounds.
The COVID-19 sound dataset from Cambridge University was utilized with mutual agreement for a research purpose. This dataset is approved at Cambridge University, Department of Computer Science and Technology, by following all requisites from the ethics committee. In the following section, the databases are described.
In the INTERSPEECH 2021 Computational Paralinguistics Challenge (ComParE), two out of four sub-challenges were used in this work, which are the COVID-19 cough sub-challenge (CCS) and the COVID-19 speech sub-challenge (CSS). For both CCS and CSS, cough sounds and speech recordings with COVID-19 positive/negative audios were used to predict a COVID-19 infection. The “COVID-19 Sounds App” was used to collect audio data via multiple platforms (a webpage, an Android app, and an iOS app). Each participant was requested to provide one to three forced coughs and say “I hope my data can help to manage the virus pandemic” one to three times. Finally, each recording was manually checked, resampled, and converted to 16 kHz and mono/16 bit (Schuller et al., 2021). Table 1 shows a detailed sample distribution for this dataset. It is to be noted that the number of healthy individuals (labeled as # negative) is significantly higher than individuals infected with COVID-19, especially for the cough recordings (409 more healthy samples). To compare with the ComParE sub-challenge results, the official challenge partitions for training, validation, and testing were used in our experiments.
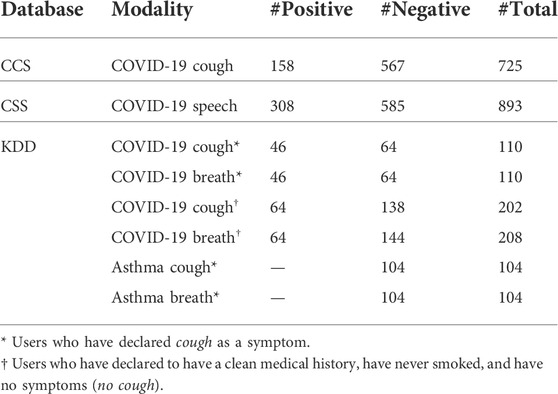
TABLE 1. Sample distribution of the databases utilized in our experiments with respect to modality, number of COVID-19-positive samples (#Positive), number of COVID-19-negative samples (#Negative), and total number of samples (#Positive + #Negative, # Total).
In this crowdsourced dataset, the aforementioned “COVID-19 Sounds App” was also utilized to record, in addition to cough and speech, breathing sounds. However, as in the study by Brown et al. (2020), only cough and breathing sounds were used in our study. Five different sets of users were selected from this database: positive COVID-19 with cough as a symptom, positive COVID-19 without cough as a symptom, healthy with cough as a symptom, healthy without cough as a symptom, and asthma with cough as a symptom. Unlike CCS and CSS, the Cambridge KDD database is split between web-based and Android partitions (Brown et al., 2020). As in the study by Sharma et al. (2022), in our research, we utilized the subset, which is collected by the Android application only due to the wide prevalence of smartphone users. As for CCS and CSS datasets, the data in Cambridge KDD are unbalanced (see Table 1), especially for individuals who declared a clean medical history (nonsmoking and no symptoms).
In general, an audio can be represented through a two-dimensional representation by considering the time and amplitude variation. Figure 2A shows an example of cough, speech, and breath sound signals in the time domain, respectively. Audio can also be transformed into a time and frequency representation. The time–frequency representation (TFR) of the audio allows us to analyze its embedded data, with spectrograms being the most commonly used (see Figure 2B). A spectrogram represents short time periods of a signal and the power spectrum for different frequency ranges, and it can be visualized through an image for easy interpretation (Sharma et al., 2022). In our study, we utilized the Mel spectrogram to represent the COVID-19 respiratory sounds (Zhou et al., 2021).
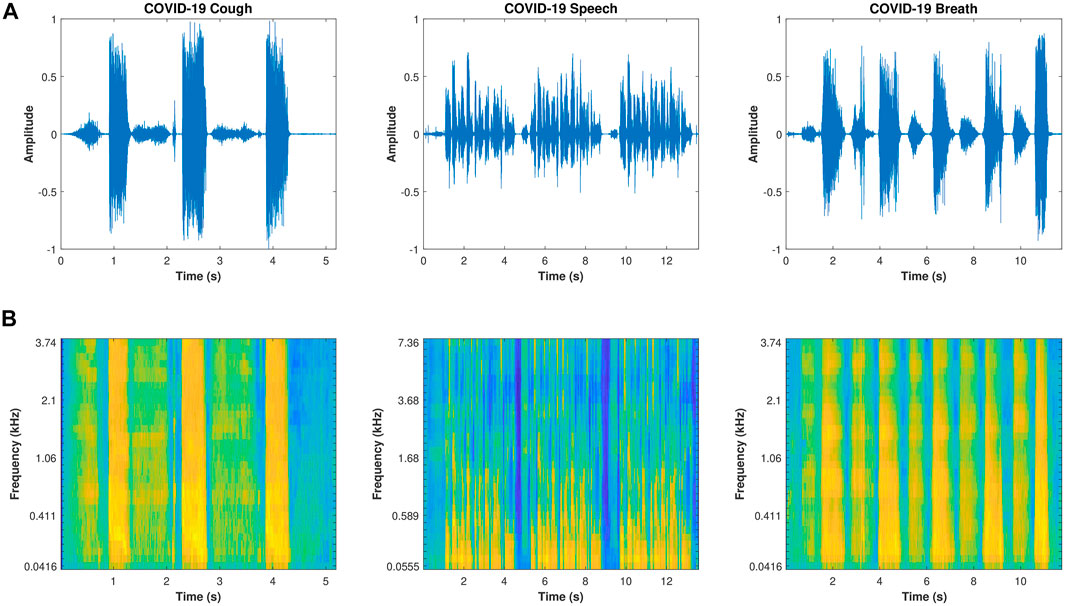
FIGURE 2. Cough, speech, and breath signal representation. (A) shows the signals in the time domain; (B) shows the time–frequency Mel spectrogram representation.
The Mel spectrogram is computed by extracting the coefficients relative to the compositional frequencies with a short-time Fourier transform (STFT). As the human ear does not perceive frequencies on a linear scale (lower frequencies are better to discriminate than higher frequencies), the main idea of the Mel scale is to mimic the non-linear human ear perception (Nanni et al., 2021; Zhou et al., 2021). Each frame of the spectrum is passed through a Mel filter bank, and the conversion between Hertz (f) and Mel (m) can be calculated using Eq. 1.
In order to use machine learning techniques for training models to classify cough from COVID-19 and healthy individuals, it is necessary to extract features from the Mel spectrograms. Recently, various research studies using audio textures have shown good results for pathological speech screening (Sharma et al., 2020) and analysis (Sharma et al., 2021), COVID-19 respiratory sound analysis (Sharma et al., 2022), and lung sound classification (Sengupta et al., 2017). Texture analysis is important in applications, such as face and pattern recognition (Sharma et al., 2020). In the proposed study, we extract two common texture features from the Mel spectrogram images, local binary patterns, and local ternary patterns, which will be described in detail in the following subsections.
The local binary pattern (LBP) is widely used in image processing for texture analysis because it is a simple and efficient operator to measure the spatial representation of local image texture and gray scale contrast. For instance, it has been used in lung sound classification (Sengupta et al., 2017), pathological speech screening (Sharma et al., 2020) and analysis (Sharma et al., 2021), COVID-19 screening (Sharma et al., 2022), scene classification (Abidin et al., 2018), and snore discrimination (Demir et al., 2018). The original LBP, termed “uniform,” compares each pixel of a neighborhood (the original LBP considers a region of 3 × 3) to the center pixel value. Negative results are encoded with 0 and the other with 1, and its decimal correspondent number is used (Ojala et al., 2002). Figure 3 shows an example of LBP. After extracting the Mel spectrogram, the image representation was converted from RGB to the gray scale. Thereafter, the LBP features were extracted from the gray scale image. We selected a radius of 3 units and eight sampling points as proposed by Sharma et al. (2022) and normalized it by the L2 norm to make features invariant to rotations, resulting in 59 dimensional LBP features.
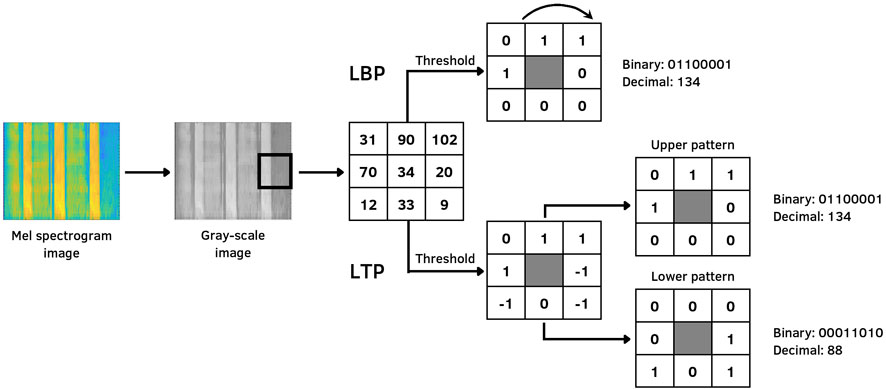
FIGURE 3. Example of LBP and LTP encoding from the Mel spectrogram.
The local ternary pattern is an extension of the LBP local texture descriptor, which is more discriminant and less sensitive to noise in uniform regions. It has been used for, e.g., speech emotion recognition (Sönmez and Varol, 2020), fall detection (Adnan et al., 2018), and heart sound classification (Er, 2021). Instead of representing values through thresholds such as 0 and 1 as in the case of LBP, LTP uses a constant threshold to represent (or convert) pixels into three values: − 1, 0, and 1. In order to reduce the feature vector dimension and computational time, each ternary pattern is split into two parts, the upper pattern and the lower pattern, as shown in Figure 3. The first one is the positive part, whereas the second is negative (Tan and Triggs, 2010). Similar to LBP, the LTP features were computed over Mel spectrogram gray-scale images, with a radius of 3 units; eight sampling points were selected, and 512 dimensional LTP features were utilized.
Based on the aforementioned databases, our study focused on different classification tasks to infer COVID-19 contamination, which is described as follows.
• C1: distinguish through cough sounds, users who have declared they tested positive for COVID-19 from users who have not declared a positive test for COVID-19.
• C2: distinguish through speech sounds, users who have declared they tested positive for COVID-19 from users who have not declared a positive test for COVID-19.
• C3: distinguish through cough and speech sounds, users who have declared they tested positive for COVID-19 from users who have not declared a positive test for COVID-19.
• K1: distinguish by employing cough sounds, users who have declared they tested positive for COVID-19 (COVID-positive) from users who have not declared a positive test for COVID-19 (non-COVID) and have a clean medical history (nonsmoking and no symptoms.)
• K2: distinguish by employing cough sounds, users who have declared they tested positive for COVID-19 and also have declared cough as a symptom (COVID-positive with cough) from users who have declared not to have tested positive for COVID-19 and further have cough as a symptom (non-COVID with cough).
• K3: distinguish by employing breath sounds, COVID-positive users from non-COVID users.
• K4: distinguish by employing breath sounds, COVID-positive users with cough from non-COVID users with cough.
• K5: distinguish by employing cough and breath sounds, COVID-positive users with cough from non-COVID users with cough.
• K6: distinguish by employing cough sounds, COVID-positive users with cough from users who have declared not to have tested positive for COVID-19, have reported asthma and cough as a symptom.
After applying the feature extraction methods to cough, speech, and breath data, the final feature vector is utilized as input for a classifier. For both CCS and CSS databases, the original partitions were maintained: 286 samples for training, 231 for validation, and 208 for testing. On the other side, the Cambridge KDD dataset was split into 80% for training and 20% for testing. In both databases, a 10-fold cross-trial validation was utilized to avoid overfitting and underfitting. For both datasets, the support vector machine (SVM) was explored to perform binary classification. As the datasets are highly unbalanced, we utilized the unweighted average recall (UAR) for comparison.
As mentioned previously, two feature extraction methods were evaluated. Figure 4 shows the results of all nine experiments for both CCS and CSS and the Cambridge KDD database for cough, speech, and breath classification with the SVM as a classifier for COVID-19 screening.
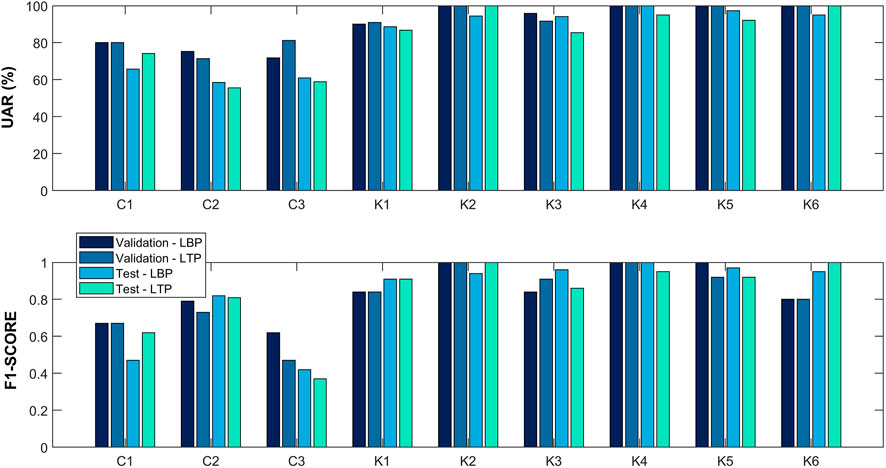
FIGURE 4. Respiratory sound classification performance for various modalities (cough, speech, and breath) in terms of the UAR and F1-score. For each experiment (C1–C3 and K1–K6), two feature extraction methods [the local binary pattern (LBP) and local ternary pattern (LTP)] were evaluated.
In the case of CCS and CSS databases, the main objective of both C1 and C2 experiments is to perform a binary classification between COVID-19 positive and negative patients by using cough and breath signals, respectively. Although LBP and LTP-based features performed the same result for the validation set (UAR = 80.00%), employing cough sounds (C1), LTP-based features achieved better results for the test set (UAR = 74.16%). Regarding C2, where speech samples were evaluated, LBP-based features achieved better results than LTP in both validation (UAR = 74.24%) and test (UAR = 58.52%) sets. In addition to the original challenges, one more experiment with CCS and CSS datasets was also carried out to investigate if the combination of cough and speech sounds could improve the distinction between COVID-19 and healthy individuals. In this experiment (C3), the results obtained in the test set for both LBP and LTP-based features are close. However, they have a significant difference in the validation set for both the UAR and F1-score.
For the Cambridge KDD dataset, six experiments were conducted (K1 to K6) with cough and/or breath sounds. As previously mentioned, the Cambridge KDD dataset has cough and breath audio samples from individuals who reported cough as a symptom or not. For almost all experiments (except K2 and K6), the LBP-based features achieved better or equal results to LTP in both validation and test sets. Also, to perform a binary classification, we conducted experiments (K1–K4) to investigate the impact of COVID-19 screening in patients with cough as a symptom from those with a clean medical history (nonsmoking and no COVID-19 symptoms). Experiment K1 demonstrated good classification by using our approach in COVID-positive and non-COVID individuals (UAR = 88.69%). As expected, in experiment K2, a UAR of 100.00% was achieved using LTP-based features in COVID-positive patients with cough and non-COVID individuals with cough. On the other hand, experiments K3 and K4 demonstrated that cough as a symptom is not a major factor in inferring COVID-19, with a UAR of 94.11% for COVID-positive patients and non-COVID individuals, and 95.00% for COVID-positive patients with cough and non-COVID patients with cough since they obtained good performance using breath sounds.
As explained by Sharma et al. (2022), in experiment K5, we also conducted an experiment using cough and breath audios combined to perform a binary classification between COVID-positive patients with cough and non-COVID individuals with cough. A UAR of 97.37% and F1-score of 0.97 were achieved using our LBP-based feature approach. On the other hand, these results suggest that combining cough and breath sounds can distinguish better between COVID-19-positive and -negative patients than cough and speech sounds together.
Asthma is one of the most prevalent chronic diseases in the United States, and respiratory infections are frequently thought to be asthma triggers (Esmaeilzadeh et al., 2022). Patients with acute asthma attacks frequently describe upper respiratory symptoms, including cough, in the days before the exacerbation starts (Pattemore et al., 1992). Then, we conducted experiment K6 to evaluate if a cough sound from an individual with a respiratory disease (asthma) can be distinguished from a COVID-positive individual with cough. In this experiment, LTP-based features achieved a UAR of 100.00% and F1-score of 1.00 for both validation and test sets.
Since the COVID-19 outbreak, several research studies have been conducted to infer infection by COVID-19 (Brown et al., 2020; Schuller et al., 2021; Zhou et al., 2021; Pahar et al., 2022; Pleva et al., 2022; Sharma et al., 2022; Villa-Parra et al., 2022). From the experiments, we can find that the proposed audio texture feature extraction can achieve a good performance in COVID-19 screening. Coppock et al. (2022) presented a summary of the INTERSPEECH 2021 ComParE. A cough and speech UAR of 75.9% (Casanova et al., 2021) and 72.1% (Schuller et al., 2021) was achieved, respectively. Although we reached a slightly lower UAR for cough (UAR = 75.54%), it is worth noting that we did not use any data augmentation and deep learning methods. On the other hand, Solera-Ureña et al. (2021) achieved a UAR of 69.3% without data augmentation using SVM as a classifier. Unlike for cough, we did not achieve a good performance for speech tasks compared to the baseline shown by Schuller et al. (2021) (UAR = 72.1%). Casanova et al. (2021), when exploring the same approach utilized for cough, had achieved a UAR of 70.3%. Klumpp et al. (2021) explored Mel spectrograms and various classifiers, such as LSTM, CNN, SVM, and LR, with data augmentation, and a UAR of 64.2% was reached. Brown et al. (2020) explored acoustic features in their research, and AUC-ROC up to 0.82 was achieved for binary classification. It is worth mentioning that various research studies utilized the accuracy (ACC) and area under the curve of receiver operating characteristic (AUC-ROC) as metrics. Sharma et al. (2022) analyzed cough, speech, and breath sounds collected from smartphones by using spectrograms and textural features (LBP and Haralick’s), and an ACC of 98.9% and 72.2% for 2- and 5-class classification tasks were reached, respectively. The authors utilized 120-dimensional features for LBP and 14-dimensional Haralick’s features. In contrast, our research utilized 59-dimensional features only. A study conducted by Pahar et al. (2022) explored deep architecture for COVID-19 detection, and they achieved an AUC-ROC of 0.98, 0.94, and 0.92, respectively, for all three sound classes (cough, breath, and speech). Respiratory audio data are also explored for chronic obstructive pulmonary disease (COPD) detection. Srivastava et al. (2021) explored MFCC features and achieved an AUC-ROC of 0.89. In addition to research using respiratory audio in COVID-19 screening, various research studies employing chest X-ray images are being conducted, such as the one by Bhatt et al. (2021). In this work, progressive resizing and transfer learning techniques are explored in normal and COVID-19-infected X-ray images, and an accuracy of up to 100.00% was achieved.
It is to be noted that various research studies explored acoustic features (Brown et al., 2020; Pahar et al., 2022), although textural features are still not much explored in audio analysis, particularly for COVID-19 screening, thus opening avenues in respiratory sound analysis. In general, our results show that LBP achieved better performance than LTP. It is worth mentioning that the main advantage of using LBP textural features is the low computational complexity, thus facilitating a mobile implementation of the proposed system to infer COVID-19 using a smartphone.
In this work, we presented a framework to infer COVID-19 by using cough, speech, and breath audios using textural features. For each respiratory sound, the Mel spectrogram was computed, and two different methods for feature extraction were performed over the Mel spectrogram gray-scale image: local binary patterns and local ternary patterns. We have evaluated the features with an SVM classifier for three different databases. Our study with different feature extraction methods reveals that the LBP-based feature is superior to LTP in most of the experiments. In addition, we have noticed that in a binary classification, cough sounds are better to distinguish between COVID-19-positive and -negative individuals.
As a limitation to our study, we performed the analysis using a small sample size. Although good performance was obtained with our proposal, it may not be a good alternative to detect COVID-19. However, it creates new opportunities to develop COVID-19 screening tools for telemedicine and remote monitoring (Sharma et al. 2022; Villa-Parra et al. 2022). In future works, we will explore data augmentation techniques (Saldanha et al., 2022), transfer learning (Bhatt et al., 2021), and interpretable deep learning models (Joshi et al., 2021) to improve the interpretability and usability of our framework to help COVID-19 diagnosis.
The data analyzed in this study are subject to the following licenses/restrictions: only credentialed users who sign the data transfer agreement can access the files. Requests to access these datasets should be directed to https://www.covid-19-sounds.org/.
Experimental design, software, and writing—original draft: LS; writing—reviewing and editing: CV, LL, DD, and EC; experimental design, supervision, and writing—reviewing and editing: TB; and experimental design, supervision, writing—reviewing and editing, and funding: SK. All authors contributed to manuscript revision and read and approved the submitted version.
This research was funded by Coordenação de Aperfeiçoamento de Pessoal de Nível Superior (CAPES/Brazil): 012/2020 and the Natural Sciences and Engineering Research Council of the Canada Discovery Grant RGPIN-2020-04628.
The authors acknowledge the financial support from Global Affairs Canada (Canadian scholarship), CAPES/Brazil (postdoctoral fellow scholarship), CNPq/Brazil (PhD and researcher scholarships), and FACITEC/Brazil (PhD scholarship).
The authors declare that the research was conducted in the absence of any commercial or financial relationships that could be construed as a potential conflict of interest.
All claims expressed in this article are solely those of the authors and do not necessarily represent those of their affiliated organizations, or those of the publisher, the editors, and the reviewers. Any product that may be evaluated in this article, or claim that may be made by its manufacturer, is not guaranteed or endorsed by the publisher.
Abidin, S., Togneri, R., and Sohel, F. (2018). Spectrotemporal analysis using local binary pattern variants for acoustic scene classification. IEEE/ACM Trans. Audio Speech Lang. Process. 26, 2112–2121. doi:10.1109/TASLP.2018.2854861
Adnan, S. M., Irtaza, A., Aziz, S., Ullah, M. O., Javed, A., and Mahmood, M. T. (2018). Fall detection through acoustic local ternary patterns. Appl. Acoust. 140, 296–300. doi:10.1016/j.apacoust.2018.06.013
Bhatt, A., Ganatra, A., and Kotecha, K. (2021). Covid-19 pulmonary consolidations detection in chest x-ray using progressive resizing and transfer learning techniques. Heliyon 7, e07211. doi:10.1016/j.heliyon.2021.e07211
Brown, C., Chauhan, J., Grammenos, A., Han, J., Hasthanasombat, A., Spathis, D., et al. (2020). Exploring automatic diagnosis of covid-19 from crowdsourced respiratory sound data. arXiv preprint arXiv:2006.05919.
Casanova, E., Candido, A., Fernandes, R. C., Finger, M., Gris, L. R. S., Ponti, M. A., et al. (2021). “Transfer learning and data augmentation techniques to the Covid-19 identification tasks in compare 2021,” in 22nd annual conference of the international speech communication association, 4301–4305.INTERSPEECH
Coppock, H., Akman, A., Bergler, C., Gerczuk, M., Brown, C., Chauhan, J., et al. (2022). A summary of the compare covid-19 challenges. arXiv preprint arXiv:2202.08981.
Demir, F., Sengur, A., Cummins, N., Amiriparian, S., and Schuller, B. (2018). 40th Annual International Conference of the IEEE Engineering in Medicine and Biology Society, Low level texture features for snore sound discrimination, (EMBC) (IEEE), 413–416.
Er, M. B. (2021). Heart sounds classification using convolutional neural network with 1d-local binary pattern and 1d-local ternary pattern features. Appl. Acoust. 180, 108152. doi:10.1016/j.apacoust.2021.108152
Esmaeilzadeh, H., Sanaei Dashti, A., Mortazavi, N., Fatemian, H., and Vali, M. (2022). Persistent cough and asthma-like symptoms post Covid-19 hospitalization in children. BMC Infect. Dis. 22, 244–248. doi:10.1186/s12879-022-07252-2
Hopkins University, Johns (2022). Covid-19 dashboard. Available at: https://coronavirus.jhu.edu/map.html (Accessed July 1, 2022).
Joshi, G., Walambe, R., and Kotecha, K. (2021). A review on explainability in multimodal deep neural nets. IEEE Access 9, 59800–59821. doi:10.1109/access.2021.3070212
Klumpp, P., Bocklet, T., Arias-Vergara, T., Vásquez-Correa, J. C., Pérez-Toro, P. A., Bayerl, S., et al. (2021). The phonetic footprint of Covid-19? Interspeech, 441–445. doi:10.21437/Interspeech.2021-1488
Nanni, L., Maguolo, G., Brahnam, S., and Paci, M. (2021). An ensemble of convolutional neural networks for audio classification. Appl. Sci. 11, 5796. doi:10.3390/app11135796
Ojala, T., Pietikainen, M., and Maenpaa, T. (2002). Multiresolution gray-scale and rotation invariant texture classification with local binary patterns. IEEE Trans. Pattern Anal. Mach. Intell. 24, 971–987. doi:10.1109/tpami.2002.1017623
Oliveira, B. A., Oliveira, L. C. d., Sabino, E. C., and Okay, T. S. (2020). Sars-cov-2 and the covid-19 disease: a mini review on diagnostic methods, 62. São Paulo: Revista do Instituto de Medicina Tropical de São Paulo. doi:10.1590/s1678-9946202062044
Pahar, M., Klopper, M., Reeve, B., Warren, R., Theron, G., and Niesler, T. (2021). Automatic cough classification for tuberculosis screening in a real-world environment. Physiol. Meas. 42, 105014. doi:10.1088/1361-6579/ac2fb8
Pahar, M., Klopper, M., Warren, R., and Niesler, T. (2022). Covid-19 detection in cough, breath and speech using deep transfer learning and bottleneck features. Comput. Biol. Med. 141, 105153. doi:10.1016/j.compbiomed.2021.105153
Pattemore, P., Johnston, S., and Bardin, P. (1992). Viruses as precipitants of asthma symptoms. i. epidemiology. Clin. Exp. Allergy 22, 325–336. doi:10.1111/j.1365-2222.1992.tb03094.x
Pleva, M., Martens, E., and Juhar, J. (2022). “Automated Covid-19 respiratory symptoms analysis from speech and cough,” in 2022 ieee 20th jubilee World symposium on applied machine intelligence and informatics (sami) (IEEE).
Pramono, R. X. A., Imtiaz, S. A., and Rodriguez-Villegas, E. (2016). A cough-based algorithm for automatic diagnosis of pertussis. PloS one 11, e0162128. doi:10.1371/journal.pone.0162128
Rai, P., Kumar, B. K., Deekshit, V. K., Karunasagar, I., and Karunasagar, I. (2021). Detection technologies and recent developments in the diagnosis of Covid-19 infection. Appl. Microbiol. Biotechnol. 105, 441–455. doi:10.1007/s00253-020-11061-5
Saldanha, J., Chakraborty, S., Patil, S., Kotecha, K., Kumar, S., and Nayyar, A. (2022). Data augmentation using variational autoencoders for improvement of respiratory disease classification. PloS one 17, e0266467. doi:10.1371/journal.pone.0266467
Schuller, B. W., Batliner, A., Bergler, C., Mascolo, C., Han, J., Lefter, I., et al. (2021). The interspeech 2021 computational paralinguistics challenge: Covid-19 cough, covid-19 speech, escalation & primates. arXiv preprint arXiv:2102.13468.
Sengupta, N., Sahidullah, M., and Saha, G. (2017). Lung sound classification using local binary pattern
Sharma, G., Prasad, D., Umapathy, K., and Krishnan, S. (2020). Screening and analysis of specific language impairment in young children by analyzing the textures of speech signal. Annu. Int. Conf. IEEE Eng. Med. Biol. Soc., 964–967. doi:10.1109/EMBC44109.2020.9176056
Sharma, G., Umapathy, K., and Krishnan, S. (2022). Audio texture analysis of Covid-19 cough, breath, and speech sounds. Biomed. Signal Process. Control 76, 103703. doi:10.1016/J.BSPC.2022.103703
Sharma, G., Zhang, X. P., Umapathy, K., and Krishnan, S. (2021). Audio texture and age-wise analysis of disordered speech in children having specific language impairment. Biomed. Signal Process. Control 66, 102471. doi:10.1016/J.BSPC.2021.102471
Solera-Ureña, R., Botelho, C., Teixeira, F., Rolland, T., Abad, A., and Trancoso, I. (2021). Transfer learning-based cough representations for automatic detection of Covid-19. Interspeech, 436–440. doi:10.21437/Interspeech.2021-1702
Sönmez, Y. l., and Varol, A. (2020). A speech emotion recognition model based on multi-level local binary and local ternary patterns. IEEE Access 8, 190784–190796. doi:10.1109/ACCESS.2020.3031763
Srivastava, A., Jain, S., Miranda, R., Patil, S., Pandya, S., and Kotecha, K. (2021). Deep learning based respiratory sound analysis for detection of chronic obstructive pulmonary disease. PeerJ Comput. Sci. 7, e369. doi:10.7717/peerj-cs.369
Suppakitjanusant, P., Sungkanuparph, S., Wongsinin, T., Virapongsiri, S., Kasemkosin, N., Chailurkit, L., et al. (2021). Identifying individuals with recent Covid-19 through voice classification using deep learning. Sci. Rep. 11, 1–7. doi:10.1038/s41598-021-98742-x
Tan, X., and Triggs, B. (2010). Enhanced local texture feature sets for face recognition under difficult lighting conditions. IEEE Trans. Image Process. 19, 1635–1650. doi:10.1109/TIP.2010.2042645
Verde, L., Pietro, G. D., Ghoneim, A., Alrashoud, M., Al-Mutib, K. N., and Sannino, G. (2021). Exploring the use of artificial intelligence techniques to detect the presence of coronavirus Covid-19 through speech and voice analysis. IEEE Access 9, 65750–65757. doi:10.1109/ACCESS.2021.3075571
Villa-Parra, A. C., Criollo, I., Valadão, C., Silva, L., Coelho, Y., Lampier, L., et al. (2022). Towards multimodal equipment to help in the diagnosis of Covid-19 using machine learning algorithms. Sensors 22, 4341. doi:10.3390/s22124341
World Health Organization (2020). Who director-general’s opening remarks at the media briefing on covid-19 - 11 march 2020. Available at: https://www.who.int/director-general/speeches/detail/who-director-general-s-opening-remarks-at-the-media-briefing-on-covid-19—11-march-2020 (Accessed June 30, 2022).
Keywords: COVID-19, local binary pattern, local ternary pattern, speech, cough, breath, machine learning, spectrogram
Citation: Silva L, Valadão C, Lampier L, Delisle-Rodríguez D, Caldeira E, Bastos-Filho T and Krishnan S (2022) COVID-19 respiratory sound analysis and classification using audio textures. Front. Sig. Proc. 2:986293. doi: 10.3389/frsip.2022.986293
Received: 04 July 2022; Accepted: 15 September 2022;
Published: 05 October 2022.
Edited by:
Shishir Maheshwari, Thapar Institute of Engineering & Technology, IndiaReviewed by:
Ketan Kotecha, Symbiosis International University, IndiaCopyright © 2022 Silva, Valadão, Lampier, Delisle-Rodríguez, Caldeira, Bastos-Filho and Krishnan. This is an open-access article distributed under the terms of the Creative Commons Attribution License (CC BY). The use, distribution or reproduction in other forums is permitted, provided the original author(s) and the copyright owner(s) are credited and that the original publication in this journal is cited, in accordance with accepted academic practice. No use, distribution or reproduction is permitted which does not comply with these terms.
*Correspondence: Leticia Silva, bGV0aWNpYS5zaWx2YS4yOUBlZHUudWZlcy5icg==
Disclaimer: All claims expressed in this article are solely those of the authors and do not necessarily represent those of their affiliated organizations, or those of the publisher, the editors and the reviewers. Any product that may be evaluated in this article or claim that may be made by its manufacturer is not guaranteed or endorsed by the publisher.
Research integrity at Frontiers
Learn more about the work of our research integrity team to safeguard the quality of each article we publish.