 Eleni Fotiadou
 Raoul Melaet1
 Rik Vullings
- 1Nemo Healthcare, Veldhoven, Netherlands
- 2Eindhoven University of Technology, Department of Electrical Engineering, Biomedical Diagnostics Lab, Eindhoven, Netherlands
The use of wearable technology for monitoring a person’s health status is becoming increasingly more popular. Unfortunately, this technology typically suffers from low-quality measurement data, making the acquisition of, for instance, the heart rate based on electrocardiography data from non-adhesive sensors challenging. Such sensors are prone to motion artifacts and hence the electrocardiogram (ECG) measurements require signal processing to enhance their quality and enable detection of the heart rate. Over the last years, considerable progress has been made in the use of deep neural networks for many signal processing challenges. Yet, for healthcare applications their success is limited because the required large datasets to train these networks are typically not available. In this paper we propose a method to embed prior knowledge about the measurement data and problem statement in the network architecture to make it more data efficient. Our proposed method aims to enhance the quality of ECG signals by describing ECG signals from the perspective of a multi-measurement vector convolutional sparse coding model and use a deep unfolded neural network architecture to learn the model parameters. The sparse coding problem was solved using the Alternation Direction Method of Multipliers. Our method was evaluated by denoising ECG signals, that were corrupted by adding noise to clean ECG signals, and subsequently detecting the heart beats from the denoised data and compare these to the heartbeats and derived heartrate variability features detected in the clean ECG signals. This evaluation demonstrated an improved in the signal-to-noise ratio (SNR) improvement ranging from 17 to 27 dB and an improvement in heart rate detection (i.e. F1 score) ranging between 0 and 50%, where the range depends on the SNR of the input signals. The performance of the method was compared to that of a denoising encoder-decoder neural network and a wavelet-based denoising method, showing equivalent and better performance, respectively.
1 Introduction
Current research trends in healthcare aim at enabling patients to be monitored in their home environment. Not only does staying at home, instead of in the hospital, improve the quality of life for the patients, but it also reduces the occupancy of hospital infrastructure and saves costs. During the recent worldwide Covid-19 pandemic, it has become even clearer that having the possibility to monitor patients out of the hospital has additional advantages as it limits the exposure of people to viruses and infections.
One of the most frequently monitored health parameters in the home environment is the heart rate, while other examples include mobility, blood pressure, and oxygen saturation. A common property between all home monitoring applications is that the quality of the signals is lower than in related hospital applications. During home monitoring, the patient can place the sensors, needed to record the desired health parameters, by him/herself, often leading to suboptimal placing. Alternatively, sensors placed in the hospital and then used at home can get detached, e.g. after showering. To compromise signal quality further, patients at home tend to move around more compared to when they are monitored in a hospital bed.
For every health parameter monitored at home, several technologies can be used to acquire that parameter. For instance, heart rate can be monitored through electrocardiography (Waller, 1887), photoplethysmography (Allen, 2007), seismocardiography (Salerno and Zanetti, 1990), etc. In the remainder of this work, we will focus our discussion on monitoring of the heart rate through electrocardiogram (ECG) measurements. However, the proposed strategy and parts of the methodology can be generalized to other home monitoring modalities.
When considering home monitoring of the ECG, wearable solutions by means of Holter recordings already exist. These are for instance used for periods up to 48 h to screen for atrial fibrillation. But also here, during episodes of movement the signal quality can degrade, complicating the analysis of the recorded data. This degradation of signal quality is even more apparent when unobtrusive sensors such as textile or capacitive electrodes are used (Ottenbacher and Heuer, 2010; Nigusse et al., 2021). Current solutions for dealing with low signal quality mainly focus on the detection of artifacts that yield unreliable inference on heart rate (Moeyersons et al., 2019). Subsequently, these unreliable segments can be ignored for any downstream assessment of the patient’s condition. In many situations this is an acceptable solution, because the heart rate does not need to be monitored 24/7. However, if we were to develop technology that can unobtrusively and continuously monitor the heart rate in a reliable way, this could unravel further possibilities for monitoring even more patients outside of the hospital.
An important challenge is therefore to develop signal processing methods that are tolerant to low quality data and enable reliable detection of the heart rate. There are different methods available in the literature that focus on estimating the clean ECG signal from its noisy observation. This ECG denoising is typically necessary as preprocessing step before the heart rate can be detected. One category of algorithms used for preprocessing consists of signal decomposition techniques like empirical mode decomposition (EMD) (Blanco-Velasco et al., 2008) and Fourier decomposition (Singh, 2018; Singhal et al., 2020). Another category of methods is based on wavelet transforms that decompose the signal, threshold it and then reconstruct it (Awal et al., 2014; Lin et al., 2014). Conventional filtering techniques (van Alsté et al., 1986; Bhaskar, 2012) and adaptive filters (Vullings et al., 2011; Hesar and Mohebbi, 2021) have been also widely used for ECG signal denoising.
Recently, breakthroughs have been made across many domains by using deep learning models, including applications in healthcare (Esteva et al., 2019; Parvaneh et al., 2019; Fotiadou et al., 2021; Yang et al., 2021). Deep learning has also attracted some research studies in ECG signal denoising with denoising autoencoders (DAEs) and generative adversarial networks (GANs) being the most representative methods (Xiong et al., 2016; Chiang et al., 2019; Singh and Pradhan, 2021; Xu et al., 2021). Despite the clear potential of these deep learning models, their success often largely depends on the amount and quality of available data to train the models. In healthcare applications, data sets are unfortunately often relatively small and high-quality reference methods, to enable supervised learning, are often lacking. In these cases, it is typically beneficial to include knowledge on the signals and application within the design of the deep learning models to enhance their data efficiency.
To leverage the potential of deep learning models and overcome the limitations concerning data availability, in this paper we propose a neural network architecture that embeds strong prior assumptions on the characteristics of the ECG signal. This culminates in a convolutional sparse coding method that aims to denoise poor-quality ECG signals, in which reliable heart rate detection is no longer possible, to the extent that heart rate detection is enabled.
This paper is organized as follows. In Section 2 the unfolded convolutional sparse coding method is discussed and motivated. Moreover, in this Section we discuss the dataset used to train and evaluate the method, as well as how this evaluation is done. In Section 3 the results of the proposed method are shown. In Section 4 these results, the setup of this study, as well as possible applications where the proposed approach can be useful are discussed. Finally, in Section 5 we draw conclusions about the feasibility and potential of the proposed approach.
2 Methodology
2.1 Properties of electrocardiography signals
The ECG reflects the electrical activity of the heart during cardiac contraction. A typical ECG complex consists of P-wave, QRS-complex and T-wave, representing atrial contraction, ventricular contraction, and ventricular relaxation, respectively (see Figure 1). For heart rate detection, we are typically interested in the detection of the R-peaks, or more specifically, in the detection of the interval between consecutive R-peaks. This RR-interval RR reflects the time between two heartbeats; the heart rate HR is calculated as HR = 60/RR and expressed in beats-per-minute (BPM).
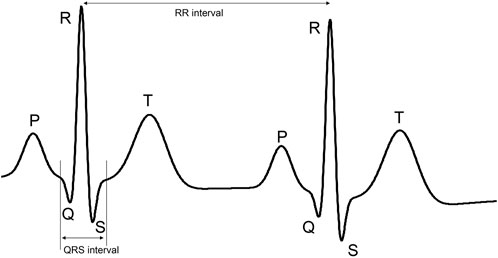
FIGURE 1. Example of ECG signal with its characteristic P-wave, QRS complex, and T-wave. The part of the ECG signal that is demarcated by the vertical lines is referred to as the QRS complex. The distance between these lines is referred to as the QRS interval. The length of this interval is used to define the kernel sizes of some layers in the proposed neural network.
Considering that for heart rate detection we are only interested in the R-peaks, or more specifically the QRS-complex, we can consider the ECG signal to be sparse. The P- and T-waves have typically much lower amplitude and hence we could consider the ECG to be a signal of zeros, except for the QRS-complex, which is corrupted by noise. Here, this noise includes the actual measurement noise and P- and T-waves.
Next to sparsity, another property of the ECG that can be leveraged in the design of deep learning models is related to spatial correlations in multi-channel measurements. The ECG is recorded as a voltage between two locations on the body. The ECG lead, meaning the vector between these two locations, can be considered a one-dimensional projection of the more complex electrical activity of the heart (Malmivuo and Plonsey, 2002). Intuitively, each ECG signal represents a different point of view on this complex electrical activity. For this reason, in many ECG applications, cardiologists resort to a 12-lead ECG as to paint a complete picture of the heart. However, this also means that several ECG leads, or equivalently: ECG channels, have strong similarities. The QRS-complex can differ in morphology, but must occur in every channel at the same point in time.
Based on the mentioned properties sparsity and spatial correlation the ECG can be described by a multi-measurement vector (i.e. multi-channel) sparse coding model.
2.2 Convolutional sparse coding
In a sparse coding model, the ECG is considered to be the linear combination of a limited number of atoms from a dictionary. In other words, the ECG can be modeled as the linear combination of a small number of QRS templates that are stored in a dictionary. The sparse coding algorithm will determine which QRS templates should be used, in parallel optimizing for two competing features: the reconstruction of the ECG complex from the templates must be as accurate as possible, while on the other hand as few as possible templates should be used. Mathematically, this can be described as:
Here,
In the model of Eq. 1, we have assumed that the ECG represents a short segment with a length of m samples from a possibly longer ECG recording. If we were to segment a longer ECG recording into shorter segments of fixed length, we cannot be sure without a priori peak detection that the sparse information occurs in the same part of every segment. The QRS-complex can be at the start of the segment, the middle, the end, etc. That means that the dictionary A in Eq. 1 must contain templates for every possible position of the QRS complex, on either side of the QRS complex padded with zeros to have the length m. Alternatively, we propose to change the sparse coding model of Eq. 1 into a convolutional sparse coding model:
Since convolutions are equivariant to translation, the dictionary only needs to contain the QRS templates and not their position within the ECG Y; This position is captured by the sparsity matrix X. Additionally, the length of the QRS complexes in the dictionary can now be freely chosen and is no longer restricted to the same length m as the ECG segments. Furthermore, in this notation
To solve the sparse coding problem, following the suggestions from Chen et al. (2021), we propose to use the Alternation Direction Method of Multipliers (ADMM) (Boyd et al., 2011). In ADMM an auxiliary matrix
ADMM proposes an iterative approach to solve an augmented Lagrangian representation of the problem in Eq. 3:
where
The iterative solution to this problem can be derived in line with the presentation by Chen et al. (2021), leading to the following set of equations where in each iteration towards the solution a cycle is made through these equations:
with η a step size, γ1 and γ2 step lengths for the Lagrangian multipliers (γ1, γ2 > 0), and
2.3 Deep unfolding model for sparse coding
As mentioned before, the solution to the ADMM problem can be found through an iterative approach. This constitutes an iterative algorithm that cycles over a small number of equations until convergence has reached. Similar approaches for solving sparse coding problems are the iterative shrinkage and thresholding algorithm (ISTA) (Beck and Teboulle, 2009). Recent advances in deep learning models have shown that iterative algorithms can be effectively described via unfolding neural networks. Here, each fold in the neural network represents one cycle over the equations in the iterative approach. Unlike conventional iterative optimization algorithms, the unfolded neural networks can rapidly converge to a solution, often requiring only a small number of folds. In Figure 2 an illustration is provided for the unfolding of the recurrent update of Zk. In the simplistic representation of the recurrent update (left panel), the update equations for Xk and
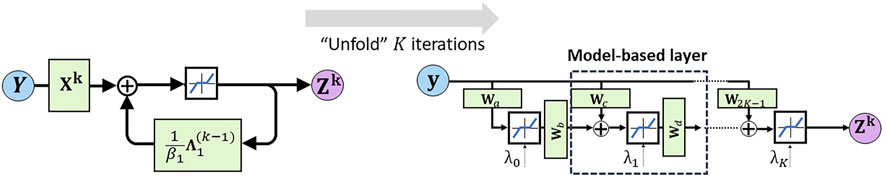
FIGURE 2. Illustration of deep unfolding of the recurrent update algorithm for Zk. The blue line within the black box (top center in the left panel) represents the row-wise shrinkage operator that stimulates sparsity of the ultimate solutions.
Following a deep unfolding approach for the entire solution of Eqs. 5a–5d, the following set of equations can be derived:
Here,
In line with the work by Solomon et al. (2020) we propose to replace the row-wise shrinkage operator
It should be noted here that the softplus function
The deep unfolding model was implemented in Keras (Chollet et al., 2015) with the Tensorflow backend. As an optimization method, we selected the Adam optimizer with a learning rate of 0.0001 and a mean squared error as loss function. The batch size was set to 64 and the number of folds to 3. In our results, we saw that the performance of the method does no longer significantly improve when adding more folds, while adding more folds will increase the computational complexity. As a final model, we chose the one that has the lowest loss on the validation dataset.
2.4 Data for training and evaluation
To evaluate the method the PTB Diagnostic ECG Database of Physionet is used (Bousseljot et al., 1995; Goldberger et al., 2000). The database comprises of both normal and pathological signals with 15 leads, from which we have used the conventional 12 leads. The database contains 549 records from 290 male and female subjects, sampled at 1,000 Hz. We corrupt the signals with additive Gaussian noise, to obtain signals with signal-to-noise ratio (SNR) from −5 to −20 dB. 458 recordings from the subjects ‘patient001′ to ‘patient224′ are used for training the network, 46 recordings from subjects ‘patient225′ to ‘patient259′ for validation and the remaining 43 recordings are kept as a test set (the recordings‘s0544_re’ and‘s0555_re’ were excluded because of poor quality). Finally, the ECG signals are divided in segments of length of 1,000 samples and normalized to have zero mean and unity standard deviation. The normalization is performed along each channel separately.
2.5 Reference methods for ECG denoising
Our method is evaluated in comparison with a wavelet-based denoising method and a denoising autoencoder (DAE). Wavelet-based denoising uses three main steps. In the first step, the wavelet transform is applied to decompose the signal into a set of wavelet coefficients; the detail and the approximation ones. In the second step, the detail coefficients are compared to a threshold and in the third step the coefficients that exceed the threshold are used together with the approximation coefficients to reconstruct the denoised signal. The symlet wavelet is selected as mother wavelet due to its resemblance with an ECG, while a fixed threshold is used.
Autoencoders are unsupervised neural networks aiming at copying inputs to outputs by learning dense representations of the input data. An autoencoder has two distinct components: an encoder and a decoder. In case of a DAE the input data are corrupted by noise and the network is trained to predict the original uncorrupted data. We compare our method with the DAE proposed by (Chiang et al., 2019), but unlike (Chiang et al., 2019) we simultaneously denoise all the 12 ECG leads and not each lead separately. The architecture of the DAE that we have used is shown in Figure 3. The size of the network’s input is set to 1024 × 12 to facilitate the subsampling operations.
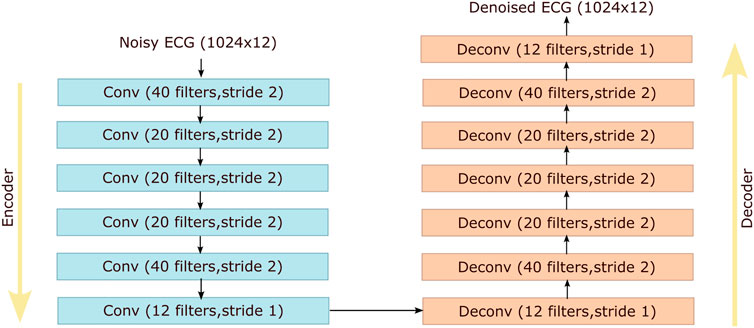
FIGURE 3. Architecture of the denoising autoencoder proposed by (Chiang et al., 2019) that is used as a reference method for comparison with our method. Conv and Deconv stand for convolutional and deconvolutional layers respectively.
2.6 Evaluation strategy
Because the goal of the proposed method is to denoise ECG signals to enable reliable detection of the heart rate, the evaluation of the method in comparison to reference methods is made based on the denoising capabilities and the correctness of the heart rate and heart rate variability (HRV) that can be detected from the denoised ECG signals. As ground truth heart rate, the heart rate and HRV are first detected from the ECG signal prior to adding the Gaussian noise (i.e., the clean ECG signal). The method used to detect the heart rate is the well-known Pan-Tompkins algorithm (Pan and Tompkins, 1985), for which we have used an open source Python implementation (Sznajder and Łukowska, 2017). As HRV features, we have used the root mean square of successive differences between adjacent RR intervals (RMSSD) and the PNN50 metric, the proportion of beat to beat interval pairs that differ by more than 50 ms.
The performance in denoising is quantified in terms of the improvement of the SNR of the ECG signals, where the clean ECG signal serves as ground truth. To quantify the performance of the heart rate detection, each detected QRS complex–or R-peak–in the ECG is compared to the QRS complexes from the clean signals. A detection is indicated to be correct if it falls within a 50 milliseconds window centered around the true QRS complex (Warmerdam et al., 2018). Based on this classification as correct or incorrect, we can define the following evaluation metrics:
where PPV is the positive predictive value, TP is true positives (i.e., QRS complexes correctly detected), FN is false negatives (i.e., QRS complexes missed), FP is false positive (i.e., QRS complexes incorrectly detected).
For the HRV features, the performance is quantified by the percentual difference between the HRV features calculated from the denoised ECG signal and those calculated from the clean ECG signal.
Every ECG recording in the dataset is a 12-lead ECG recording. In such a multi-channel recording, each heart beat (i.e., QRS complex) happens in each of the channels at the same time. Hence, many signal processing methods exploit the spatial correlation in the data to improve the detection of heart beats (Vullings et al., 2010; Lee et al., 2020). Yet, to evaluate our method on its contribution to denoising the ECG, we have considered each channel to be independent of the others, effectively expanding our dataset 12 times: a single 12-lead ECG recording is considered as 12 single-lead ECG recordings. To also present a more realistic measure of the performance of our method and the reference methods, we also evaluated the performance in retrieving the correct heart rate by only considering the channel that showed the best comparison to the ground truth heart rate.
3 Results
Conceptually, the proposed method works such that it estimates the row-sparse matrix Z, or equivalently X, and convolutes this matrix in the last fold of the unfolded recurrent architecture with a set of learned filter kernels. The result of this convolution should resemble a denoised, sparse ECG signal and therefore, we would expect that the neural network has learned that the filter kernels should resemble clean QRS complexes. To evaluate this expectation, in Figure 4 the first six kernels of this last set of filter kernels are depicted. Indeed, most of them strongly resemble QRS complexes from a clean ECG signal.
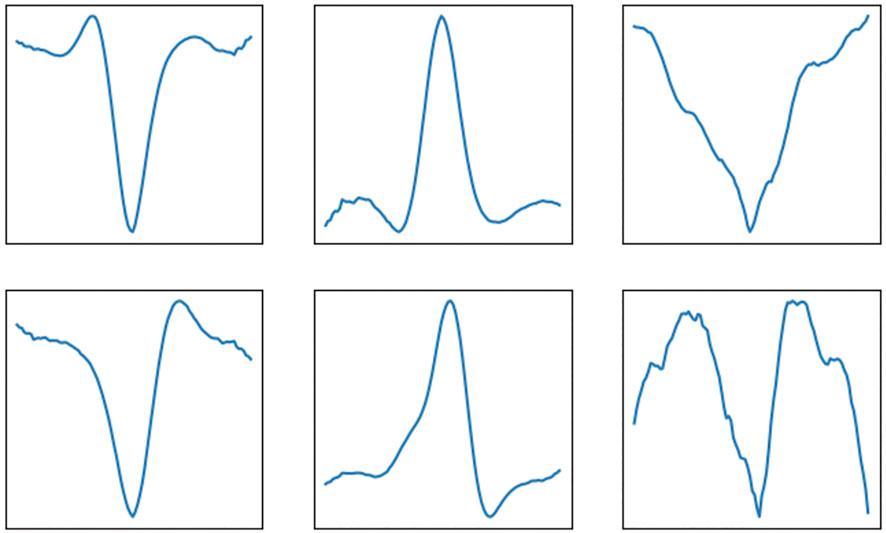
FIGURE 4. Example of filter kernels that are learned by the deep unfolding convolutional sparse coding network. These kernels are convoluted with the row-sparse matrix Z to yield the denoised ECG signals as output.
As mentioned before, the goal of the proposed method is to denoise ECG signals to the extent that reliable detection of the QRS complexes, and thereby calculation of the heart rate, becomes possible. In Figure 5 an example is provided of a clean ECG, its noisy counterpart, and the denoised signal after applying the proposed method and the reference methods (i.e., DAE and wavelet-based denoising). The red dots in the plots symbolize the locations at which the Pan-Tompkins method detected the QRS complexes.
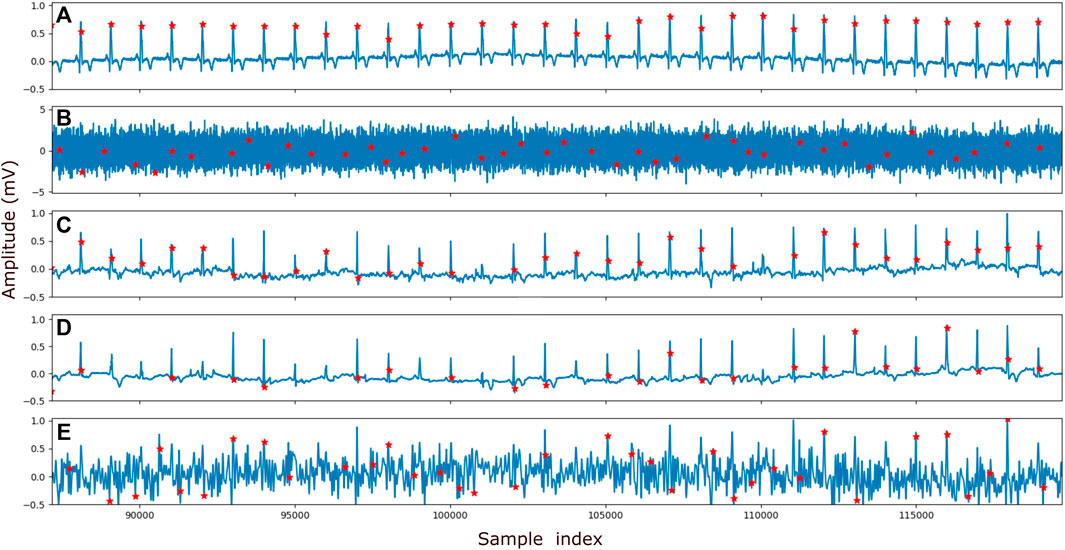
FIGURE 5. Example of the peak detection. In (A) the clean signal, (B) the signal with addded Gaussian noise of SNR −15 dB (C) the denoised signal by the proposed method, (D) the denoised signal by the reference DAE and (E) the denoised signal by the reference wavelet method is shown. The ECG recording that is visualized here is obtained from patient265, channel 12. Prior to being denoised by our proposed method and the DAE method, the ECG signals are normalized (see Section 2.4). To visualize the output of the method on the same vertical scale as the other ECG signals, the output was corrected for this normalization.
To quantify the performance of our method in denoising the ECG signals and enable heart rate detection, we applied our method and subsequently the Pan-Tompkins peak detection on the 43 recordings from the test set of our data (see Section 2.4). In this evaluation, the SNR of the input data was varied by adding higher or smaller amplitude noise. The detected QRS complexes were compared to those from the ground truth (i.e. clean ECG signal) and the performance in QRS detection was quantified via the F1, PPV, and Sensitivity metrics explained in Eqs. 10–12. The denoising performance of the methods was assessed based on the improvement in SNR of the denoised signals when compared to the noisy ones. Finally, the efficiency of the methods in extracting reliable HRV features was measured by the RMSSD and PNN50 feature comparison between the clean and the denoised signals. In Figure 6, all the performance metrics are depicted as a function of the SNR of the input data.
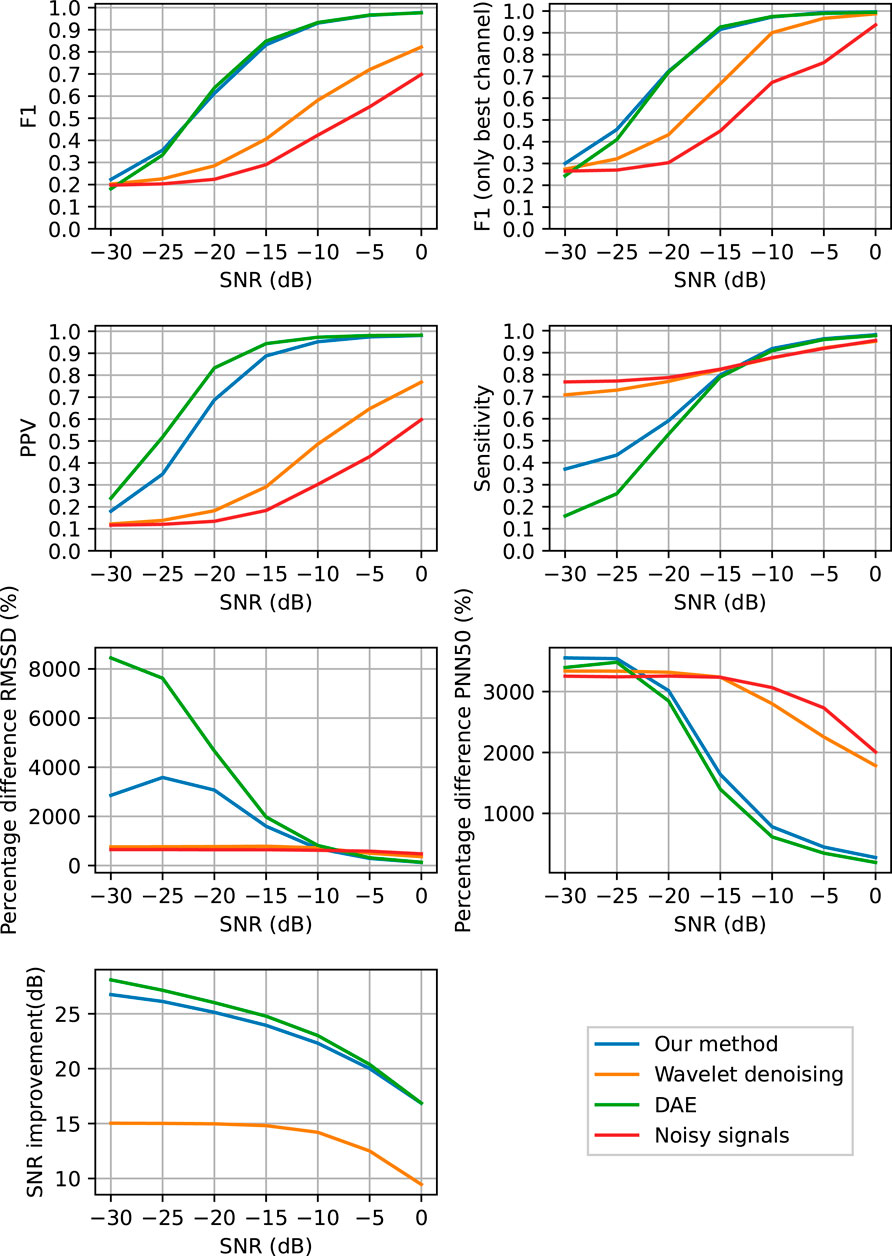
FIGURE 6. Performance of QRS complex detection, heart rate variability feature extraction and denoising as a function of the SNR of the input signals. The QRS detection was performed in ECG signals that are denoised with the proposed method (blue), with the DAE (green), with the wavelet-based method (orange), and without any denoising (red).
4 Discussion
4.1 Rationale of the study
In this paper, we proposed a deep unfolded multi-measurement vector convolutional sparse coding algorithm for denoising of ECG signals to enable more reliable heart rate detection. This algorithm is derived by the explicit embedding of strong signal priors within the architecture of a neural network. By embedding prior knowledge on signal properties, the neural network can be trained with fewer data (i.e., no data is wasted to learn structures within the data that were already known) and with a smaller memory footprint. Moreover, the resulting algorithms are typically more robust and to some extent explainable; the neural network is no longer a black box but its working can be partly understood. In our example, the neural network denoises the input data by reconstructing it from a sparse linear combination of learned filter kernels.
4.2 Performance in denoising and enabling heart rate detection
From the results in Figure 6 it can be seen that the proposed method achieves a significant improvement in SNR of the noisy ECG signals and that it outperforms the wavelet-based denoising method, while performing comparable to the DAE neural network. From the results in Figures 5, 6 it is clear that the proposed method is capable of denoising ECG signals to improve the detection of the heart rate. Also here, the proposed method performs comparable to the DAE, which was to be expected as the denoising capabilities, which is the key ingredient to enable heart rate detection, was comparable. From Figure 6 it can be concluded that both the proposed method and the DAE stand out from the wavelet-based denoising for a SNR range of the input signals between −20 and 0 dB. Below −20 dB also the proposed method and the DAE are no longer capable of sufficiently denoising the ECG signals and the detection of QRS complexes breaks down. This is evidenced by the relatively low Sensitivity of the proposed method for these low input SNRs, albeit that the Sensitivity is significantly better than that of the DAE method.
For the noisy data, the Sensitivity is close to perfect, also in case of low SNR. This can be explained by the fact that in the noisy data and also in the wavelet denoised data, the employed QRS detection method finds many peaks, most of which can be attributed to noise (i.e. false positives). However, by finding many peaks, the chance that for each of the peaks in the ground truth signal at least one peak was found in the vicinity is large, thus yielding a small number of false negatives. From the PPV and F1 metrics, it can be seen that most of the detected peaks from the noisy and wavelet-denoised data are indeed false positives.
From the HRV features in Figure 6 it can be concluded that all methods have their pro’s and con’s, but what stands out the most is that all methods differ a substantial amount from the ground truth data. A reasonable explanation for this is that the implementation of the Pan-Tompkins method used in this paper seems to perform below par, as illustrated in Figure 5. A better peak detection method would likely resolve the differences in HRV features to a large extent, but for reproducability of this study, the Pan-Tompkins method was still favored here. The proposed method and the DAE perform relatively well in terms of PNN50 for input SNR abov -10 dB, but are outperformed by the wavelet-based denoising in terms of the RMSSD. For RMSSD, the proposed method performs significantly better than the DAE method. It should be noted here that for low input SNR, the heart rate detection for all methods is already so low, that the RMSSD and PNN50 are far off from the ground truth results. At that point, it can be argued whether an error as large as 800% is really that much better than an error of 3,000%; both will yield inaccurate interpretation of the HRV.
To further boost heart rate detection in practical situations, and perhaps enable accurate heart rate detection for input SNR below −20 dB, the spatial correlation between the ECG signals could be exploited during peak detection, such as proposed in (Warmerdam et al., 2018). Moreover, as an alternative method for heart rate detection, one could consider using the row-sparse matrix Z instead of the reconstructed ECG signals that were exemplified in the results section. These reconstructed ECGs are determined by the convolution of the learned filter kernels with Z. That means that Z encodes the locations of the QRS complexes (i.e., the positions of the peak that we want to detect), while the filter kernels encode the shape of these complexes.
4.3 Limitations of our study
The performance of our proposed method was evaluated by comparing the ability of a well-known heart rate detection method in detecting the heart rate in both noisy and denoised data. To gauge the performance of our method, the input data was also denoised with a wavelet-based denoising method prior to heart rate detection. It is important to note here that the goal of our paper is to showcase an example of how signal priors can be embedded within a neural network architecture. We have chosen convolutional sparse coding of ECG signals as an appealing example, but should stress that the presented framework can be similarly applied to other problems. The presented method is therefore not (yet) intended to outperform the state-of-the-art algorithms for ECG denoising, nor has it yet been fully optimized by tuning all hyperparameters such as the number of folds and the number of filter kernels. In line with this reasoning, the benchmark method is not considered the state of the art, but constitutes a widely used generic method for signal denoising.
Future work should therefore include the further optimization of the proposed method and the comparison of the method to state-of-the-art denoising methods.
4.4 Clinical utility and future work
The proposed method is able to enhance the quality of noisy ECG signals to the extent that it is possible to detect the heart rate. It should be noted here that the detected heart rates correspond well to the heart rates from the clean reference signals, but that for some recordings small differences in heart rate can be encountered. These differences can lead to different interpretations when it comes to heart rate variability features that look at short-term variations, such as RMSSD. This means that the proposed method can be used for e.g. monitoring at home when the key interest is in monitoring heart rate trends over time or in monitoring long-term variability. To enable monitoring of short-term variability, further advances in the proposed method are still needed.
The proposed method has a few characteristics that should make it suitable for use on a wide range of problems. It was designed based on four key assumptions on the input data. 1) The input data is sparse in nature. 2) The input data is multi-channel and the sparse information in the data is present in all channels in the same position or at the same point in time. 3) The sparse information more or less repeats itself between signal segments (i.e., quasi-periodical). 4) It is a priori unknown where in the signal segments the sparse information will be. In case the last assumption is not valid and it can be a priori known where the information is, the convolutions in the proposed method can be replaced by multiplications such as fully-connected layers.
The assumptions that were made, apply to many problems around the detection of the periodicity within a multi-channel time series data, especially when these data are strongly corrupted by noise. For example, the use of multi-color photoplethysmography signals for reliable heart rate detection with smart watches (Ghamari et al., 2018), heart rate detection from ECG measurement during pregnancy (Peters et al., 2006) or with textile (Atallah et al., 2014) or capacitive electrodes (Yang et al., 2014). These applications should nevertheless be studied in future work before conclusions about the generalizability of the proposed method can be drawn.
5 Conclusion
In this paper, a method for multi-measurement vector convolutional sparse coding with unfolded deep neural networks was presented, aiming to denoise ECG signals and thereby enable reliable heart rate detection. The proposed method is capable of denoising ECG signals by accurately reconstructing them from the convolution of a limited number of filter kernels with a row-sparse matrix. The method was shown to outperform a popular wavelet-based denoising method for input ECG signals with a SNR higher than −20 dB and perform similarly to a denoising autoencoder neural network, making it suitable for applications in ambulatory or unobtrusive monitoring of the heart rate.
Data availability statement
Publicly available datasets were analyzed in this study. This data can be found here: Physionet PTB Diagnostic ECG Database https://www.physionet.org/content/ptbdb/1.0.0/#:∼:text=PhysioNet%20is%20a%20repository%20of,see%20the%20MIT%20Accessibility%20Page.
Author contributions
Author EF and RM developed the methods and performed the data analysis. Author RV conceptualized the work and drafted the paper. All authors were involved in editing and reviewing the paper.
Conflict of interest
EF, RM and RV were employed by Nemo Healthcare.
Publisher’s note
All claims expressed in this article are solely those of the authors and do not necessarily represent those of their affiliated organizations, or those of the publisher, the editors and the reviewers. Any product that may be evaluated in this article, or claim that may be made by its manufacturer, is not guaranteed or endorsed by the publisher.
References
Allen, J. (2007). Photoplethysmography and its application in clinical physiological measurement. Physiol. Meas. 28, R1–R39. doi:10.1088/0967-3334/28/3/r01
Atallah, L., Serteyn, A., Meftah, M., Schellekens, M., Vullings, R., Bergmans, J. W. M., et al. (2014). Unobtrusive ECG monitoring in the NICU using a capacitive sensing array. Physiol. Meas. 35, 895–913. doi:10.1088/0967-3334/35/5/895
Awal, M. A., Mostafa, S. S., Ahmad, M., and Rashid, M. A. (2014). An adaptive level dependent wavelet thresholding for ecg denoising. Biocybern. Biomed. Eng. 34, 238–249. doi:10.1016/j.bbe.2014.03.002
Beck, A., and Teboulle, M. (2009). A fast iterative shrinkage-thresholding algorithm for linear inverse problems. SIAM J. Imaging Sci. 2, 183–202. doi:10.1137/080716542
Blanco-Velasco, M., Weng, B., and Barner, K. E. (2008). Ecg signal denoising and baseline wander correction based on the empirical mode decomposition. Comput. Biol. Med. 38, 1–13. doi:10.1016/j.compbiomed.2007.06.003
Bousseljot, R., Kreiseler, D., and Schnabel, A. (1995). Nutzung der ekg-signaldatenbank cardiodat der ptb über das internet. Biomed. Technik/Biomedical Eng. 40, 317–318. doi:10.1515/bmte.1995.40.s1.317
Boyd, S., Parikh, N., Chu, E., Peleato, B., and Eckstein, J. (2011). Distributed optimization and statistical learning via the alternating direction method of multipliers. FNT. Mach. Learn. 3, 1–122. doi:10.1561/2200000016
Chen, Z., Xiang, J., Bagnaninchi, P., and Yang, Y. (2021). MMV-net: A multiple measurement vector network for multi-frequency electrical impedance tomography. arXiv:2105.12474v1
Chiang, H.-T., Hsieh, Y.-Y., Fu, S.-W., Hung, K.-H., Tsao, Y., and Chien, S.-Y. (2019). Noise reduction in ecg signals using fully convolutional denoising autoencoders. IEEE Access 7, 60806–60813. doi:10.1109/access.2019.2912036
Chollet, F. (2015). Keras. Available at: https://keras.io.
Esteva, A., Robicquet, A., Ramsundar, B., Kuleshov, V., DePristo, M., Chou, K., et al. (2019). A guide to deep learning in healthcare. Nat. Med. 25, 24–29. doi:10.1038/s41591-018-0316-z
Fotiadou, E., van Sloun, R., van Laar, J., and Vullings, R. (2021). A dilated inception cnn-lstm network for fetal heart rate estimation. Physiol. Meas. 42. doi:10.1088/1361-6579/abf7db
Ghamari, M., Nazeran, H., Soltanpur, C., and Nazeran, H. (2018). A review on wearable photoplethysmography sensors and their potential future applications in health care. Int. J. Biosens. Bioelectron. 4, 195–202. doi:10.15406/ijbsbe.2018.04.00125
Goldberger, A. L., Amaral, L. A., Glass, L., Hausdorff, J. M., Ivanov, P. C., Mark, R. G., et al. (2000). PhysioBank, PhysioToolkit, and PhysioNet: Components of a new research resource for complex physiologic signals
Hesar, H. D., and Mohebbi, M. (2021). An adaptive kalman filter bank for ecg denoising. IEEE J. Biomed. Health Inf. 25, 13–21. doi:10.1109/jbhi.2020.2982935
Lee, J., Kim, M., Park, H.-K., and Kim, Y. (2020). Motion artifact reduction in wearable photoplethysmography based on multi-channel sensors with multiple wavelengths. Sensors (Basel) 20, 1493. doi:10.3390/s20051493
Lin, H.-Y., Liang, S.-Y., Ho, Y.-L., Lin, Y.-H., and Ma, H.-P. (2014). Discrete-wavelet-transform-based noise removal and feature extraction for ECG signals. IRBM 35, 351–361. doi:10.1016/j.irbm.2014.10.004
Malmivuo, J., and Plonsey, R. (2002). Bioelectromagnetism - principles and applications of bioelectric and biomagnetic fields. - the internet version.
Moeyersons, J., Smets, E., Morales, J., Villa, A., De Raedt, W., Testelmans, D., et al. (2019). Artefact detection and quality assessment of ambulatory ecg signals. Comput. Methods Programs Biomed. 182, 105050. doi:10.1016/j.cmpb.2019.105050
Nigusse, A. B., Mengistie, D. A., Malengier, B., Tseghai, G. B., and Langenhove, L. V. (2021). Wearable smart textiles for long-term electrocardiography monitoring—a review. Sensors (Basel). 21, 4174. doi:10.3390/s21124174
Ottenbacher, J., and Heuer, S. (2010). Motion artefacts in capacitively coupled ECG electrodes. 25, 1059–1062. doi:10.1007/978-3-642-03882-2_282
Pan, J., and Tompkins, W. J. (1985). A real-time qrs detection algorithm. IEEE Trans. Biomed. Eng. BME-32, 230–236. doi:10.1109/tbme.1985.325532
Parvaneh, S., Rubin, J., Babaeizadeh, S., and Xu-Wilson, M. (2019). Cardiac arrhythmia detection using deep learning: A review. J. Electrocardiol. 57, S70–S74. doi:10.1016/j.jelectrocard.2019.08.004
Peters, C., Vullings, R., Bergmans, J., Oei, G., and Wijn, P. (2006). “Heart rate detection in low amplitude non-invasive fetal ecg recordings,” in Annual international conference of the IEEE engineering in medicine and biology society (IEEE), 1, 6092–6094. doi:10.1109/IEMBS.2006.259845
Salerno, D. M., and Zanetti, J. M. (1990). Seismocardiography: A new technique for recording cardiac vibrations. Concept, method, and initial observations.
Singh, P. (2018). Novel Fourier quadrature transforms and analytic signal representations for nonlinear and non-stationary time series analysis. R. Soc. open Sci. 5, 1–26. doi:10.1098/rsos.181131
Singh, P., and Pradhan, G. (2021). A new ecg denoising framework using generative adversarial network. IEEE/ACM Trans. Comput. Biol. Bioinform. 18, 759–764. doi:10.1109/tcbb.2020.2976981
Singhal, A., Singh, P., Fatimah, B., and Pachori, R. B. (2020). An efficient removal of power-line interference and baseline wander from ecg signals by employing Fourier decomposition technique. Biomed. Signal Process. Control 57, 101741. doi:10.1016/j.bspc.2019.101741
Solomon, O., Cohen, R., Zhang, Y., Yang, Y., He, Q., Luo, J., et al. (2020). Deep unfolded robust pca with application to clutter suppression in ultrasound. IEEE Trans. Med. Imaging 39, 1051–1063. doi:10.1109/tmi.2019.2941271
Sznajder, M., and Łukowska, M. (2017). Python online and offline ecg qrs detector based on the pan-tomkins algorithm. doi:10.5281/zenodo.826614
van Alsté, J., van Eck, W., and Herrmann, O. E. (1986). Ecg baseline wander reduction using linear phase filters. Comput. Biomed. Res. 5, 417–427. doi:10.1016/0010-4809(86)90037-6
van Sloun, R., Cohen, R., and Eldar, Y. (2019). Deep learning in ultrasound imaging. Proc. IEEE 108, 11–29. doi:10.1109/jproc.2019.2932116
Vullings, R., de Vries, B., and Bergmans, J. (2011). An adaptive Kalman filter for ECG signal enhancement. IEEE Trans. Biomed. Eng. 58, 1094–1103. doi:10.1109/tbme.2010.2099229
Vullings, R., Peters, C., Hermans, M., Wijn, P., Oei, S., and Bergmans, J. (2010). A robust physiology-based source separation method for QRS detection in low amplitude fetal ECG recordings. Physiol. Meas. 31, 935–951. doi:10.1088/0967-3334/31/7/005
Waller, A. D. (1887). A demonstration on man of electromotive changes accompanying the heart’s beat. J. Physiology 8, 229–234. doi:10.1113/jphysiol.1887.sp000257
Warmerdam, G. J. J., Vullings, R., Schmitt, L., Van Laar, J. O. E. H., and Bergmans, J. W. M. (2018). Hierarchical probabilistic framework for fetal R-peak detection, using ECG waveform and heart rate information. IEEE Trans. Signal Process. 66, 4388–4397. doi:10.1109/tsp.2018.2853144
Xiong, P., Wang, H., Liu, M., Zhou, S., Hou, Z., and Liu, X. (2016). Ecg signal enhancement based on improved denoising auto-encoder. Eng. Appl. Artif. Intell. 52, 194–202. doi:10.1016/j.engappai.2016.02.015
Xu, B., Liu, R., Shu, M., Shang, X., and Wang, Y. (2021). An ecg denoising method based on the generative adversarial residual network. Comput. Math. Methods Med. 2021, 1–23. doi:10.1155/2021/5527904
Yang, K., Serteyn, A., Vullings, R., and Bergmans, J. (2014). “Sensitivity analysis of heuer’s method for motion-artifacts reduction in capacitive biopotential measurements,” in 2014 IEEE biomedical circuits and systems conference (BioCAS) proceedings, 192–195. doi:10.1109/BioCAS.2014.6981695
Keywords: electrocardiogram, sparse coding, multi-measurement vector, artificial intelligence, denoising, deep learning, ADMM
Citation: Fotiadou E, Melaet R and Vullings R (2022) Deep unfolding for multi-measurement vector convolutional sparse coding to denoise unobtrusive electrocardiography signals. Front. Sig. Proc. 2:981453. doi: 10.3389/frsip.2022.981453
Received: 29 June 2022; Accepted: 16 August 2022;
Published: 13 September 2022.
Edited by:
Massimo Walter Rivolta, University of Milan, ItalyReviewed by:
Agnese Sbrollini, Marche Polytechnic University, ItalyPushpendra Singh, National Institute of Technology, India
Copyright © 2022 Fotiadou, Melaet and Vullings. This is an open-access article distributed under the terms of the Creative Commons Attribution License (CC BY). The use, distribution or reproduction in other forums is permitted, provided the original author(s) and the copyright owner(s) are credited and that the original publication in this journal is cited, in accordance with accepted academic practice. No use, distribution or reproduction is permitted which does not comply with these terms.
*Correspondence: Rik Vullings, ci52dWxsaW5nc0B0dWUubmw=