 Sunil Kumar Vengalil
 Bharath Krishnamurthy
 Neelam Sinha
- International Institute of Information Technology Bangalore, Bangalore, India
Introduction: Fundal imaging is the most commonly used non-invasive technique for early detection of many retinal diseases such as diabetic retinopathy (DR). An initial step in automatic processing of fundal images for detecting diseases is to identify and segment the normal landmarks: the optic disc, blood vessels, and macula. In addition to these structures, other parameters such as exudates that help in pathological evaluations are also visible in fundal images. Segmenting features like blood vessels pose multiple challenges because of their fine-grained structure that must be captured at original resolution and the fact that they are spread across the entire retina with varying patterns and densities. Exudates appear as white patches of irregular shapes that occur at multiple locations, and they can be confused with the optic disc, if features like brightness or color are used for segmentation.
Methods: Segmentation algorithms solely based on image processing involve multiple parameters and thresholds that need to be tuned. Another approach is to use machine learning models with inputs of hand-crafted features to segment the image. The challenge in this approach is to identify the correct features and then devise algorithms to extract these features. End-to-end deep neural networks take raw images with minimal preprocessing, such as resizing and normalization, as inputs, learn a set of images in the intermediate layers, and then perform the segmentation in the last layer. These networks tend to have longer training and prediction times because of the complex architecture which can involve millions of parameters. This also necessitates huge numbers of training images (2000‒10,000). For structures like blood vessels and exudates that are spread across the entire image, one approach used to increase the training data is to generate multiple patches from a single training image, thus increasing the total number of training samples. Patch-based time cannot be applied to structures like the optic disc and fovea that appear only once per image. Also the prediction time is larger because segmenting a full image involves segmenting multiple patches in the image.
Results and Discussion: Most of the existing research has been focused on segmenting these structures independently to achieve high performance metrics. In this work, we propose a multi-tasking, deep learning architecture for segmenting the optic disc, blood vessels, macula, and exudates simultaneously. Both training and prediction are performed using the whole image. The objective was to improve the prediction results on blood vessels and exudates, which are relatively more challenging, while utilizing segmentation of the optic disc and the macula as auxiliary tasks. Our experimental results on images from publicly available datasets show that simultaneous segmentation of all these structures results in a significant improvement in performance. The proposed approach makes predictions of all four structures in the whole image in a single forward pass. We used modified U-Net architecture with only convolutional and de-convolutional layers and comparatively.
1 Introduction
Fundal imaging, capturing retinal images using specialized cameras, is the most widely used non-invasive technique for screening of retinal diseases. These images are used to identify common eye diseases like diabetic retinopathy (DR) (Hu et al., 2015) and glaucoma, which are the most common causes for blindness, but could also be employed as indicators of cardiovascular diseases. Blood vessels (BVs), the optic disc (OD), and the macula are the normal landmarks visible in a healthy fundal image. Certain features of BVs like tortuosity are widely used for early detection of various cardiovascular diseases (Krestanova et al., 2020). However, manual identification and demarcation of fine structures like BVs require domain expertise, besides being prone to manual errors. Features extracted for the OD like cup-to-disc ratio can be used to detect glaucoma; hence, automatic detection of major landmarks in fundal images has become an active research area (Kou et al., 2020; Guo et al., 2020; Nur and Tjandrasa 2018; Jiang et al., 2018; Joshua et al., 2020; Dash et al., 2020).
Figure 1 shows a fundal image with normal landmarks like BVs, the OD, and the macula marked. The OD is the point of exit of the optic nerves that carry information from the eye to the brain. It is also the point where all the BVs enter the eye. Since there are no photosensors (rods and cones) present in the OD, it represents a blind spot in the retina. The macula is a small region with many cone cells packed together, and this region is responsible for sharp vision (Wikipedia, 2022). The center point of the macula is called the fovea. BVs that carry blood to the eye are spread across the entire region of the retina and vary in thickness and density.
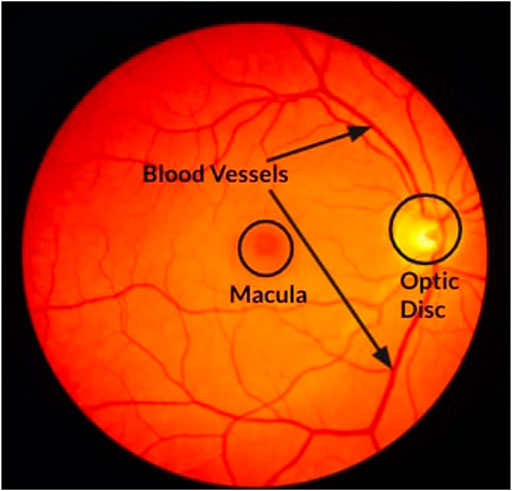
FIGURE 1. Sample fundal image showing normal landmarks, BVs, the OD, and the macula.
Figure 2A, B shows a sample fundal image with exudates and the corresponding ground-truth features. Exudates are fluids such as pus that can leak out of BVs. They are indicative of an advanced stage of DR. Exudates appear as unstructured, scattered, bright patches in the fundal image.
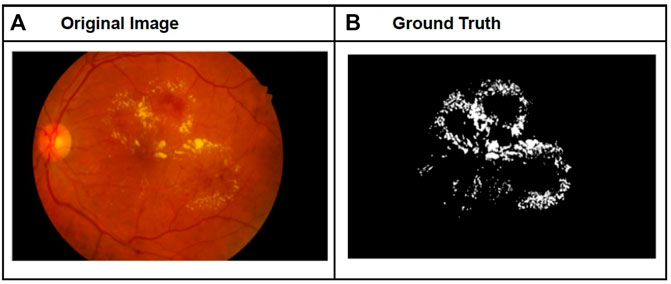
FIGURE 2. Sample fundal image with exudates (A) and corresponding ground-truth image for exudates (B).
The segmentation of BVs is the most challenging imaging task among the four structures considered because BVs are spread across the entire image with varying patterns and density. They vary in thickness, being thicker and denser near the OD and finer grained towards the ends of the branches. Down-sampling of the image as required by some approaches like neural networks will result in loss of such fine-grained vessels in the segmented image. Exudates, which are visible as irregularly shaped white patches in the fundal image, can also be spread across the entire image. Exudates can also be confused with the OD, especially those that appear very close to the OD, if features like brightness, color, and position are used for segmentation. In contrast, the fovea and OD are present only once per fundal image at a fixed location. Their shapes are also relatively predictable compared to exudates and BVs. Because of these characteristics, it is relatively easy to identify the OD and fovea.
One of the approaches for segmenting these structures is to use image processing algorithms such as thresholding, edge and shape detection, and morphological operations. Such algorithms have major drawbacks, however, such as the necessity of using multiple parameters that need to be tuned for different types of images with varying acquisition artifacts and anomalies. This can be resolved by a data-driven approach where one first identifies some generic features, such as edges, color, brightness, and location, which are crucial for the segmentation task, then extracts these features using image processing algorithms, and lastly applies a machine learning model, such as clustering or conditional random field to segment the image using the features. The challenge in this approach is to identify usable features that can be easily extracted, and that will work across tasks and across images that vary in resolution, pathology, and acquisition artifacts, and then to devise an algorithm to extract these features. One way to achieve this is to employ end-to-end deep neural networks that take raw images with minimal preprocessing such as resizing and normalization as input. The algorithm then learns a set of generic features from the initial layers, more task-specific features towards the final layers, and performs the segmentation task in the last layer. Such an effective approach is becoming popular and has been shown to out-perform both the techniques mentioned earlier.
Since the breakthrough successes of deep learning in solving tasks in domains like computer vision for classification (Krizhevsky et al., 2012 Simonyan and Zisserman, 2014), the framework has been successfully extended to more complex tasks such as semantic segmentation (Chen et al., 2017; Yu et al., 2018; Wang et al., 2018). The primary reason for the success of these deep neural networks is that the features are learned from data in the initial layers of the network, and the segmentation task is performed on these learned features in the final layer.
Recently, several deep learning architectures that were successful in segmentation (Chen et al., 2017) of natural images were tried for segmenting BVs in retinal images. Many deep learning architectures have been utilized for segmenting challenging structures such as BVs (Vengalil et al., 2016; Zhuang, 2018; Jiang et al., 2018; Park et al., 2020; Exudates Kou et al., 2020; Guo et al., 2020; Nur and Tjandrasa, 2018) in fundal images, and the results were significantly better than using conventional image processing techniques. However, one of the main challenges in using deep neural networks for segmentation is that the reduction in resolution of the feature map as one goes deeper will result in loss of fine details like edges, which are crucial for segmentation tasks. Another major issue in using deep learning architecture for medical images is limited availability of annotated training data. Deep learning models for segmentation need a large number of training images as the models have a huge number of parameters, typically in the range of 60–100 million (Long et al. 2015). The number of images required to train a model increases with the number of training parameters in the model. Our model has fewer (31 million) parameters compared to other deep learning models because it has fewer layers and there is no dense layer (i.e., the encoder network is fully convolutional, and the decoder network is fully de-convolutional). Hence, we are able to get good performance, without overfitting, even with relatively few training images. Many approaches, like taking multiple training patches from a single image (Vengalil et al., 2016) and transfer learning (Vengalil et al., 2016), have been successfully explored, but these methods also tend to have longer prediction times because of complex neural network architectures and patch-based training and prediction.
Most of the existing research has focused on segmenting different structures independently. However, in almost all the practical use cases, the goal is to detect the early development of anomalies, such as (1) exudates that are indicators of pathologies like diabetic retinopathy, 2) abnormal cup-to-disc ratios in the OD that can indicate glaucoma, and (3) anomalies in BV tortuosity which can be indicative of cardiovascular diseases. When an ophthalmologist analyzes a fundal image, it is customary to look for all these anomalies. So for any automatic diagnostic system that can reduce the need for manual intervention by an ophthalmologist, it is necessary that all these structures be segmented as a first step. It should be noted that, even if the use case is just to segment only one single anomaly like exudates, the multi-tasking model does not add any additional overhead as opposed to a model that just predicts exudates. The segmentation of exudates shows a significant improvement when a multi-tasking model is used because of the correlation between other structures and exudates; the remaining outputs can be ignored. In general, segmenting multiple structures using separate models suffers from the following problems:
1) It does not take into account the correlation between structures such as (a) BVs and the OD, where BVs are thicker and denser near and inside the OD, (b) the OD and macula, where the line connecting the centroid of the OD and macula lies approximately along a diameter of the fundal image, (c) exudates and BVs, in which the appearance of small exudates starts near the blood vessels as substances leaking out of BVs, and (d) for the OD and exudates with the possibility of confusing them with the OD. Exudates in poor quality fundal images can be avoided if the OD and the exudates are segmented together by a single model.
2) Segmenting each structure separately using different models will increase the training and prediction time as a separate DL model needs to be trained for each structure.
In this work, we propose a multi-tasking, deep learning architecture for simultaneous segmentation of BVs, the OD, the macula, and exudates. Our results show that a single network that predicts multiple structures performs better compared to detecting each structure independently using different networks, as the single network can make use of the correlation between multiple tasks. This correlation is evident from Figure 1, where it is shown that BVs are thicker and denser near and inside the OD. Thus, the task of segmentation of the OD can help the segmentation of BVs, and vice versa. Similarly, the relative positions of the OD and the macula can help to improve the segmentation performance of each of these structures. We performed experiments on BV segmentation using data from four publicly available and well-evaluated datasets: DRIVE, HRF (Budai et al., 2013), CHASE_DB, and IDRiD (Porwal, 2018). Since the numbers of images in these datasets are relatively small (40, 45, and 28, respectively), we used data augmentation techniques such as horizontal flip, vertical flip, rotation, elastic transformation, grid distortion, and optical distortion to increase the number of training images by a factor of 4–6. For segmentation of the macula, we used the IDRiD localization dataset, which contains 413 training and 103 testing images. The IDRiD dataset for exudate segmentation contained a total of 81 images, out of which 54 images were used for training and 27 for testing. The major contribution of this work is to propose a multi-tasking model for simultaneous segmentation of BVs, the OD, the macula, and exudates. The proposed multi-tasking model resulted in a 15% improvement in F1 score for exudates, besides being 12 times faster.
2 Related work
2.1 Blood vessel segmentation
Existing techniques for fundal image segmentation mainly fall into two categories: (1) traditional image processing techniques and (2) deep learning techniques. Examples of techniques for image processing include filtering (Zhang et al., 2010; Yavuz and Köse, 2011; Aslan, 2018) and morphological separation (Hassan et al., 2015; Singh et al., 2014). Image processing methods have the advantage that domain knowledge can be easily incorporated through hand-crafted features; however, they are not easily generalizable across diverse datasets. Furthermore, these algorithms are based on many customized parameters that may vary from dataset to dataset. Generalization becomes challenging since there could be hardware differences, change in acquisition conditions, different pathologies, etc.
Several types of deep learning architecture that had been successful in segmentation (Chen et al., 2017) of natural images were tried for segmenting BVs in retinal images, and the results were significantly better than using conventional image processing techniques. Vengalil et al. (2016) used a popular segmentation model, deeplab (Chen et al., 2017), which was pre-trained on natural images for semantic segmentation, to segment BVs at the pixel level. Jiang et al. (2018) proposed a pre-trained fully convolutional network for segmenting BVs and reported accuracy of cross-dataset testing on four different datasets. In M-GAN, proposed by Park et al. (2020), a multi-kernel pooling block added between stacked convolutional layers supported scale-invariance, which is a highly desirable feature for BV segmentation.
One of the main challenges in using deep neural networks for segmentation tasks is that the reduction in resolution of the feature map as one goes deeper will result in loss of fine details like edges, which are crucial for segmentation tasks. In order to circumvent this, the U-Net (Ronneberger et al., 2015) model was introduced specifically for medical image segmentation because it has multiple skip connections. In their recent work, Joshua et al. (2020) used a modified version of U-Net for segmenting BVs in retinal images and reported high levels of accuracy. Laddernet, introduced by Zhuang et al., Zhuang et al. (2018), is a sequence of multiple U-Nets cascaded together.
2.2 Exudate segmentation
Like BV segmentation, studies on exudate segmentation were also performed using both traditional image processing and deep learning techniques. Existing works on exudate segmentation using deep learning approaches include Perdomo et al. (2017), Tan et al. (2017), Feng et al. (2017), and Zheng et al. (2018). The work reported in Perdomo et al. (2017) and Kou et al. (2020) used a convolutional neural network, LeNet (LeCun et al., 1989), to classify patches extracted from fundal images into classes of “with exudates” or “without exudates.” They extracted patches of the size of 48 × 48; hence, the network did not provide pixel-wise segmentation. The work reported in Kou et al. (2020) proposed a deep learning approach, called enhanced residual U-Net (ERU-Net). Their proposed model had three U-paths each with three up-sampling paths and one down-sampling path. This structure enhanced the feature-fusion capability of the networks to capture more details about the fundal image. The proposed model also made use of residual blocks.
3 Proposed method
3.1 CNN architecture
A modified version of the U-Net architecture proposed by Ronneberger et al. (2015), shown in Figure 3, was used for segmenting various structures. The modifications are as follows:
1) Our proposed network retained the original dimensions of the input image, whereas the original U-Net described in Ronneberger et al. (2015) reduced the original input size from 572 × 572 to 388 × 388.
2) We used de-convolutional layers with a stride of two for up-sampling as opposed to the up-sampling of layers used in the original U-Net architecture. Our method has the advantage that the network also learns the interpolation weights using a de-convolutional layer.
3) We added batch normalization after each convolutional layer in order to stabilize the training process as well as for faster training.
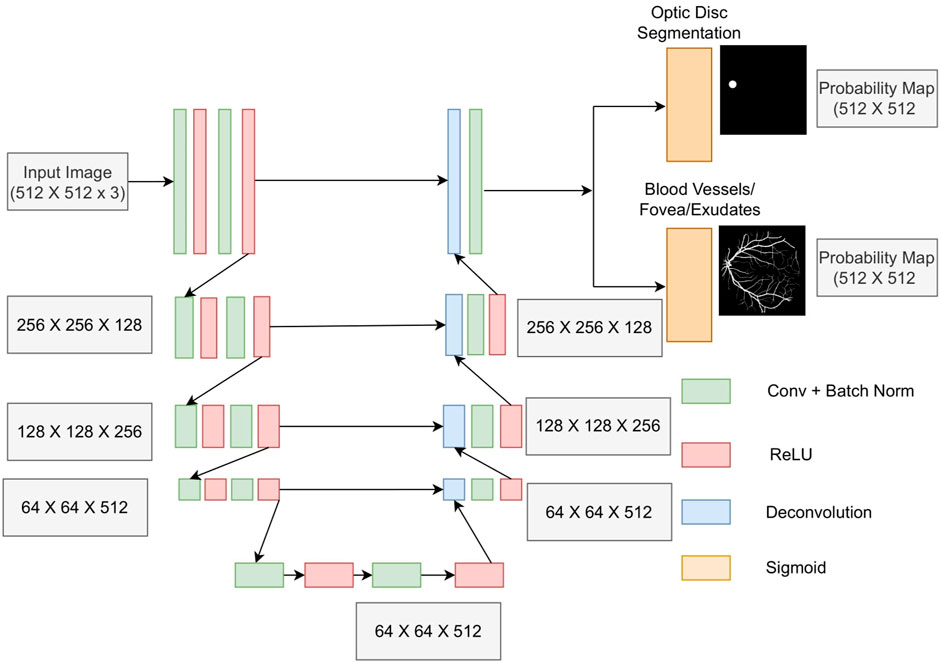
FIGURE 3. Architecture of the proposed multi-tasking U-Net model.
The encoder and decoder consist of four stages each. Each stage of the encoder comprises two convolution layers, each followed by batch normalization and an ReLU activation function. A max-pooling layer with a stride of two was added at the end of each stage of the encoder, which down-samples the image by a factor of two. Each decoder layer up-samples the image by a factor of two using a de-convolution layer followed by a convolution layer. A sigmoid function was used in the final output channel with two filters instead of the Softmax activation function because the BV and OD features were not mutually exclusive. These features shared common connections in the fundal image, and hence, their simultaneous segmentation also yielded the best results.
For multi-tasking experiments, the auxiliary task chosen was OD segmentation. We also evaluated models with different dimensions of latent representation and different numbers of channels in the bottleneck layer and reported the results for all combinations. For latent representation dimension, we experimented with different values 16 × 16, 32 × 32, 64 × 64, and 128 × 128. For the number of channels, experiments were carried out at 384, 512, 768, 1024, and 1280.
3.2 Datasets
We used the DRIVE, HRF (Budai et al., 2013), CHASE_DB, and IDRiD (Porwal, 2018) datasets. The DRIVE dataset contains 20 training images and 20 testing images with a resolution of 565 × 584 pixels. The dataset also provided ground-truth images for BV segmentation annotated by a human expert. As the DRIVE and CHASE_DB datasets did not have OD annotations, we annotated the OD in each image ourselves. The HRF dataset contains 15 high-resolution fundal images along with ground-truth annotation for BV segmentation.
The IDRiD (Porwal, 2018) localization dataset, which contains 413 training images and 103 test images along with fovea ground-truth, was used for macula localization. For segmentation of exudates, we used the IDRiD segmentation dataset which contains a total of 81 images. The OD ground-truths were available as part of the dataset, but the BV ground-truths were not available. For training exudates in the multi-tasking mode, we first predicted BV segmentation on these images using the model trained on images taken from HRF, DRIVE, and CHASE_DB datasets. These predictions were used as BV ground-truth for multi-tasking training. Data augmentation by horizontal and vertical flipping and grid and elastic distortion was provided by the library, Albumentations (Buslaev et al., 2020), and used to increase the number of training samples by a factor of 4. No preprocessing, other than resizing the images to 512 × 512, was performed on the original images.
3.3 Experiments
We used full images, as opposed to image patches, for training the network because a full image will show more context and hence should be more effective for predicting structures like the OD and macula. We performed multiple experiments, for individual and simultaneous prediction of BVs, the OD, the macula, and exudates. First, we performed BV segmentations on the individual datasets with the proposed U-Net architecture to achieve the best possible results. To further improve the BV results, we utilized simultaneous segmentation of BVs and the OD. In addition to these experiments, we also modified the U-Net architecture to determine the best suitable parameters for both BVs and the OD.
Another experiment we carried out was to train a model for BV segmentation using a training set containing images from HRF, DRIVE, and CHASE datasets. We evaluated the performance of this trained model on a held-out validation dataset comprised of images from HRF, DRIVE, and CHASE_DB and a test dataset containing images from IDRiD dataset. Using the IDRiD dataset, we evaluated the model qualitatively as no ground-truth was available for this dataset. To determine the generalizability of the trained model, we also reported the results for all tasks across the dataset. The BV data obtained from the IDRiD dataset were further utilized to improve the segmentation results for the OD, macula, and exudates.
3.4 Loss function and training
A sigmoid activation function was used at the output layer. The model was trained with dice loss and with a combination of dice loss and binary cross entropy loss. In most of our experiments, we noticed that a combination of the two losses gave a better F1 score. For predicting the structures separately, four separate networks with the same architecture were trained independently, one for each of the structures, BVs, the OD, the macula and exudates.
In the multi-tasking model, we trained three separate networks, each with two output channels, for predicting the following three combinations:
1) BV and OD
2) Macula and OD
3) Exudates and OD
4) BV and macula
5) BV and exudates
6) Exudates, BV, and OD
7) Macula, BV, and OD
The network was trained for 60 epochs in all cases.
4 Results and discussion
We used multiple metrics, accuracy, dice score, ROC-AUC, and Jaccard index (intersection over union) for evaluating model performance. The definition and mathematical expression of each of these metrics is given below.
True positive (TP): The number of positive pixels in the image which the model also correctly predicted as positive.
True negative (TN): The number of negative pixels which the model correctly predicted as negative.
False positive (FP): The number of negative pixels in the image which the model predicted incorrectly as positive.
False Negative (FN): The number of pixels which are actually positive that the model predicted as negative.
Accuracy (ACC): It is the ratio of the total number of correctly predicted positive and negative pixels (sum of true positives and true negatives) to the total number of pixels in the image.
Dice score: It is the ratio of two times overlap (intersection of predicted and actual positive pixels) to that of the sum of the number of positively labeled pixels in the ground-truth and the number of pixels which the model predicted as positive.
Jaccard Index (JI): Also known as the intersection-over-union (IoU), Jaccard Index is the ratio of the intersection of predicted and ground-truth pixels (which is the same as TP) to the union of prediction and ground-truth.
True positive rate (TPR): Also known as the sensitivity or recall, true positive rate is the ratio of the number of true positives to the total number of positive samples.
False positive rate (FPR): It is the ratio of the number of false positives to the total number of negative pixels.
ROC-AUC: The receiver operating characteristic (ROC) is a plot of true positive rate vs false positive rate computed at various thresholds. The area under the ROC curve (AUC) is a measure of a model’s ability to discriminate between positive and negative samples, and this metric is independent of the threshold. In addition to the above metrics, we also compared our approach with other up-to-date approaches with inclusion of prediction time.
For comparison of multi-tasking segmentation with segmentation of individual structures, experiments on individual prediction were performed. In that case, the network had one output channel corresponding to the segmentation map. The network outputs a binary image, of the same resolution as the input, which indicates pixel by pixel segmentation. For multi-tasking models, additional channels for predicting additional structures in combination with another structure were added at the output layer.
Table 1 compares the segmentation performance of various structures when the model was trained with and without multi-tasking. The table provides a comparison of results when the model was trained in the multi-tasking mode with two different tasks vs the results with an individual task. In all these cases, the OD was added as an auxiliary task along with the main tasks like BVs, the macula, and exudates. The row for the OD shows comparison of segmentation performance of the OD when trained with the OD alone vs results of multi-tasking loss with BVs. As evident from the table, dice score for segmentation of exudates resulted in an improvement of 10% when the model was trained in combination with the OD. A similar trend was observed in BV and OD segmentation with an improved dice score of about 4% (for HRF) and 6% (for CHASE_DB). For the macula, the segmentation results decreased by 2% upon addition of the OD as an additional task during training. This happened because the macula and optic disc were mutually exclusive as they appear at different locations in the image. In all our simultaneous segmentation experiments, we used the sigmoid function as an output activation function for multi-label prediction, which was not true in this case. However, when trained with BVs, and the macula and OD together, we observed a 3% increase in the score for the macula.
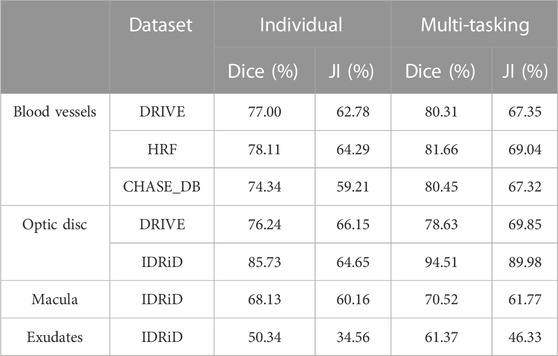
TABLE 1. Comparison of results with and without multi-tasking. For all tasks except the optic disc, multi-tasking was done with the OD as an auxiliary task. For the OD, multi-tasking was done in combination with blood vessels.
For exudates, we carried out multiple experiments (Table 2). As shown in the table, when multi-tasking was done with three tasks (OD, exudate, and BV segmentation), the score for exudates segmentation increased by 15% to a value of 65%. Also, the AUC improved from 0.8402, when trained individually, to 0.9993 when trained in combination with BV and OD. Figure 4 shows the ROC-AUC curve for all four exudate segmentation experiments.
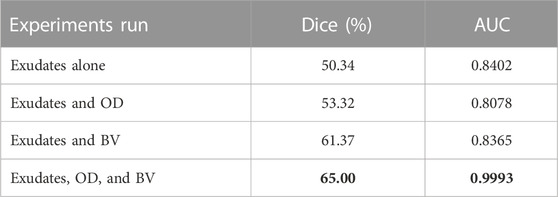
TABLE 2. Results of various multi-tasking experiments run on segmentation of exudates. Best results (shown in bold) were achieved when the model was trained with multi-tasking loss for a combination of exudates, the OD, and BVs.

FIGURE 4. ROC-AUC curves for different experiments on exudate segmentation.
Figure 5 shows a sample of BV segmentation results with and without multi-tasking for the HRF, DRIVE, and CHASE_DB datasets. The increase in dice score was due to a lower number of false negatives (red pixels) in the prediction (resulting in higher precision). Similarly, Figures 6–8 shows a comparison of segmentation results for the OD, the macula, and exudates, respectively.

FIGURE 5. Comparison of blood vessel segmentation results for HRF, DRIVE, and CHASE_DB datasets (from top to bottom row) with and without multi-tasking. The green pixels in the predicted image correspond to true positives, blue pixels correspond to false positives, and red pixels correspond to false negatives. An increase in F1 score of 4.67%, 3.31%, and 5.83% was observed in HRF, DRIVE, and CHASE_DB, respectively. The columns from left to right show original image (A), Ground Truth (B), Prediction with model trained only for BV segmentation (C) and Prediction using model trained with OD and BV segmentation (D).
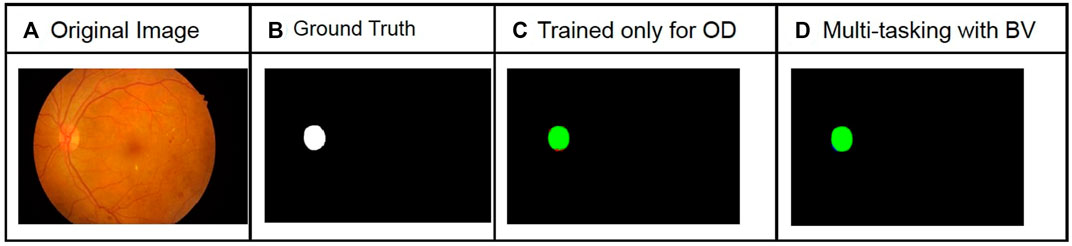
FIGURE 6. Comparison of optic disc segmentation results for the IDRiD dataset with and without multi-tasking. The green pixels in the predicted image correspond to true positives, blue pixels correspond to false positives, and red pixels correspond to false negatives. An increase in F1 score of 9% was observed. The columns from left to right show original image (A), Ground Truth (B), Prediction with model trained only for OD segmentation (C) and Prediction using model trained with OD and BV segmentation (D).
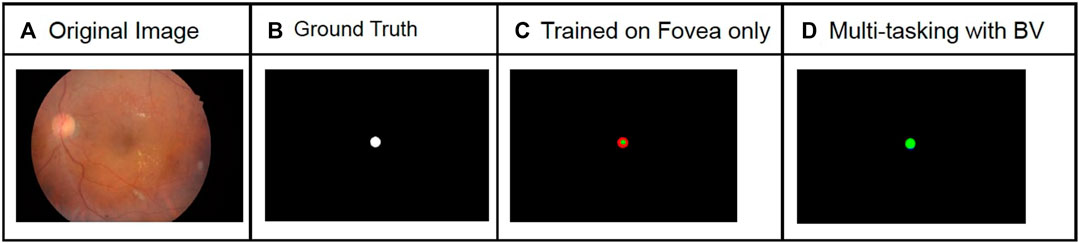
FIGURE 7. Comparison of macula segmentation results for the IDRiD dataset with and without multi-tasking. The green pixels in the predicted image correspond to true positives, blue pixels correspond to false positives, and red pixels correspond to false negatives. An increase in F1 score of 58% was observed for this image.The columns from left to right show original image (A), Ground Truth (B), Prediction with model trained only for Fovea segmentation (C) and Prediction using model trained with Fovea and BV segmentation (D).
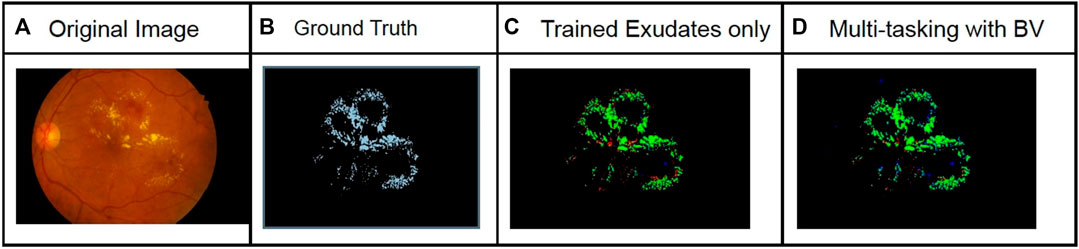
FIGURE 8. Comparison of exudates segmentation results for the IDRiD dataset with and without multi-tasking. The green pixels in the predicted image correspond to true positives, blue pixels correspond to false positives, and red pixels correspond to false negatives. An increase in F1 score of 15% was observed. The columns from left to right show original image (A), Ground Truth (B), Prediction with model trained only for Exudates segmentation (C) and Prediction using model trained with Exudates and BV segmentation (D).
The improved performance with multi-tasking is a consequence of the direct correlation between the two predicted structures. When trained together, the network is able to learn new hidden layer features that can contribute to the prediction of both structures. When trained individually, the OD can easily be confused as exudates as both appear as white patches. In simultaneous segmentation, the network learns to discriminate the OD from the exudates, using some other features like shape for example, which improves the segmentation results for both.
Figure 9 shows a plot of validation dice score vs feature map dimension, and Figure 10 shows dice score as a function of number of channels in the bottleneck layer. As evident from the graphs, the best results were obtained when the feature map dimension was 64 × 64 and the number of channels was 1024.
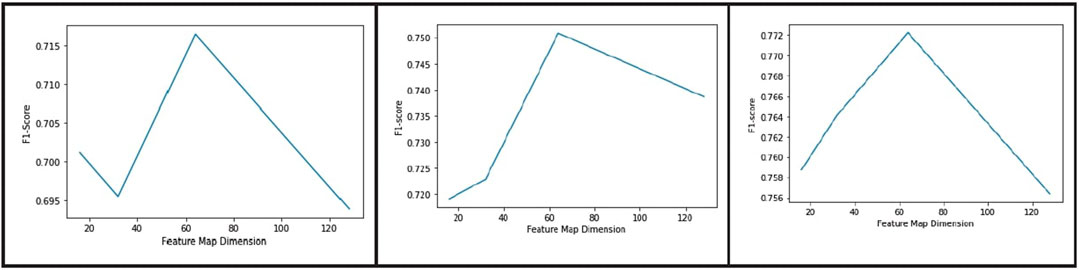
FIGURE 9. Plot of dice score vs dimension of the feature map in the bottleneck layer for blood vessel segmentation from the DRIVE, CHASE_DB, and HRF datasets (from left to right).
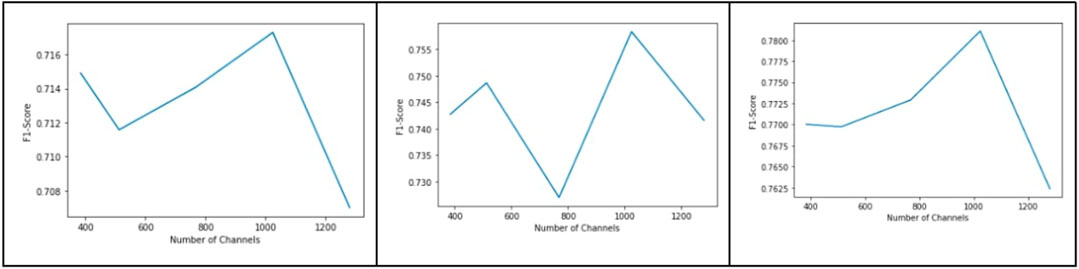
FIGURE 10. Plot of dice score vs number of channels in the bottleneck layer for blood vessel segmentation from the DRIVE, CHASE_DB, and HRF datasets (from left to right).
Figure 11 shows the results of BV segmentation on the IDRiD dataset using the model trained with images from DRIVE, HRF, and CHASE_DB datasets. These segmentation results were used as BV ground-truth of IDRiD images while training for exudates in the multi-tasking mode.
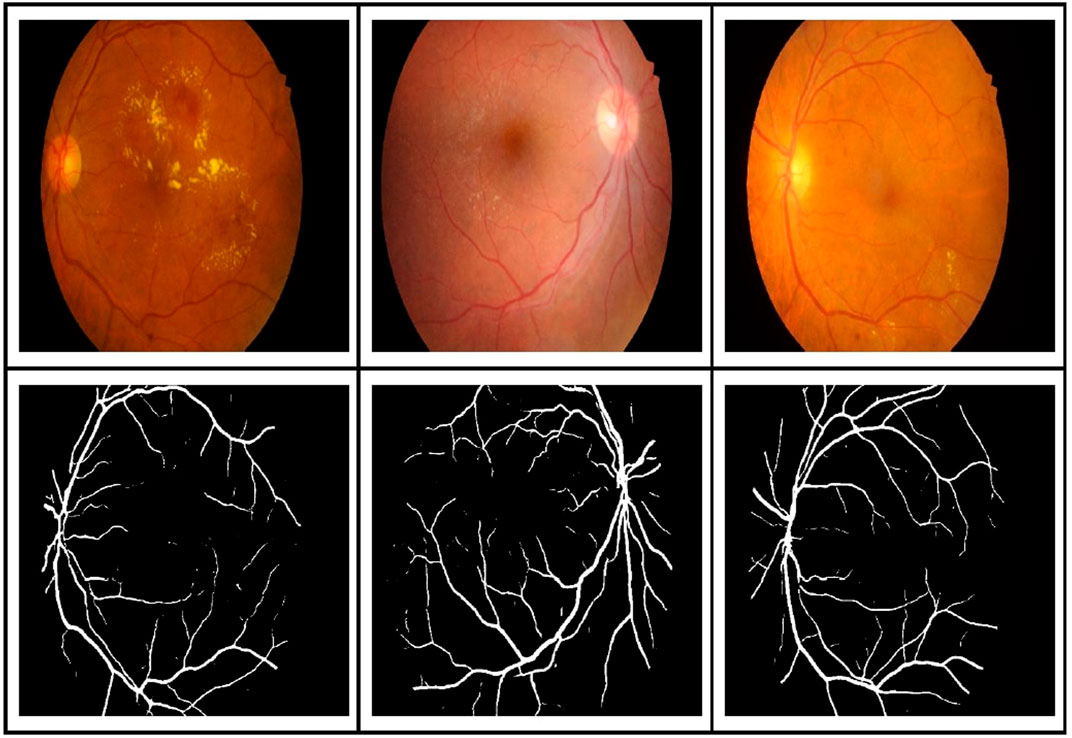
FIGURE 11. BV segmentation results on the IDRiD dataset using the model trained with images selected from DRIVE, HRF, and CHASE_DB.
Figure 12 shows the receiver operating characteristics (ROC) curves of the best results from the three structures, BV, OD, and macula, and for the pathological indicator, exudates. The BV segmentation results are on DRIVE test images, while the OD, macula, and exudates results are on the IDRiD dataset. As evident in the figure, the ROC curve for exudates is encouraging as an indicator for early detection of many retinal diseases like DR. It is worth noting that these improved results were achieved as a consequence of multi-tasking with BV and OD images.
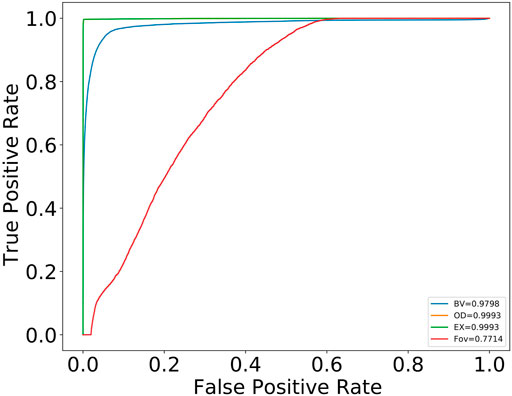
FIGURE 12. ROC curve for BVs, OD, and macula structures and the pathological indicator, exudates. BV results are on the DRIVE test dataset. OD, macula (FOV), and exudates (EX) are on the IDRiD dataset.
Table 3 compares our results for the segmentation of exudates with state-of-the-art techniques. The AUC of our segmentation results is better than the latest DL methods (Kou et al., 2020); and, more significantly, our prediction time is significantly better than that of the latest DL approaches. This time saving is accomplished by doing whole image segmentation in a single forward pass, whereas many DL approaches used patch-wise training. The patch method requires longer times for prediction of a single image as the network needs to run the prediction on each patch and all the predictions needs to be combined together to get the overall segmentation results for the image. We believe that the AUC can be further improved by adding more data augmentation techniques and also by including more images in the original training set. Our improvement in AUCs is attributed to multi-tasking, which results in faster learning of more generalized features. Another major advantage of our approach is that we achieved segmentation of two different additional structures, BVs and the OD, along with exudates. Nur and Tjandrasa (2018) obtained an accuracy of 99.33% by removing the OD first and then obtaining the salient regions using intensity thresholding. The challenge to their method was that the threshold varied from dataset to dataset and the accuracy depended on the OD removal step.
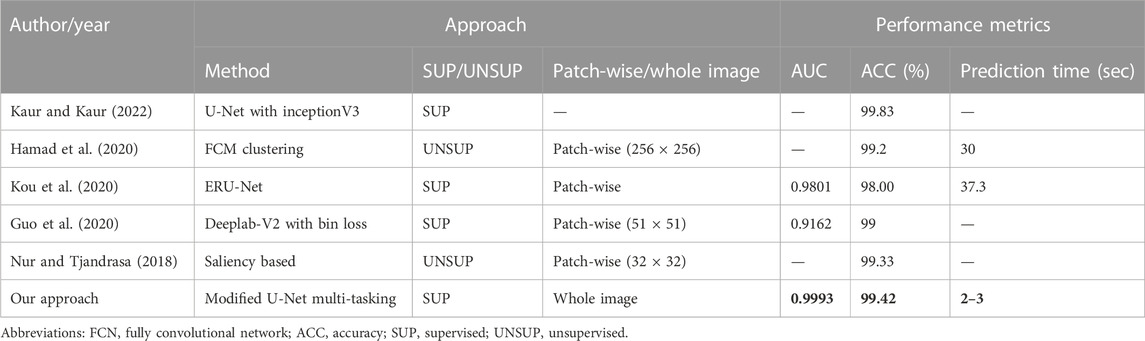
TABLE 3. Comparison of our method for segmentation of exudate images with other up-to-date approaches on the IDRiD dataset. As our predictions are for whole images, our prediction times are much faster (about 12 times) compared to other state-of-the-art techniques on the IDRiD dataset. Best results are shown in bold.
Figure 13 shows the comparison of exudate segmentation results of the proposed approach with the approach mentioned in Guo et al. (2020) for some sample images. Even though we got better accuracy (99.42) and AUC (0.9993) when averaged over all test images, our model failed to capture very small exudates, as shown in the second row of Figure 13. This happened because such fine exudates were removed when the image was resized from the original size of 4288 × 2848 to 768 × 512.
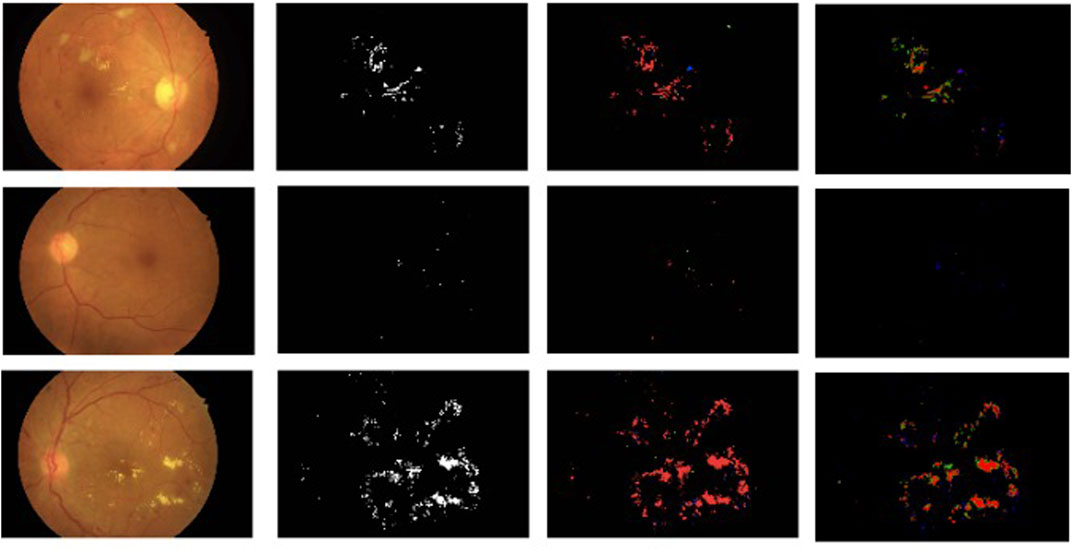
FIGURE 13. Comparison of the proposed approach for segmentation of exudates with results of Guo et al. (2020). Each column from the left shows the original image, the ground-truth segmentation results of Guo et al. (2020), and the segmentation results of our proposed approach. The color code is the same as in Guo et al. (2020): red, true positive; green, false positive; blue, false negative.
Table 4 shows a comparison of our BV segmentation results with the state-of-the-art techniques. As evident from the table, accuracy (95.89%) of our approach on the DRIVE dataset is better than other recently reported approaches, and AUC is close to being ideal. Dice scores on all three datasets are lower than patch-based state-of-the-art techniques. However, since we train on whole images, both training and prediction time is about 20 times faster than patch-based deep learning approaches.
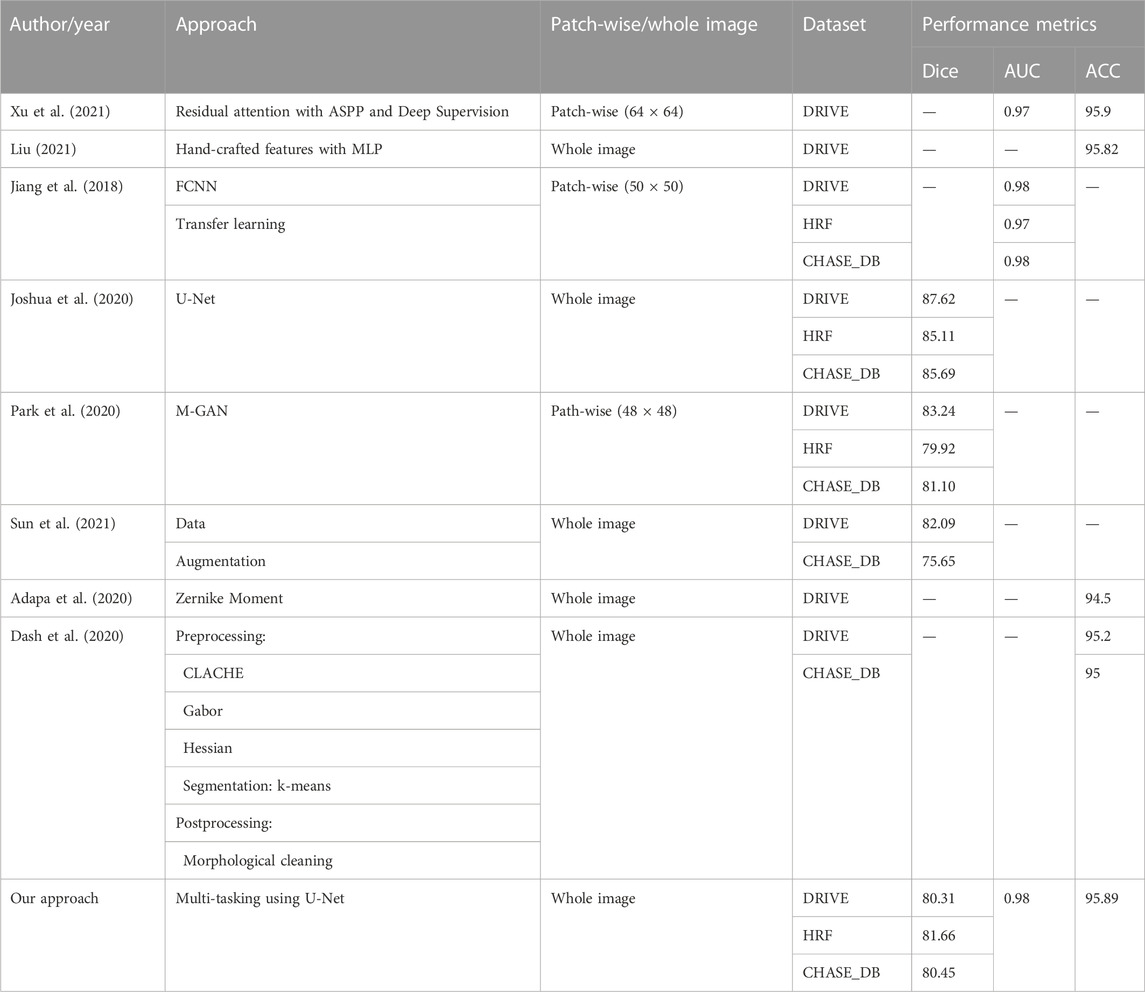
TABLE 4. Comparison of BV segmentation results of our approach with other up-to-date approaches.
Abbreviations: AUC, area under the curve; ACC, accuracy
5 Conclusions
In this work, we illustrated the efficacy of a modified multi-tasking U-Net method for segmenting fundal images of blood vessels, the optic disc, the macula, and exudates. The proposed approach resulted in a peak increase of 15% in dice score for the segmentation of exudates compared to individual segmentation results with the same architecture. Using the proposed approach, we were able to achieve a high level of accuracy of 95.89% on DRIVE test images which is 0.7% greater than some recently reported results. With our proposed method, the image prediction times were some 12 times faster than most other deep learning methods. In addition to this increased prediction speed, the AUC for exudates was improved from 0.9801% to 0.9993% and the accuracy from 99.33% to 99.42% on the IDRiD test dataset.
Data availability statement
The original contributions presented in the study are included in the article/Supplementary Material. Further inquiries can be directed to the corresponding author. All datasets used in this work are publicly available.
Author contributions
SV and BK contributed to conceptualization, investigation, and developing the methodology. BK carried out the implementation and ran all the experiments in this work. Both BK and SV contributed equally to writing and formatting the manuscript. NS supervised the work and was involved in writing, reviewing, and editing. NS validated the work and provided the resources.
Funding
This work was funded by the Machine Intelligence and Robotics Center (MINRO) Project GoK, IIITB. It was supported by Karnataka Innovation & Technology Society, Department of IT, BT and S&T, Government of Karnataka vide GO No. ITD 76 ADM 2017, Bengaluru; dated 28.02.2018.
Conflict of interest
The authors declare that the research was conducted in the absence of any commercial or financial relationships that could be construed as a potential conflict of interest.
Publisher’s note
All claims expressed in this article are solely those of the authors and do not necessarily represent those of their affiliated organizations, or those of the publisher, the editors, and the reviewers. Any product that may be evaluated in this article, or claim that may be made by its manufacturer, is not guaranteed or endorsed by the publisher.
References
Adapa, D., Joseph Raj, A. N., Alisetti, S. N., Zhuang, Z., and Naik, G. (2020). A supervised blood vessel segmentation technique for digital fundus images using zernike moment based features. Plos one 15, e0229831.
Aslan, M. F. (2018). “Segmentation of retinal blood vessel using gabor filter and extreme learning machines,” in 2018 International Conference on Artificial Intelligence and Data Processing (IDAP) (IEEE), 1–5.
Budai, A., Bock, R., Maier, A., Hornegger, J., and Michelson, G. (2013). Robust vessel segmentation in fundus images. Int. J. Biomed. imaging 2013, 1–11. doi:10.1155/2013/154860
Buslaev, A., Iglovikov, V. I., Khvedchenya, E., Parinov, A., Druzhinin, M., and Kalinin, A. A. (2020). Albumentations: Fast and flexible image augmentations. Information 11, 125. doi:10.3390/info11020125
Chen, L.-C., Papandreou, G., Kokkinos, I., Murphy, K., and Yuille, A. L. (2017). Deeplab: Semantic image segmentation with deep convolutional nets, atrous convolution, and fully connected crfs. IEEE Trans. pattern analysis Mach. Intell. 40, 834–848. doi:10.1109/tpami.2017.2699184
Dash, J., Parida, P., and Bhoi, N. (2020). Retinal blood vessel extraction from fundus images using enhancement filtering and clustering. ELCVIA Electron. Lett. Comput. Vis. image analysis 19, 0038–0052. doi:10.5565/rev/elcvia.1239
Feng, Z., Yang, J., Yao, L., Qiao, Y., Yu, Q., and Xu, X. (2017). “Deep retinal image segmentation: A fcn-based architecture with short and long skip connections for retinal image segmentation,” in International conference on neural information processing (Springer), 713–722.
Guo, S., Wang, K., Kang, H., Liu, T., Gao, Y., and Li, T. (2020). Bin loss for hard exudates segmentation in fundus images. Neurocomputing 392, 314–324. doi:10.1016/j.neucom.2018.10.103
Hamad, H., Dwickat, T., Tegolo, D., and Valenti, C. (2020). Exudates as landmarks identified through fcm clustering in retinal images. Appl. Sci. 11, 142. doi:10.3390/app11010142
Hassan, G., El-Bendary, N., Hassanien, A. E., Fahmy, A., Abullah M., S., and Snasel, V. (2015). Retinal blood vessel segmentation approach based on mathematical morphology. Procedia Comput. Sci. 65, 612–622. doi:10.1016/j.procs.2015.09.005
Hu, F. B., Satija, A., and Manson, J. E. (2015). Curbing the diabetes pandemic: The need for global policy solutions. Jama 313, 2319–2320. doi:10.1001/jama.2015.5287
Jiang, Z., Zhang, H., Wang, Y., and Ko, S.-B. (2018). Retinal blood vessel segmentation using fully convolutional network with transfer learning. Comput. Med. Imaging Graph. 68, 1–15. doi:10.1016/j.compmedimag.2018.04.005
Joshua, A. O., Nelwamondo, F. V., and Mabuza-Hocquet, G.Department of Electrical/Engineering Science University of Johannesburg Johannesburg South Africa (2020). Blood vessel segmentation from fundus images using modified u-net convolutional neural network. J. Image Graph. 8, 21–25. doi:10.18178/joig.8.1.21-25
Kaur, J., and Kaur, P. (2022). Uniconv: An enhanced u-net based inceptionv3 convolutional model for dr semantic segmentation in retinal fundus images. Concurrency Comput. Pract. Exp. 34, e7138. doi:10.1002/cpe.7138
Kou, C., Li, W., Yu, Z., and Yuan, L. (2020). An enhanced residual u-net for microaneurysms and exudates segmentation in fundus images. IEEE Access 8, 185514–185525. doi:10.1109/access.2020.3029117
Krestanova, A., Kubicek, J., and Penhaker, M. (2020). Recent techniques and trends for retinal blood vessel extraction and tortuosity evaluation: A comprehensive review. Ieee Access 8, 197787–197816. doi:10.1109/access.2020.3033027
Krizhevsky, A., Sutskever, I., and Hinton, G. E. (2012). Imagenet classification with deep convolutional neural networks. Adv. neural Inf. Process. Syst. 25, 1097–1105.
LeCun, Y., Boser, B., Denker, J., Henderson, D., Howard, R., Hubbard, W., et al. (1989). Handwritten digit recognition with a back-propagation network. Adv. neural Inf. Process. Syst. 2.
Liu, Z. (2021). Construction and verification of color fundus image retinal vessels segmentation algorithm under bp neural network. J. Supercomput. 77, 7171–7183. doi:10.1007/s11227-020-03551-0
Long, J., Shelhamer, E., and Darrell, T. (2015). “Fully convolutional networks for semantic segmentation,” in Proceedings of the IEEE conference on computer vision and pattern recognition, 3431–3440.
Nur, N., and Tjandrasa, H. (2018). Exudate segmentation in retinal images of diabetic retinopathy using saliency method based on region. In Journal of Physics: Conference Series, 1108. IOP Publishing, 012110.
Park, K.-B., Choi, S. H., and Lee, J. Y. (2020). M-gan: Retinal blood vessel segmentation by balancing losses through stacked deep fully convolutional networks. IEEE Access 8, 146308–146322. doi:10.1109/access.2020.3015108
Perdomo, O., Arevalo, J., and González, F. A. (2017). “Convolutional network to detect exudates in eye fundus images of diabetic subjects,” in 12th international symposium on medical information processing and analysis, 10160, 235–240.
Ronneberger, O., Fischer, P., and Brox, T. (2015). “U-net: Convolutional networks for biomedical image segmentation,” in International Conference on Medical image computing and computer-assisted intervention (Springer), 234–241.
Simonyan, K., and Zisserman, A. (2014). Very deep convolutional networks for large-scale image recognition. arXiv preprint arXiv:1409.1556.
Singh, D., Dharmveer, , and Singh, B. (2014). “A new morphology based approach for blood vessel segmentation in retinal images,” in 2014 annual IEEE India conference (INDICON) (IEEE), 1–6.
Sun, X., Fang, H., Yang, Y., Zhu, D., Wang, L., Liu, J., et al. (2021). “Robust retinal vessel segmentation from a data augmentation perspective,” in International workshop on ophthalmic medical image analysis (Springer), 189–198. doi:10.1007/978-3-030-87000-3_20
Tan, J. H., Fujita, H., Sivaprasad, S., Bhandary, S. V., Rao, A. K., Chua, K. C., et al. (2017). Automated segmentation of exudates, haemorrhages, microaneurysms using single convolutional neural network. Inf. Sci. 420, 66–76. doi:10.1016/j.ins.2017.08.050
Vengalil, S. K., Sinha, N., Kruthiventi, S. S., and Babu, R. V. (2016). “Customizing cnns for blood vessel segmentation from fundus images,” in 2016 international conference on signal processing and communications (SPCOM) (IEEE), 1–4.
Wang, P., Chen, P., Yuan, Y., Liu, D., Huang, Z., Hou, X., et al. (2018). “Understanding convolution for semantic segmentation,” in 2018 IEEE winter conference on applications of computer vision (Lake Tahoe, NV: WACV), 1451–1460. doi:10.1109/WACV.2018.00163
Wikipedia (2022). Macula of retina. Available at: https://en.wikipedia.org/wiki/Macula_of_retina.
Xu, S., Chen, Z., Cao, W., Zhang, F., and Tao, B. (2021). Retinal vessel segmentation algorithm based on residual convolution neural network. Front. Bioeng. Biotechnol. 9, 786425. doi:10.3389/fbioe.2021.786425
Yavuz, Z., and Köse, C. (2011). “Retinal blood vessel segmentation using gabor filter and top-hat transform,” in 2011 IEEE 19th signal processing and communications applications conference (SIU) (IEEE), 546–549.
Yu, C., Wang, J., Peng, C., Gao, C., Yu, G., and Sang, N. (2018). “Bisenet: Bilateral segmentation network for real-time semantic segmentation,” in Proceedings of the European conference on computer vision (ECCV).
Zhang, B., Zhang, L., Zhang, L., and Karray, F. (2010). Retinal vessel extraction by matched filter with first-order derivative of Gaussian. Comput. Biol. Med. 40, 438–445. doi:10.1016/j.compbiomed.2010.02.008
Zheng, R., Liu, L., Zhang, S., Zheng, C., Bunyak, F., Xu, R., et al. (2018). Detection of exudates in fundus photographs with imbalanced learning using conditional generative adversarial network. Biomed. Opt. express 9, 4863–4878. doi:10.1364/boe.9.004863
Keywords: fundal image segmentation, deep learning, multi-task learning, blood vessels, macula, optic disc, exudate segmentation
Citation: Vengalil SK, Krishnamurthy B and Sinha N (2023) Simultaneous segmentation of multiple structures in fundal images using multi-tasking deep neural networks. Front. Sig. Proc. 2:936875. doi: 10.3389/frsip.2022.936875
Received: 05 May 2022; Accepted: 12 December 2022;
Published: 09 January 2023.
Edited by:
Mahesh Raveendranatha Panicker, Indian Institute of Technology Palakkad, IndiaReviewed by:
Priyadarsan Parida, Gandhi Institute of Engineering and Technology University (GIET), IndiaSreehari Ravindran, Indian Institute of Technology Palakkad, India
Copyright © 2023 Vengalil, Krishnamurthy and Sinha. This is an open-access article distributed under the terms of the Creative Commons Attribution License (CC BY). The use, distribution or reproduction in other forums is permitted, provided the original author(s) and the copyright owner(s) are credited and that the original publication in this journal is cited, in accordance with accepted academic practice. No use, distribution or reproduction is permitted which does not comply with these terms.
*Correspondence: Sunil Kumar Vengalil, c3VuaWxAb3BlbnN0cmVhbS5jb20=
†Present Address: Sunil Kumar Vengalil, openstream.ai, Bangalore, India