 Sourav Kumar Mukhopadhyay
 Sridhar Krishnan
- Department of Electrical, Computer, and Biomedical Engineering, Ryerson University, Toronto, ON, Canada
Plausibly, the first computerized and automated electrocardiogram (ECG) signal processing algorithm was published in the literature in 1961, and since then, the number of algorithms that have been developed to-date for the detection of the QRS-complexes in ECG signals is countless. Both the digital signal processing and artificial intelligence-based techniques have been tested rigorously in many applications to achieve a high accuracy of the detection of the QRS-complexes in ECG signals. However, since the ECG signals are quasi-periodic in nature, a periodicity analysis-based technique would be an apt approach for the detection its QRS-complexes. Ramanujan filter bank (RFB)-based periodicity estimation technique is used in this research for the identification of the QRS-complexes in ECG signals. An added advantage of the proposed algorithm is that, at the instant of detection of a QRS-complex the algorithm can efficiently indicate whether it is a normal or a premature ventricular contraction or an atrial premature contraction QRS-complex. First, the ECG signal is preprocessed using Butterworth low and highpass filters followed by amplitude normalization. The normalized signal is then passed through a set of Ramanujan filters. Filtered signals from all the filters in the bank are then summed up to obtain a holistic time-domain representation of the ECG signal. Next, a Gaussian-weighted moving average filter is used to smooth the time-period-estimation data. Finally, the QRS-complexes are detected from the smoothed data using a peak-detection-based technique, and the abnormal ones are identified using a period thresholding-based technique. Performance of the proposed algorithm is tested on nine ECG databases (totaling a duration of 48.91 days) and is found to be highly competent compared to that of the state-of-the-art algorithms. To the best of our knowledge, such an RFB-based QRS-complex detection algorithm is reported here for the first time. The proposed algorithm can be adapted for the detection of other ECG waves, and also for the processing of other biomedical signals which exhibit periodic or quasi-periodic nature.
1 Introduction
S. K. Yuen discoursed in his Ph.D. thesis (Yuen, 1976) that the cardiovascular diseases were the leading causes of death in the U.S. in 1972, and even in 2021 (Centers for Disease Control and Prevention, 2022) the statistic has not been altered. Perhaps the scenarios are even more alarming in the other parts of the globe. Therefore, it could be said undoubtedly that the research and development in the area of the computerized processing of the ECG signal and automated detection of cardiovascular diseases are to be carried out in higher pace, if the situation is to alter. An electrocardiogram (ECG) signal characterizes the electrical activity of the heart that arises from the depolarization and repolarization activities of the cardiac cells. ECG signals are recorded by means of electrodes that are placed on various standard locations on the body surface. An ECG signal is composed of waves such as P, QRS-complex and T waves, segments such as PR and ST segments and intervals such as R-to-R and P-to-R intervals, and the presence of any cardiac disorder is generally reflected in the shapes, patterns and durations of these waves, segments and intervals, respectively. Among all other waves and segments of an ECG signal, the QRS-complexes are the most salient regions as it contains the highest frequency spectrum and amplitude. Since the publication of the plausibly-first computerized ECG processing algorithm in 1961 (Pipberger et al., 1961), a multitude of algorithms are proposed in the literature to-date on the detection of the QRS-complexes in ECG signals. A methodological review (Berkayaa et al., 2018) suggests that these QRS-complex detection algorithms could be broadly categorized into two groups: 1) digital signal processing (Burguera, 2019; Hossain et al., 2019; Sharma et al., 2019; Zhang et al., 2020; Jorge et al., 2021; Modak et al., 2021; Morshedlou et al., 2021; Rahul et al., 2021; Tueche et al., 2021), and 2) artificial intelligence-based (Mehta and Lingayat, 2008; Merino et al., 2015; Chandra et al., 2019; Goovaerts et al., 2019; Chen and Maharatna, 2020; Jia et al., 2020; He et al., 2021).
Rahul et al. have proposed an amplitude and interval threshold-based QRS-complex detection algorithm in (Rahul et al., 2021). In (Rahul et al., 2021), first, the ECG signal is denoised using bandpass and moving average filters. Next, a series of static and dynamic amplitude-threshold values (7 threshold values in total) are applied on the denoised ECG signal to identify the plausible QRS-complexes. Though the run-time of the algorithm [run-time indicates the amount of time taken by an algorithm to process a certain amount of data (Cormen et al., 2009)] is low, the QRS-complex detection performance of the algorithm is poor compared to that of the state-of-the-art algorithms (Please see Table 6). A similar type of algorithm is proposed in (Tueche et al., 2021) by Tueche et al. In (Tueche et al., 2021), the ECG signal is first denoised, and then the denoised signal is squared to enhance the QRS-complex regions. Next, all the peaks of the enhanced signal are detected, and three different threshold values are applied on those detected peaks to separate out the real QRS-complexes. The algorithm is primarily implemented on software platform, and then it is also implemented on a microcontroller-based system to examine the likelihood of its success in real-time applications. The authors have claimed that they have not found any difference in the results that they obtained on both the software and hardware platforms. However, here also, as in the case of (Rahul et al., 2021), the QRS-complex detection performance of the algorithm (Tueche et al., 2021) is poor. A tunable-Q wavelet transform (TQWT)-based QRS-complex detection algorithm is proposed by Sharma et al. in (Sharma et al., 2019). A QRS-enhanced ECG signal is obtained from a number of suitably chosen wavelet sub-bands. Then, the correntropy of the QRS-enhanced signal is calculated. Finally, a threshold-based peak detection technique is used to identify the QRS complexes. However, neither the QRS-complex detection performance nor the runtime of the algorithm could compete with that of the state-of-the-art algorithms.
Processing of the ECG signals using deep learning models has become one of the most promising areas of research in the last few years. In their review (Hong et al., 2020), Hong et al. have found 109 published articles, which were focused only on the deep learning-based ECG processing algorithms, and all those articles were published after the year 2019. A U-Net and bidirectional long-short term memory-based QRS-complex detection algorithm is proposed in (He et al., 2021) by He et al. In (He et al., 2021), first, an ECG signal is denoised using a median filter and a wavelet transformation-based technique. The denoised signal is then segmented into blocks of length 10 s each. Those blocks are then fed to the deep learning model to train the classifier. However, even after rigorous training and testing, the algorithm is unable to detect the paced QRS-complexes. Moreover, the model demands high computational-memory, and it require a graphics processing unit to get implemented. Chen et al. have proposed a hierarchical clustering-based R-peak detection and discrete wavelet transform-based T-peak detection algorithm in (Chen and Maharatna, 2020). In (Chen and Maharatna, 2020), the ECG signal is first denoised using Butterworth lowpass and highpass filters to expel the high frequency noises and baseline wonder noise out, respectively, and the amplitude of the denoised signal is normalized within [0, 1]. Then the denoised ECG signal is broken into segments of length 1.2 s each and are processed sequentially. The amplitudes and slopes of all the ECG samples in each of the segment are calculated and then they are clustered into two, namely R-cluster and non-R-cluster. The cluster with a smaller number of samples is considered as the R-cluster, and those samples which belong to R-cluster are considered as the R-peaks. However, a window of length 1.2 s restricts the applicability of the algorithm on ECG signals where the heart rate varies between 50 and 100 beats/minute.
The objective and aim of this proposed research work are to design a high-efficient yet fast QRS-complex detection algorithm overriding the shortcomings of other state-of-the-art algorithms as mentioned above. The main contribution of this research work is that the proposed QRS-complex detection algorithm is 1) highly accurate compared to that of the state-of-the art algorithms, 2) less complex, 3) noise tolerant 4) fast and 5) able to identify the premature ventricular contraction and atrial premature contraction QRS-complexes. The novelty of the proposed algorithm lies both in its working principle and performance. It is worth mentioning that a Ramanujan filter bank-based QRS-complex detection algorithm exploiting the time-period estimation of the ECG signal is being proposed here for the first time, to the best of our knowledge.
The paper is organized as follows. The theoretical background of Ramanujan filter bank is presented in Section 2. Section 3 describes the proposed QRS-complex detection algorithm. The performance of the proposed algorithm is investigated in Section 4. Section 5 compares the performance of the proposed algorithm with that of other state-of-the-art algorithms. Limitation and the future direction of the proposed research work are outlined in Section 6. Finally, discussions and conclusions are drawn in Section 7.
2 Ramanujan Filter Bank
In 1918, the Indian mathematician Srinivasa Ramanujan introduced a new set of sequences, which is known as Ramanujan Sums (Ramanujan, 1918). Ramanujan sums (RS) are real sums defined as the
Where,
where,
It can be seen from Eq. 3 that the values of
If the RS is regarded as a digital filter having an impulse response
From Eq. 4 it can be seen that the value of
If the signal
3 The QRS-Complex Detection Algorithm
The proposed RFB-based QRS-complex detection algorithm can be divided into three major parts: 1) Preprocessing, 2) time-period analysis using RFB and the 3) identification of the QRS-complexes. Schematic diagram of the proposed algorithm is shown in Figure 1.
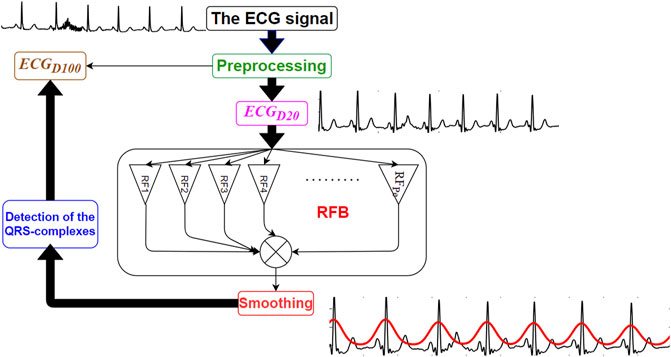
FIGURE 1. Schematic diagram of the proposed RFB-based QRS-complex detection algorithm.
3.1 Preprocessing
The clinical bandwidth of an ECG signal ranges between 0.5 and 100 Hz (Tompkins, 1993). In this research work the original ECG signal is denoised using two sets of filters. In the first set, a 4th order zero-phase Butterworth bandpass filter having lower and upper cut-off frequencies 0.5 and 100 Hz, respectively, and a 4th order zero-phase Butterworth notch filter is used to denoise the original ECG signal. The bandpass filter suppresses the out-of-band noises, and the notch filter suppresses the 50/60 Hz powerline interference noise. This version of the denoised signal is referred as
Next, the amplitudes of both the
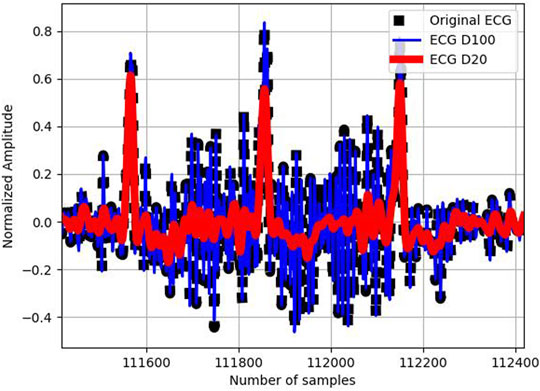
FIGURE 2. Original ECG signal (in black), its
3.2 Time-Period Analysis Using RFB
In this step, the
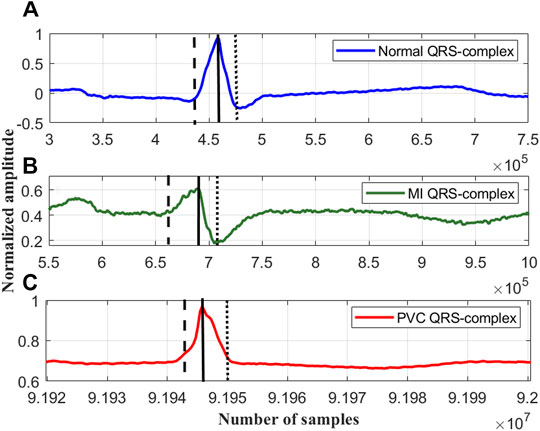
FIGURE 3. The rise and fall times of the QRS-complexes of a (A) normal ECG beat, lead I; record #s0273lrem, PTBDB, (B) myocardial infraction (MI) ECG beat, lead I; record #s0015lrem, PTBDB and (C) premature ventricular contraction (PVC) beat, lead V5; record # 104m, MITDB.
In the proposed research work it has been found experimentally, that repeating the coefficients of each of the Ramanujan filter twice
where,
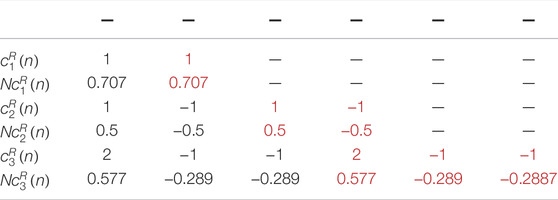
TABLE 1. The coefficients of the RFB
Now, the
for q =1 to
end
where, the command ‘ones((i×
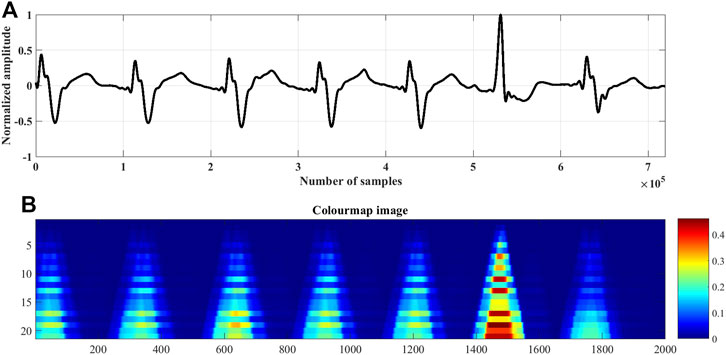
FIGURE 4. (A)
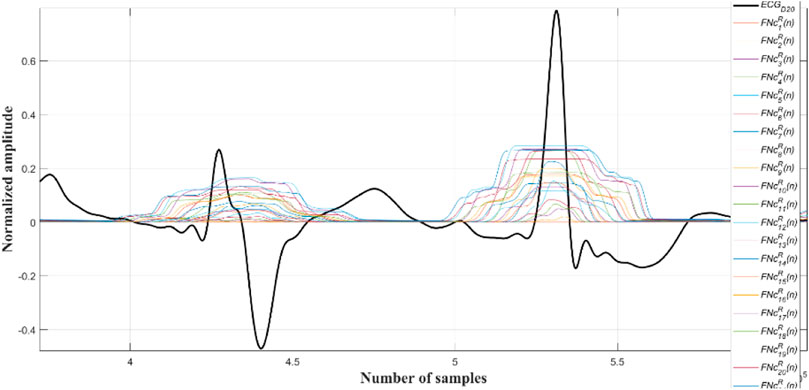
FIGURE 5.
Next the outputs of all the Ramanujan filters are summed up so as to obtain a holistic time-period representation (
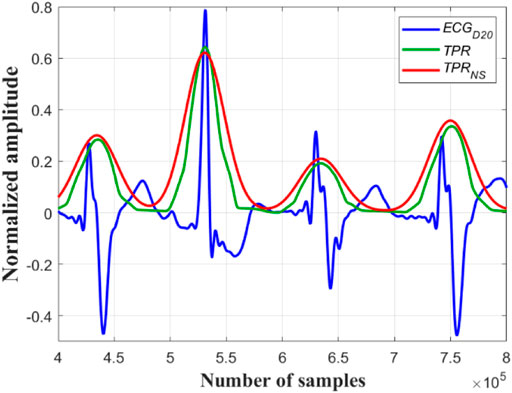
FIGURE 6.
3.3 Identification of the QRS-Complexes
Now, all the peaks of the
A close observation and analysis, which are listed below, reveal that the
Observation #1: From Figure 7A, it can be seen that the amplitudes of the peaks and the valleys of the
Observation #2: Figure 7B shows that the amplitudes of the peaks of the
Observation #3: Figure 7C shows that the amplitudes of both the peaks and the valleys of the
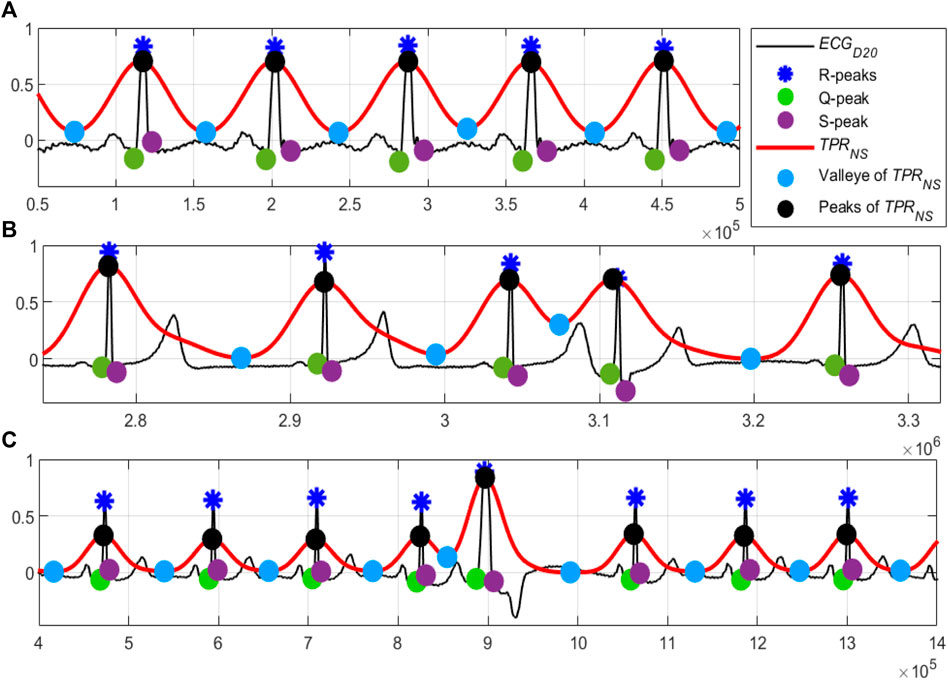
FIGURE 7. (A) Normal sinus rhythm; record #122m, MITDB, (B) the 4th QRS-complex is an APC beat; record #113m, MITDB and (C) the 5th QRS-complex is a PVC beats; record #119m, MITDB. The
Following these observations, the APC and PVC beats are segregated using the following steps.
the
elseif ((
the
else
the
end
After testing the proposed algorithm on a large number of ECG data of various pathological and arrhythmic classes, the value of
4 Performance Evaluation
The ECG signals are collected from nine publicly available datasets, totaling a duration of 48.91 days, and are used as the performance evaluation testbed of the proposed algorithm. The details of these collected ECG signals are given in Table 2. The algorithm is implemented and tested on MATLAB platform with a computer having 64-bit Windows 10 operating system, 12 GB RAM and Intel Core i7 10510U central processing unit (CPU) 2.30 GHz. Five statistical metrices: sensitivity (
where,
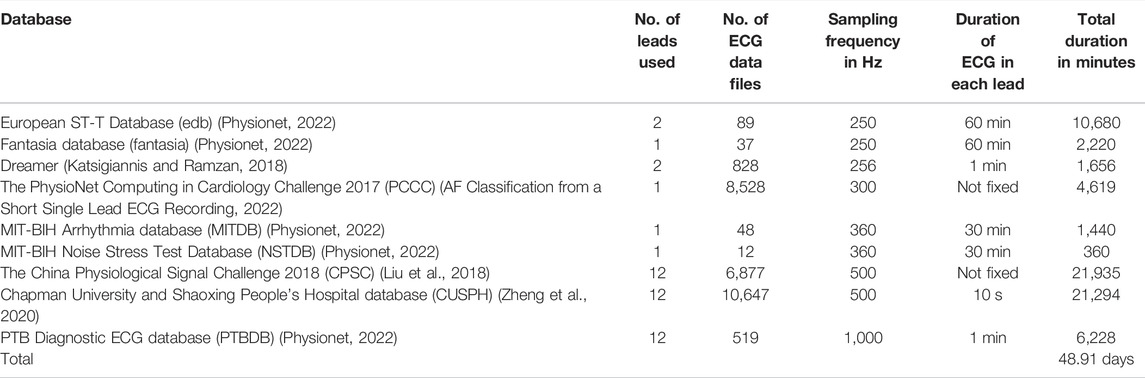
TABLE 2. Details of the collected ECG signals.
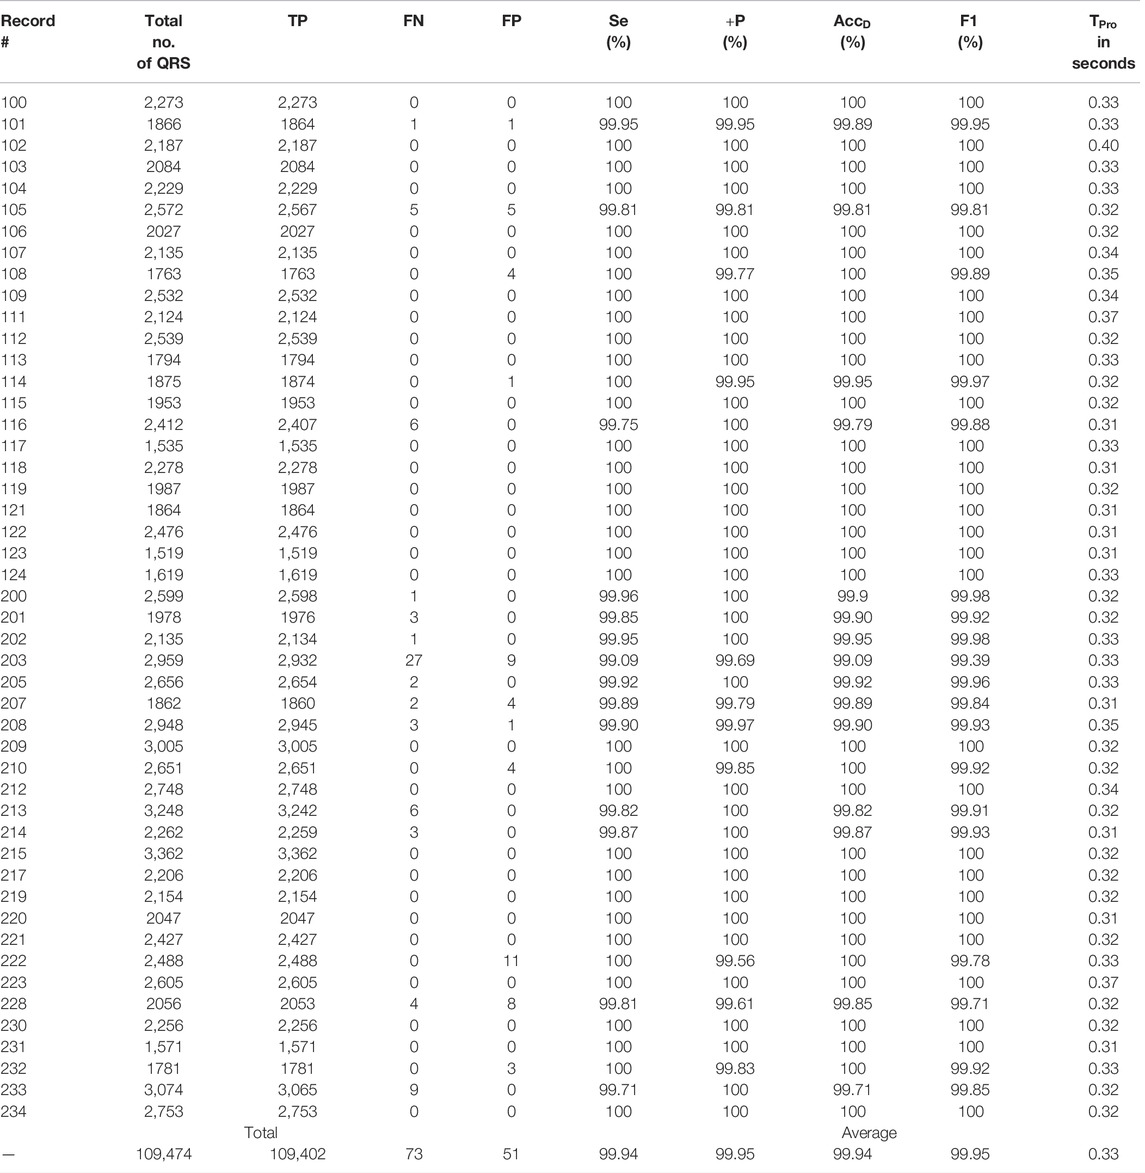
TABLE 3. Performance of proposed RFB-based QRS-complex detection algorithm on MITDB.
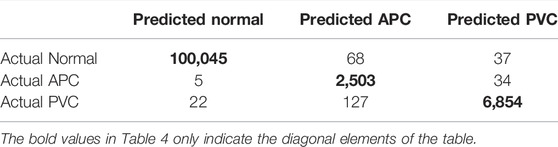
TABLE 4. Performance of the proposed algorithm in segregating the normal, APC and PVC beats on MITDB.
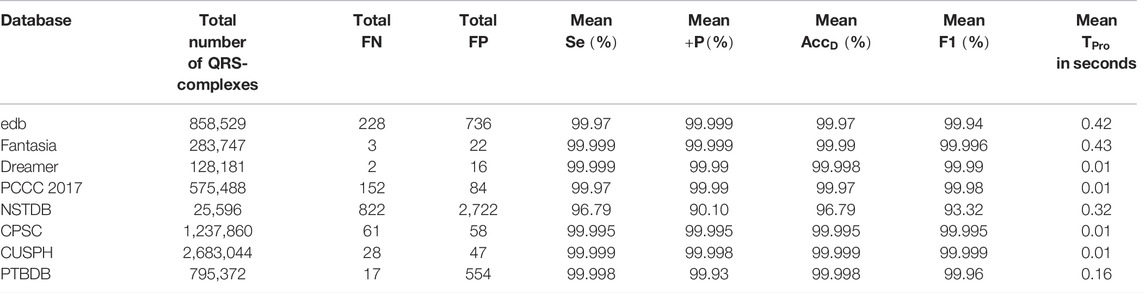
TABLE 5. Performance of the proposed algorithm on other ECG datasets.
The proposed algorithm fails to detect a QRS-complex when its amplitude is too small compared to other such as a few of the QRS-complexes following a large motion artefact noise. On the other hand, the algorithm detects a non-QRS-complex as a QRS-complex when its amplitude is high, and the periodicity matches with that of a QRS-complex. From Table 3 it can be seen that the algorithm is unable to detect 27 QRS-complexes of the file number #203 m of MITDB. The reasons behind this are the presence of: 1) QRS-complexes of different morphologies, and 2) intense motion artifact noise. The ECG record #203 m of MITDB contains QRS-complexes of five different morphologies (normal, aberrated APC, PVC, fusion PVC) and of five different rhythms (normal sinus rhythm, atrial flutter, atrial fibrillation, ventricular trigeminy and ventricular tachycardia) (MIT-BIH Arrhythmia Database Directory, 2022). Such a combination intricates the task of interpretation of an ECG signal even for the cardiologists. On the other hand, the proposed algorithm detects 11 non-QRS-complexes in the ECG record #222. In this ECG record the QRS-complexes are annotated as atrial flutter. A few of those atrial flutters are detected as QRS-complexes. Figures 8–10 show the detected QRS-complexes, APC and PVC beats of the ECG signals of different databases. These figures portray the efficiency of the proposed algorithm in detection the QRS-complexes of different morphologies even in the presence of motion artifact noise.
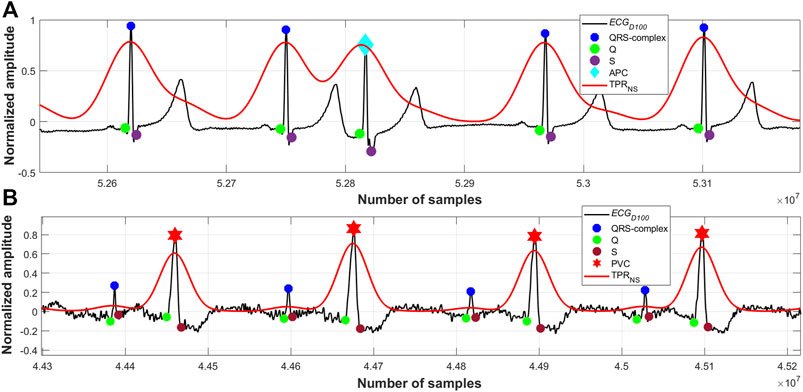
FIGURE 8. (A) Detected QRS-complexes and APC beats; record #113m, MITDB, (B) detected QRS-complexes and PVC beats; record #228m, MITDB.
Run-time of an algorithm is a function of the size of the input data file, and it is an important figure of merit. Run-time is used to measure the time complexity of an algorithm. Run-time of the proposed algorithm as a function of the length of the signal at different sampling rates are evaluated and shown in Figure 11. From this figure it is to be noted that the time complexity of the proposed algorithm varies almost linearly with the length of the signal and sampling rate. The proposed algorithm is primarily implemented on software platform, and hence, the space complexity and the power requirement are not considered in this research. However, the run-time of proposed algorithm can further be reduced by efficient code-optimization and implementation.
5 Performance Comparison
The performance of the proposed RFB-based QRS-complex detection algorithm on MITDB is compared with that of state-of-the-algorithms in Table 6. The numerical results of the other algorithms are collected from the respective articles.
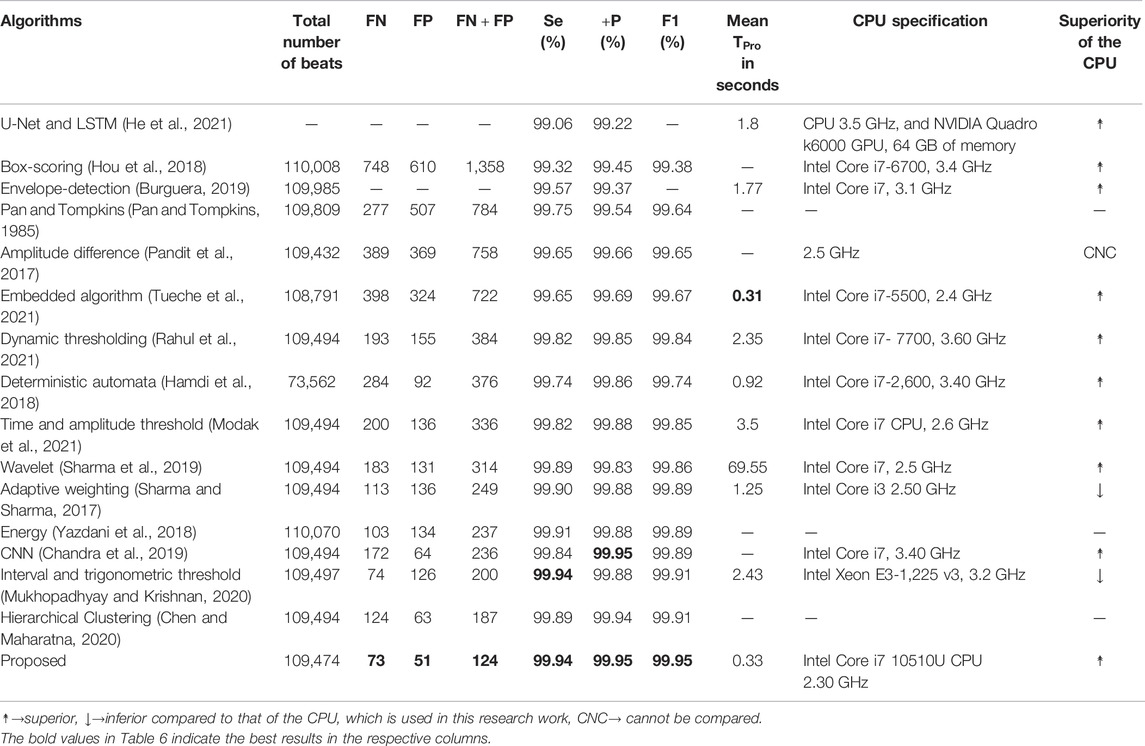
TABLE 6. Performance comparison of the proposed algorithm with a few other recently developed algorithms on MITDB.
Before going into a detail comparison, it is good to mention that the performance of all the algorithms, which are included in Table 6, are remarkably high. The
The
As the number of
The number of
The number of
In Table 6, seven metrics (
Now, the QRS-complex detection performance of the proposed RFB-based algorithm on other ECG databases is summarized and compared with a few recently developed algorithms in Table 7. It can be seen that the proposed algorithm performs equally well on other ECG datasets.
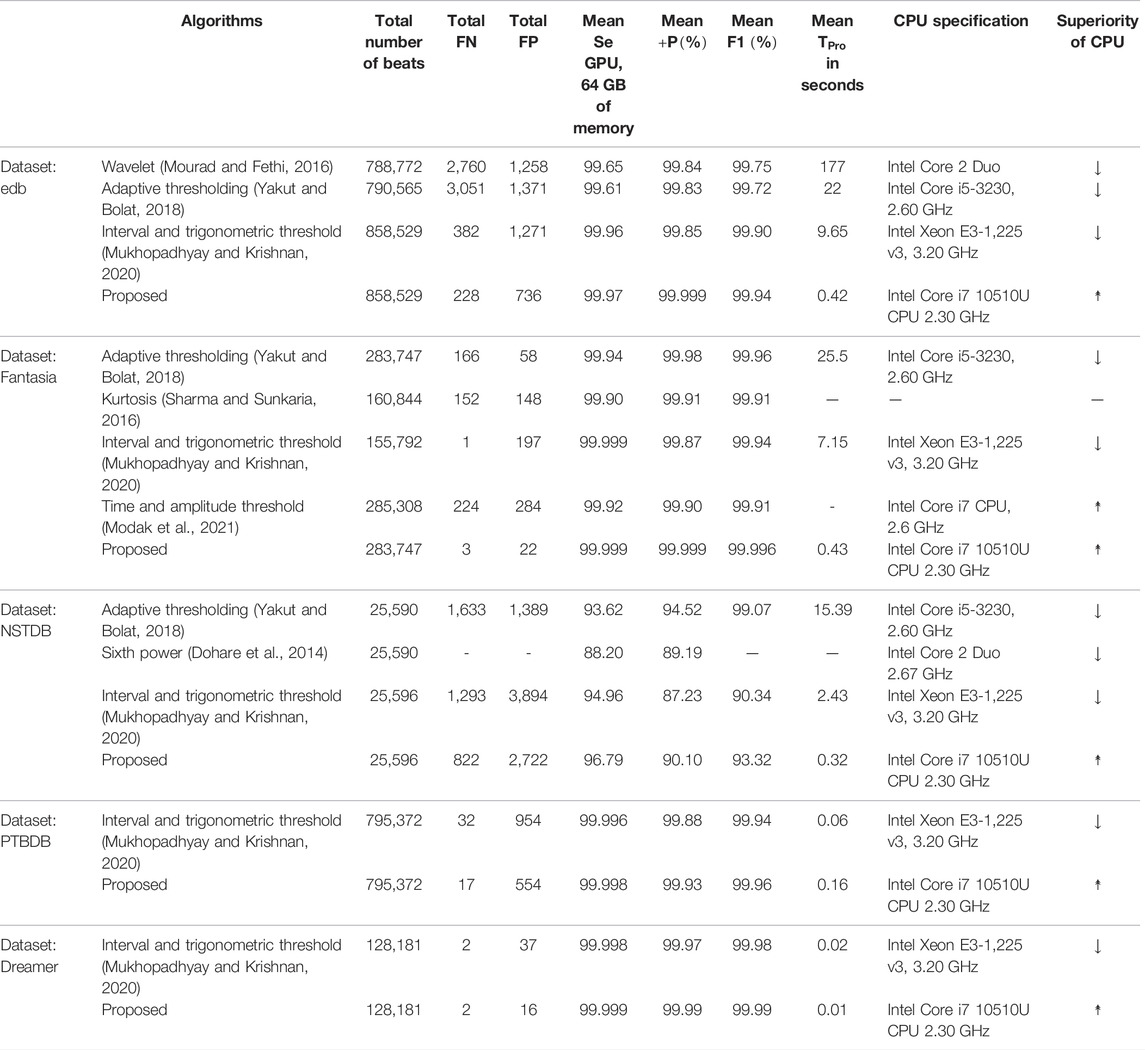
TABLE 7. Performance comparison of the proposed algorithm with a few other recently developed algorithms on non-MITDB ECG databases.
6 Limitation and Future Direction
It has been observed that sometimes the proposed algorithm fails to detect a few of the QRS-complexes following a large motion artefact noise when the amplitude of the noise is found to be around 10 times or more than that of the QRS amplitude. However, this limitation could be overcome by clipping the amplitude of such noises to a suitable level at the preprocessing stage. From Figure 9B it can also be seen that some of the noise-peaks of very low amplitude values have been wrongly detected by the algorithm as R-peaks. A suitably chosen threshold value could be applied on the
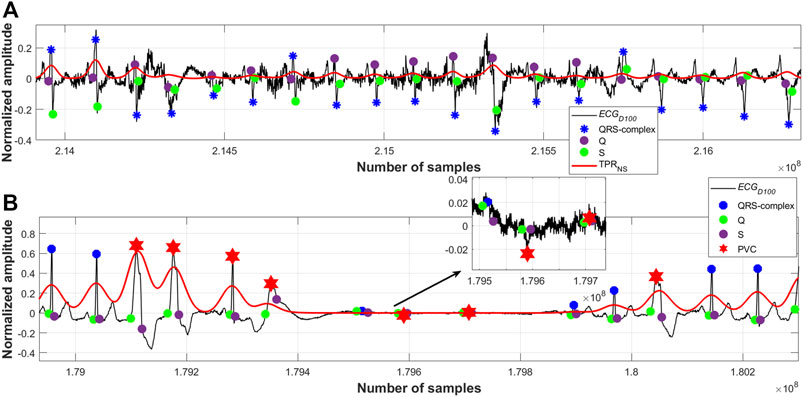
FIGURE 9. (A) Detected QRS-complexes; record #108m, MITDB, (B) detected QRS-complexes and PVC beats; record #208m, MITDB.
7 Conclusion and Discussion
A robust, reliable, fast and high-performance QRS-complex detection algorithm is proposed in this paper. It is worth mentioning that Ramanujan filter bank (RFB) is used in this research work for the detection of the QRS-complexes in ECG signals for the first time, to the best of our knowledge. The advantages of using RFB in detecting the QRS-complexes are multifold. First, the number of required filters in the bank and hence the filter-coefficients depends on the periodic property of the QRS-complexes. Since the periodic property of the QRS-complexes are well defined in the domain of cardio physiology, the required number of filters can easily be derived from the domain knowledge. In this research work it has been found that 1) the number of filters, which is equal to the sampling frequency times the half of the QRS duration; as defined in Eq. 6, and 2) the length of the average filter of unit 6; as described in Section 3.2, best suit in detecting the QRS-complexes in ECG signals. Therefore, the task of normalization of the sampling frequency, which is a prime prerequisite in many of the QRS-complex detection algorithms, could be avoided. Second, as described in Section 3.2, the main mathematical computation that is required to perform is the linear convolution operation only, and therefore the use of a mathematically as well as computationally intricated transformation technique could be avoided. Third, the runtime of the proposed algorithm is incredibly low. Fourth, the effect of the motion artifact types of noises on RFB is extremely low. Many of the QRS-complex detection algorithms detects the high amplitude motion artifact types of noises as the plausible QRS-complexes. This is because of the fact that both the frequency spectra and amplitude of the motion artifact noise and QRS-complex overlap. However, a motion artifact noise is not periodic in nature, and its periodic property does not match with that of the QRS-complexes. This is the main reason for what the false positive detection rate of the proposed algorithm low.
As per the cardio physiologic definition, the heights, frequencies, widths and also the periodicities of different arrhythmic QRS-complexes are different. Figures 7–10 manifest and corroborate this notion. A time-period representation clearly portrays and segregates a normal, premature ventricular contraction and atrial premature contraction QRS-complexes with their corresponding unique periodic patterns. In this research work, alongside detecting the normal QRS-complexes, two types of arrhythmic QRS-complexes (premature ventricular contraction and atrial premature contraction) are identified using a period-thresholding-based technique, and this has been done without the intervention of any ad hoc arrhythmic QRS-complex detection technique.
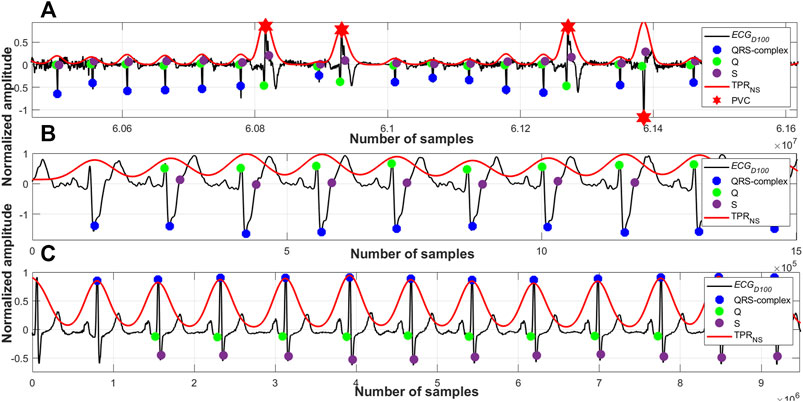
FIGURE 10. (A) Detected QRS-complexes and PVC beats; record #e0107m, edb, (B) detected QRS-complexes; record #A0001m, CPSC, (C) detected QRS-complexes; record #s0301lrem, PTBDB.
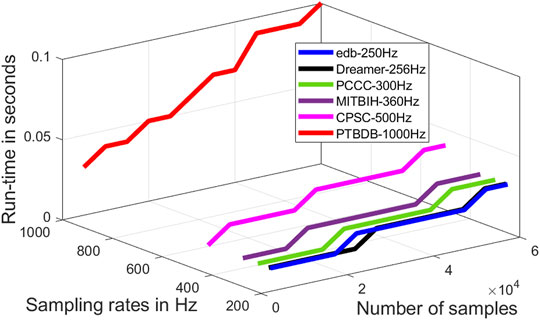
FIGURE 11. Run-time of the proposed algorithm as a function of the number of samples and sampling rates.
Data Availability Statement
Publicly available datasets were analyzed in this study. This data can be found here: https://physionet.org/about/database/.
Author Contributions
Both the authors; SM and SK, have equal contribution in this proposed research work and also in writing the paper.
Conflict of Interest
The authors declare that the research was conducted in the absence of any commercial or financial relationships that could be construed as a potential conflict of interest.
Publisher’s Note
All claims expressed in this article are solely those of the authors and do not necessarily represent those of their affiliated organizations, or those of the publisher, the editors and the reviewers. Any product that may be evaluated in this article, or claim that may be made by its manufacturer, is not guaranteed or endorsed by the publisher.
Acknowledgments
We would like to thank the funding provided by the Natural Sciences and Engineering Research Council (NSERC) Discovery Grant program of Canada.
References
AF Classification from a Short Single Lead Ecg Recording (2022). AF Classification from a Short Single Lead ECG Recording - the PhysioNet Computing in Cardiology Challenge 2017 v1.0.0. [Online]. Available at: https://physionet.org/content/challenge-2017/1.0.0/(Accessed April, 2022).
Berkayaa, S. K., Uysal, A. K., Gunal, E. S., Erginc, S., Gunal, S., and Gulmezoglu, M. B. (2018). A Survey on ECG Analysis. Biomed. Signal Process. Control 43 (5), 216–235.
Burguera, A. (2019). Fast QRS Detection and ECG Compression Based on Signal Structural Analysis. IEEE J. Biomed. Health Inf. 23 (1), 123–131. doi:10.1109/jbhi.2018.2792404
Centers for Disease Control and Prevention (2022). Centers for Disease Control and Prevention. [Online]. Available at: https://www.cdc.gov/nchs/fastats/leading-causes-of-death.htm (Accessed April, 2022).
Chandra, B. S., Sastry, C. S., and Jana, S. (2019). Robust Heartbeat Detection from Multimodal Data via CNN-Based Generalizable Information Fusion. IEEE Trans. Biomed. Eng. 66 (3), 710–717. doi:10.1109/tbme.2018.2854899
Chen, G., Krishnan, S., and Bui, T. D. (2013). Matrix-Based Ramanujan-Sums Transforms. IEEE Signal Process. Lett. 20 (10), 941–944. doi:10.1109/lsp.2013.2273973
Chen, H., and Maharatna, K. (2020). An Automatic R and T Peak Detection Method Based on the Combination of Hierarchical Clustering and Discrete Wavelet Transform. IEEE J. Biomed. Health Inf. 24 (10), 2825–2832. doi:10.1109/jbhi.2020.2973982
Cormen, T. H., Leiserson, C. E., Rivest, R. L., and Stein, C. (2009). Introduction to Algorithms. Third edition July. Cambridge, MA, USA: The MIT Press.
Dohare, A. K., Kumar, V., and Kumar, R. (2014). An Efficient New Method for the Detection of QRS in Electrocardiogram. Comput. Electr. Eng. 40 (5), 1717–1730. doi:10.1016/j.compeleceng.2013.11.004
Goldberger, A. L. (2006). Clinical Electrocardiography, a Simplified Approach. 7th ed. Amsterdam, Netherlands: Elsevier.
Goovaerts, G., Padhy, S., Vandenberk, B., Varon, C., Willems, R., and Van Huffel, S. (2019). A Machine-Learning Approach for Detection and Quantification of QRS Fragmentation. IEEE J. Biomed. Health Inf. 23 (5), 1980–1989. doi:10.1109/JBHI.2018.2878492
Hamdi, S., Abdallah, A. B., and Bedoui, M. H. (2018). A Robust QRS Complex Detection Using Regular Grammar and Deterministic Automata. Biomed. Signal Process. Control 40 (2), 263–274. doi:10.1016/j.bspc.2017.09.032
He, R., Liu, Y., Wang, K., Zhao, N., Yuan, Y., Li, Q., et al. (2021). Automatic Detection of QRS Complexes Using Dual Channels Based on U-Net and Bidirectional Long Short-Term Memory. IEEE J. Biomed. Health Inf. 25 (4), 1052–1061. doi:10.1109/jbhi.2020.3018563
Hong, S., Zhou, Y., Shang, J., Xiao, C., and Sun, J. (2020). Opportunities and Challenges of Deep Learning Methods for Electrocardiogram Data: A Systematic Review. Comput. Biol. Med. 122 (7), 103801–103814. doi:10.1016/j.compbiomed.2020.103801
Hossain, M. B., Bashar, S. K., Walkey, A. J., McManus, D. D., and Chon, K. H. (2019). An Accurate QRS Complex and P Wave Detection in ECG Signals Using Complete Ensemble Empirical Mode Decomposition with Adaptive Noise Approach. IEEE Access 7, 128869–128880. doi:10.1109/access.2019.2939943
Hou, Z., Dong, Y., Xiang, J., Li, X., and Yang, B. (2018). A Real-Time QRS Detection Method Based on Phase Portraits and Box-Scoring Calculation. IEEE Sensors J. 18 (9), 3694–3702. doi:10.1109/jsen.2018.2812792
Jia, M., Li, F., Wu, J., Chen, Z., and Pu, Y. (2020). Robust QRS Detection Using High-Resolution Wavelet Packet Decomposition and Time-Attention Convolutional Neural Network. IEEE Access 8, 16979–16988.
Jorge, R. R., Damas, I. D. L., Bila, J., and Škvor, J. (2021). Internet of Things-Assisted Architecture for QRS Complex Detection in Real Time. Internet Things 14 (2), 1–15. doi:10.1016/j.iot.2021.100395
Katsigiannis, S., and Ramzan, N. (2018). DREAMER: A Database for Emotion Recognition through EEG and ECG Signals from Wireless Low-Cost Off-The-Shelf Devices. IEEE J. Biomed. Health Inf. 22 (1), 98–107. doi:10.1109/jbhi.2017.2688239
Liu, F., Liu, C., Zhao, L., Zhang, X., Wu, X., Xu, X., et al. (2018). An Open Access Database for Evaluating the Algorithms of Electrocardiogram Rhythm and Morphology Abnormality Detection. J. Med. imaging hlth Inf. 8 (7), 1368–1373. doi:10.1166/jmihi.2018.2442
Mainardi, L., Bertinelli, M., and Sassi, R. (2008). Analysis of T-Wave Alternans Using the Ramanujan Transform. Comput. Cardiol. 14-17, 605–608. doi:10.1109/cic.2008.4749114
Mainardi, L. T., Pattini, L., and Cerutti, S. (2007). Application of the Ramanujan Fourier Transform for the Analysis of Secondary Structure Content in Amino Acid Sequences. Methods Inf. Med. 46 (2), 126–129.
Mehta, S. S., and Lingayat, N. S. (2008). SVM-based Algorithm for Recognition of QRS Complexes in Electrocardiogram. IRBM 29 (5), 310–317. doi:10.1016/j.rbmret.2008.03.006
Merino, M., Gómez, I. M., and Molina, A. J. (2015). Envelopment Filter and K-Means for the Detection of QRS Waveforms in Electrocardiogram. Med. Eng. Phys. 37 (6), 605–609. doi:10.1016/j.medengphy.2015.03.019
MIT-BIH Arrhythmia Database Directory (2022). MIT-BIH Arrhythmia Database Directory. [Online]. Available at: https://archive.physionet.org/physiobank/database/html/mitdbdir/records.htm#203 (Accessed April, 2022).
Modak, S., Taha, L. Y., and Abdel-Raheem, E. (2021). A Novel Method of QRS Detection Using Time and Amplitude Thresholds with Statistical False Peak Elimination. IEEE Access 9, 46079–46092. doi:10.1109/access.2021.3067179
Morshedlou, F., Ravanshad, N., and Dehsorkh, H. R. (2021). An Ultra-low Power Analog QRS-Detection Circuit for Ambulatory ECG Monitoring. Int. J. Electron. Commun. 129 (2), 1–11. doi:10.1016/j.aeue.2020.153551
Mourad, K., and Fethi, B. R. (2016). Efficient Automatic Detection of QRS Complexes in ECG Signal Based on Reverse Biorthogonal Wavelet Decomposition and Nonlinear Filtering. Measurement 94 (18), 663–670. doi:10.1016/j.measurement.2016.09.014
Mukhopadhyay, S. K., and Krishnan, S. (2020). Robust Identification of QRS-Complexes in Electrocardiogram Signals Using a Combination of Interval and Trigonometric Threshold Values. Biomed. Signal Process. Control 61 (7), 1–12. doi:10.1016/j.bspc.2020.102007
Pan, J., and Tompkins, W. J. (1985). A Real-Time QRS Detection Algorithm. IEEE Trans. Biomed. Eng. BME-32 (3), 230–236. doi:10.1109/tbme.1985.325532
Pandit, D., Zhang, L., Liu, C., Chattopadhyay, S., Aslam, N., and Lim, C. P. (2017). A Lightweight QRS Detector for Single Lead ECG Signals Using a Max-Min Difference Algorithm. Comput. Methods Programs Biomed. 144 (7), 61–75. doi:10.1016/j.cmpb.2017.02.028
Pei, S.-C., and Chang, K.-W. (2017). Two-Dimensional Period Estimation by Ramanujan's Sum. IEEE Trans. Signal Process. 65 (19), 5108–5120. doi:10.1109/tsp.2017.2726986
Physionet (2022). Physionet. [Online]. Available at: https://physionet.org/about/database/(Accessed April, 2022).
Pipberger, H. V., Arms, R. J., and Stallmann, F. W. (1961). Automatic Screening of Normal and Abnormal Electrocardiograms by Means of a Digital Electronic Computer. Exp. Biol. Med. 106 (1), 130–132. doi:10.3181/00379727-106-26260
Rahul, J., Sora, M., and Sharma, L. D. (2021). Dynamic Thresholding Based Efficient QRS Complex Detection with Low Computational Overhead. Biomed. Signal Process. Control 67 (5), 1–16. doi:10.1016/j.bspc.2021.102519
Ramanujan, S. (1918). On Certain Trigonometrical Sums and Their Applications in the Theory of Numbers. Trans. Camb. Philosophical Soc. 22 (13), 259–276.
Saatci, E., and Saatci, E. (2020). Period Determination in Cyclo-Stationary Signals by Autocorrelation and Ramanujan Subspaces. IEEE Signal Process. Lett. 27, 266–270. doi:10.1109/lsp.2020.2966877
Sharma, A., Patidar, S., Upadhyay, A., and Rajendra Acharya, U. (2019). Accurate Tunable-Q Wavelet Transform Based Method for QRS Complex Detection. Comput. Electr. Eng. 75 (3), 101–111. doi:10.1016/j.compeleceng.2019.01.025
Sharma, L. D., and Sunkaria, R. K. (2016). A Robust QRS Detection Using Novel Pre-processing Techniques and Kurtosis Based Enhanced Efficiency. Measurement 87 (11), 194–204. doi:10.1016/j.measurement.2016.03.015
Sharma, T., and Sharma, K. K. (2017). QRS Complex Detection in ECG Signals Using Locally Adaptive Weighted Total Variation Denoising. Comput. Biol. Med. 87 (8), 187–199. doi:10.1016/j.compbiomed.2017.05.027
Singh, P., Joshi, S. D., Patney, R. K., and Saha, K. (2017). The Fourier Decomposition Method for Nonlinear and Non-stationary Time Series Analysis. Proc. Math. Phys. Eng. Sci. 473 (2199), 20160871. doi:10.1098/rspa.2016.0871
Singhal, A., Singh, P., Fatimah, B., and Pachori, R. B. (2020). An Efficient Removal of Power-Line Interference and Baseline Wander from ECG Signals by Employing Fourier Decomposition Technique. Biomed. Signal Process. Control 57 (3), 1–8. doi:10.1016/j.bspc.2019.101741
Sugavaneswaran, L., Xie, S., Umapathy, K., and Krishnan, S. (2012). Time-Frequency Analysis via Ramanujan Sums. IEEE Signal Process. Lett. 19 (6), 352–355. doi:10.1109/lsp.2012.2194142
Tenneti, S. V. (2018). The Nested Periodic Subspaces: Extensions of Ramanujan Sums for Period Estimation. Ph.D. dissertation (Pasadena, California: Dept. of Electrical Engineering, California Institute of Technology). doi:10.7907/1n4t-5876
Tenneti, S. V., and Vaidyanathan, P. P. (2015). Nested Periodic Matrices and Dictionaries: New Signal Representations for Period Estimation. IEEE Trans. Signal Process. 63 (14), 3736–3750. doi:10.1109/tsp.2015.2434318
Tenneti, S. V., and Vaidyanathan, P. P. (2015). “Ramanujan Filter Banks for Estimation and Tracking of Periodicities,” in IEEE International Conference on Acoustics, Speech and Signal Processing (ICASSP), South Brisbane, QLD, Australia, 19-24 April 2015, 3851–3855. doi:10.1109/icassp.2015.7178692
Trevethan, R. (2017). Sensitivity, Specificity, and Predictive Values: Foundations, Pliabilities, and Pitfalls in Research and Practice. Front. Public Health 5, 307–7. doi:10.3389/fpubh.2017.00307
Tueche, F., Mohamadou, Y., Djeukam, A., Kouekeu, L. C. N., Seujip, R., and Tonka, M. (2021). Embedded Algorithm for QRS Detection Based on Signal Shape. IEEE Trans. Instrum. Meas. 70, 1–12. doi:10.1109/tim.2021.3051412
Vaidyanathan, P. P., and Tenneti, S. V. (2015). “Properties of Ramanujan Filter Banks,” in 23rd European Signal Processing Conference (EUSIPCO), Nice, France, 31 Aug.- 4 Sept. 2015, 2816–2820. doi:10.1109/eusipco.2015.7362898
Yadav, D. K., Kuldeep, G., and Joshi, S. D. (2018). Orthogonal Ramanujan Sums, its Properties, and Applications in Multiresolution Analysis. IEEE Trans. Signal Process. 66 (21), 5789–5798. doi:10.1109/tsp.2018.2871384
Yakut, Ö., and Bolat, E. D. (2018). An Improved QRS Complex Detection Method Having Low Computational Load. Biomed. Signal Process. Control 42 (4), 230–241. doi:10.1016/j.bspc.2018.02.004
Yazdani, S., Fallet, S., and Vesin, J.-M. (2018). A Novel Short-Term Event Extraction Algorithm for Biomedical Signals. IEEE Trans. Biomed. Eng. 65 (4), 754–762. doi:10.1109/tbme.2017.2718179
Yuen, S. K. (1976). Cardalert: A Portable, Battery-Operated, Real-Time Arrhythmia Detector and Alarm System. Ph.D. dissertation (Champaign, IL, USA: Dept. of Computer Science, University of Illinois at Urbana-Champaign).
Zhang, Z., Yu, Q., Zhang, Q., Ning, N., and Li, J. (2020). A Kalman Filtering Based Adaptive Threshold Algorithm for QRS Complex Detection. Biomed. Signal Process. Control 58 (4), 1–8. doi:10.1016/j.bspc.2019.101827
Keywords: electrocardiogram, period estimation, Ramanujan filter bank, Ramanujan sums, QRS-complex detection
Citation: Mukhopadhyay SK and Krishnan S (2022) Robust Identification of the QRS-Complexes in Electrocardiogram Signals Using Ramanujan Filter Bank-Based Periodicity Estimation Technique. Front. Sig. Proc. 2:921973. doi: 10.3389/frsip.2022.921973
Received: 17 April 2022; Accepted: 24 May 2022;
Published: 29 June 2022.
Edited by:
Manjeet Kumar, Delhi Technological University, IndiaReviewed by:
Pushpendra Singh, National Institute of Technology, Hamirpur, IndiaMuammar Muhammad Kabir, University Health Network, Canada
Copyright © 2022 Mukhopadhyay and Krishnan. This is an open-access article distributed under the terms of the Creative Commons Attribution License (CC BY). The use, distribution or reproduction in other forums is permitted, provided the original author(s) and the copyright owner(s) are credited and that the original publication in this journal is cited, in accordance with accepted academic practice. No use, distribution or reproduction is permitted which does not comply with these terms.
*Correspondence: Sourav Kumar Mukhopadhyay, c291cmF2Lm11a2hvcGFkaHlheUByeWVyc29uLmNh