 Angeliki Katsenou
 Fan Zhang
 Mariana Afonso
95% of researchers rate our articles as excellent or good
Learn more about the work of our research integrity team to safeguard the quality of each article we publish.
Find out more
ORIGINAL RESEARCH article
Front. Signal Process. , 11 April 2022
Sec. Image Processing
Volume 2 - 2022 | https://doi.org/10.3389/frsip.2022.874200
This article is part of the Research Topic Video Content Production and Delivery Over IP Networks and Distributed Computing Facilities View all 5 articles
The video technology scenery has been very vivid over the past years, with novel video coding technologies introduced that promise improved compression performance over state-of-the-art technologies. Despite the fact that a lot of video datasets are available, representative content of the wide parameter space along with subjective evaluations of variations of encoded content from an unpartial end is required. In response to this requirement, this paper features a dataset, the BVI-CC. Three video codecs were deployed to create the variations of the encoded sequences: High Efficiency Video Coding Test Model (HM), AOMedia Video 1 (AV1), and Versatile Video Coding Test Model (VTM). Nine source video sequences were carefully selected to offer both diversity and representativeness in the spatio-temporal domain. Different spatial resolution versions of the sequences were created and encoded by all three codecs at pre-defined target bit rates. The compression efficiency of the codecs was evaluated with commonly used objective quality metrics, and the subjective quality of their reconstructed content was also evaluated through psychophysical experiments. Additionally, an adaptive bit rate (convex hull rate-distortion optimization across spatial resolutions) test case was assessed using both objective and subjective evaluations. Finally, the computational complexities of the tested codecs were examined. All data have been made publicly available as part of the dataset, which can be used for coding performance evaluation and video quality metric development.
Video technology is ubiquitous in modern life, with wired and wireless video streaming, terrestrial and satellite TV, Blu-ray players, digital cameras, video conferencing and surveillance all underpinned by efficient signal representations. It was predicted that, by 2022, 82% (approximately 4.0 ZB) of all global internet traffic per year will be video content CISCO (2018). This projected figure was probably hit earlier due to the increased use of video technologies during the Covid-19 pandemic. It is therefore a very challenging time for compression, which must efficiently encode these increased quantities of video at higher spatial and temporal resolutions, dynamic resolutions and qualities.
The last 3 decades have witnessed significant advances in video compression technology, from the first international video coding standard H.120 [ITU-T Rec. H.120 (1993)], to the widely adopted.
MPEG-2/H.262 [ITU-T Rec. H.262 (2012)], and H.264 Advanced Video Coding (H.264/AVC) [ITU-T Rec H.264 (2005)] standards. Recently, ISO/IEC Moving Picture Experts Group (MPEG) and ITU-T Video Coding Experts Group (VCEG) have released a new video coding standard, Versatile Video Coding (VVC) [Bross et al. (2019)], with the aim of reducing bit rates by 30–50% compared to the current High Efficiency Video Coding (HEVC) standard [ITU-T Rec H.265 (2015)]. In parallel, the Alliance for Open Media (AOMedia) have developed royalty-free open-source video codecs to compete with MPEG standards. The first AOMedia Video 1 (AV1) codec [AOM (2019); Chen et al. (2020)] has been reported to outperform its predecessor VP9, developed by Google (2017). In order to benchmark these coding algorithms, their rate quality performance can be evaluated using objective and/or subjective assessment methods. Existing works, by Akyazi and Ebrahimi (2018); Grois et al. (2016); Dias et al. (2018); Guo et al. (2018); Zabrovskiy et al. (2018); Katsavounidis and Guo (2018); Nguyen and Marpe (2021), have reported comparisons for contemporary codecs, with perplexing results and conclusions, mainly due to the use of different coding configurations. Also, most of these studies are solely based on objective quality assessment. Finally, the majority of these works do not publicly release the produced data.
The significant impact of data availability has always been important in video technology research and has become even more crucial over the past years due to the deployment of machine learning and deep learning methods [see Ma et al. (2021)]. Furthermore, existing datasets lack of variety in the encoded versions of the raw sequences, as the majority offers only H.264 e.g., VQEGHD3 [Video Quality Experts Group (2010)], LIVE [Seshadrinathan et al. (2010)], NFLX-P and VMAF+ [Li et al. (2016)] or HEVC e.g., BVI-HD [Zhang et al. (2018)], BVI-Texture [Papadopoulos et al. (2015)], BVI-SynTex [Katsenou A. V. et al. (2021)] encodings.
In this context, this paper presents a video dataset, referred to as BVI-CC, which comprises a complete set of 306 encodings using VVC, HEVC, and AV1, on nine representative source sequences typically used by the standardisation bodies. To this end, a controlled set of three experiments were designed taking into consideration the codecs corresponding common test conditions. The source sequences native spatial resolution is Ultra High Definition (UHD), 3840×2160. Additionally to the UHD resolution, the sequences were spatially downscaled to 1920×1080, 1280×720, and 960×540 resolution and three experiments were designed. Two experiments were traditionally configured using constant resolution, one at UHD and one at HD. The third experiment was designed on an adaptive bit rate use case implementing the Dynamic Optimizer (DO) approach1 as described by Katsavounidis (2018) and implemented by Katsenou et al. (2019b) (up to FHD resolution only). This work provides a comprehensive extension of our previous work [Katsenou et al. (2019b)], where only AV1 and HEVC results were presented based on the DO approach. BVI-CC is complemented by data collected during the quality assessment: 1) anonymised opinion scores from psychovisual experiments in labs and 2) values of six commonly used objective quality metrics. BVI-CC dataset is publicly available after request [see Katsenou A. et al. (2021a)] and can be utilised either for research on video compression and research on image/video quality assessment.
The rest of this paper is organised as follows. Section 2 briefly reviews the history of video coding and related work on codec comparison. Section 3 presents the selected source sequences and the coding configurations employed in generating various compressed content. In Section 4, the conducted subjective experiments are described in detail, while the evaluation results through both objective and subjective assessment are reported and discussed in Section 5. Finally, Section 6 outlines the conclusion and future work.
This section provides a brief overview of video coding standards and reports on existing datasets for research on video compression and quality assessment.
Video coding standards normally define the syntax of bitstream and the decoding process, while encoders generate standard-compliant bitstream and thus determine compression performance. Each generation of video coding standard comes with a reference test model, such as HM (HEVC Test Model) for HEVC, which can be used to provide a performance benchmark. H.264/MPEG-4-AVC [ITU-T Rec H.264 (2005)] was launched in 2004, and is still the most prolific video coding standard, despite the fact that its successor, H.265/HEVC [ITU-T Rec H.265 (2015)] finalised in 2013, provides enhanced coding performance. In 2020, the first version of the latest video coding standard, Versatile Video Coding (VVC) [Bross et al. (2019)], has been finalised, which can achieve 30–50% coding gain over H.265/HEVC, supporting immersive formats (360° videos) and higher spatial resolutions, up to 16 K.
Alongside recent MPEG standardisation, there has been increasing activity in the development of open-source royalty-free video codecs, particularly by the Alliance for Open Media (AOMedia), a consortium of video-related companies. VP9 [Google (2017)], which was earlier developed by Google to compete with MPEG, provided a basis for AV1 (AOMedia Video 1) [AOM (2019); Chen et al. (2020)], which was released in 2018. Chen et al. (2020) set as AV1’s main goal to provide an open source and royalty-free video coding format that substantially outperforms its primary market competitors in compression efficiency and concurrently achieves a practical decoding complexity, is optimized for hardware feasibility and scalability on modern devices. Since its release, its pool of contributors has expanded and they have provided significant updates towards its goal. The AOM contributors are currently working towards developing the next generation, AV2 [Shostak et al. (2021)]. For further details on existing video coding standards and formats, the readers are referred to Bull and Zhang (2021); Wien (2015); Ohm (2015).
The performance of video coding algorithms is usually assessed by comparing their rate-distortion (RD) or rate-quality (RQ) performance on various test sequences. According to Recommendation ITU-R BT.500-12 (2012), the selection of test content is important and should provide a diverse and representative coverage of the video parameter space. Objective quality metrics or/and subjective opinion measurements are normally employed to assess compressed video quality. The overall RD or RQ performance difference between codecs can be then calculated using Bjøntegaard delta metrics for objective quality metrics according to Bjøntegaard (2001) or SCENIC developed by Hanhart and Ebrahimi (2014) for subjective assessments.
Most recent literature on video codec comparisons has focused on performance evaluations between MPEG codecs (H.264/AVC, HEVC, and VVC) and royalty-free (VP9 and AV1) codecs [Akyazi and Ebrahimi (2018); Grois et al. (2016); Lee et al. (2011); Dias et al. (2018); Nguyen and Marpe (2021)] and on their application in adaptive video steaming services Guo et al. (2018); Zabrovskiy et al. (2018); Katsavounidis and Guo (2018). However, the results presented are acknowledged to be highly inconsistent [Nguyen and Marpe (2021)], mainly due to the different configurations employed across codecs.
Our work contributes towards a fair codec comparison by releasing publicly a dataset that includes objective and subjective codec comparisons in three different use cases: encoding at FHD and UHD resolution and encoding within the framework of adaptive streaming.
The literature is rich of video datasets developed for many different purposes, mainly for computer vision related tasks such as object detection, action recognition, summarization, etc. These datasets, however, are not suitable for research in video compression. The main reason is that those have been designed for training deep network or models to infer very specific information. For example, the EPIC-Kitchens dataset [Damen et al. (2021)], contains scenes of daily activities in the kitchen, e.g., slicing bread, peeling carrots, stirring soup, etc. Therefore, the content bears significant similarities by repeating specific patterns in similar although diverse set-ups. Not providing a wide range of scenes with spatial and temporal information, this type of datasets cannot adequately represent video content and, thus, form a basis for a fair comparison of video compression algorithms and/or video quality metrics. Furthermore, the datasets published for computer vision tasks include already encoded versions (usually H.264-based encodings) as exported automatically from the video recording device. Although this type of content resembles the features of user generated content (UGC), a large portion of the videos streamed are coming from the creative industry. Thus research on video technology additionally requires pristine videos as exported from post-production.
In Table 1, a selection of commonly use datasets for video compression research is listed along with some of their basic features. Some of these datasets consist of pristine sequences [those that include raw (uncompressed) video sequences in the dataset] and others of UGC content [no raw sequences available as in KonViD-1K (Hosu et al. (2017)], YouTube-UGC [Wang et al. (2019)], DVL 2021 [Xing et al. (2022)]. Most of the existing datasets with pristine content, only include encoded sequences with one codec, usually H.264 {e.g., VQEGHD3 [Video Quality Experts Group (2010)], LIVE [Seshadrinathan et al. (2010)], NFLX-P and VMAF+ [Li et al. (2016)]} or HEVC {e.g., BVI-HD [Zhang et al. (2018)], BVI-Texture [Papadopoulos et al. (2015)], BVI-SynTex [Katsenou A. V. et al. (2021)]}.
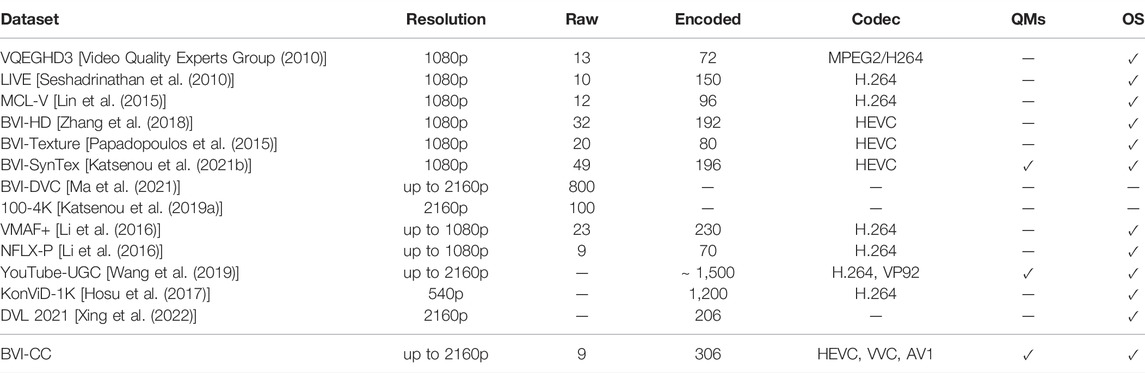
TABLE 1. Selection of state-of-the-art datasets for video research purposes.
From Table 1, it is evident that there is no dataset available that offers variations of encoded sequences based on different state-of-the-art codecs. Furthermore, to the best of our knowledge, there is no other dataset available that offers encoded sequences based on VVC and AV1. This is a very important contribution of the introduced dataset, BVI-CC, as it could facilitate research on video compression and comparison across these three different codecs. It is also noticeable that although almost all datasets provide opinion scores (OS) data, most of the datasets do not provide computed values of objective quality metrics (QMs).
This section describes the selection of source sequences and the different codec configurations used to generate their various compressed versions.
Nine source sequences were selected from Harmonic (2019), BVI-Texture [Papadopoulos et al. (2015)] and JVET (Joint Video Exploration Team) CTC (Common Test Conditions) datasets. Each sequence is progressively scanned, at UHD resolution, with a frame rate of 60 frames per second (fps) and without scene-cuts. All were truncated from their original lengths to 5 seconds [rather than the recommended 10 s in ITU standard Recommendation ITU-R BT.500-12 (2012)]. This reflects the recommendations of a recent study on optimal video duration for subjective quality assessment by Mercer Moss et al. (2016a, 2016b). Sample frames from the selected nine source sequences alongside clip names and indices are shown in Figure 1. The dataset includes three sequences with only local motion (without any camera motion, V1-V3), three sequences with dynamic textures [for definitions see Zhang and Bull (2011), V4-V6], and three with complex camera movements (V7-V9). The coverage of the video parameter space is confirmed in Figure 2, where the Spatial and Temporal Information (SI and TI, respectively), the colourfulness (CF), and average contrast, as defined by Winkler (2012) are plotted.
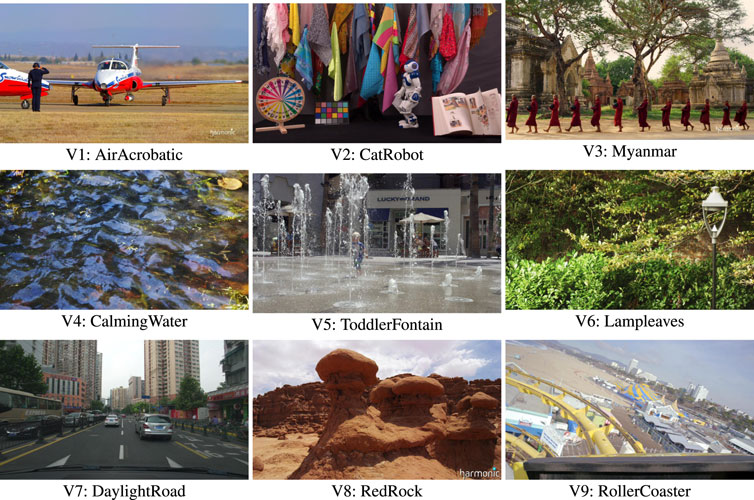
FIGURE 1. Sample video frames from the selected source sequences.
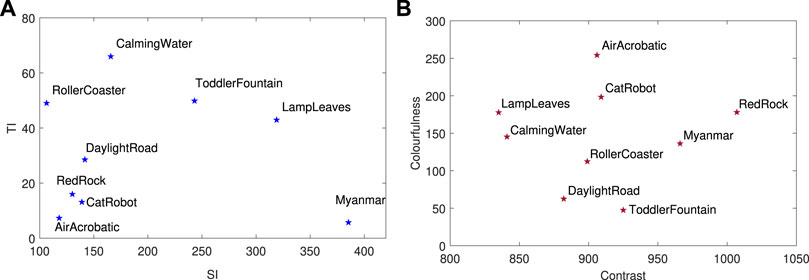
FIGURE 2. Scatter plots of low level content characteristics: for the selected source sequences: (A) SI vs. TI and (B) CF vs. Contrast.
In order to investigate coding performance across different resolutions and within an adaptive streaming framework, three spatial resolution groups were generated from the source sequences: (A) UHD (3840×2160) only, (B) HD (1920 601,080) only, and (C) HD-Dynamic Optimizer (HD-DO). For group C, coding results for three different resolutions (1920×1080, 1,280×720, and 960×540) and with various quantisation parameters (QPs) were firstly generated. The reconstructed videos were then up-sampled to HD resolution (in order to provide a basis for comparison with the original HD sequences). Here, spatial resolution re-sampling was implemented using Lanczos-3 filters designed by Duchon (1979). The rate points with optimal rate-quality performance based on Video Multimethod Assessment Fusion (VMAF) [Li et al. (2016)] were selected across the three tested resolutions for each target bit rate and codec. This process is repeated to create the entire convex hull in the DO approach [Katsavounidis (2018)]. The resulting selected resolutions across the set of target bit rates are reported in Table 2.
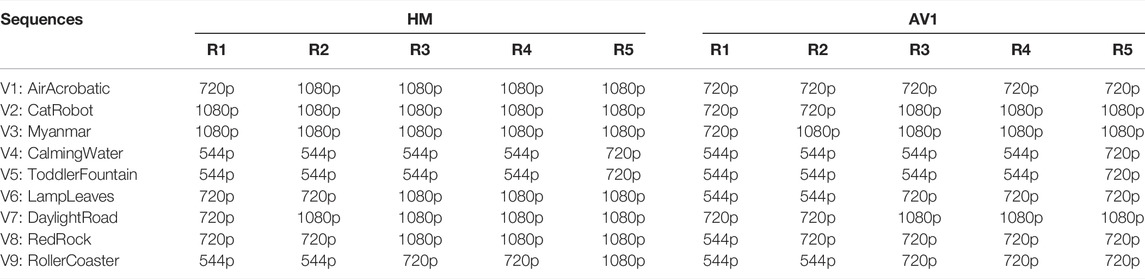
TABLE 2. Resolution selections per sequence after applying the DO methodology on AV1 and HM for resolution group C.
The reference test models of HEVC and VVC, and their major competitor, AV1 have been evaluated in this study. Each codec was configured using the coding parameters defined in their common test conditions [see Sharman and Suehring (2018); Bossen et al. (2019); Daede et al. (2019)], with fixed quantisation parameters (rate control disabled), the same structural delay (e.g., defined as GOP size in the HEVC HM software) of 16 frames and the same random access intervals (e.g., defined as IntraPeriod in the HEVC HM software) of 64 frames. The actual codec versions and configuration parameters are provided in Table 3.
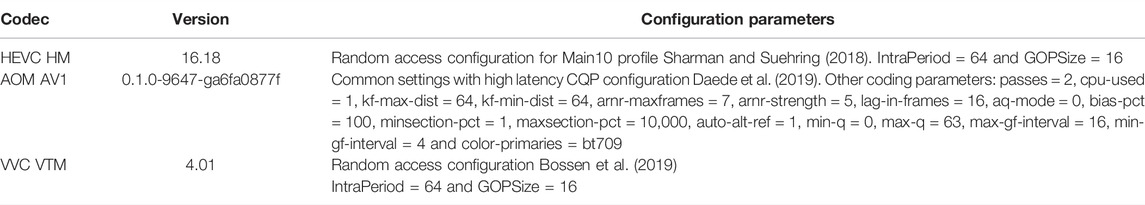
TABLE 3. The software versions and configurations of the evaluated video codecs.
Different target bit rates were pre-determined for each test sequence and for each resolution group (four points for resolution group A and B, and five for HD-DO group), and their values are shown in Table 4. These were determined based on the preliminary encoding results of the test sequences for each resolution group using AV1. This decision was made because the version of AV1 employed restricted production of bitstreams at pre-defined bit rates, as only integer quantisation parameters could be used. On the other hand, for HEVC HM and VVC VTM this was easier to achieve by enabling the “QPIncrementFrame” parameter. In order to achieve these target bit rates, the quantisation parameter values were iteratively adjusted to ensure the output bit rates were sufficiently close to the targets (within a range of ±3%).
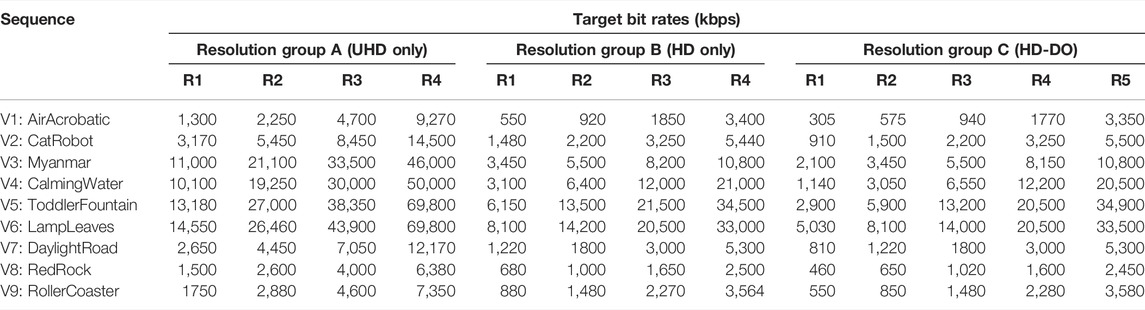
TABLE 4. Pre-determined target bit rates for all test sequences in three resolution groups.
In summary, a total number of 306 distorted sequences were produced: there are 108 (9 source sequences × 4 rate points × 3 codecs) for Resolution Group A (UHD only), 108 (9 3 4 co3) for Resolution Group B (HD only), and 90 (9 ) for 2) for Resolution Group C (HD-DO)2,3.
Three subjective experiment sessions were conducted separately on the test sequences in the three resolution groups. The experimental setup, procedure, test methodology and data processing approach are reported in this section.
All three experiment sessions were conducted in a darkened, living room-style environment. The background luminance level was set to 15% of the peak luminance of the monitor used (62.5 lux) Recommendation ITU-R BT.500-12 (2012). All test sequences were shown at their native spatial resolution and frame rates, on a consumer display, a SONY KD65Z9D LCD TV, which measures 1,429 29804 mm, with a peak luminance of 410 lux. The viewing distance was set to 121 cm (1.5 times the screen height) for Resolution Group A (UHD) and 241 cm (three times the screen height) for Resolution Group B (HD) and C (HD-DO), following the Recommendation ITU-R BT.500-12 (2012) and P.910 (1999). The presentation of video sequences was controlled by a Windows PC running an open source software, BVI-SVQA, developed by Dimitrov et al. (2019) at the University of Bristol for psychophysical experiments.
In all three experiments, the Double Stimulus Continuous Quality Scale (DSCQS) [Recommendation ITU-R BT.500-12 (2012)] methodology was used. In each trial, participants were shown a pair of sequences twice, including original and encoded versions. The presentation order was randomised in each trial and was unknown to each participant. Participants had unlimited time to respond to the following question (presented on the video monitor): “Please rate the quality (0–100) of the first/second video. Excellent–90, Good–70, Fair–50, Poor–30 and Bad–10”. Participants then used a mouse to scroll through the vertical scale and score (0–100) for these two videos. The total duration of each experimental session was approximately 50 (Resolution Group A and B) or 60 (Resolution Group C) minutes, and each was split into two sub-sessions with a 10 min break in between. Before the formal test, a training session was conducted, under the supervision of the instructor, consisting of three trials (different from those used in the formal test) to allow the participants time to familiarize.
A total of 62 subjects, with an average age of 27 (age range 20–45), from the University of Bristol (students and staff), were compensated for their participation in the experiments. All of them were tested for normal or corrected-to normal vision. Consent forms were signed by each participant and the data were anonymized. Responses from the subjects were first recorded as quality scores in the range 0–100, as explained earlier. Difference scores were then calculated for each tested sequence and each subject i by subtracting the quality score of the distorted sequence OSdis from its corresponding reference OSref. Difference Mean Opinion Scores (DMOS) and the respective statistics (standard error, confidence intervals, etc) were then obtained for each trial by taking the mean of the difference scores among participants N. Particularly, DMOS values for a video v were calculated as follows:
In order to reflect the quality taking into account the relative difference from the score of the hidden reference (in this case the original) for each participant i, we subtracted the DMOSv from the maximum quality score (100).
Further to the score collection, we performed post-screening of the subjects. Following the Recommendation ITU-R BT.500-12 (2012) protocols, for each resolution group, we performed outlier rejection on all participant scores. No participants were rejected. Moreover, we calculated the subject bias according the Recommendation P.913 (2021) and removed it before performing any statistical analysis. As defined in the recommendation, subject bias is the difference between the average of one subject’s ratings and the average of all subjects’ ratings for each processed video sequence. To remove subject bias, the recommendation proposed to subtract that its value from each one of subject’s ratings.
This section presents the codec comparison results based on objective and subjective quality assessments of BVI-CC, alongside encoder and decoder complexity assessments. For the objective evaluation, two video quality metrics have been employed: the commonly used Peak-Signal-to-Noise-Ratio (PSNR) and Video Multi-method Assessment Fusion (VMAF) Li et al. (2016). The latter is a machine learning-based video quality metric, which predicts subjective quality by combining multiple quality metrics and video features, including the Detail Loss Metric (DLM) [Li et al. (2011)], Visual Information Fidelity measure (VIF) [Sheikh et al. (2005)], and averaged temporal frame difference [Li et al. (2016)]. The fusion process employs a ν-Support Vector machine (ν-SVM) regressor [Cortes and Vapnik (1995)]. VMAF has been evaluated on various video quality databases, and shows improved correlation with subjective scores [Li et al. (2016); Zhang et al. (2018); Li et al. (2019)]. In this work, VMAF has also been employed to determine optimum resolution for each test rate point and sequence, following the procedure described in Section 3.2. The difference between test video codecs in terms of coding efficiency was calculated using the Bjøntegaard (2001) Delta (BD) measurements benchmarked against HEVC HM.
For the subjective assessment of the BVI-CC dataset, after following the experimental procedure defined in Section 4.2, the raw opinion scores were collected for each trial in confidentiality and anonymized. The rate-quality curves have been plotted for each test sequence in all three resolution groups (see Section 5.2), where the subjective quality is defined as 100-DMOS (see Eq. 1). Before computing the DMOS values and performing a codec comparison, the subject bias was estimated and removed according to the Recommendation P.913 (2021). A significance test was then conducted using one-way Analysis of Variance (ANOVA) between each paired of codecs on all rate points and sequences.
The subjective data collected was also used to evaluate six popular objective video quality metrics (see Section 5.3), including PSNR, Structural Similarity Index (SSIM) [Wang et al. (2004)], multi-scale SSIM (MS-SSIM) [Wang et al. (2003)], VIF [Sheikh et al. (2005)], Visual Signal-to-Noise Ratio (VSNR) [Chandler and Hemami (2007)], and VMAF [Li et al. (2016)]. According to the recommendation the bias was only removed from the opinion scores for the subjective comparison of the codecs. For the objective comparison, the raw opinion scores were utilized. Following the procedure in Video Quality Experts Group (2000), their quality indices and the subjective DMOS were fitted based on a weighted least-squares approach using a logistic fitting function for three different resolution groups. The correlation performance of these quality metrics was assessed using four correlation statistics, the Spearman Rank Order Correlation Coefficient (SROCC), the Linear Correlation Coefficient (LCC), the Outlier Ratio (OR) and the Root Mean Squared Error (RMSE). The definitions of these parameters can be found in Video Quality Experts Group (2000).
Finally, the computational complexity of the three tested encoders was calculated and normalised to HEVC HM for Resolution Group A and B (see Section 5.4). They were executed on the CPU nodes of a shared cluster, Blue Crystal Phase 3, of the Advanced Computing Research Centre, University of Bristol (2021). Each node has 16 6E2.6 GHz SandyBridge cores and 64 GB RAM.
Table 5 summarises the Bjøntegaard Delta measurements (BD-rate) of AOM AV1 (for three resolution groups) and VVC VTM (for Resolution Group A and B only) compared with HEVC HM, based on both PSNR and VMAF. For the tested codec versions and configurations, it can be observed that AV1 achieves an average bit rate saving of 7.3% against HEVC HM for the UHD test content assessed by PSNR, and this figure reduces (3.8%) at HD resolution. When VMAF is employed for quality assessment, the coding gains of AV1 over HM are slightly higher, averaging 8.6 and 5.0% for UHD and HD respectively. Comparing to AV1, VTM provides significant bit rate savings for both HD and UHD test content, with average BD-rate values between −27% and −30% for PSNR and VMAF. For resolution group C, where VMAF-based DO was applied for HM and AV1, the coding gain achieved by AV1 is 6.3% (over HM) assessed by VMAF, while there is a BD-rate (1.8%) loss when PSNR is employed. In overall conclusion, the performance of AV1 makes a small improvement over HM on the test content, and both AV1 and HM perform (significantly) worse than VTM.
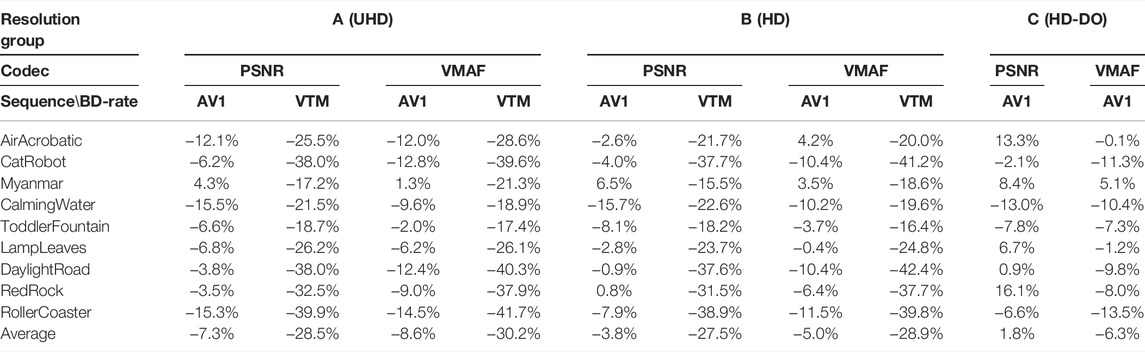
TABLE 5. Codec comparison results based on PSNR and VMAF quality metrics. Here Bjøntegaard Delta Bjøntegaard (2001) measurements (BD-rate) were employed, and HEVC HM was used as benchmark.
In order to further compare performance across different spatial resolutions and within the context of DO, the average rate-VMAF curves of the nine test sequences (HD resolution only) for HM and AV1 with and without DO are shown in Figure 3. It can be observed that DO has achieved slightly higher overall coding gains for AV1 (BD-rate is -8.2%) on the tested content compared to HM (BD-rate is -6.1%). For both codecs, the savings become lower for higher bit rates (low QP and high quality). It should be noted that the DO approach employed was based on efficient up-sampling using simple spatial filters. Afonso et al. (2019), Zhang et al. (2019) and others have reported significant improvement when advanced up-sampling approaches are applied, such as deep learning based super-resolution.
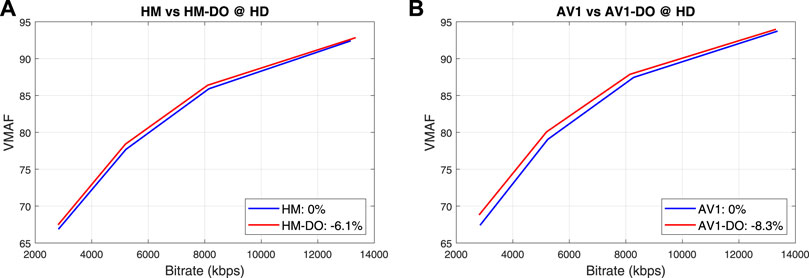
FIGURE 3. The average rate-VMAF curves of the nine test sequences for (A) HM and (B) AV1 with and without applying DO.
As outlined in the introduction of Section 5, following the ITU-BT.500 protocols, for each resolution group, we performed outlier rejection on all participant scores. No participants were rejected. Next, following the ITU-T P.913 recommendation P.913 (2021), we estimated the subject bias for the different trials and compensated the raw scores based on that. Figures 4, 5 illustrate the 100-DMOS against the achieved bit rate for all tested codecs and sequences. Then, we performed one-way ANOVA analysis between pairs of the tested codecs to assess the significance of the differences. Table 6 summarises this comparison.
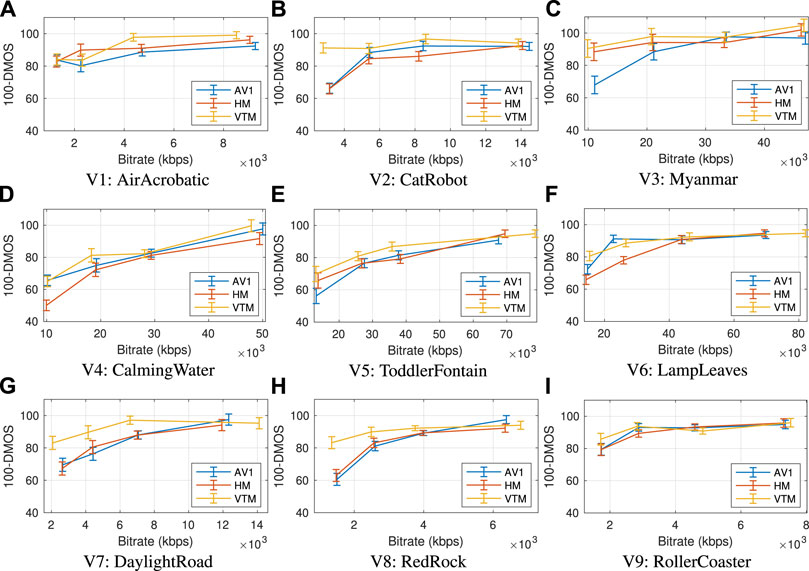
FIGURE 4. The DMOS-Rate curves for all sequences (A–I) of Resolution Group A and all three codecs along with the standard error bars after compensating for subject bias, as described in Recommendation P.913 (2021).
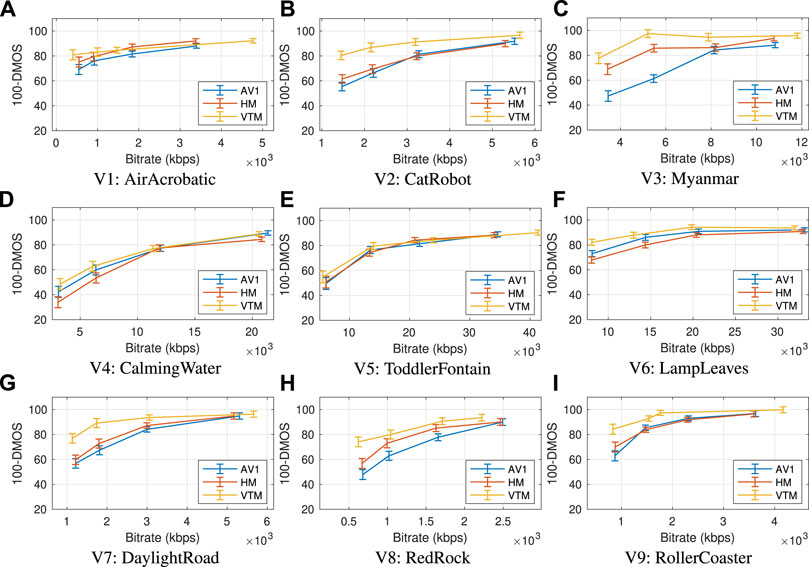
FIGURE 5. The DMOS-Rate curves for all sequences (A–I) of Resolution Group B and all three codecs along with the standard error bars after compensating for subject bias, as described in Recommendation P.913 (2021).
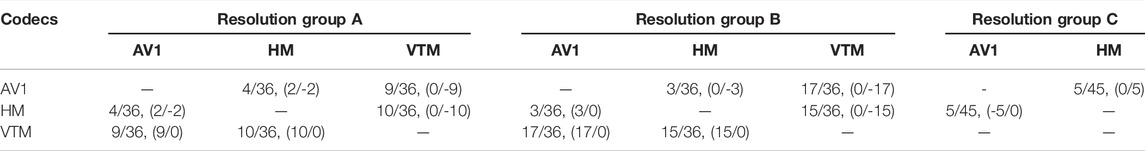
TABLE 6. Aggregated significant difference of perceived quality among the tested codecs based on the ANOVA. The first ratio represents the number of sequences where statistically significant difference has been recorded. The ratio in the parentheses show which codec is significantly better (+) or worse (−) in the pairwise comparison of horizontal/vertical codec.
Results on Resolution Group A: A first impression from Figure 4 is that in most cases the VTM curve is on top of the other curves but also that the confidence intervals are overlapping in most cases. This is confirmed in Table 6, where the significance tests indicate only four cases which exhibit significant difference (p < 0.05) between HM and AV1. In two of these, AV1 is significantly better than HM: in the cases of CalmingWater sequence at R1 and LampLeaves at R2. Both of these sequences consist of dynamic textures that are very challenging to compress. The opposite happens at R2 for AirAcrobatics and at R1 for Myanmar sequence; two sequences with a static background and slow moving objects. Performing significance tests between VTM and HM, a higher number of cases with significant differences were identified mostly at the lower bit rates. Particularly, for CatRobot at R1, R3; for CalmingWater at R1; for LampLeaves at R1-R2; for DaylightRoad at R1-R3; and for RedRock at R1-R2. A similar number of cases where VTM was significantly better than AV1 were identified: for AirAcrobatics at R3; for CatRobot at R1; for Myanmar at R1; for ToddlerFontain at R1; for DaylightRoad at R1-R3; and for RedRock at R1-R2. It is worth mentioning that from the curves in Figure 4 VTM achieves very good quality
Results on Resolution Group B: We performed the same post-screening of the subjects and statistical analysis as in resolution group A. Figure 5 demonstrates the subjective quality against the bit rate after removing the subject bias and Table 6 summarises the results of the one-way ANOVA comparison of the codecs. Generally, the results for the resolution group B align with those from resolution group A, that in most cases AV1 and HM result in equivalent video quality according to the viewers and that VTM in many cases prevails both codecs. Particularly, from Table 6, it can be observed that HM is significantly better than AV1 in only three cases: for Myanmar at R1-R2 and for RedRock at R2. VTM is significantly better than HM in 15 cases: for ToddlerFontain at R1-R4; for Myanmar at R1-R2; for CalmingWater at R1; for LampLeaves at R1-R2; for DaylightRoad at R1-R3; at RedRock at R1; and RollerCoaster at R3-R4. Similarly, VTM is significantly better than AV1 in 17 cases (almost have of the test sequences): for AirAcrobatics at R1; for CatRobot at R1-R3; for Myanmar at R1-R4; for LampLeaves at R1; for DaylightRoad at R1-R3; for RedRock at R1-R3; and RollerCoaster at R1-R2.
The reason that significant differences are noticed between AV1 and both HM and VTM in the case of the Myanmar sequence might be associated with the observation that, at lower bit rates, AV1 encoder demonstrates noticeable artifacts on regions of interest, namely in the center of the frame and on the heads of the walking monks in front of a still background with a static camera. An indicative example of these artifacts has been captured in Figure 6. This, however, is probably a rare case as no similar cases have been reported so far in recent literature.

FIGURE 6. Example of artifacts experienced on the Myanmar sequence that results in subjectively significantly different opinion scores between (A) HM and (B) AV1. The particular patches were captured at R1 from the resolution group B.
Results on Resolution Group C: The removal of the subject bias leads to slightly different results than the ones presented for this case in our previous work [see Katsenou et al. (2019b)], as illustrated in Figure 7. After performing the significance test using one-way ANOVA between paired AV1 and HM sequences, the p-values of five rate points were indicated as significantly different. In all cases, HM is significantly better than AV1: at R1-R4 for Myanmar; and at R2 and R5 for LampLeaves. Myanmar encoded sequences suffer as mentioned earlier from unique artifacts and LampLeaves is a challenging dynamic texture. Although the findings from this resolution group are generally aligned with the observation from the other two resolution groups, for the LampLeaves sequence we notice a degraded performance of AV1 compared to resolution group B. This is attributed to the selected set of resolutions by the DO algorithm for AV1, which comprises lower resolution sequences than those selected for HM: at R2 540p instead of 720p and at R5 720p instead of 1080p (see Table 2).
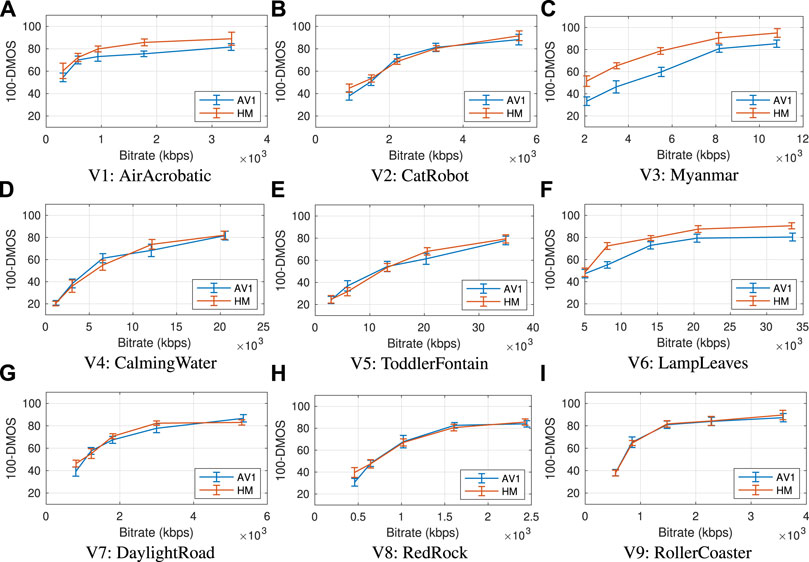
FIGURE 7. The DMOS-Rate curves for all sequences (A–I) of Resolution Group C and all three codecs along with the standard error bars after compensating for subject bias, as described in Recommendation P.913 (2021).
The correlation performance of six tested objective quality metrics for three resolution groups (in terms of SROCC values) is summarised in Table 7. It can be observed that VMAF outperforms the other metrics on all three test databases with the highest SROCC and LCC values, and lowest OR and RMSE. PSNR results in much lower performance, especially for the UHD resolution group. It is also noted that, for all test quality metrics, the SROCC values for three resolution groups are all below 0.9, which indicates that further enhancement is still needed to achieve more accurate prediction.
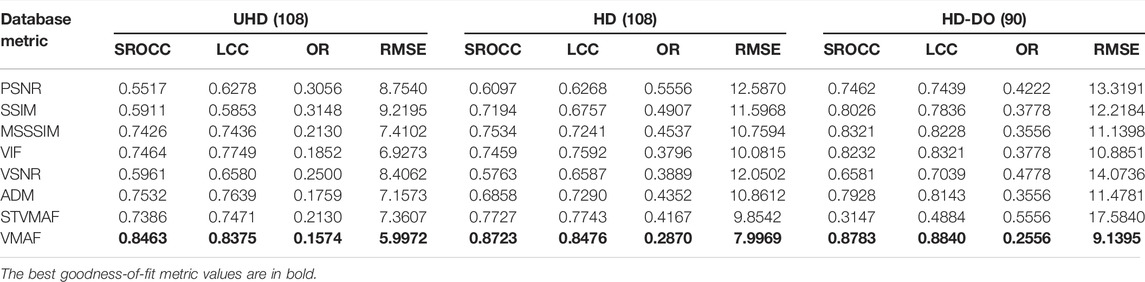
TABLE 7. The correlation statistics of six popular quality metrics when evaluated on three subject datasets (UHD, HD and HD-DO).
The average complexity figures for encoding UHD and HD content are summarised in Table 8, where the HM encoder has been used for benchmarking. The average complexity is computed as the average ratio of the execution time of the tested codec for all rate points over the benchmark. As can be seen, for the tested codec versions, AV1 has a higher complexity compared to VTM4. Interestingly these figures are higher for the HD than the UHD resolution. The relationship between the relative complexity and encoding performance (in terms of average coding gains for PSNR and VMAF) is also shown in Figure 8.

TABLE 8. Computational complexity comparison.
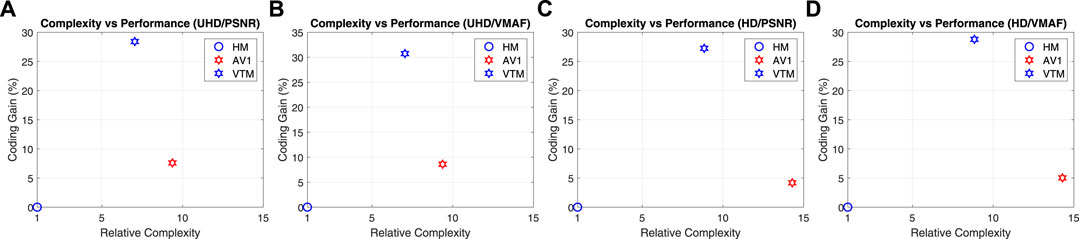
FIGURE 8. The relationship between the relative codec complexity (benchmarked on HM) and encoding performance (in terms of average coding gains) for different resolution groups and quality metrics: (A) UHD/PSNR, (B) UHD/VMAF, (C) HD/PSNR, and (D) HD/VMAF.
This paper presents a video database of nine representative UHD source sequences and 306 compressed versions of these along with their associated objective and subjective quality assessment results. The testing configurations include spatial resampling (from 540p to 1080p) and encoding by three major contemporary video codecs, HEVC HM, AV1, and VVC VTM at pre-defined target bit rates. For one of the three test cases, the convex hull rate-distortion optimisation has been employed to compare HEVC HM and AV1 across different resolutions (from 540p to 1080p) and across a wider bit rate range. This test case is particularly useful in the bitrate ladder construction for adaptive video streaming. All the original and compressed video sequences and their corresponding quality scores are available online for public testing [see Katsenou A. et al. (2021)] with the aim to facilitate research on video compression and video quality across video codecs. To the best of our knowledge, this is the first public dataset that contains encodings from VVC, AV1, and HEVC.
As research on video technologies evolves to data-greedy algorithms, in the near future, we intend to extend this dataset by incorporating more sequences, at higher spatial resolutions, varying framerates, and bitdepths, and by running a large-scale subjective evaluation through crowdsourcing. Furthermore, as the newest VTM releases have shown significant improvement over past versions, we intend to update the VTM version with the latest release. Finally, we will expand the set of codecs by including optimized versions of existing standards, such as SVT-AV1 from Norkin et al. (2020), VVenC/VVdeC from Brandenburg et al. (2020), etc.
The datasets presented in this study can be found in online repositories listed in this paper.
Ethical review and approval was not required for the study of human participants in accordance with the local legislation and institutional requirements. Written informed consent from the participants was provided following the ITU-R BT.500 protocol.
AK: Conceptualization, Investigation, Methodology, Subjective Tests, Data Curation, Software, Visualization, Validation, Writing—Reviewing and Editing. FZ: Conceptualization, Investigation, Methodology, Data Curation, Software, Visualization, Validation, Writing—Reviewing and Editing. MA: Investigation, Methodology, Conceptualization, Software. GD: Subjective Tests, Data Curation, Software, Validation. DB: Supervision, Funding acquisition, Conceptualization, Writing—Reviewing and Editing.
The authors acknowledge funding from the UK Engineering and Physical Sciences Research Council (EPSRC, project No. EP/M000885/1) and the Leverhulme Early Career Fellowship awarded to A. Katsenou (ECF-2017-413). This study received donation from NVIDIA Corporation in the form of GPUs.
The authors declare that the research was conducted in the absence of any commercial or financial relationships that could be construed as a potential conflict of interest.
All claims expressed in this article are solely those of the authors and do not necessarily represent those of their affiliated organizations, or those of the publisher, the editors and the reviewers. Any product that may be evaluated in this article, or claim that may be made by its manufacturer, is not guaranteed or endorsed by the publisher.
1Here only convex hull rate-distortion optimisation within each shot is employed.
2Only for a subset, for the categories Gaming, Sports, and Vlog videos.
3We have not compared VVC with other codecs using the DO approach. This is mainly due to the high computation complexity of VVC and the limited computational resources that we have. Preliminary results for Group A and B have already shown the significant improvement of VVC over the other two.
4It is noted that the complexity for both AV1 and VTM in more recent versions have been significantly reduced.
[Dataset] Advanced Computing Research Centre, University of Bristol (2021). BlueCystal Phase 3. Bristol, England: Advanced Computing Research Centre, University of Bristol. Available at: https://www.acrc.bris.ac.uk/acrc/phase3.htm.
Afonso, M., Zhang, F., and Bull, D. R. (2019). Video Compression Based on Spatio-Temporal Resolution Adaptation. IEEE Trans. Circuits Syst. Video Technol. 29, 275–280. doi:10.1109/tcsvt.2018.2878952
Akyazi, P., and Ebrahimi, T. (2018). “Comparison of Compression Efficiency between HEVC/H. 265, VP9 and AV1 Based on Subjective Quality Assessments,” in Tenth International Conference on Quality of Multimedia Experience (QoMEX) (Cagliari, Italy: IEEE), 1–6. doi:10.1109/qomex.2018.8463294
[Dataset] AOM (2019). AOMedia Video 1 (AV1). Briarcliff Manor, NY, USA: AOM. Available at: https://github.com/AOMediaCodec.
Bjøntegaard, G. (2001). “Calculation of Average PSNR Differences between RD-Curves,” in VCEG-M33: 13th VCEG Meeting (Austin, Texas, USA: ITU-T).
Bossen, F., Boyce, J., Li, X., Seregin, V., and Sühring, K. (2019). “JVET Common Test Conditions and Software Reference Configurations for SDR Video,” in The JVET meeting (ITU-T and ISO/IEC), JVET-M1001.
Brandenburg, J., Wieckowski, A., Hinz, T., Henkel, A., George, V., Zupancic, I., et al. (2020). “Towards Fast and Efficient Vvc Encoding,” in 2020 IEEE 22nd International Workshop on Multimedia Signal Processing (MMSP), 1–6. doi:10.1109/mmsp48831.2020.9287093
Bross, B., Chen, J., Liu, S., and Wang, Y.-K. (2019). “Versatile Video Coding (Draft 7),” in The JVET meeting (ITU-T and ISO/IEC), JVET-P2001.
Bull, D. R., and Zhang, F. (2021). Intelligent Image and Video Compression: Communicating Pictures. Cambridge, MA, USA: Academic Press.
Chandler, D. M., and Hemami, S. S. (2007). VSNR: A Wavelet-Based Visual Signal-To-Noise Ratio for Natural Images. IEEE Trans. Image Process. 16, 2284–2298. doi:10.1109/tip.2007.901820
Chen, Y., Mukherjee, D., Han, J., Grange, A., Xu, Y., Parker, S., et al. (2020). An Overview of Coding Tools in AV1: the First Video Codec from the Alliance for Open Media. APSIPA Trans. Signal Inf. Process. 9. doi:10.1017/atsip.2020.2
CISCO (2018). CISCO Visual Networking index: Forecast and Methodology. Indianapolis, Indiana: CISCO, 2017–2022.
Cortes, C., and Vapnik, V. (1995). Support-vector Networks. Mach Learn. 20, 273–297. doi:10.1007/bf00994018
Daede, T., Norkin, A., and Brailovskiy, I. (2019). “Video Codec Testing and Quality Measurement,” in Internet-Draft (Network Working Group).
Damen, D., Doughty, H., Farinella, G. M., Fidler, S., Furnari, A., Kazakos, E., et al. (2021). The Epic-Kitchens Dataset: Collection, Challenges and Baselines. IEEE Trans. Pattern Anal. Mach. Intell. 43, 4125–4141. doi:10.1109/TPAMI.2020.2991965
Dias, A. S., Blasi, S., Rivera, F., Izquierdo, E., and Mrak, M. (2018). “An Overview of Recent Video Coding Developments in MPEG and AOMedia,” in International Broadcasting Convention (IBC).
[Dataset] Dimitrov, G., Katsenou, A. V., and Bull, D. R. (2019). BVI-SVQA: Subjective Video Quality Assessment Software. Available at: https://github.com/goceee/SVQA.
Duchon, C. E. (1979). Lanczos Filtering in One and Two Dimensions. J. Appl. Meteorol. 18, 1016–1022. doi:10.1175/1520-0450(1979)018<1016:lfioat>2.0.co;2
[Dataset] Google (2017). VP9 Video Codec. Available at: https://www.webmproject.org/vp9/.
Grois, D., Nguyen, T., and Marpe, D. (2016). “Coding Efficiency Comparison of AV1, VP9, H.265/MPEG-HEVC, and H. 264/MPEG-AVC Encoders,” in Picture Coding Symposium (PCS) (Nuremberg, Germany: IEEE), 1–5.
Guo, L., De Cock, J., and Aaron, A. (2018). “Compression Performance Comparison of X264, X265, Libvpx and Aomenc for On-Demand Adaptive Streaming Applications,” in Picture Coding Symposium (PCS) (San Francisco, CA, USA: IEEE), 26–30. doi:10.1109/pcs.2018.8456302
Hanhart, P., and Ebrahimi, T. (2014). Calculation of Average Coding Efficiency Based on Subjective Quality Scores. J. Vis. Commun. Image Representation 25, 555–564. doi:10.1016/j.jvcir.2013.11.008
[Dataset] Harmonic (2019). Harmonic Free 4K Demo Footage. Available at: https://www.harmonicinc.com/news-insights/blog/4k-in-context/.
[Dataset] Hosu, V., Hahn, F., Jenadeleh, M., Lin, H., Men, H., Szirányi, T., et al. (2017). KonVid-1K: The Konstanz Natural Video Database.
[Dataset] ITU-T Rec. H.120 (1993). Codecs for Videoconferencing Using Primary Digital Group Transmission.
[Dataset] ITU-T Rec. H.262 (2012). Information Technology - Generic Coding of Moving Pictures and Associated Audio Information: Video.
Katsavounidis, I. (2018). Dynamic Optimizer – a Perceptual Video Encoding Optimization Framework. Netflix Tech. Blog.
Katsavounidis, I., and Guo, L. (2018). Video Codec Comparison Using the Dynamic Optimizer Framework. Appl. Digital Image Process. XLI (International Soc. Opt. Photonics) 10752, 107520Q. doi:10.1117/12.2322118
Katsenou, A. V., Dimitrov, G., Ma, D., and Bull, D. R. (2021b). BVI-SynTex: A Synthetic Video Texture Dataset for Video Compression and Quality Assessment. IEEE Trans. Multimedia 23, 26–38. doi:10.1109/tmm.2020.2976591
Katsenou, A. V., Sole, J., and Bull, D. R. (2019a). “Content-gnostic Bitrate Ladder Prediction for Adaptive Video Streaming,” in Picture Coding Symposium (PCS). doi:10.1109/pcs48520.2019.8954529
Katsenou, A. V., Zhang, F., Afonso, M., and Bull, D. R. (2019b). “A Subjective Comparison of AV1 and HEVC for Adaptive Video Streaming,” in Proc. IEEE Int Conf. on Image Processing. doi:10.1109/icip.2019.8803523
[Dataset] Katsenou, A., Zhang, F., Afonso, M., Dimitrov, G., and Bull, D. R. (2021a). BVI-CC: BVI - Video Codec Comparison. Available at: https://angkats.github.io/Video-Codec-Comparison/.
Lee, J.-S., De Simone, F., and Ebrahimi, T. (2011). Subjective Quality Evaluation via Paired Comparison: Application to Scalable Video Coding. IEEE Trans. Multimedia 13, 882–893. doi:10.1109/tmm.2011.2157333
Li, J., Krasula, L., Baveye, Y., Li, Z., and Le Callet, P. (2019). Accann: A New Subjective Assessment Methodology for Measuring Acceptability and Annoyance of Quality of Experience. IEEE Trans. Multimedia 21, 2589–2602. doi:10.1109/tmm.2019.2903722
Li, S., Zhang, F., Ma, L., and Ngan, K. N. (2011). Image Quality Assessment by Separately Evaluating Detail Losses and Additive Impairments. IEEE Trans. Multimedia 13, 935–949. doi:10.1109/tmm.2011.2152382
Li, Z., Aaron, A., Katsavounidis, I., Moorthy, A., and Manohara, M. (2016). Toward a Practical Perceptual Video Quality Metric. Netflix Tech. Blog.
Lin, J. Y., Song, R., Wu, C.-H., Liu, T., Wang, H., and Kuo, C.-C. J. (2015). MCL-V: A Streaming Video Quality Assessment Database. J. Vis. Commun. Image Representation 30, 1–9. doi:10.1016/j.jvcir.2015.02.012
Ma, D., Zhang, F., and Bull, D. (2021). BVI-DVC: A Training Database for Deep Video Compression. IEEE Trans. Multimedia. doi:10.1109/tmm.2021.3108943
Mercer Moss, F., Wang, K., Zhang, F., Baddeley, R., and Bull, D. R. (2016a). On the Optimal Presentation Duration for Subjective Video Quality Assessment. IEEE Trans. Circuits Syst. Video Technol. 26, 1977–1987. doi:10.1109/TCSVT.2015.2461971
Mercer Moss, F., Yeh, C.-T., Zhang, F., Baddeley, R., and Bull, D. R. (2016b). Support for Reduced Presentation Durations in Subjective Video Quality Assessment. Signal. Processing: Image Commun. 48, 38–49. doi:10.1016/j.image.2016.08.005
Nguyen, T., and Marpe, D. (2021). Compression Efficiency Analysis of AV1, VVC, and HEVC for Random Access Applications. APSIPA Trans. Signal Inf. Process. 10, e11. doi:10.1017/atsip.2021.10
Norkin, A., Sole, J., Afonso, M., Swanson, K., Opalach, A., Moorthy, A., et al. (2020). SVT-AV1: Open-Source AV1 Encoder and Decoder. Netflix Technol. Blog.
[Dataset] P.910, I.-R. (1999). Subjective Video Quality Assessment Methods for Multimedia Applications.
[Dataset] P.913, I.-R. (2021). Methods for the Subjective Assessment of Video Quality, Audio Quality and Audiovisual Quality of Internet Video and Distribution Quality Television in Any Environment Applications.
[Dataset] Papadopoulos, M. A., Zhang, F., Agrafiotis, D., and Bull, D. R. (2015). BVI-texture: BVI Video Texture Database. Available at: http://data.bris.ac.uk/data/dataset/1if54ya4xpph81fbo1gkpk5kk4.
Recommendation ITU-R BT.500-12 (2012). Methodology for the Subjective Assessment of the Quality of Television Pictures.
Seshadrinathan, K., Soundararajan, R., Bovik, A. C., and Cormack, L. K. (2010). Study of Subjective and Objective Quality Assessment of Video. IEEE Trans. Image Process. 19, 1427–1441. doi:10.1109/tip.2010.2042111
Sharman, K., and Suehring, K. (2018). “Common Test Conditions for Hm Video Coding Experiments,” in The JCT-VC meeting (ITU-T, ISO/IEC), JCTVC-AF1100.
Sheikh, H. R., Bovik, A. C., and de Veciana, G. (2005). An Information Fidelity Criterion for Image Quality Assessment Using Natural Scene Statistics. IEEE Trans. Image Process. 14, 2117–2128. doi:10.1109/tip.2005.859389
[Dataset] Shostak, N., Fedorov, E., and Zimiche, V. (2021). AV2 Video Codec – Early Performance Evaluation of the Research. Available at: https://ottverse.com/av2-video-codec-evaluation/.
Video Quality Experts Group (2000). Final Report from the Video Quality Experts Group on the Validation of Objective Quailty Metrics for Video Quality Assessment.
Video Quality Experts Group (2010). Report on the Validation of Video Quality Models for High Definition Video Content.
Wang, Y., Inguva, S., and Adsumilli, B. (2019). “Youtube Ugc Dataset for Video Compression Research,” in 2019 IEEE 21st International Workshop on Multimedia Signal Processing (MMSP), 1–5. doi:10.1109/mmsp.2019.8901772
Wang, Z., Bovik, A. C., Sheikh, H. R., and Simoncelli, E. P. (2004). Image Quality Assessment: from Error Visibility to Structural Similarity. IEEE Trans. Image Process. 13, 600–612. doi:10.1109/tip.2003.819861
Wang, Z., Simoncelli, E. P., and Bovik, A. C. (2003). “Multi-scale Structural Similarity for Image Quality Assessment,” in Proc. Asilomar Conference on Signals, Systems and Computers (Pacific Grove, CA, USA: IEEE), 1398. Vol. 2.
Winkler, S. (2012). Analysis of Public Image and Video Database for Quality Assessment. IEEE J. Selected Top. Signal Process. 6, 1–10. doi:10.1109/jstsp.2012.2215007
Xing, F., Wang, Y.-G., Wang, H., He, J., and Yuan, J. (2022). DVL2021: An Ultra High Definition Video Dataset for Perceptual Quality Study. J. Vis. Commun. Image Representation 82, 103374. doi:10.1016/j.jvcir.2021.103374
Zabrovskiy, A., Feldmann, C., and Timmerer, C. (2018). “A Practical Evaluation of Video Codecs for Large-Scale HTTP Adaptive Streaming Services,” in 25th IEEE International Conference on Image Processing (ICIP) (Athens, Greece: IEEE), 998–1002. doi:10.1109/icip.2018.8451017
Zhang, F., Afonso, M., and Bull, D. R. (2019). Vistra2: Video Coding Using Spatial Resolution and Effective Bit Depth Adaptation. arXiv preprint arXiv:1911.02833.
Zhang, F., and Bull, D. R. (2011). A Parametric Framework for Video Compression Using Region-Based Texture Models. IEEE J. Sel. Top. Signal. Process. 5, 1378–1392. doi:10.1109/jstsp.2011.2165201
Keywords: video codec dataset, codec comparison, HEVC, AV1, VVC, objective quality assessment, subjective quality assessment
Citation: Katsenou A, Zhang F, Afonso M, Dimitrov G and Bull DR (2022) BVI-CC: A Dataset for Research on Video Compression and Quality Assessment. Front. Sig. Proc. 2:874200. doi: 10.3389/frsip.2022.874200
Received: 11 February 2022; Accepted: 09 March 2022;
Published: 11 April 2022.
Edited by:
Raouf Hamzaoui, De Montfort University, United KingdomReviewed by:
Xin Lu, De Montfort University, United KingdomCopyright © 2022 Katsenou, Zhang, Afonso, Dimitrov and Bull . This is an open-access article distributed under the terms of the Creative Commons Attribution License (CC BY). The use, distribution or reproduction in other forums is permitted, provided the original author(s) and the copyright owner(s) are credited and that the original publication in this journal is cited, in accordance with accepted academic practice. No use, distribution or reproduction is permitted which does not comply with these terms.
*Correspondence: Angeliki Katsenou, YW5nZWxpa2kua2F0c2Vub3VAYnJpc3RvbC5hYy51aw==
Disclaimer: All claims expressed in this article are solely those of the authors and do not necessarily represent those of their affiliated organizations, or those of the publisher, the editors and the reviewers. Any product that may be evaluated in this article or claim that may be made by its manufacturer is not guaranteed or endorsed by the publisher.
Research integrity at Frontiers
Learn more about the work of our research integrity team to safeguard the quality of each article we publish.