 Mouath Aouayeb
- 1Univ. Rennes, INSA Rennes, CNRS, IETR—UMR, Rennes, France
- 2Univ. Rennes, CentraleSupélec, CNRS, IETR—UMR, Rennes, France
Facial micro-expressions (MiEs) analysis has applications in various fields, including emotional intelligence, psychotherapy, and police investigation. However, because MiEs are fast, subtle, and local reactions, there is a challenge for humans and machines to detect and recognize them. In this article, we propose a deep learning approach that addresses the locality and the temporal aspects of MiE by learning spatiotemporal features from local facial regions. Our proposed method is particularly unique in that we use two fusion-based squeeze and excitation (SE) strategies to drive the model to learn the optimal combination of extracted spatiotemporal features from each area. The proposed architecture enhances a previous solution of an automatic system for micro-expression recognition (MER) from local facial regions using a composite deep learning model of convolutional neural network (CNN) and long short-term memory (LSTM). Experiments on three spontaneous MiE datasets show that the proposed solution outperforms state-of-the-art approaches. Our code is presented at https://github.com/MouathAb/AnalyseMiE-CNN_LSTM_SE as an open source.
1 Introduction
Analysis of MiEs plays an important role in several disciplines such as psychology, human–machine interaction, and security due to its characteristics disclosed by (Ekman and Friesen, 1969) as universal, spontaneous, local, and low-intensity expression. However, analyzing them is challenging because they are subtle and fast reflexes that last only from 1/25 to 1/5 s.
Since then, numerous researchers have proposed automated approaches for MER. Various strategies, ranging from handmade to deep learning, are utilized to handle various issues such as the low-intensity aspect, the limitation of MiE samples, and the imbalance of the available data.
Our proposed solution relies on a recent and efficient region-based deep learning approach presented by Aouayeb et al. (2019). This method (Aouayeb et al., 2019) is unique in using an updated label vector based on emotion and its related action units (AUs) for each location in the spatial domain to learn more robust features. The main disadvantage of that method is the static selection of regions of interests (ROIs), with no guarantee that all areas of the region are essential for MER. Another drawback is that the spatiotemporal features from all regions are fused by a simple concatenation block. However, each region may contribute with different weights for different MiEs.
In this study, we aim to overcome these two issues. The proposed solution addresses the first issue by learning the active patches on each region and the second issue by learning the active region for each MiE sequence through time. Its novelty is to combine a deep learning architecture of CNN-LSTM for spatiotemporal features extraction with a fusion attention block called squeeze and excitation (SE) (Hu et al., 2018) to learn more local features. It results in training CNN efficiently on more local areas and learning the attention of each region’s features extracted by LSTM, which helps classify them using fully connected layer (FCL) and outperforms state-of-the-art performance on 3 MiE datasets.
The principal contribution of this study concerns extracting more local characteristics of each ROI, identified by Aouayeb et al. (2019), using CNN and SE. By training the CNN with very local regions (patches), the model focuses on learning more local features avoiding unnecessary ones for MER (e.g., edges, shapes, and textures). However, it could augment the redundancy of the extracted spatial features from different patches and harm the model’s training. To alleviate this issue, we employ SE as an attention block to learn the active patches. The originality is that it is the first time a deep learning model is trained on tiny regions to extract very local features, pointed out by different handcrafted approaches (Zhao and Xu, 2018; Zhao and Xu, 2019; Zhao et al., 2021) as essential for MER. The second contribution is to employ another SE block to learn the attention of the spatiotemporal features and identify the principal regions during a micro-expression sequence. As a result, a classifier could learn more efficiently.
The rest of the study is organized as follows. Section 2 presents the state-of-the-art solutions for MiE recognition. Section 3 describes the proposed spatiotemporal architecture for MiE recognition. The performance of the proposed solution is assessed and compared to the best-performing solutions in Section 4. Finally, Section 5 concludes this paper.
2 Related Work
In this section, we review different approaches for MER. The state-of-the-art solutions are grouped into four categories: handcrafted, deep learning, hybrid, and region-based solutions. A complete survey on micro-expression databases, features, and algorithms is made by Ben et al. (2021) for further details.
2.1 Handcrafted Solutions
The pioneer works on MiE recognition are handcrafted solutions. Zhao and Pietikainen (2007) proposed Local Binary Pattern on Three Orthogonal Planes (LBP-TOP) for features extraction to detect the appearance of face information that describes the variation of pixel intensity. Subsequently, many variants of LBP-TOP were proposed for MER. Wang et al. (2014) proposed Local Binary Pattern (LBP) with six intersection points of the planes (x, y), (x, t), and (y, t) to reduce redundancy in LBP-TOP. Guo et al. (2019) proposed Extended LBP-TOP (ELBP-TOP), which computes three components—the LBP-TOP, the radial difference LBP-TOP, and the angular difference LBP-TOP—to explore the second order of local information in angular and radial directions. Different from these methods, Polikovsky et al. (2009) used the Histogram of Oriented Gradient (HOG) as a descriptor on particular regions of the face to recognize MiE. In addition, Duque et al. (2020) proposed the Mean Oriented Riesz Features (MORF) descriptor, which uses a Riesz pyramid to create an image pair and then extracts spatiotemporal features from it. Despite the progress in handcrafted solutions for MER and other computer vision tasks, they show limits in terms of performance. On the contrary, based on the good results using deep learning methods for different computer vision problems, many researchers invested in using those methods for MER.
2.2 Deep Learning Solutions
Deep learning has been widely used for computer vision tasks such as face recognition, object detection, image segmentation, and tracking. Recently, deep learning architectures have been proposed to classify MiE videos/clips. Patel et al. (2016) used a pre-trained model on the ImageNet dataset and then fine-tuned its weights to classify macro- and micro-expressions. Reddy et al. (2019) proposed a 3D-CNN for spatiotemporal features extraction and then performed the classification using a FCL. Quang et al. (2019) adapted CapsuleNet (Sabour et al., 2017) for MER. Furthermore, Choi and Song (2020) created a 2D feature map based on the time variation of distance between facial landmarks. Then, they fed the sequence of 2D feature maps to a combined architecture of CNN and LSTM to extract spatiotemporal features and classify them.
The main challenge for deep learning solutions in MiE analysis is not only that the provided datasets of spontaneous MiE sequences are limited but also the imbalance between classes. To overcome these problems, Yu et al. (2020) used an improved architecture of conditional Generative Adversarial Nets (cGAN) (Mirza and Osindero, 2014) called Identity-aware and Capsule-Enhanced GAN (ICE-GAN) to synthesize and augment data. The proposed solution consists of a conditional encoder-decoder to generate synthesized MiE and a discriminator based on CapsuleNet (Sabour et al., 2017) to discriminate the real from the fake and identify the corresponding MiE class.
Considering the results of different deep learning solutions, we can notice the improvement compared to handcrafted solutions. However, the performance is still insufficient compared to other computer vision tasks. Hence, there is a need for other solutions.
2.3 Hybrid Solutions
Instead of choosing between handcrafted and deep learning approaches, some researchers consider benefiting from both of them. Typical structures of optical flow (OF) or LBP-TOP are usually employed, and the output is fed to a CNN or a combination of CNN and recurrent neural network (RNN).
Liong et al. (2019) proposed Shallow Triple Stream Three-dimensional CNN (STSTNet): the model used only the onset and apex frames to generate optical flow images (optical strain, horizontal flow, and vertical flow). The optical flow images are stacked with the raw image, followed by three CNNs and a fusion layer. Zhou et al. (2019) considered another approach: instead of extracting deep features from a mix of handcrafted features, they mixed the deep features extracted from the handcrafted ones separately. Precisely, they used a dual CNN model: one for the horizontal component and the other for the vertical component of OF calculated from a mid-position frame that represents the apex and onset frame. The two outputs are merged by FCL to perform the classification. Xia et al. (2020) studied the effect of lower-resolution data on shallow architecture models. They proposed an OF map as input for a recurrent convolutional network with shallow architectures and used a neural architecture search (NAS) (Liu H et al., 2019) strategy to find an optimal combination of wide extension, short connection, and attention units for strong features with low learning complexity.
Hybrid solutions gained a significant performance improvement compared to previous approaches by mixing the handcrafted and deep learning approaches to cover their flaws. However, the results are still limited.
2.4 Region-Based Solutions
MiE video classification has evolved from handcrafted models (Zhao and Pietikainen, 2007; Davison A et al., 2018; Duque et al., 2020) to deep spatiotemporal networks (Patel et al., 2016; Reddy et al., 2019; Yu et al., 2020) and hybrid solutions (Gan et al., 2019; Liong et al., 2019; Xia et al., 2020). However, the improvements in MiE analysis are more modest compared to other computer vision tasks such as human action recognition (Ji et al., 2013). This observation reveals the challenge of MER and invites researchers to address the characteristics of MiE as a short expression in space. Previous works focused on the time and movement specificities of MiE. Recently, some researchers (Zhao and Xu, 2018, 2019; Aouayeb et al., 2019) have proposed to adopt the previous approaches on selected regions of interest (ROI) instead of using the whole face to address the locality aspect of MiE. Such solutions lead to significant improvements over state-of-the-art works. The current work is also related to a region-based approach to extract robust spatiotemporal features from local regions using deep learning architecture for efficient MER. Inspired by existing works (Hu et al., 2018; Aouayeb et al., 2019; Chen et al., 2019), we integrate fusion units to learn active patches on each region and active regions along each MiE temporal sequence.
3 Proposed Solution
In this section, the proposed approach is presented on a deeper level. The overall flow of the proposed system for automatic MER is illustrated in Figure 1. The framework integrates a preprocessing step to normalize the input data. Besides, it includes two processing streams. The first is performed via a CNN to extract spatial structures of each region. The second stream is to extract spatiotemporal structures and classify them. To sum up, our ultimate goal is to reduce the non-useful features for MER extracted from the whole face. This is achieved by extracting features from only ROIs and integrating a double system of fusion in both space and time to add attention to the most relevant spatiotemporal features.

FIGURE 1. Overview of the proposed solution. Images reproduced from the SAMM database with permission from Davison A. K et al. (2018).
3.1 Preprocessing: ROI Extraction
The selected ROIs are based on the Necessary Morphological Patches (NMPs) presented by Zhao and Xu (2019). First, an automatic technique (Kazemi and Sullivan, 2014) based on HOG and linear classifier (the algorithm is provided on dlib1 library) is used to detect the 68 facial landmarks. Second, we align and crop the face based on these landmarks. Then, we identify the ROIs that must contain the AUs responsible for a MiE.
According to Ekman and Friesen (1978), a facial MiE can be represented with Facial Action Coding System (FACS) by a combination of AUs. These AUs are mainly distributed in six regions \{the left and the right (eyes + eyebrows), the nose, the left and the right cheeks, and the mouth \} as shown in Table 1.

TABLE 1. Facial regions and corresponding AUs: we focus on the local region where characteristics of MiE appear.
To find the active location of the MiEs and their corresponding emotion label, Zhao and Xu (2019) used a random forest algorithm on the combination of optical flow’s histogram with LBP-TOP’s histogram. The result is depicted in Figure 2.
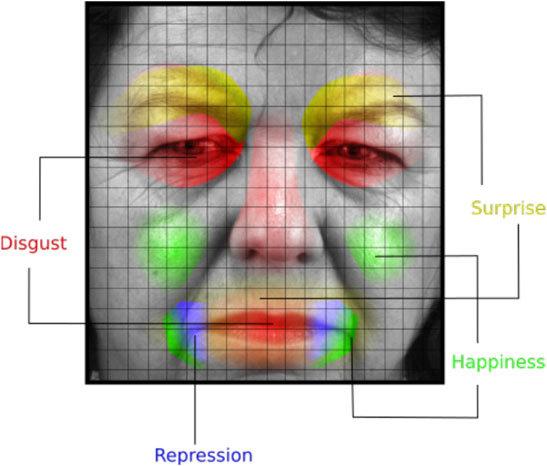
FIGURE 2. Regions of interest and the corresponding emotions. Image reproduced from the SAMM database with permission from Davison A. K et al. (2018).
After the localization of the ROIs, they are cropped from the entire face. Then, their size is normalized to a predefined size for each region. Table 2 shows the size by region on each dataset and the average size among the different databases used in our experiments.

TABLE 2. The dimension for each region on each dataset and the mean between the three databases (CASME II, SAMM, SMIC).
Next, each region is divided into m equal patches. One shall notice that our method differs from those of Zhao and Xu (2018) and Zhao and Xu (2019) in that we get the patches from the six ROIs, not from the entire face. Precisely, we have m∗6 patches, and we have different sizes for patches depending on the size of the region. Thus, a reshape is applied to fit the CNN input architecture. An ablation study of the number of patches is presented in Table 3. It tests the performance of the model using a different number of patches on the mixed dataset of SAMM and CASME II for five AU classification tasks. Further details on the mixed database are presented in the Supplementary Material. It shows that m = 9 is the best choice and outperforms the other choice on four different metrics: accuracy, f1-score, UAR, and UF1. For additional proof of concept, the confusion matrices are presented in the Supplementary Material.
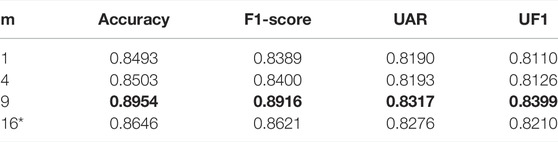
TABLE 3. Ablation study of the number of patches. The proposed model is trained and evaluated using LOSO-CV protocol on a mixed dataset of SAMM and CASME II for the 5-AU classification task. m is a square root of non-negative numbers, and its maximum is 16 because of memory limitation. * The batch size is reduced to 32 instead of 128 like the rest of the experiments.
3.2 Spatial Features Extraction
Now that we have finished the preprocessing step and the data are prepared to be fed into the network, we introduce the spatial model for features extraction from each region. The proposed model is visualized in Figure 3.
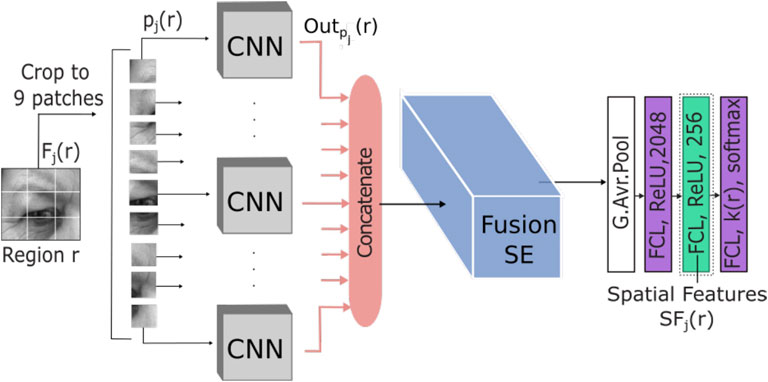
FIGURE 3. The proposed model for spatial features extraction from the left \{eye + eyebrow\} region. The model contains two main parts: the extraction of features from patch Pj(r) using CNN and the fusion of features using SE. Image reproduced from the SAMM database with permission from Davison A. K et al. (2018).
The proposed network first encodes each patch spatially using the CNN model. This provides a deep local and low-resolution features representation. Then, the following SE network fuses the features with an attention process to learn the activated patches and feed the output to FCL to classify them while reducing the dimension of the spatial features.
For the CNN model (Figure 4), we used the same architecture proposed by Aouayeb et al. (2019) with the adaption of the input to the size of the patches. The model has a convolution layer of four filters with a size of 5 × 5 followed by a second convolution layer of eight filters with a size of 3 × 3. Then, a max-pooling layer with a pooling size of 2 × 2 is employed in parallel with four convolution layers of 16 filters with sizes of 1 × 1, 3 × 3, 5 × 5, and 7 × 7, respectively. A Rectified Linear Unit (ReLU) as an activation function and a max-pooling layer with a size of 2 × 2, to reduce the spatial dimensions, are employed after convolution operations. After that, we concatenate the output of the last parallel max-pooling layers. This model is formulated by Eq. 1. Let us denote
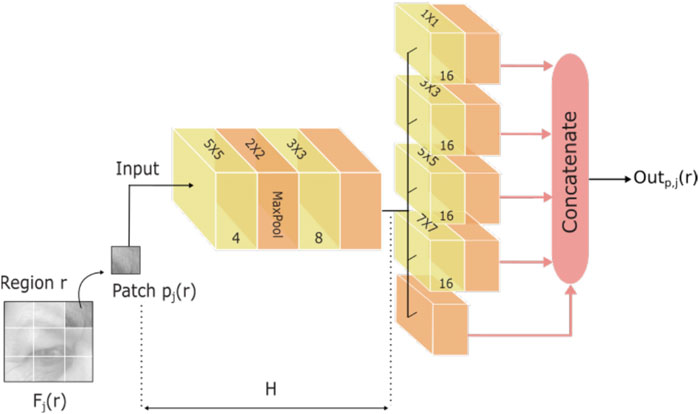
FIGURE 4. The CNN architecture proposed by Aouayeb et al. (2019). It is employed to extract very local features form patches.
The outputs of the nine patches are concatenated and fused using SE (Hu et al., 2018), as depicted in Figure 3. A detailed illustration of the SE network is shown in Figure 5. The squeeze and excitation block mainly contains two operations:
1) The squeeze operation performed by Eq. 2: its operation is based on compressing the input with a global average pooling from (H, W, F) to (1, 1, F) and feeding it to an FCL (or 1 × 1 convolutional layer). The FCL has se.F neurons (se < 1 is the SE parameter) and ReLU as an activation function:
where
2) The excitation operation (Eq. 3), which is a simple FCL (or 1 × 1 convolutional layer) with F neurons followed by a sigmoid activation: the purpose of the excitation is to generate a weight for each feature channel. In our case, the feature channels represent the spatial features extracted from each patch Pj(r):
where A2 and B2 are the parameters of the FCL. Finally, we multiply the generated weights of the excitation with the feature maps FM:
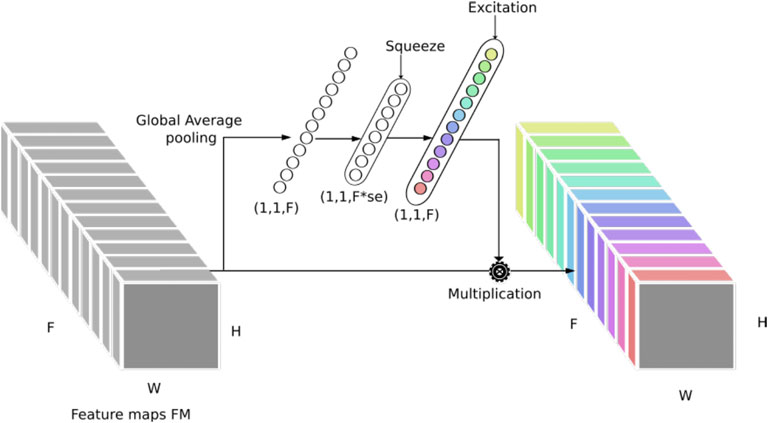
FIGURE 5. Squeeze and excitation (SE) block structure.
For a more thorough description of the SE architecture and its effectiveness, more details can be found in Hu et al. (2018).
After the SE operations, we integrate a global average pooling layer and two FCLs, with, respectively, 2048 and 256 neurons and ReLU as an activation to reduce the dimension of the spatial features. A last layer of FCL is added with the softmax function to perform the classification. Furthermore, a dropout of 0.5 is used after each FCL to immunize the model against the overfitting problem.
After training the spatial model, we save the output of the last ReLU function applied on the FCL with 256 neurons, as the spatial features SFj(r) (equation in 5) extracted from region r at frame Fj. At this point, each MiE sequence is transformed into six sequences of local spatial features (one for each ROI):
3.3 Spatiotemporal Features Extraction and Classification
The temporal aspect of MiE is important for automatic MER systems. In this section, the temporal model, shown in Figure 6, is described. First, a zero-padding is applied to make all sequences of spatial features in a batch fit a given standard length N. Then, an LSTM with 64 units is applied on each sequence {SFj(r), j ∈ [1 ... N]}, followed by a leaky Rectified Linear Unit (LeakyReLU) as activation and a dropout of 0.2. For regions, the output of the LSTM is considered as the spatiotemporal features performed by
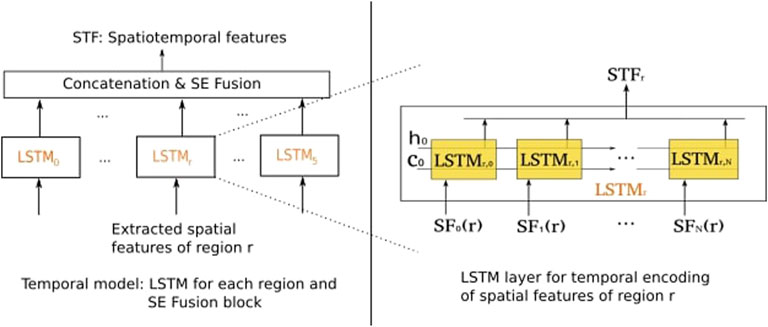
FIGURE 6. Temporal model architecture: the LSTM is employed to extract spatiotemporal features and SE to learn attention of active regions.
After that, we integrate another SE block to fuse the spatiotemporal features of the six regions and learn to activate the region for each MiE sequence. The output STF of the SE block is presented by
The final step is classification. In this model, a simple neural network (NN) is applied. It contains an FCL with 256 neurons and LeakyReLU as an activation function, followed by a dropout of 0.5 and then another FCL with K neurons and softmax as an activation function, where K represents the number of classes. Then, the system provides for each MiE sequence S a set of K probabilities P(s) set as
3.4 Architecture Details
This section provides some details on the input, hyperparameters, and loss function used in the proposed solution. The input image for the spatial model has pixels with values in the [0, 255] range. It is standardized to be in the range [0, 1]. The input sequence of spatial features for the temporal model is normalized in such a way that the mean value data are equal to 0 with the standard deviation equal to 1. Moreover, all the layers are initialized with random values of the normal distribution with a mean value equal to 0 and a standard deviation equal to 1.
In order to train the spatial model or the temporal model with the classification network, a focal loss (Lin et al., 2018) is used. It is presented by
where LFL denotes the focal loss, αi ∈ [0, 1] is a weighting factor for class i set by inverse class frequency to contribute the imbalance between classes, and γ > = 0 is the focusing parameter often set to 2. The role of
Furthermore, the used optimizer is Adam, with a learning rate set to 1e − 4 for the training of the spatial model and 5e − 5 for the training of the temporal model with the classification network. For fast implementation, we utilize the library of Tensorflow-gpu 1.12.0, and all the experiments are performed on a GPU cluster (GeForce GTX 1080 Ti GPU 32 GB memory).
4 Experiments and Comparison
In this section, we experimentally evaluate our contributions. We start with a brief introduction of the datasets and the evaluation methodology used in the 2nd Micro-expression Grand Challenge (MEGC) (4.1). Then, we ablate the various design choices in the proposed architecture to assess the comprehension of each (see Section 4.1.6). Finally, we compare our solution to state-of-the-art solutions (Section 4.2).
4.1 Databases and Evaluation Methodology
4.1.1 Databases
The three used datasets are CASME II (Yan et al., 2014), SAMM (Davison A. K et al., 2018), and SMIC (Li et al., 2013). Besides these three databases, another one called FULL is introduced in MEGC (See et al., 2019) by fusing the three of them.
4.1.2 SMIC
The Spontaneous Micro-Expression (SMIC) dataset contains three versions using three different cameras: a high-speed (HS) camera at 100 frames per second (fps) and two cameras at 25 fps of both visual (VIS) and near-infrared (NIR) light range. In all experiments, we used the SMIC-HS version that features 164 clips from 16 distinct persons. SMIC-HS generates sequences with a face resolution of (190 × 230) that fall into only three categories: negative, positive, and surprise.
4.1.3 CASME II
The Chinese Academic of Science Micro-Expressions II (CASME II) dataset contains 247 sequences2 of spontaneous MiE from 35 people, comprising five categories—happiness, disgust, repression, surprise, and sadness—and the Other category. The sequences have high temporal and spatial resolutions of 200 fps and (280 × 340), respectively.
4.1.4 SAMM
The Spontaneous Micro-Facial Movement (SAMM) has the most ethnic diversity (13 ethnicities) and the most diverse age range. Disgust, surprise, happiness, fear, anger, contempt, and sadness are the seven main types of emotion depicted in the video sequences, captured with a high-resolution camera at 200 fps. A total of 159 spontaneous facial MiE sequences from 32 people are included in the database. Among these three datasets, it has the highest spatial resolution (400 × 400 pixels). Furthermore, the focus of this dataset is on the objective AUs labels rather than the emotional labels. Therefore, all of the sequences are FACS-coded and include the Onset, Apex, and Offset frames.
4.1.5 FULL
It contains 442 sequences with three classes: “negative,” “positive,” and “surprise.” It is introduced as data augmentation.
All used datasets in experiments are summarized in Table 4.
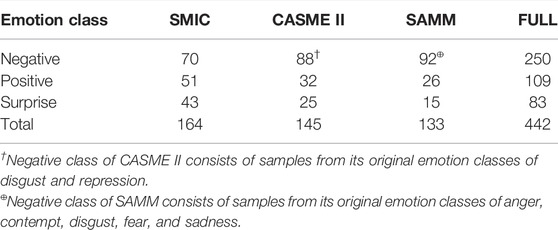
TABLE 4. Distribution of classes according to the MEGC conditions (See et al., 2019).
4.1.6 Evaluation Methodology
For the evaluation of the proposed solution, the Leave-One-Subject-Out Cross-Validation (LOSO-CV) is used as a protocol to split data into train and test sets. Data are divided per subject following this protocol. At each time, the training is conducted on Z-1 subjects and the test is run on the remaining subject (Z is the total number of subjects). The metrics applied to evaluate the system are the accuracy, the Unweighted Average Recall (UAR), and the Unweighted F1-score (UF1). The UF1 and UAR are computed by Eq. 11 and Eq. 10, respectively. Both metrics are used with LOSO-CV as they are more convenient for an imbalanced classification problem (See et al., 2019):
where TPc, FPc, and FNc are, respectively, true positive, false positive, and false negative of class c and C is the number of classes:
where ACCc and Nc are, respectively, the accuracy rate and the number of samples of class c.
4.2 Results and Analysis
4.2.1 Contribution of Spatial and Temporal Models
The proposed method involves two stages of fusion in space and time. To validate the use of the two fusion blocks, we test the solution with and without the fusion blocks under the MEGC conditions with LOSO-CV. The performance in terms of UAR, UF1, and accuracy is summarized in Table 5. These results demonstrate the efficiency of each fusion unit. The performance with the two SE fusion blocks outperforms the base solution without any fusion and the model with either a spatial fusion or a temporal fusion, with a 3% more in UAR and almost 3% more in UF1. One can observe a gain of 3% on UF1 and 4% on accuracy with the spatial fusion compared to the basic solution, which clearly supports the use of small patches instead of the regions or the whole face. We can notice that the spatial fusion has a more positive impact on the result compared to the temporal fusion with 2% more in UF1 and 4% more in accuracy, which can be explained by the fact that the basic solution contains already a fusion of LSTMs with a simple concatenation followed by an FCL but no fusion of spatial features.
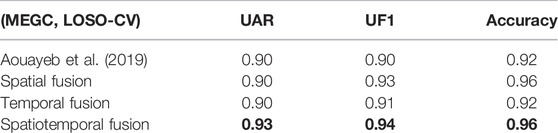
TABLE 5. Performance of the spatial and temporal fusion blocks.
4.2.2 Impact of Learning With ROI Labels
Aouayeb et al. (2019) suggested using a customized label for each region to train the spatial model. To demonstrate the effectiveness of this contribution, we test the proposed model with the provided labels for the whole face with the label given for each region based on Aouayeb et al. (2019). Table 6 shows that the solution with customized labels for each region performs better because it helps the spatial model to train more efficiently by focusing on a local region.
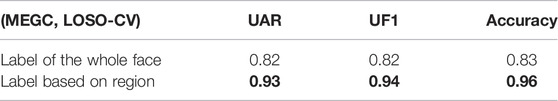
TABLE 6. Performance of using the customized label for each region to train the spatial model.
4.2.3 Comparison to the State-of-the-Art
Table 7 shows that the proposed model improves the basic architecture in UAR and UF1 by almost 4% in the FULL database. By taking a closer look, one can find that the SAMM part is the most improved, with 8% in UAR and 14% in UF1.
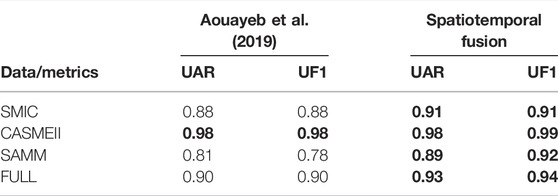
TABLE 7. Performance on three classes based MEGC with LOSO-CV.
As shown in Table 8, the proposed solution outperforms all state-of-the-art works, particularly handcrafted solutions where the UAR and UF1 metrics are improved in most cases by 40%, and one can also observe a slight improvement compared to recent deep learning-based solutions. The main drawback of our solution is the complexity of the algorithm, which makes the tuning of hyperparameters of the model harder.
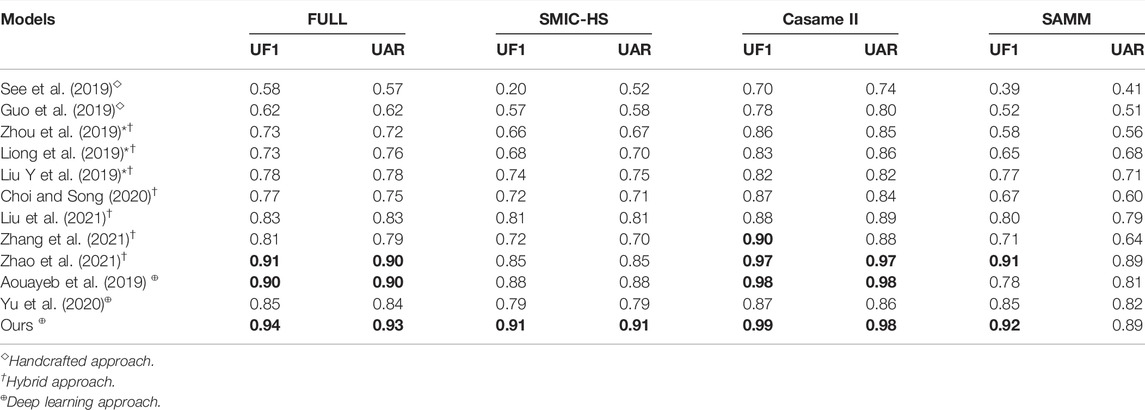
TABLE 8. LOSO-CV performance of the proposed method, baselines, and the recent methods (* references from the MEGC 2019 challenge). Bold: score
5 Conclusion
In this study, we have proposed a region-based solution for MER. The proposed solution extracts spatiotemporal features using a combined architecture of CNN and LSTM supported by a SE fusion unit in space and time. The effectiveness of the architecture, the use of the SE, and the ROI labels are validated. Experiments on different databases demonstrate the potential of this model. It outperforms the first solution in the MEGC and other recently proposed solutions. In future work, we will explore less complex architecture for MER that addresses the locality character with an automatic system.
Author Contributions
MA: software, methodology and conceptualization, and writing—original draft. CS: conceptualization, methodology, and writing—review and editing. WH: supervision and writing—review and editing. KK: supervision and writing—review and editing. RS: supervision.
Conflict of Interest
The authors declare that the research was conducted in the absence of any commercial or financial relationships that could be construed as a potential conflict of interest.
Publisher’s Note
All claims expressed in this article are solely those of the authors and do not necessarily represent those of their affiliated organizations or those of the publisher, the editors, and the reviewers. Any product that may be evaluated in this article, or claim that may be made by its manufacturer, is not guaranteed or endorsed by the publisher.
Supplementary Material
The Supplementary Material for this article can be found online at: https://www.frontiersin.org/articles/10.3389/frsip.2022.861469/full#supplementary-material
References
Aouayeb, M., Hamidouche, W., Kpalma, K., and Benazza-Benyahia, A. (2019). “A Spatiotemporal Deep Learning Solution for Automatic Micro-expressions Recognition from Local Facial Regions,” in 2019 IEEE 29th International Workshop on Machine Learning for Signal Processing (MLSP) (Pittsburgh, PA), 1–6. doi:10.1109/mlsp.2019.8918771
Ben, X., Ren, Y., Zhang, J., Wang, S.-J., Kpalma, K., Meng, W., et al. (2021). Video-based Facial Micro-expression Analysis: A Survey of Datasets, Features and Algorithms. IEEE Trans. Pattern Anal. Mach. Intell., 1. doi:10.1109/TPAMI.2021.3067464
Chen, Y., Zhang, Z., Zhong, L., Chen, T., Chen, J., and Yu, Y. (2019). Three-stream Convolutional Neural Network with Squeeze-And-Excitation Block for Near-Infrared Facial Expression Recognition. Electronics 8, 385. doi:10.3390/electronics8040385
Choi, D. Y., and Song, B. C. (2020). Facial Micro-expression Recognition Using Two-Dimensional Landmark Feature Maps. IEEE Access 8, 121549–121563. doi:10.1109/access.2020.3006958
Davison, A. K., Lansley, C., Costen, N., Tan, K., and Yap, M. H. (2018). SAMM: A Spontaneous Micro-facial Movement Dataset. IEEE Trans. Affective Comput. 9, 116–129. doi:10.1109/taffc.2016.2573832
Davison, A., Merghani, W., and Yap, M. (2018). Objective Classes for Micro-facial Expression Recognition. J. Imaging 4, 119. doi:10.3390/jimaging4100119
Duque, C., Alata, O., Emonet, R., Konik, H., and Legrand, A. (2020). Mean Oriented Riesz Features for Micro Expression Classification. ArXiv abs/2005.06198.
Ekman, P., and Friesen, W. V. (1969). Nonverbal Leakage and Clues to Deception. Psychiatry 32, 88–106. doi:10.1080/00332747.1969.11023575
Ekman, P., and Friesen, W. (1978). Facial Action Coding System: Investigator’s Guide. Consulting Psychologists Press.
Gan, Y., Liong, S.-T., Yau, W. C., Huang, Y. C., and Tan, L. K. (2019). OFF-ApexNet on Micro-expression Recognition System. Signal. Processing: Image Commun. 74, 129. doi:10.1016/j.image.2019.02.005
Guo, C., Liang, J., Zhan, G., Liu, Z., Pietikäinen, M., and Liu, L. (2019). Extended Local Binary Patterns for Efficient and Robust Spontaneous Facial Micro-expression Recognition. IEEE Access 7, 174517–174530. doi:10.1109/access.2019.2942358
Hu, J., Shen, L., and Sun, G. (2018). “Squeeze-and-excitation Networks,” in 2018 IEEE/CVF Conference on Computer Vision and Pattern Recognition, 7132–7141. doi:10.1109/cvpr.2018.00745
Ji, S., Xu, W., Yang, M., and Yu, K. (2013). 3d Convolutional Neural Networks for Human Action Recognition. IEEE Trans. Pattern Anal. Mach. Intell. 35, 221–231. doi:10.1109/tpami.2012.59
Kazemi, V., and Sullivan, J. (2014). “One Millisecond Face Alignment with an Ensemble of Regression Trees,” in 2014 IEEE Conference on Computer Vision and Pattern Recognition, 1867–1874. doi:10.1109/cvpr.2014.241
Li, X., Pfister, T., Huang, X., Zhao, G., and Pietika, M. (2013). “A Spontaneous Micro-expression Database: Inducement, Collection and Base-Line,” in 10th Proceedings of the International Conference Autom Face Gesture Recognition (FG2013), Shanghai, China. doi:10.1109/FG.2013.6553717
Lin, T.-Y., Goyal, P., Girshick, R., He, K., and Dollar, P. (2020). Focal Loss for Dense Object Detection. IEEE Trans. Pattern Anal. Mach. Intell. 42, 318–327. doi:10.1109/TPAMI.2018.2858826
Liong, S.-T., Gan, Y., See, J., and Khor, H.-Q. (2019). A Shallow Triple Stream Three-Dimensional CNN (STSTNet) for Micro-expression Recognition System. arXiv preprint arXiv:1902.03634.
Liu, H., Simonyan, K., and Yang, Y. (2019). “DARTS: Differentiable Architecture Search,” in International Conference on Learning Representations.
Liu, K.-H., Jin, Q.-S., Xu, H.-C., Gan, Y.-S., and Liong, S.-T. (2021). Micro-expression Recognition Using Advanced Genetic Algorithm. Signal. Processing: Image Commun. 93, 116153. doi:10.1016/j.image.2021.116153
Liu, Y., Du, H., Zheng, L., and Gedeon, T. (2019). “A Neural Micro-expression Recognizer,” in 14th IEEE International Conference on Automatic Face & Gesture Recognition (FG 2019). doi:10.1109/fg.2019.8756583
Patel, D., Hong, X., and Zhao, G. (2016). “Selective Deep Features for Micro-expression Recognition,” in 2016 23rd International Conference on Pattern Recognition (ICPR), 2258–2263. doi:10.1109/icpr.2016.7899972
Polikovsky, S., Kameda, Y., and Ohta, Y. (2009). “Facial Micro-expressions Recognition Using High Speed Camera and 3d-Gradient Descriptor,” in 3rd International Conference On Imaging For Crime Detection And Prevention (ICDP 2009). doi:10.1049/ic.2009.0244
Quang, N. V., Chun, J., and Tokuyama, T. (2019). “Capsulenet for Micro-expression Recognition,” in 2019 14th IEEE International Conference on Automatic Face Gesture Recognition (FG 2019), 1–7. doi:10.1109/fg.2019.8756544
Reddy, S. P. T., Karri, S. T., Dubey, S. R., and Mukherjee, S. (2019). Spontaneous Facial Micro-expression Recognition Using 3D Spatiotemporal Convolutional Neural Networks. arXiv preprint arXiv:1904.01390.
Sabour, S., Frosst, N., and Hinton, G. E. (2017). Dynamic Routing between Capsules. ArXiv abs/1710, 09829.
See, J., Yap, M. H., Li, J., Hong, X., and Wang, S.-J. (2019). “MEGC 2019 – the Second Facial Micro-expressions Grand Challenge,” in 14th IEEE International Conference on Automatic Face & Gesture Recognition (FG 2019).
Wang, Y., See, J., Phan, R. C.-W., and Oh, Y.-H. (2014). “Lbp with Six Intersection Points: Reducing Redundant Information in Lbp-Top for Micro-expression Recognition,” in Asian conference on computer vision (Springer), 525–537.
Xia, Z., Peng, W., Khor, H.-Q., Feng, X., and Zhao, G. (2020). Revealing the Invisible with Model and Data Shrinking for Composite-Database Micro-expression Recognition. IEEE Trans. Image Process. 29, 8590–8605. doi:10.1109/tip.2020.3018222
Yan, W. J., Li, X., Wang, S. J., Zhao, G., Liu, Y. J., Chen, Y. H., et al. (2014). CASME II: An Improved Spontaneous Micro-expression Database and the Baseline Evaluation. PloS one 9, e86041. doi:10.1371/journal.pone.0086041
Yu, J., Zhang, C., Song, Y., and Cai, W. (2020). Ice-gan: Identity-Aware and Capsule-Enhanced gan for Micro-expression Recognition and Synthesis. ArXiv abs/2005.04370.
Zhang, L., Hong, X., Arandjelovic, O., and Zhao, G. (2021). Short and Long Range Relation Based Spatio-Temporal Transformer for Micro-expression Recognition. CoRR abs/2112.05851.
Zhao, G., and Pietikainen, M. (2007). Dynamic Texture Recognition Using Local Binary Patterns with an Application to Facial Expressions. IEEE Trans. Pattern Anal. Mach. Intell. 29, 915–928. doi:10.1109/tpami.2007.1110
Zhao, Y., Chen, Z., and Luo, S. (2021). Micro-expression Recognition Based on Pixel Residual Sum and Cropped Gaussian Pyramid. Front. Neurorobot. 15, 746985. doi:10.3389/fnbot.2021.746985
Zhao, Y., and Xu, J. (2019). An Improved Micro-expression Recognition Method Based on Necessary Morphological Patches. Symmetry 11, 497. doi:10.3390/sym11040497
Zhao, Y., and Xu, J. (2018). Necessary Morphological Patches Extraction for Automatic Micro-expression Recognition. Appl. Sci. 8, 1811. doi:10.3390/app8101811
Zhou, L., Mao, Q., and Xue, L. (2019). “Dual-inception Network for Cross-Database Micro-expression Recognition,” in 2019 14th IEEE International Conference on Automatic Face Gesture Recognition (FG 2019), 1–5. doi:10.1109/fg.2019.8756579
Footnotes
1http://dlib.net/face_landmark_detection.py.html
2247 samples were reported by Yan et al. (2014), while, in the publicly available dataset, the number of samples is about 255.
Keywords: micro-expression recognition, squeeze and excitation, CNN, LSTM, active patches
Citation: Aouayeb M, Soladie C, Hamidouche W, Kpalma K and Seguier R (2022) Spatiotemporal Features Fusion From Local Facial Regions for Micro-Expressions Recognition. Front. Sig. Proc. 2:861469. doi: 10.3389/frsip.2022.861469
Received: 24 January 2022; Accepted: 14 March 2022;
Published: 13 April 2022.
Edited by:
Yuming Fang, Jiangxi University of Finance and Economics, ChinaCopyright © 2022 Aouayeb, Soladie, Hamidouche, Kpalma and Seguier. This is an open-access article distributed under the terms of the Creative Commons Attribution License (CC BY). The use, distribution or reproduction in other forums is permitted, provided the original author(s) and the copyright owner(s) are credited and that the original publication in this journal is cited, in accordance with accepted academic practice. No use, distribution or reproduction is permitted which does not comply with these terms.
*Correspondence: Mouath Aouayeb, aouayeb.mouath@insa-rennes.fr