 Fouzi Harrou
 K. Ramakrishna Kini
 Muddu Madakyaru
 Ying Sun
- 1King Abdullah University of Science and Technology (KAUST) Computer, Electrical and Mathematical Sciences and Engineering (CEMSE) Division, Thuwal, Saudi Arabia
- 2Department of Instrumentation and Control Engineering, Manipal Institute of Technology, Manipal Academy of Higher Education, Manipal, India
- 3Department of Chemical Engineering, Manipal Institute of Technology, Manipal Academy of Higher Education, Manipal, India
Drunk driving poses a significant threat to road safety, necessitating effective detection methods to enhance preventive measures and ensure the well-being of road users. Recognizing the critical importance of identifying drunk driving incidents for public safety, this paper introduces an effective semi-supervised anomaly detection strategy. The proposed strategy integrates three key elements: Independent Component Analysis (ICA), Kantorovitch distance (KD), and double Exponentially Weighted Moving Average (DEWMA). ICA is used to handle non-gaussian and multivariate data, while KD is used to measure the dissimilarity between normal and abnormal events based on ICA features. The DEWMA is applied to KD charting statistics to detect changes in data and uses a nonparametric threshold to improve sensitivity. The primary advantage of this approach is its ability to perform anomaly detection without requiring labeled data. The study also used XGBoost for the later calculation of the SHAP (SHapley Additive exPlanations) values to identify the most important variables for detecting drunk driving behavior. The approach was evaluated using publicly available data from gas and temperature sensors, as well as digital cameras. The results showed that the proposed approach achieved an F1-score of 98% in detecting the driver’s drunk status, outperforming conventional PCA-based and ICA-based methods.
1 Introduction
Alcohol consumption has a notable impact on global health, accounting for 5% of the total disease burden and directly leading to one in 20 deaths worldwide (Koch et al., 2023). Drunk driving is a significant problem worldwide, leading to numerous road accidents and fatalities annually. Alcohol increases the risk of severe traffic crashes, with approximately 30 daily fatalities in the US linked to alcohol-related incidents, comprising 30% of all traffic deaths (National Highway Traffic Safety Administration, 2022). According to the WHO, car crashes contribute to about 1.3 million annual deaths (World Health Organization, 2021). The risk of accidents significantly rises with alcohol or psychoactive substance use while driving. The WHO reports that approximately 40% of road accidents stem from driving under the influence of alcohol, the fifth leading cause of on-road fatalities (World Health Organization, 2015; Haghpanahan et al., 2019). Beyond causing injuries, drunk driving results in global financial losses of up to $500 million per year (Paredes-Doig et al., 2014). Hence, precise detection of intoxicated drivers is crucial to reduce road accidents. In-vehicle systems are essential for detecting and preventing drunk driving, offering interventions like impairment warnings and enforced vehicle stops.
Despite the advancements in intelligent transportation systems, drunk driving remains one of the major global traffic safety concerns, significantly contributing to road fatalities. Traditional methods of detecting drunk driving, like breathalyzers or field sobriety tests, are not always accurate or reliable, and drivers may manipulate the results Doniec et al. (2024); Greer et al. (2023). Consequently, there has been a growing interest in using sensor-based technologies to detect drunk driving. This method uses sensors that can detect changes in the driver’s body or the vehicle’s behavior, alerting authorities if the driver is under the influence of alcohol. There are two types of alcohol detection methods: obtrusive and unobtrusive (Li et al., 2020). Obtrusive methods rely on physiological changes like blood alcohol concentration, but obtaining such data is challenging and may interfere with the driver (Khardi and Vallet, 1995; Sakairi, 2011; Wu et al., 2016). In contrast, unobtrusive methods depend on driving behavior and vehicle-based features, such as vehicle speed, acceleration, steering wheel movements, lateral position, and image-based features to monitor the driver’s face and condition (Chen and Chia-Tseng, 2012; Ljungblad et al., 2017). Many embedded systems have been developed for alcohol detection, employing strategies such as breath-based alcohol detection and IoT-based drunk detection, which utilize sensors for heartbeat rate, facial recognition, and alcohol concentration detection (Sandeep et al., 2017; Gasparesc, 2018).
Several studies have concentrated on camera-based driver monitoring due to its effectiveness in capturing rich visual information about the driver’s behavior and the surrounding environment (Doudou et al., 2020). These camera-based systems typically utilize computer vision techniques to analyze images or videos of the driver’s face, posture, and eye movements to infer their cognitive and physical states (Wang et al., 2021). By monitoring indicators such as eyelid closure, head position, gaze direction, and facial expressions, these systems can detect signs of drowsiness, distraction, or impairment in real-time (Guettas et al., 2019). Moreover, advancements in machine learning algorithms have significantly improved the accuracy and robustness of these monitoring systems, enabling them to adapt to different lighting conditions, facial orientations, and driver demographics. Additionally, integrating multiple cameras within the vehicle cabin allows for a comprehensive analysis of the driver’s behavior from various angles, enhancing the system’s overall effectiveness. Camera-based driver monitoring systems have shown great promise in enhancing road safety by providing early warnings to drivers and triggering interventions when signs of impairment or distraction are detected. In (Jo et al., 2011), a driver–monitoring method is proposed to detect both drowsiness and distraction by analyzing eye movements. Their approach combines eye detection algorithms with machine learning techniques to achieve high detection accuracies for both factors, contributing to accident prevention. Kashevnik et al. present a cloud-based driver monitoring system that utilizes smartphone sensors for detecting dangerous states such as drowsiness and distraction (Kashevnik et al., 2020). They integrate information from camera video frames and other sensors to personalize the monitoring system and provide real-time reports on driver behavior. Shaily et al. (2021) develop a smart driver monitoring system based on image processing, leveraging vehicle details and a dashboard-mounted camera to detect driver drowsiness. Their non-intrusive approach, incorporating machine learning, aims to mitigate the risk of road accidents caused by driver fatigue. Mazzae et al. (2023) investigate drivers’ eye gaze behavior and performance using camera-based visibility systems versus traditional mirrors. They compare driving behavior and preferences between the two systems, providing insights into the potential impacts on safety and usability. Of course, as technology continues to evolve, camera-based monitoring systems are expected to play an increasingly important role in preventing accidents and promoting safe driving behaviors on the roads.
Drunk driving poses a severe threat to road safety, and researchers and engineers have been working to develop data-driven methods to improve detection (Wang et al., 2021). Numerous techniques have been scrutinized in the literature over the past few decades. For instance, in the study (Li et al., 2015), drunk driving detection is tackled using multivariate time series classification. Driving performance measures, such as lateral position and steering angle, are gathered and analyzed. Features such as slope and time interval of segments are extracted through the utilization of a piecewise linear representation. A support vector machine (SVM) classifier successfully categorizes driver states into normal or drunk, achieving an accuracy of 80%. The study in (Chen et al., 2017) distinguishes between drunk driving and normal driving in simulated conditions using an SVM classifier. By incorporating driving performance and physiological measurements, the SVM achieves a 70% accuracy, emphasizing the importance of specific physiological indicators highlighted through Principal Component Analysis. In (Chatterjee et al., 2018), a non-intrusive driving fitness detection approach is presented. The system utilizes computer vision techniques to capture real-time video feeds via a smartphone camera. Facial landmark detection and motion analysis assess drowsiness and potential alcohol influence. The system calculates a severity score based on persistent eye blinks and head/body orientation, indicating the driver’s fitness to operate a vehicle. In (Li et al., 2020), Li et al. proposed an approach for detecting drunk driving, utilizing Random Forest-based feature selection. Driving behavior data collected from a Beijing University of Technology simulator served as the foundation for developing the detection system. The study identified crucial features, such as acceleration, speed, distance to the center of the lane, acceleration, engine revolution, brake depth, and steering angle, that significantly influence accurate drunk driving detection. Notably, the inclusion of accelerator pedal depth demonstrated superior classifier performance. Additionally, the integration of a dummy variable allowed for the encoding of geometric characteristics of different roads, ensuring the system’s adaptability to diverse road conditions. Comparative analysis with linear discriminant analysis, SVM, and AdaBoost classifiers revealed that both the Random Forest and AdaBoost classifiers achieved an impressive accuracy of 81.48%, affirming the effectiveness of the proposed method in enhancing drunk driving recognition. In (Mühlbacher-Karrer et al., 2017), a driver state detection system based on cellular neural networks is introduced. The system combines a capacitive-based wireless hand detection sensor with physiological sensors to monitor the driver’s stress level. The study, conducted in a driving simulator, demonstrates a significant improvement in detection accuracy (92%) by integrating sensor inputs from different driver inherent domains. Introducing the capacitive hand detection sensor boosts accuracy by an additional 10%, underscoring the effectiveness of integrating diverse sensor inputs for robust driver state detection. However, these approaches require labeled data, which is challenging in practice.
In Chang et al.’s study (Chang et al., 2021), they propose a two-stage neural network for drunk driving detection. Using a simplified visual geometry group (VGG) network, the first stage determines the driver’s age range, and the second stage, employing a simplified Dense-Net, identifies facial features associated with drunk driving. The age discrimination stage achieved an accuracy of 86.36%, and in tests recognizing drunk driving across various age groups, the system showed an improved overall accuracy of 89.62%. However, this two-stage approach using simplified VGG and Dense-Net networks can be computationally intensive, requiring significant processing power and memory. This complexity may limit its deployment in real-time applications or resource-constrained environments. In (Dairi et al., 2022), an anomaly detection framework is introduced for effective drunk driving detection by merging the t-distributed stochastic neighbor embedding (t-SNE) for feature extraction with the Isolation Forest (iF) scheme. The t-SNE-iF approach achieves high detection performance with an AUC of around 95% based on publically available data from gas sensors, temperature sensors, and a digital camera. While t-SNE is effective for visualization, it may not always preserve the intrinsic structure of the data when used for feature extraction. This can lead to suboptimal feature representations for the Isolation Forest. The study in (Hs and Hs, 2010) collected data from 108 drivers across age groups, road types, and alcohol concentrations using the National Advanced Driving Simulator. Three algorithms were developed, utilizing logistic regression, decision trees, and an SVM. The algorithms demonstrated an accuracy of 73%–86% in distinguishing between drivers with blood alcohol concentrations (BACs) at or above 0.08% and those below. These results are comparable to standardized field sobriety tests and suggest the potential of vehicle-based systems in addressing alcohol-impaired driving issues. However, an accuracy range of 73%–86% may not be adequate for high-stakes applications such as preventing drunk driving. Furthermore, reliance on data from a driving simulator may fail to fully capture the complexities and variabilities of real-world driving conditions, potentially limiting the model’s applicability in real-world scenarios. In (Varghese et al., 2021), an integrated system using machine learning to detect driver drowsiness and alcohol intoxication is proposed, addressing key factors contributing to road accidents. The system employs an MQ-3 sensor for alcohol detection and a webcam for non-intrusive drowsiness detection through facial features. Utilizing SVM and Histogram of Oriented Gradient, the system achieves an overall accuracy of 86%. The integration of these components, facilitated by Raspberry Pi three and Arduino UNO, provides a cost-effective and efficient solution to enhance road safety. However, combining multiple sensors and technologies (e.g., Raspberry Pi, Arduino UNO) into a cohesive system can be challenging and require careful calibration and synchronization to ensure reliable operation. Additionally, this fully supervised approach necessitates labeled data for training, which may not always be readily available and could limit the system’s scalability and adaptability to new environments or unseen data. The study in (Karimisetty et al., 2022) presents a two-step system for continuously monitoring drunk drivers using IoT and machine learning-based anomaly detection. The approach integrates IoT sensors for alcohol detection and tracking abnormal vehicle movements through GPS. With IoT Drunk Driver Detection and SVM Learning-based anomaly detection, this system enables real-time monitoring for vehicle owners. It assists law enforcement in identifying drunk drivers, particularly in heavy traffic situations. However, relying on an SVM classifier necessitates labeled data for training, which can be a significant limitation. Collecting and labeling large datasets is time-consuming and expensive, potentially hindering the system’s scalability and adaptability to new environments. Additionally, integrating various IoT sensors and technologies requires meticulous calibration and synchronization to ensure consistent and reliable performance, which could complicate deployment and maintenance.
This study contributes to developing an effective approach for detecting drunk driving behavior using a semi-supervised anomaly detection strategy. Utilizing unimodal sensors such as gas sensors, temperature sensors, and digital cameras, distinct aspects of the driving environment and behavior are captured. Gas sensors measure alcohol concentration levels, while temperature sensors monitor environmental conditions. In-vehicle digital cameras capture visual information to assess driver behavior, focusing on detecting changes in pupil ratio. These sensors can be employed in combination to gather data for analysis. The proposed approach integrates several techniques such as Independent Component Analysis (ICA), Kantorovitch distance (KD)-based detector, and double Exponentially Weighted Moving Average (DEWMA) chart to detect abnormal driving events. The use of ICA allows for the handling of non-Gaussian and multivariate data, while KD is used to measure the dissimilarity between normal and abnormal events based on ICA features. The DEWMA is applied to KD charting statistics to detect changes in data. Unlike supervised methods, this approach does not need labeled data for training. It establishes detection thresholds and reference models solely based on anomaly-free data. Additionally, it employs Kernel Density Estimation to compute detection thresholds in a nonparametric way, without assuming any specific data distribution, enhancing its flexibility and sensitivity. The proposed approach is evaluated using publicly available data from gas, temperature, and digital cameras, and the results show that it outperforms other statistical methods in detecting drunk driving behavior. The study also employed XGBoost to compute the SHAP (SHapley Additive exPlanations) values to identify the most important variables for detecting drunk driving behavior.
The paper is organized into three main sections. Section 2 introduces ICA, PCA, and the proposed DEWMA-KD detector. Section 3 presents an overview of the proposed ICA-based drunk driving detection strategy. In Section 4, the effectiveness of the proposed method is evaluated using publicly available data. Finally, Section 5 provides a conclusion summarizing the study’s main findings.
2 Methodology
This section introduces the used dataset, ICA, PCA, KD, the proposed DEWMA-KD detector, and the ICA-based drunk driving detection strategy (Figure 4).
2.1 Data description and analysis
Using three sensors for driver data acquisition is an important aspect of the proposed approach. The MQ-3 gas sensor detects the presence of ethanol, a key indicator of drunk driving behavior. This sensor is quick and easy to integrate into the system. The MLX90621 temperature sensor measures the driver’s facial thermal changes, which can provide further evidence of impairment. Finally, the Raspberry Pi Camera is used to compute the pupil ratio, another useful indicator of drunk driving behavior. These sensors provide a rich set of multivariate data that includes the alcohol concentration and temperature in the car environment, facial temperature, and pupil ratio. The dataset used in the study includes 390 instances, with 217 instances representing normal driving behaviors and 173 instances representing drunk driving behaviors with varying alcohol concentrations (Rosero-Montalvo et al., 2020). Five variables were recorded to differentiate between the two behaviors: alcohol concentration in the car’s environment measured in mL/L, car environment temperature measured in degrees Celsius, minimum face temperature in degrees Celsius, maximum face temperature in degrees Celsius, and pupil ratio. Alcohol can affect a person’s mental and intellectual abilities at different levels of BAC (Rosero-Montalvo et al., 2020). This study utilizes only one dataset for assessment due to the absence of publicly available alternatives after thorough exploration. The Violin plots in Figure 1 demonstrate that the distributions of these five attributes deviate from Gaussian. These plots provide enhanced insights, combining the advantages of boxplots and histograms. As shown in Figure 1, the distributions of these five attributes indicate that they do not follow a Gaussian distribution.
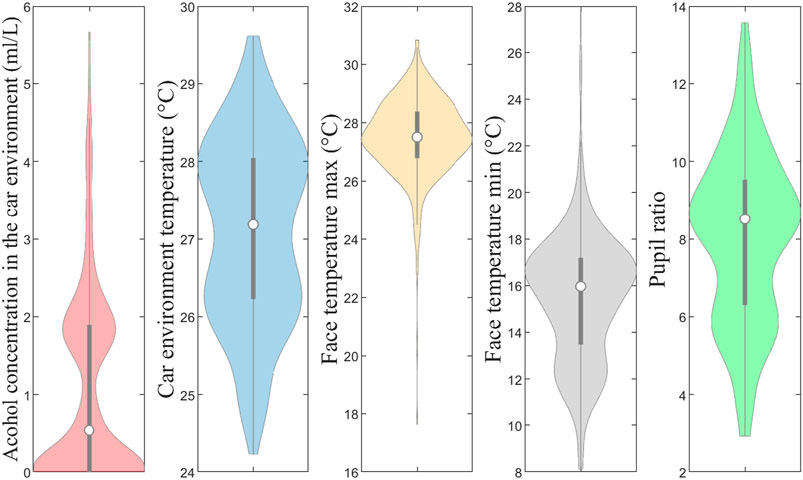
Figure 1. Data distribution using Violin plots.
The RadViz visualization in Figure 2 illustrates the factors influencing drivers’ alcohol status. In this representation, the label ‘1’ designates normal data (sober), while label ‘2’ indicates anomalies (intoxicated data). RadViz, initially developed for DNA sequence classification (Hoffman et al., 1999; 1997), projects observations onto a unit circle, connecting each point to anchor points representing variables. The connections are established using virtual springs, and observation positions are influenced by spring strengths, resulting in equilibrium positions where forces balance (Harrou et al., 2021). Notably, observations at the circle’s center exhibit roughly equal dimensional values, while those with larger coordinate values are closer to corresponding anchors. This method provides an intuitive means to explore and interpret relationships within multi-dimensional datasets in a reduced 2D space. Examining Figure 2, it becomes apparent that the normal status is notably reflected by face temperature and car environment temperature. Conversely, intoxicated status is distinctly represented by alcohol concentration and temperature in the car environment. This visual representation enhances our understanding of the key variables affecting drivers’ alcohol status and facilitates the interpretation of complex relationships within the dataset.
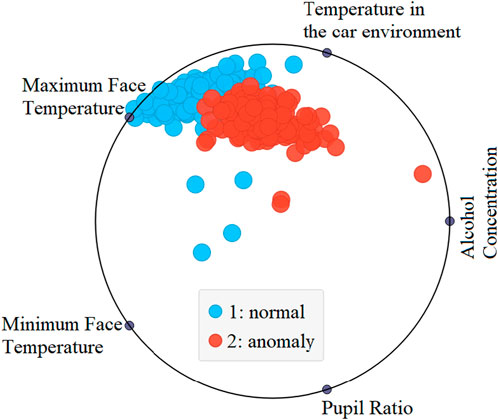
Figure 2. RadViz visualization depicting the indicators reflecting alcohol status.
Identifying important variables contributing to driver drunk detection is crucial to getting more insight into the data. This knowledge not only facilitates a deeper understanding of the relationship between inputs and outputs but also contributes to model simplification and performance enhancement. A crucial aspect of this identification process is the exclusion of non-informative and redundant variables, thereby streamlining the predictive model and reducing unnecessary complexity. In this study, we employed two prominent machine learning algorithms, namely, Random Forest (RF) and CatBoost, to identify important features within our dataset (Rogers and Gunn, 2005; Grömping, 2009). Utilizing multiple methods allows for a more comprehensive and robust understanding of feature importance. This, in turn, enables more informed decisions regarding including or excluding specific features in the model-building process. Random Forest and CatBoost are widely acknowledged for their effectiveness in handling diverse datasets and providing reliable insights into feature importance. Random Forest constructs an ensemble of decision trees, and the importance of each feature is gauged based on its contribution to the overall performance (Rogers and Gunn, 2005). CatBoost, on the other hand, specialized in handling categorical variables and employing gradient boosting, provides insights into feature importance (Dorogush et al., 2018; Prokhorenkova et al., 2018; Al-Sarem et al., 2021). Note that Catboost has demonstrated strong performance in handling both categorical and numerical data in different applications Al-Sarem et al. (2021); Fan et al. (2024), thanks to its robust handling of overfitting and efficient high-dimensional data processing. The combination of CatBoost and Random Forest ensures a thorough and robust evaluation, identifying key variables crucial for accurate driver drunk detection.
Figures 3A, B visually represents the outcomes of feature selection based on both Random Forest and CatBoost methods. Notably, the analysis indicates that Alcohol Concentration emerges as the most influential variable, signifying its critical role in determining the outcome. Following is the Pupil Ratio, exerting a relatively moderate impact on the predictive model. The significance of Alcohol Concentration and Pupil Ratio in Driver Drunk Detection can be attributed to their unique roles in reflecting physiological and behavioral changes associated with intoxication. The concentration of alcohol in the car environment serves as a direct physiological measure of the driver’s potential intoxication. Elevated alcohol levels can impair cognitive functions, reaction time, and decision-making abilities, making it a crucial variable for detecting drunk driving behavior. Alcohol concentration is a fundamental factor in determining whether a driver is within legal limits. Exceeding these limits not only poses a safety risk but also carries legal consequences. Its prominence in feature importance highlights its direct connection to the core objective of drunk driving detection.
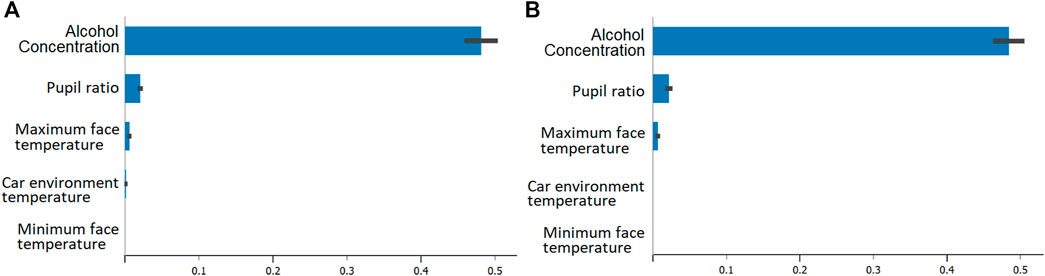
Figure 3. Identifying important variables contributing to driver drunk detection using (A) Random Forest and (B) CatBoost.
The Pupil Ratio is a behavioral indicator that provides insights into the driver’s neurological state. Changes in pupil size can be indicative of altered cognitive processes and attention levels, making it a valuable feature for detecting impairment. The pupil ratio offers a non-intrusive and continuous measure of a driver’s cognitive state, making it practical for real-time monitoring without causing discomfort or distraction. This makes it an attractive feature for inclusion in detection systems. The study in (Kvamme et al., 2019) showed the presence of a positive correlation between pupil dilation and intoxication. Additionally, we observe that the maximum facial temperature has a relatively minor impact on detecting potential drunk driving behavior. This may be due to a potential correlation between increased blood flow from alcohol consumption and a slight rise in facial temperature (Hermosilla et al., 2018). The analysis indicates that in-vehicle environment temperature and temperature face minimum do not significantly contribute to the detection of drunk driving. This finding aligns with the results reported in (Rosero-Montalvo et al., 2020).
In summary, the importance of Alcohol Concentration and Pupil Ratio for Driver Drunk Detection lies in their direct relevance to physiological and behavioral changes associated with intoxication. These variables offer a focused and targeted approach to detecting impaired driving behavior, whereas the other temperature-related variables may lack the specificity needed for accurate and reliable detection. The feature importance analysis guides the prioritization of variables that align closely with the desired outcome of detecting drunk driving.
2.2 Principal Component Analysis
Principal Component Analysis (PCA) stands out as a powerful technique widely employed in anomaly detection across various domains, including industrial processes, engineering systems, and data-driven applications (Harrou et al., 2013). This statistical method aims to extract essential information from complex datasets by transforming the original variables into a novel set of uncorrelated variables referred to as principal components. In the context of anomaly detection, PCA plays a crucial role in identifying abnormal patterns or deviations from normal behaviour.
The fundamental idea behind PCA for anomaly detection involves capturing the maximum variance in the data through linear combinations of the original variables. The first few principal components typically account for the majority of the variance, allowing for a dimensionality reduction while retaining the essential information. Anomalies can then be detected by monitoring deviations from the expected patterns in the reduced-dimensional space.
PCA reduces the dimensionality of data while retaining most of its variation by transforming the data from a higher-dimensional space to a lower-dimensional subspace while preserving as much variance as possible (Harrou et al., 2020). Given a dataset
whereT = [t1, t2…td] and V = [v1, v2…vd] are score and loading vectors associated with the covariance of Xsc which is represented by Eq. 2:
where Λ = diag (λ1, λ2, … λd) is a diagonal matrix containing eigenvalues of Σ arranged in a descending order. It may be noted that the eigenvalues correspond to PCs in which the larger eigenvalues contain useful information while the smaller values correspond to unwanted component. The PCA-based anomaly detection involves two steps: offline training of the model using anomaly-free data (Algorithm 1) and online monitoring of new data (Algorithm 2).
Following PCA modeling, the Cumulative Percentage Variance (CPV) method (Diana and Tommasi, 2002) is utilized to select a subset of PCs that capture significant data variance. The PCA model is then expressed as the sum of an approximated matrix,
Anomaly detection relies on assessing the vital information in matrices
The SPE statistic captures the variations within the remaining set of m − p PCs as provided by Eq. 5:
For anomaly detection, exceeding predefined thresholds for both T2 and SPE indicates the presence of a anomaly Joe Qin (2003).
Algorithm 1.PCA Offline-Monitoring.
1: Normalize original data and compute covariance matrix.
2: Perform Singular Value Decomposition (SVD) on the covariance matrix to generate eigenvalues and eigenvectors.
3: Choose the optimal principal components (PCs) based on the Cumulative Percentage Variance (CPV) scheme.
4: Generate the score and loading matrices.
5: Generate the thresholds Th1 and Th2 for the two statistical indicators.
Algorithm 2.PCA Online-Monitoring.
1: Normalize a new data sample Xnew.
2: Compute the statistical indicators T2 and Q as follows:
3:
4:
5: Declare an anomaly if T2 ≥ Th1 or Q ≥ Th2
PCA offers several advantages for anomaly detection, including its ability to highlight the most significant variations in the data and provide a simplified representation for easier interpretation. However, it is essential to consider the assumptions underlying PCA, such as linearity and normality, and adapt the method accordingly to the specific characteristics of the data and the anomaly patterns.
2.3 Independent component analysis
ICA is a technique used to separate a multivariate signal into independent components by assuming that the observed signal is a linear combination of hidden independent sources and finding a linear transformation that maximizes the statistical independence of the resulting components. For a dataset
where A is a mixing matrix, S is a matrix of independent components (ICs), k represents the number of ICs, and F is the residual matrix. The goal of ICA is to compute a separating matrix W that estimates ICs S from mixed data X using Eq. 7:
To estimate the mixing matrix A and separating matrix W, ICA algorithms typically aim to maximize the statistical independence of the estimated ICs, such as maximizing their non-Gaussianity or minimizing their mutual information. The procedure involves centering and whitening the observed data, followed by iterative optimization to adjust W. Techniques such as FastICA maximize non-Gaussianity using measures like kurtosis or negentropy, while methods like Infomax minimize mutual information. Once optimization converges, the separating matrix W is obtained, and the mixing matrix A is computed as its inverse (Stone, 2004).
Once ICs are computed, the crucial step is selecting optimal ICs. Ordering ICs by Euclidean norm and choosing dominant ones using Cumulative Percentage Variance (CPV) determines optimal ICs (Lee et al., 2006). CPV is given by Eq. 8:
The ICA model, expressed as X = AdSd + Am−dSm−d + E, involves systematic, excluded, and residual spaces. Anomaly detection indicators (
where fnew d, fnew m−d are computed for new data using Wd, Wm−d obtained from matrix W, and Xnew = Q−1BdWdXnew(i).
The offline monitoring of the ICA strategy is summarized in Algorithm 3.
Algorithm 3.Offline Monitoring of ICA Strategy.
1: Normalize the original data to have a mean of zero.
2: Perform the whitening transformation: Z = QX = QAS = BS, where Q is a diagonal matrix and B is the eigenvector matrix calculated from the covariance of X.
3: Select p ICs to be estimated and set the counter k = 1.
4: Set the initial value of B = Im×m.
5: while k ≤ l do
6: Let
7: Perform deflationary orthogonalization:
8: if bk is converged to last iteration value then
9: Output bk
10: end if
11: k ← k + 1
12: end while
13: Retain optimum ICs using the CPV approach
14: Compute the following statistical indicators:
15: I2d = XTWkTWkX
16: I2e = XTWm − kTWm−kX
17: SPE = e. eT, where Wk represents retained ICs, Wm−k represents ignored ICs and
18: Compute thresholds Tha, Thb, and Thc using Kernel Density Estimation (KDE) approach.
The online monitoring of the ICA strategy is given in Algorithm 4.
Algorithm 4.Online Monitoring of ICA Strategy.
1: Normalize new data Xnew to have a mean of zero.
2: Compute the statistical indicators for Xnew
3: if I2d ≥ Tha or I2e ≥ Thb or SPE ≥ Thc then, declare an abnormality
4: end if
Table 1 presents a concise overview of the characteristics of ICA and PCA models.
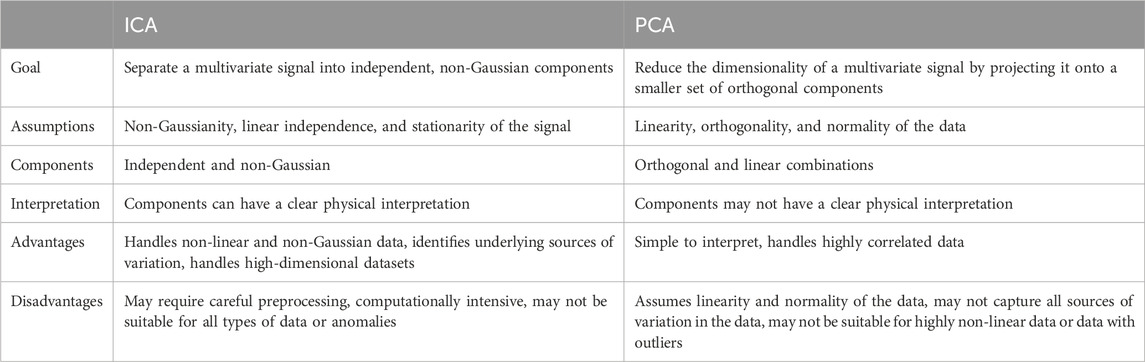
Table 1. Comparison of ICA and PCA.
2.4 Kantorovich distance
The Kantorovich distance is a metric that measures the distance between two probability distributions by considering the transportation cost required to move mass from one distribution to the other. It is a more general distance measure than the commonly used Euclidean distance or cosine similarity (Kammammettu and Li, 2019). The Kantorovich distance considers the cost of transforming one distribution into the other, where the cost is determined by the transportation cost required to move mass from one distribution to the other. The transportation cost is based on a cost function that assigns a cost to moving a unit of mass from one point in the distribution to another. The optimal transport plan is the one that minimizes the total transportation cost required to transform one distribution into the other.
Kantorovich can be used as an anomaly indicator by computing the distance between a normal and test distribution and comparing it to a threshold. For a probability distribution function C and D defined on a common space Ω, the p-Wasserstein distance is defined by Eq. 12 (Kammammettu and Li, 2019):
where Π(C, D) denotes the set of all joint distributions γ(x, y) whose marginals are C and D respectively. The distance is defined as the minimum cost required to transport the probability mass from one distribution to another using an optimal transport plan. The transportation cost is determined by a cost function, c (x, y), which assigns a cost to move a unit of mass from point x in C to point y in D. For the special case when p = 1, the p-Wasserstein distance reduces to the Earth Mover’s Distance (EMD), also known as the Kantorovich-Rubinstein distance, which is defined by Eq. 14:
The EMD measures the minimum amount of “work” needed to transform one distribution into the other, where the “work” is defined as the amount of mass moved multiplied by the distance it is moved.
The 2-Wasserstein distance has a closed-form expression for Gaussian distributions, making it computationally efficient. The formula for 2-Wasserstein distance is defined by Eq. 14:
where μC and μD are the means, and ΣC and ΣD are the covariance matrices of the distributions C and D, respectively. The 2-Wasserstein distance can also be used as an anomaly indicator by comparing it to a decision threshold. To compute the 2-Wasserstein distance between two-time series, one approach is to first compute the empirical cumulative distribution function (ECDF) for each time series and then apply the 2-Wasserstein distance to the resulting distributions. Another approach is to use a histogram-based method, where the time series are discretized into a finite number of bins, and the 2-Wasserstein distance is computed between the resulting histograms. The segmentation technique is utilized between the two distributions which enables to capture sensitive details in the data (Kini and Madakyaru, 2022). This feature enables the KD metric to enhance the detection of small magnitude anomalies. In this study, we will calculate the KD statistic between normal and abnormal data residuals. The decision threshold for the KD metric is determined using the KDE method. The KD threshold is established by computing the (1 − α)th quantile from the estimated distribution of residuals, where α denotes the probability of a false alarm.
2.5 Double EWMA scheme
The DEWMA chart is a statistical process control tool used to monitor the process mean and detect small shifts in data. The DEWMA statistic, wt, at time t is defined in Eq. 15 as (Zhang and Chen, 2005):
where, St represents the EWMA statistic at time t, and ν is the smoothing parameter that controls the weight assigned to the current observation and the previous statistic, with 0 ≤ ν ≤ 1. A smaller ν places more emphasis on the historical statistics, making the DEWMA more resistant to short-term fluctuations but slower to detect recent changes. Conversely, a larger ν gives more weight to recent observations, making the DEWMA more sensitive to short-term changes (Harrou et al., 2022). In quality control, a smaller ν value allows smaller shifts to be detected more quickly (Lucas and Saccucci, 1990; Montgomery, 2019). Therefore, ν should be adjusted to an appropriate value based on the specific characteristics of the monitored process. Typically, ν is set between 0.2 and 0.3 (Hunter, 1986). The performance of DEWMA with different smoothing parameters performs similarly to that of DEWMA with equal parameters, as shown in previous studies (Zhang and Chen, 2005; Taghezouit et al., 2021). Here, we used DEWMA with equal parameters.
Here, the KDE method estimates the probability density function (PDF) of the DEWMA-KD values. The DEWMA-KD vector, denoted as D = d1, … , dn, is obtained from the residual of the chosen model, such as ICA or PCA. The KDE technique estimates the PDF by assigning a kernel (a smoothing function) to each data point and then summing up these kernels to create a continuous, smooth estimate of the underlying distribution. Mathematically, the KDE for DEWMA-KD values is expressed in Eq. 16 as (Taghezouit et al., 2020):
where di represents the ith observation in the DEWMA-KD vector. h s the smoothing bandwidth parameter, determining the kernel’s width and influencing the estimated PDF’s smoothness. K is the kernel function, describing the shape of the smoothing function. The KDE process involves placing a kernel around each data point di, adjusting for the bandwidth h, and summing up these contributions to form the estimated PDF
3 Proposed ICA-DEWMA-KD FD strategy
This section provides an overview of the proposed the ICA-DEWMA-KD based abnaormlity detection strategy. The proposed approach anomaly detection strategy is a semi-supervised technique used to detect drunk driving behavior. While the ICA multi-variate approach is used for model development, the KD and DEWMA are used as indicators for the identification of abnormality. This integration of KD with the DEWMA indicator ensures that sensitive details are captured which increases the probability of accurate abnormality detection. The general framework of this approach involves using zero mean normalized training data that only contains anomaly-free data to train the ICA model. After selecting few optimum ICs, the residuals are generated and the detection threshold of the DEWMA-KD chart is computed. The testing data is normalized to zero mean and then, the residuals are generated from reference ICA. Next, the evaluation metrics are computed to assess the performance of the proposed approach. The ICA model handles non-Gaussian and multivariate data and extracts features used to compute the Kantorovich distance-based detector (KD). The DEWMA chart is applied to the KD charting statistics to detect changes in data, and a nonparametric threshold using kernel density estimation is computed to improve the sensitivity of the approach. Figure 4 shows the block diagram representation of the proposed ICA-DEWMA-KD strategy.
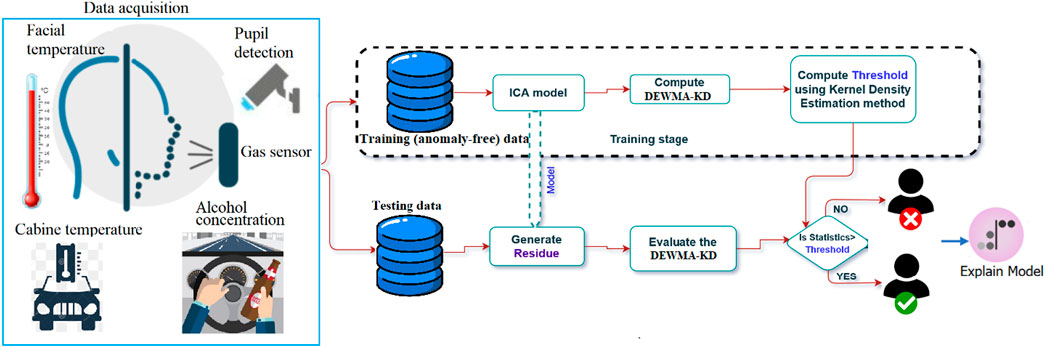
Figure 4. Flowchart of the proposed approach for detecting drunk driving based on sensor data.
The proposed approach was evaluated using several metrics, including True Positive Rate (TPR), False Positive Rate (FPR), precision, recall, and F1 score. These metrics are used to assess the effectiveness and accuracy of the approach in detecting abnormal events. TPR measures the proportion of actual abnormal events correctly detected as abnormal (Eq. 17), while FPR measures the proportion of normal events incorrectly classified as abnormal (Eq. 17). Precision measures the proportion of true abnormal events among all detected abnormal events (Eq. 18), while recall measures the proportion of true abnormal events that were detected among all actual abnormal events (Eq. 18). Finally, the F1 score is a weighted average of precision and recall (Eq. 19), which considers both false positives and false negatives.
where TP is true positive, FN is false negative, FP is false positive, and TN is true negative.
SHAP Analysis for Feature Importance: The study incorporates SHAP (SHapley Additive exPlanations) analysis as a powerful tool to interpret and quantify the impact of different features on the model outputs in the context of drunk driving detection. It is a powerful tool designed to reveal the impact of each feature on a model’s predictions (Shapley et al., 1953; Lundberg et al., 2020). SHAP values provide a comprehensive understanding of each feature’s contribution to the final decision, shedding light on the variables that significantly influence the detection outcomes. The SHAP analysis involves assigning each feature an importance value based on its contribution to the model’s output for a specific prediction. By considering all possible feature combinations, SHAP values employ cooperative game theory principles to fairly distribute the contribution of each feature to the overall prediction (Lundberg and Lee, 2017). By considering all possible feature combinations, SHAP values calculate the average contribution of each feature to the model’s predictions. This helps us gain insights into the inner workings of the model and why it makes certain predictions (Lundberg and Lee, 2017; Lundberg et al., 2018; Lundberg et al., 2020).
SHAP values measure the contribution of each feature to the difference between a model’s prediction and the average prediction for a specific instance. Positive values signify a positive impact, and negative values indicate a negative influence. One common method for calculating SHAP values is Shapley sampling, where feature permutations are sampled, and the model’s prediction is computed for each permutation. The difference between the prediction for the original instance and the average prediction across all permutations determines the SHAP value for that feature. The Shapley value for a feature i in cooperative game theory is determined by the formula 20 (Roth, 1988; Nohara et al., 2022):
In machine learning and SHAP values, N denotes the set of features, S is a feature subset, and v(S) is the model’s prediction considering features in subset S. For a specific prediction, the SHAP value for feature i is concisely expressed in Eq. 21:
where f(S) is the model’s prediction for features in subset S. This summation covers all possible combinations of feature subsets, and the terms inside represent the marginal contributions of feature i to the model’s prediction.
Generally speaking, by leveraging SHAP values, the study enhances the interpretability of the model, making it more transparent and accessible for stakeholders. This interpretability is crucial for building trust in the detection system, especially in applications where real-world consequences are at stake. Decision-makers can utilize these insights to prioritize interventions and strategies based on the features that exert the most influence on the detection outcomes.
4 Results and discussion
The proposed ICA-KD-DEWMA can handle non-Gaussian features in the data and will be used to detect drunk driving in car facilities. It is compared with 12 other approaches, including PCA and ICA schemes with and without DEWMA.
4.1 Detection results
This section discusses the effectiveness of the different PCA and ICA-based schemes for monitoring drunk driving. The ICA-KD-DEWMA approach is designed to handle non-Gaussian features and detect drunk driving in car facilities. It is compared with 12 approaches, including PCA and ICA schemes with and without DEWMA, to assess their effectiveness. This study used 216 observations to train the models and selected three optimum PCs and three optimum ICs (i.e., k = 3) using the CPV technique. A DEWMA smoothing parameter of 0.25 was chosen to detect small changes. Figures 5A–F displays the monitoring results of PCA-based anomaly detection methods. The red-shaded region represents samples from intoxicated drivers. Data points within this region that fall below the detection threshold represent missed detections, while those surpassing the threshold indicate samples from intoxicated drivers. The results show that PCA-based schemes such as PCA-T2, PCA-Q, and PCA-KD are not effective in identifying abnormal conditions, and their performance slightly improves with the introduction of the DEWMA approach (Figures 5A–C). However, DEWMA-T2, DEWMA-Q and DEWMA-KD approaches only show a slightly better detection rate than other schemes, as shown in Figures 5D–F.
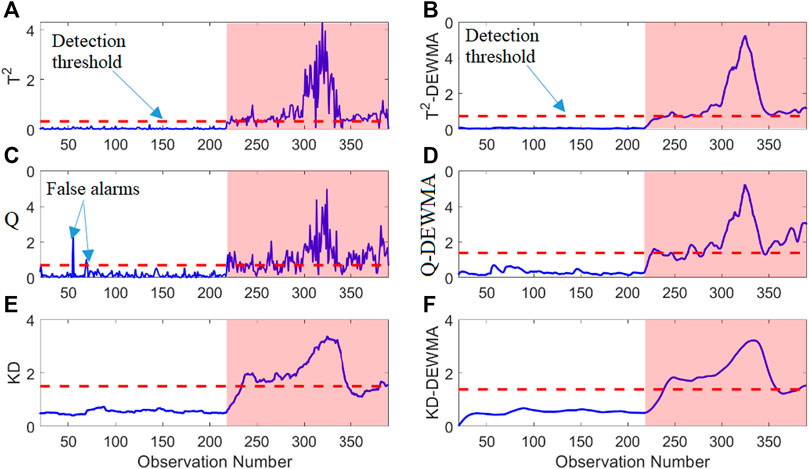
Figure 5. PCA-based scheme detection results: PCA-based (A) T2, (B) Q, (C) KD, (D) T2-DEWMA, (E) Q-DEWMA, and (F) KD-DEWMA.
Figure 6 illustrates the monitoring results of various ICA-based methods in detecting drunk driving behavior. Among the evaluated ICA-based schemes, including ICA-I2d, ICA-I2e, and ICA-SPE, there is a notable capability to recognize the drunk condition. However, the effectiveness of these methods is decreased by several instances of missed detections and false alarms, as depicted in Figures 6A–C. While ICA-KD performs relatively better, there are still instances of missed detections (Figure 6D). The limitations observed in conventional ICA methods underscore the need for refinement and enhancement to achieve a more precise and reliable detection system. Figures 6E–G further reveals that the integration of DEWMA into ICA-based schemes, specifically ICA-I2d-DEWMA, ICA-I2e-DEWA, and ICA-Q-DEWMA, leads to improved abnormality detection compared to conventional approaches. The incorporation of DEWMA contributes to a more nuanced assessment, reducing false alarms and enhancing the overall accuracy of drunk driving detection. However, these enhanced methods still exhibit some missed detections. The proposed ICA-KD-DEWMA scheme emerges as a standout performer, identifying drunk driving conditions without any missed detections and demonstrating superiority over other approaches (Figure 6H). This superior performance positions the ICA-KD-DEWMA scheme as a promising solution for achieving highly accurate and reliable drunk driving detection.
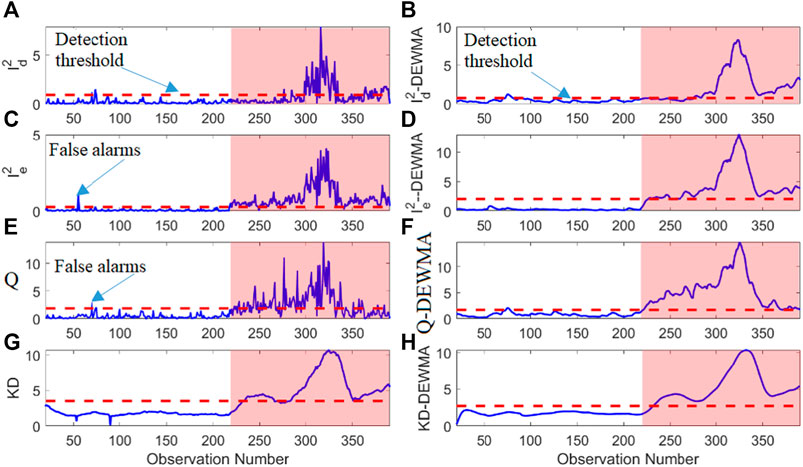
Figure 6. ICA-based scheme detection results: ICA-based (A) I2d, (B) I2e, (C) Q, (D) KD, (E) I2d-DEWMA, (F) I2e-DEWMA, (G) Q-DEWMA, and (H) KD-DEWMA.
Table 2 compares the considered PCA and ICA-based detection approaches based on the five evaluation metrics. The results show that using DEWMA with regular statistical indicators improves the monitoring results, with the proposed ICA-DEWMA-KD approach outperforming other schemes regarding the evaluation metrics. Specifically, the ICA-DEWMA-KD scheme achieved the highest TPR of 96.25%, which means it correctly identified the presence of alcohol in the car environment 96.25% of the time. It also had a precision of 1.0, meaning that all of the samples it identified as positive were indeed positive. The F1-score of 0.98 indicates that the model has a good balance between precision and recall. It can be observed that the other conventional schemes have a lesser F1-score value in comparison with proposed ICA-DEWMA-KD approach. Compared to other models, the ICA-DEWMA-KD had the lowest FPR of 0%, meaning it did not falsely identify any samples as positive. This is an important feature for an alcohol detection system, as false positives could cause inconvenience and even legal problems for drivers who are not actually under the influence of alcohol.
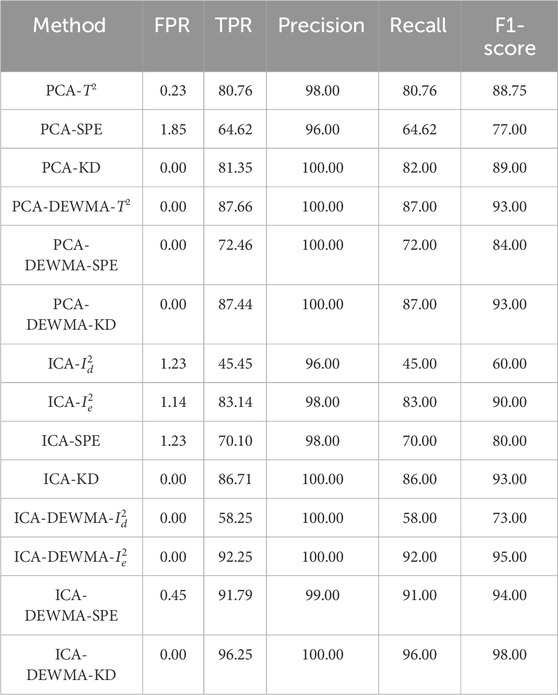
Table 2. Monitoring results of the fourteen investigated data-driven techniques based on test data.
The barplot in Figure 7 provides a visual comparison of F1-score values, aiding in assessing the fourteen monitoring schemes. A higher F1-score signifies a better balance between precision and recall, reflecting a more effective approach. Notably, the ICA-DEWMA-KD method stands out, surpassing all others in drunk driving detection with the highest F1-score of 98. Overall, the results suggest that the proposed approach is a promising method for detecting drunk driving in car facilities.
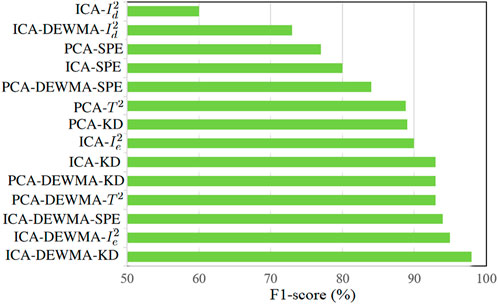
Figure 7. Bar plot illustrating the F1-score values obtained using the 14 considered methods.
The study strategically employed advanced machine learning techniques, namely, Random Forest and XGBoost, to compute SHAP (SHapley Additive exPlanations) values (Nohara et al., 2022) and identify the essential variables for detecting drunk driving. The utilization of Random Forest and XGBoost, two advanced machine learning algorithms renowned for their robustness and predictive power, underscores the sophistication of the approach adopted in this study. SHAP values are instrumental in showing the intricate relationships between input variables and model predictions, offering invaluable insights into the inner workings of complex machine learning models. By leveraging these techniques, the study aimed to delve deeper into the underlying mechanisms driving drunk driving detection, shedding light on the relative importance of each input variable in influencing the model’s decisions. The resulting SHAP analysis, depicted visually in Figures 8A, B, provides a comprehensive overview of the contribution of each variable to the overall predictive performance of the model, thus enhancing our understanding of the factors driving drunk driving behavior detection.
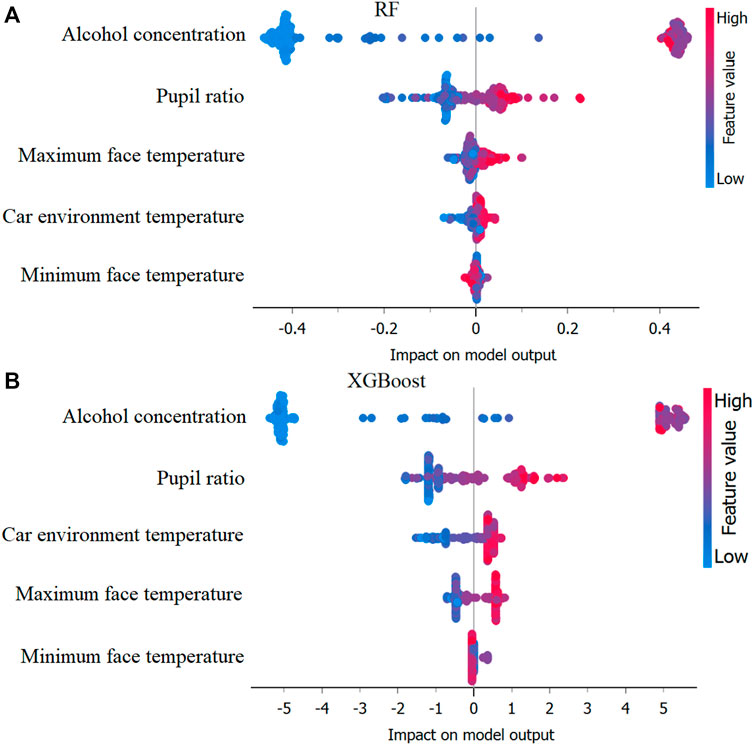
Figure 8. Identification of important variables using mean SHAP values based on (A) Random Forest and (B) XGBoost models.
Figures 8A, B visually illustrates that alcohol concentration, measured by the MQ-3 sensor, had the highest mean SHAP value and significantly impacted the model’s output. This observation highlights the pivotal role of alcohol concentration as a key determinant in identifying instances of driver intoxication. The MQ-3 sensor’s ability to directly measure real-time ethanol levels provides a crucial advantage, allowing for precise and immediate detection of the driver’s level of impairment. By accurately capturing variations in alcohol concentration, the MQ-3 sensor serves as a cornerstone of the detection system, offering unparalleled insight into the driver’s condition. This capability is particularly noteworthy in drunk driving detection, where timely and accurate assessment of the driver’s impairment is paramount for road safety. Thus, the prominent impact of alcohol concentration, as elucidated by the SHAP analysis, highlights the indispensable role of the MQ-3 sensor in effectively identifying and addressing instances of intoxicated driving.
Indeed, the SHAP analysis not only emphasized the significance of alcohol concentration but also shed light on the relative importance of other variables within the model. For instance, the face-pupil ratio emerged as another influential factor, albeit to a lesser extent than alcohol concentration. This finding underscores the multifaceted nature of driver monitoring, where factors related to physiological responses and environmental conditions play a role in determining the driver’s state. Additionally, analyzing temperature-related parameters, such as temperature minimum, car environment temperature, and face temperature maximum, provided valuable insights into their contribution to the model’s decision-making process. While these variables exhibited lower SHAP values, indicating a relatively minor impact on the model’s predictions, their inclusion in the analysis remains crucial for comprehensive drunk driving detection. By considering a diverse range of variables, including both physiological and environmental factors, the model can better capture the complexities inherent in assessing driver impairment. Thus, the SHAP analysis not only highlights the key determinants of drunk driving detection but also underscores the importance of a multidimensional approach in ensuring the accuracy and effectiveness of driver monitoring systems.
Developing an effective drunk driving detection system involves balancing minimizing missed detections and reducing false alarms. This is crucial not only for the driver’s safety but also for other road users. The consequences of potential drunk driving not being identified and false alarms in a detection system have significant implications for both road users and vehicle occupants. The failure to detect actual cases of intoxicated driving can lead to accidents and potentially be a matter of life and death for those outside the car. On the other hand, false alarms, where alerts are triggered when the driver is in normal conditions, can be inconvenient for the driver within the vehicle. Striking the right balance between sensitivity and specificity in the detection system is critical. The system should be finely tuned to identify genuine instances of impairment to prevent potential accidents and ensure road users’ safety while avoiding unnecessary disruptions for law-abiding drivers. This underscores the importance of precision and accuracy in designing detection systems to effectively address the grave consequences associated with both missed detections and false alarms.
The proposed ICA-KD approach offers several significant contributions to drunk driving detection. Firstly, by integrating ICA and KD, the method demonstrates a novel approach to anomaly detection in driving behavior, offering potential improvements in accuracy and sensitivity compared to traditional methods. Essentially, ICA offers a valuable approach for process monitoring with multiple variables. It captures intricate relationships between variables, leading to more effective detection of process anomalies that might be missed by using separate individual monitoring schemes (Harrou et al., 2021). Furthermore, compared to traditional methods using separate control charts, multivariate monitoring with ICA significantly reduces false alarms, especially when dealing with many variables (Crosier, 1988; Montgomery, 2019).
It is important to note that the MQ-3 sensor offers alcohol detection capabilities, but relying solely on a single numerical threshold for its readings is suboptimal. These sensors exhibit variations in sensitivity due to manufacturing tolerances, environmental conditions like temperature and humidity, and sensor aging. Unlike BAC, they indirectly measure alcohol vapor, which might not perfectly correlate with impairment. Importantly, using a single static threshold can cause two main issues: misclassification and false positives. Impaired individuals might have readings below the threshold due to sensor variations, while readings exceeding the threshold might not always indicate impairment because of variations in sensor sensitivity. A static threshold cannot account for these inherent variations or environmental changes, potentially compromising the detection system’s accuracy.
Furthermore, integrating data from multiple variables enables a more comprehensive understanding of the driving environment and behavior. By incorporating inputs such as temperature, pupil dilation, and other relevant factors, the proposed method can capture nuanced patterns and variations that may not be evident when analyzing alcohol concentration alone. This approach enhances the robustness and accuracy of drunk driving detection, enabling more reliable identification of abnormal behavior.
Additionally, utilizing a semi-supervised approach enables the detection of drunk driving incidents without requiring labeled data during training, thus enhancing the method’s practical applicability in real-world scenarios. Moreover, semi-supervised learning can help alleviate issues related to class imbalance, as the model only needs normal data (sober) during training.
Furthermore, the inclusion of KDE for computing detection thresholds adds flexibility to the approach by accommodating nonparametric data distributions. This potentially improves its adaptability across diverse driving environments. Specifically, traditional monitoring charts rely on parametric thresholds derived from assumptions about data normality (i.e., following a Gaussian distribution). However, these assumptions can lead to false alarms and missed detections when the underlying data distribution deviates from Gaussian or is unknown. Nonparametric approaches, such as computing the detection threshold using KDE, offer a solution to this challenge. By directly estimating the data’s probability density function from the observed samples, KDE allows for the calculation of robust thresholds to variations in data distribution. This flexibility enables the detection of anomalies even in cases where the data does not conform to standard assumptions about normality.
While the ICA-KD approach offers several advantages for detecting drunk driving behavior, it has limitations. One limitation of ICA is its sensitivity to noise and outliers in the data. Since ICA aims to separate signals into statistically independent components, noisy or outlier data points can significantly impact the accuracy of the extracted components, potentially leading to erroneous results. Moreover, KD is sensitive to the choice of distance metric used to calculate dissimilarities between distributions, and selecting an appropriate metric can be challenging, particularly in multidimensional spaces. Furthermore, while the proposed approach shows promise, its effectiveness may vary depending on factors such as the quality and quantity of sensor data, environmental conditions, and individual driving behaviors. Additionally, the reliance on publicly available datasets may limit the diversity and representativeness of the data used for evaluation, potentially affecting the generalizability of the findings. Finally, the reliance on publicly available datasets presents both advantages and limitations in evaluating the proposed approach. While these datasets offer accessibility and convenience, they may not fully capture the diverse range of real-world driving scenarios and behaviors. As a result, the dataset’s representativeness becomes a critical consideration when assessing the generalizability of the detection system. One limitation is the potential lack of diversity in the driving behaviors and environmental conditions represented in publicly available datasets. These datasets may not encompass the full spectrum of driving scenarios, such as urban driving, highway conditions, or rural routes, which can exhibit distinct characteristics and challenges. Additionally, the demographic diversity of drivers, including age, gender, and driving experience, may not be adequately represented in publicly available datasets, potentially limiting the applicability of the detection system across different populations. Furthermore, the quality and consistency of data annotation in publicly available datasets may vary, leading to uncertainties or inconsistencies in the ground truth labels used for evaluation. Issues such as labeling errors, ambiguities, or subjective interpretations could introduce biases or inaccuracies in the evaluation process, affecting the reliability of performance metrics and conclusions drawn from the study. To address these limitations, future research could explore strategies for augmenting publicly available datasets with additional data sources to enhance diversity and representativeness.
Overall, several challenges in designing an accurate drunk driving detection system can be highlighted. At first, the potential confounding effect of light conditions on pupil diameter measurements in facial analysis studies is a recognized challenge. While a direct solution involves integrating a light sensor for accurate adjustments, several alternative approaches can be considered. Feature extraction, such as calculating the rate of change in pupil diameter over time, offers a dynamic metric less sensitive to light variations. Normalization of pupil diameter measurements based on ambient light levels, achieved by calculating the ratio of pupil diameter to ambient light intensity, provides a means to account for changes in light conditions. Incorporating light conditions as a covariate in the analysis explicitly addresses their potential influence on the dependent variable. For studies where pupil diameter is a primary metric, calibration against known light levels establishes a correlation, enabling adjustments to mitigate variations induced by changes in lighting. While the direct use of a light sensor remains a reliable option, these alternative strategies offer flexibility in addressing light condition confounding, particularly when additional sensors are impractical or a more indirect approach is preferred.
Ensuring the reliability of sensors in the driver-drunk detection system is paramount. The challenge of potential sensor malfunctions, inaccuracies, or performance variations over time necessitates strategic solutions. Regular calibration protocols (1) are indispensable to maintain accuracy, align sensors with predefined standards, and minimize inaccuracies. Additionally, the implementation of sensor redundancy (2) serves as a safeguard, enabling cross-verification of data from multiple sensors to enhance overall system reliability. These measures collectively contribute to a dependable detection system that can effectively address the challenges associated with sensor reliability in real-world scenarios.
5 Conclusion
Drunk driving has been found to be a major problem that has cost many human lives in the form of accidents, and hence, the drunk driving condition has to be carefully identified. This work presented an effective approach for detecting drunk driving using the ICA-DEWMA-KD technique. The proposed abnormality detection scheme utilized the ICA multi-variate technique as a modeling framework and KD as well as DEWMA charts as anomaly indicators. The proposed ICA-KD-DEWMA scheme outperformed other approaches, including the conventional PCA-based and other ICA-based methods, in identifying drunk driving with no missed detections. The integration with the DEWMA technique improved the detection rate for both PCA and ICA-based schemes, demonstrating its effectiveness in smoothing transitions in sensor data. The proposed method was also found to have a superior F1-score value as compared to conventional methods. Additionally, SHAP values were used to explore the impact of variables on drunk driving detection, highlighting the importance of alcohol concentration in the car environment, car environment temperature, face temperature minimum, maximum, and pupil ratio. Although the primary objective is to detect drunk driving behavior, the proposed method can indirectly aid in creating labeled datasets for training supervised methods by identifying potential instances of drunk driving behavior. Overall, the proposed approach provided an accurate and efficient solution for detecting drunk driving, which has significant potential for improving road safety.
In future work, addressing the study’s limitations will involve testing using authentic driving data obtained from actual vehicles and diverse driving scenarios. While the current evaluation relied on publicly available data, the aim is to assess the proposed approach in real-world complex environments. Testing the method in actual driving conditions, including factors like traffic congestion, adverse weather conditions, and unforeseen events, will provide a more comprehensive evaluation of its effectiveness. This will allow for validation of the approach across a wider range of scenarios and ensure its applicability in diverse driving conditions. Future work could also investigate integrating other types of sensors, such as microphones or inertial sensing modules, to improve the detection system’s accuracy. Investigating the real-time implementation of the proposed method in diverse driving scenarios and environmental conditions would provide valuable insights into its practical applicability. Additionally, research efforts could delve into the development of a user-friendly interface for this detection system, facilitating seamless integration into vehicles and promoting widespread adoption. Another direction of improvement is to investigate dynamic thresholding techniques that can adapt to changes in driving conditions or patterns over time. Factors such as weather conditions, traffic density, time of day, and special events significantly impact driving behavior. By continuously monitoring these variables and employing machine learning algorithms, dynamic thresholding aims to adjust anomaly detection thresholds accordingly. This approach enhances adaptability, reduces false positives and negatives, and improves the overall robustness of the system.
Another important direction of improvement involves exploring more sophisticated fusion techniques to enhance the effectiveness of the drunk driving detection system. While the study primarily focused on stacking data from various sensors, the potential benefits of incorporating advanced fusion methods are acknowledged. Specifically, methods such as feature-level collaboration and decision-level fusion offer promising avenues for improving the robustness and accuracy of the model by leveraging complementary information from different sources. The investigation of these advanced fusion techniques in future iterations of the research is planned to evaluate their effectiveness in further optimizing the detection system. Integration of these techniques aims to enhance the reliability and performance of the model, thereby contributing to more effective drunk driving prevention strategies. Another approach worth exploring involves utilizing distribution-based monitoring techniques, such as Kullback-Leibler Divergence (KLD) (Harrou et al., 2016), Hellinger distance (Harrou et al., 2017), and Continuous Ranked Probability Score (CRPS) (Harrou et al., 2018), for detecting drunk driving based on multivariate data.
Data availability statement
The dataset used is publicly available at https://ieee-dataport.org/open-access/alcohol-detection-drivers-sensors-and-computer-vision.
Author contributions
FH: Conceptualization, Formal Analysis, Methodology, Software, Validation, Visualization, Writing–original draft, Writing–review and editing. KK: Formal Analysis, Investigation, Methodology, Software, Validation, Writing–original draft, Writing–review and editing. MM: Conceptualization, Formal Analysis, Investigation, Methodology, Validation, Writing–original draft, Writing–review and editing. YS: Investigation, Resources, Supervision, Validation, Visualization, Writing–original draft, Writing–review and editing.
Funding
The author(s) declare that no financial support was received for the research, authorship, and/or publication of this article.
Conflict of interest
The authors declare that the research was conducted in the absence of any commercial or financial relationships that could be construed as a potential conflict of interest.
Publisher’s note
All claims expressed in this article are solely those of the authors and do not necessarily represent those of their affiliated organizations, or those of the publisher, the editors and the reviewers. Any product that may be evaluated in this article, or claim that may be made by its manufacturer, is not guaranteed or endorsed by the publisher.
References
Al-Sarem, M., Saeed, F., Boulila, W., Emara, A. H., Al-Mohaimeed, M., and Errais, M. (2021). “Feature selection and classification using catboost method for improving the performance of predicting Parkinson’s disease,” in Advances on smart and soft computing: proceedings of ICACIn 2020 (Springer), 189–199.
Chang, R. C.-H., Chang, R. C.-H., Chang, R. C.-H., Wang, C.-Y., Wang, C.-Y., Li, H.-H., et al. (2021). Drunk driving detection using two-stage deep neural network. IEEE Access 9, 116564–116571. doi:10.1109/access.2021.3106170
Chatterjee, I., Chatterjee, I., Isha, I., Sharma, A., and Sharma, A. (2018). Driving fitness detection: a holistic approach for prevention of drowsy and drunk driving using computer vision techniques. SouthEast Eur. Des. Automation, Comput. Eng. Comput. Netw. Soc. Media Conf. doi:10.23919/seeda-cecnsm.2018.8544944
Chen, H., Chen, H., Chen, L., and Chen, L. (2017). Support vector machine classification of drunk driving behaviour. Int. J. Environ. Res. Public Health 14, 108. doi:10.3390/ijerph14010108
Chen, Y.-S., and Chia-Tseng, C. (2012). Facial image recognition system for a driver of a vehicle. U. S. Pat. 8 (300), 891.
Crosier, R. B. (1988). Multivariate generalizations of cumulative sum quality-control schemes. Technometrics 30, 291–303. doi:10.2307/1270083
Dairi, A., Harrou, F., and Sun, Y. (2022). Efficient driver drunk detection by sensors: a manifold learning-based anomaly detector. IEEE Access 10, 119001–119012. doi:10.1109/access.2022.3221145
Diana, G., and Tommasi, C. (2002). Cross-validation methods in principal component analysis: a comparison. Stat. Methods Appl. 11, 71–82. doi:10.1007/s102600200026
Doniec, R. J., Piaseczna, N., Duraj, K., Sieciński, S., Irshad, M. T., Karpiel, I., et al. (2024). The detection of alcohol intoxication using electrooculography signals from smart glasses and machine learning techniques. Syst. Soft Comput. 6, 200078. doi:10.1016/j.sasc.2024.200078
Dorogush, A. V., Ershov, V., and Gulin, A. (2018). Catboost: gradient boosting with categorical features support. arXiv preprint arXiv:1810.11363.
Doudou, M., Bouabdallah, A., and Berge-Cherfaoui, V. (2020). Driver drowsiness measurement technologies: current research, market solutions, and challenges. Int. J. Intelligent Transp. Syst. Res. 18, 297–319. doi:10.1007/s13177-019-00199-w
Fan, Z., Gou, J., and Weng, S. (2024). A feature importance-based multi-layer catboost for student performance prediction. IEEE Trans. Knowl. Data Eng., 1–13. doi:10.1109/tkde.2024.3393472
Gasparesc, G. (2018). Driver alcohol detection system based on virtual instrumentation. IFAC-PapersOnLine 51, 502–507. doi:10.1016/j.ifacol.2018.07.110
Greer, R., Gopalkrishnan, A., Mandadi, S., Gunaratne, P., Trivedi, M. M., and Marcotte, T. D. (2023). Vision-based analysis of driver activity and driving performance under the influence of alcohol. doi:10.48550/arXiv.2309.08021
Grömping, U. (2009). Variable importance assessment in regression: linear regression versus random forest. Am. Statistician 63, 308–319. doi:10.1198/tast.2009.08199
Guettas, A., Ayad, S., and Kazar, O. (2019). “Driver state monitoring system: a review,” in Proceedings of the 4th international conference on big data and internet of things, 1–7.
Haghpanahan, H., Lewsey, J., Mackay, D. F., McIntosh, E., Pell, J., Jones, A., et al. (2019). An evaluation of the effects of lowering blood alcohol concentration limits for drivers on the rates of road traffic accidents and alcohol consumption: a natural experiment. Lancet 393, 321–329. doi:10.1016/s0140-6736(18)32850-2
Harrou, F., Madakyaru, M., and Sun, Y. (2017). Improved nonlinear fault detection strategy based on the hellinger distance metric: plug flow reactor monitoring. Energy Build. 143, 149–161. doi:10.1016/j.enbuild.2017.03.033
Harrou, F., Nounou, M. N., Nounou, H. N., and Madakyaru, M. (2013). Statistical fault detection using pca-based glr hypothesis testing. J. loss Prev. process industries 26, 129–139. doi:10.1016/j.jlp.2012.10.003
Harrou, F., Sun, Y., Hering, A. S., Madakyaru, M., and Dairi, A. (2021). Linear latent variable regression (lvr)-based process monitoring. Elsevier BV.
Harrou, F., Sun, Y., Hering, A. S., Madakyaru, M., et al. (2020). Statistical process monitoring using advanced data-driven and deep learning approaches: theory and practical applications. Elsevier.
Harrou, F., Sun, Y., and Madakyaru, M. (2016). Kullback-leibler distance-based enhanced detection of incipient anomalies. J. Loss Prev. Process Industries 44, 73–87. doi:10.1016/j.jlp.2016.08.020
Harrou, F., Sun, Y., Madakyaru, M., and Bouyedou, B. (2018). An improved multivariate chart using partial least squares with continuous ranked probability score. IEEE Sensors J. 18, 6715–6726. doi:10.1109/jsen.2018.2850804
Harrou, F., Taghezouit, B., Khadraoui, S., Dairi, A., Sun, Y., and Hadj Arab, A. (2022). Ensemble learning techniques-based monitoring charts for fault detection in photovoltaic systems. Energies 15, 6716. doi:10.3390/en15186716
Hermosilla, G., Verdugo, J. L., Farias, G., Vera, E., Pizarro, F., and Machuca, M. (2018). Face recognition and drunk classification using infrared face images. J. Sensors 2018, 1–8. doi:10.1155/2018/5813514
Hoffman, P., Grinstein, G., Marx, K., Grosse, I., and Stanley, E. (1997). “Dna visual and analytic data mining,” in Proceedings. Visualization’97 (Cat. No. 97CB36155), Phoenix, AZ, USA, 24-24 October 1997 (IEEE), 437–441.
Hoffman, P., Grinstein, G., and Pinkney, D. (1999). “Dimensional anchors: a graphic primitive for multidimensional multivariate information visualizations,” in Proceedings of the 1999 workshop on new paradigms in information visualization and manipulation in conjunction with the eighth ACM internation conference on Information and knowledge management, 9–16. doi:10.1145/331770.331775
Hs, D., and Hs, D. (2010). Assessing the feasibility of vehicle-based sensors to detect alcohol impairment.
Hunter, J. S. (1986). The exponentially weighted moving average. J. Qual. Technol. 18, 203–210. doi:10.1080/00224065.1986.11979014
Hyvarinen, A., and Oja, E. (2000). Independent component analysis: algorithms and applications. IEEE Trans. neural Netw. 13, 411–430. doi:10.1016/s0893-6080(00)00026-5
Jo, J., Jo, J., Lee, S. J., Jung, H. G., Park, K. R., and Kim, J. (2011). Vision-based method for detecting driver drowsiness and distraction in driver monitoring system. Opt. Eng. 50, 127202. doi:10.1117/1.3657506
Joe Qin, S. (2003). Statistical process monitoring: basics and beyond. J. Chemom. A J. Chemom. Soc. 17, 480–502. doi:10.1002/cem.800
Kammammettu, S., and Li, Z. (2019). Change point and fault detection using kantorovich distance. J. Process Control 80, 41–59. doi:10.1016/j.jprocont.2019.05.012
Karimisetty, S., Arjuna Rao, A., Dinesh Kumar, Y., and Kumudini Devi, P. (2022). “Smart monitoring of drunk driver using iot and machine learning based anomaly detection,” in Proceedings of international conference on recent trends in computing: icrtc 2021 (Springer), 139–145.
Kashevnik, A., Kashevnik, A., Lashkov, I., Lashkov, I., Levashova, T., Ponomarev, A., et al. (2020). Cloud-based driver monitoring system using a smartphone. IEEE Sensors J. 20, 6701–6715. doi:10.1109/jsen.2020.2975382
Khardi, S., and Vallet, M. (1995). Drowsiness of the driver: eeg (electroencephalogram) and vehicle parameters interaction. Proc. Int. Tech. Conf. Enhanc. Saf. Veh. Natl. Highw. Traffic Saf. Adm. 1995, 443–461.
Kini, K. R., and Madakyaru, M. (2022). Kantorovich distance based fault detection scheme: an application to wastewater treatment plant. IFAC-PapersOnLine 55, 345–350. doi:10.1016/j.ifacol.2022.04.057
Koch, K., Maritsch, M., Van Weenen, E., Feuerriegel, S., Pfäffli, M., Fleisch, E., et al. (2023). “Leveraging driver vehicle and environment interaction: machine learning using driver monitoring cameras to detect drunk driving,” in Proceedings of the 2023 CHI conference on human factors in computing systems, 1–32.
Kvamme, T. L., Pedersen, M. U., Overgaard, M., Rømer Thomsen, K., and Voon, V. (2019). Pupillary reactivity to alcohol cues as a predictive biomarker of alcohol relapse following treatment in a pilot study. Psychopharmacology 236, 1233–1243. doi:10.1007/s00213-018-5131-1
Lee, J.-M., Qin, S. J., and Lee, I.-B. (2006). Fault detection and diagnosis based on modified independent component analysis. AIChE J. 52, 3501–3514. doi:10.1002/aic.10978
Lee, J. M., Yoo, C., and Lee, I. B. (2004). Statistical process monitoring with independent component analysis. J. Process Control 14, 467–485. doi:10.1016/j.jprocont.2003.09.004
Li, Z., Li, Z., Li, Z., Wang, H., Wang, H., Zhang, Y.-W., et al. (2020). Random forest–based feature selection and detection method for drunk driving recognition. Int. J. Distributed Sens. Netw. 16, 155014772090523. doi:10.1177/1550147720905234
Li, Z., Li, Z., Li, Z., Xu, J., Jin, X., Zhao, X., et al. (2015). Drunk driving detection based on classification of multivariate time series. J. Saf. Res. 54, 61.e29–64. doi:10.1016/j.jsr.2015.06.007
Ljungblad, J., Hök, B., Allalou, A., and Pettersson, H. (2017). Passive in-vehicle driver breath alcohol detection using advanced sensor signal acquisition and fusion. Traffic Inj. Prev. 18, S31–S36. doi:10.1080/15389588.2017.1312688
Lucas, J. M., and Saccucci, M. S. (1990). Exponentially weighted moving average control schemes: properties and enhancements. Technometrics 32, 1–12. doi:10.2307/1269835
Lundberg, S. M., Erion, G., Chen, H., DeGrave, A., Prutkin, J. M., Nair, B., et al. (2020). From local explanations to global understanding with explainable ai for trees. Nat. Mach. Intell. 2, 56–67. doi:10.1038/s42256-019-0138-9
Lundberg, S. M., Erion, G. G., and Lee, S.-I. (2018). Consistent individualized feature attribution for tree ensembles. arXiv Prepr. arXiv:1802.03888.
Lundberg, S. M., and Lee, S.-I. (2017). A unified approach to interpreting model predictions. Adv. neural Inf. Process. Syst. 30. doi:10.48550/arXiv.1705.07874
Mazzae, E. N., Satterfield, K., Baldwin, G. H. S., Skuce, I. A., and Andrella, A. T. (2023). Driver eye glance behavior and performance with camera-based visibility systems versus mirrors. Traffic Inj. Prev. 24, S94–S99. doi:10.1080/15389588.2022.2155049
Mühlbacher-Karrer, S., Mühlbacher-Karrer, S., Mosa, A. H., Mosa, A. H., Faller, L.-M., Faller, L.-M., et al. (2017). A driver state detection system—combining a capacitive hand detection sensor with physiological sensors. IEEE Trans. Instrum. Meas. 66, 624–636. doi:10.1109/tim.2016.2640458
National Highway Traffic Safety Administration (2022). Traffic safety facts 2020. Rep. Dot. HS 813, 294.
Nohara, Y., Matsumoto, K., Soejima, H., and Nakashima, N. (2022). Explanation of machine learning models using shapley additive explanation and application for real data in hospital. Comput. Methods Programs Biomed. 214, 106584. doi:10.1016/j.cmpb.2021.106584
Paredes-Doig, A. L., del Rosario Sun-Kou, M., and Comina, G. (2014). “Alcohols detection based on pd-doped sno 2 sensors,” in 2014 IEEE 9th IberoAmerican Congress on Sensors, Bogota, Colombia, 15-18 October 2014 (IEEE), 1–3.
Prokhorenkova, L., Gusev, G., Vorobev, A., Dorogush, A. V., and Gulin, A. (2018). Catboost: unbiased boosting with categorical features. Adv. neural Inf. Process. Syst. 31. doi:10.48550/arXiv.1706.09516
Ramakrishna, K., and Madakyaru, M. (2021). Performance evaluation of independent component analysis-based fault detection using measurements corrupted with noise. J. Control, Automation Electr. Syst. 32, 642–655. doi:10.1007/s40313-021-00702-3
Rogers, J., and Gunn, S. (2005). “Identifying feature relevance using a random forest,” in International statistical and optimization perspectives workshop” subspace, latent structure and feature selection (Springer), 173–184.
Rosero-Montalvo, P. D., López-Batista, V. F., and Peluffo-Ordóñez, D. H. (2020). “Hybrid embedded-systems-based approach to in-driver drunk status detection using image processing and sensor networks,” in IEEE Sensors Journal, 13 November 2020.
Roth, A. E. (1988). The Shapley value: essays in honor of Lloyd S. Shapley. Cambridge University Press.
Sakairi, M. (2011). Water-cluster-detecting breath sensor and applications in cars for detecting drunk or drowsy driving. IEEE sensors J. 12, 1078–1083. doi:10.1109/jsen.2011.2163816
Sandeep, K., Ravikumar, P., and Ranjith, S. (2017). “Novel drunken driving detection and prevention models using internet of things,” in 2017 International Conference on Recent Trends in Electrical, Electronics and Computing Technologies (ICRTEECT), Warangal, India, 30-31 July 2017 (IEEE), 145–149.
Shaily, S., Shaily, S., Krishnan, S., Krishnan, S., Natarajan, S., Natarajan, S., et al. (2021). Smart driver monitoring system. Multimedia Tools Appl. doi:10.1007/s11042-021-10877-1
Taghezouit, B., Harrou, F., Sun, Y., Arab, A. H., and Larbes, C. (2020). Multivariate statistical monitoring of photovoltaic plant operation. Energy Convers. Manag. 205, 112317. doi:10.1016/j.enconman.2019.112317
Taghezouit, B., Harrou, F., Sun, Y., Arab, A. H., and Larbes, C. (2021). A simple and effective detection strategy using double exponential scheme for photovoltaic systems monitoring. Sol. Energy 214, 337–354. doi:10.1016/j.solener.2020.10.086
Varghese, R. R., Jacob, P. M., Jacob, J., Babu, M. N., Ravikanth, R., and George, S. M. (2021). “An integrated framework for driver drowsiness detection and alcohol intoxication using machine learning,” in 2021 International Conference on Data Analytics for Business and Industry (ICDABI), Sakheer, Bahrain, 25-26 October 2021 (IEEE), 531–536.
Wang, J., Chai, W., Venkatachalapathy, A., Tan, K. L., Haghighat, A., Velipasalar, S., et al. (2021). A survey on driver behavior analysis from in-vehicle cameras. IEEE Trans. Intelligent Transp. Syst. 23, 10186–10209. doi:10.1109/tits.2021.3126231
World Health Organization (2015). Global status report on road safety 2015 (accessed: March 01, 2022).
World Health Organization (WHO) (2021). Road traffic injuries, 2021, doi:10.1787/9ad1618a-enAccessed: 01.March.2022).
Wu, C. K., Tsang, K. F., Chi, H. R., and Hung, F. H. (2016). A precise drunk driving detection using weighted kernel based on electrocardiogram. Sensors 16, 659. doi:10.3390/s16050659
Keywords: driver drunk detection, anomaly detection, monitoring charts, semi-supervised, variable importance
Citation: Harrou F, Kini KR, Madakyaru M and Sun Y (2024) A semi-supervised anomaly detection strategy for drunk driving detection: a feasibility study. Front. Sens. 5:1375034. doi: 10.3389/fsens.2024.1375034
Received: 23 January 2024; Accepted: 21 May 2024;
Published: 20 June 2024.
Edited by:
Yuanfang Chen, Hangzhou Dianzi University, ChinaReviewed by:
Xing Fang, Guilin University of Electronic Technology, ChinaKamen Ivanov, Bulgarian Academy of Sciences (BAS), Bulgaria
Copyright © 2024 Harrou, Kini, Madakyaru and Sun. This is an open-access article distributed under the terms of the Creative Commons Attribution License (CC BY). The use, distribution or reproduction in other forums is permitted, provided the original author(s) and the copyright owner(s) are credited and that the original publication in this journal is cited, in accordance with accepted academic practice. No use, distribution or reproduction is permitted which does not comply with these terms.
*Correspondence: Fouzi Harrou, Zm91emkuaGFycm91QGthdXN0LmVkdS5zYQ==; Muddu Madakyaru, bXVkZHUubUBtYW5pcGFsLmVkdQ==