 Dermot Diamond
 Rick A. Relyea
 Margaret McCaul
94% of researchers rate our articles as excellent or good
Learn more about the work of our research integrity team to safeguard the quality of each article we publish.
Find out more
PERSPECTIVE article
Front. Sens., 04 December 2023
Sec. Chemical Sensors
Volume 4 - 2023 | https://doi.org/10.3389/fsens.2023.1284043
This article is part of the Research TopicThought Leaders in Sensor Research: Volume 2View all 5 articles
Human activities are causing global change around the world including habitat destruction, invasive species in non-native ecosystems, overexploitation, pollution, and global climate change. While traditional monitoring has long been used to quantify and aid mitigation of global change, in-situ autonomous sensors are being increasingly used for environmental monitoring. Sensors and sensor platforms that can be deployed in developed and remote areas and allow high-frequency data collection, which is critical for parameters that exhibit important short-term dynamics on the scale of days, hours, or minutes. In this article, we discuss the benefits of in-situ autonomous sensors in aquatic ecosystems as well as the many challenges that we have experienced over many years of working with these technologies. These challenges include decisions on sensor locations, sensor types, analytical specification, sensor calibration, sensor drift, the role of environmental conditions, sensor fouling, service intervals, cost of ownership, and data QA/QC. These challenges result in important tradeoffs when making decisions regarding which sensors to deploy, particularly when a network of sensors is desired to cover a large area. We also review recent advances in designing and building chemical-sensor platforms that are allowing researchers to develop the next-generation of autonomous sensors and the power of integrating multiple sensors into a network that provides increased insight into the dynamics of water quality over space and time. In the coming years, there will be an exponential growth in data related to aquatic sensing, which will be an essential part of global efforts to monitor and mitigate global change and its adverse impacts on society.
The exponential growth of the human population has brought with it a considerable number of human impacts that are causing environmental changes on a global scale (Abbass et al., 2022; Dirzo et al., 2022). Collectively known as “global change,” these impacts can be broadly categorized under five categories: habitat destruction, invasive species non-native ecosystems, overexploitation, pollution, and global climate change (Figure 1) (Friedland and Relyea, 2018). Habitat destruction (including habitat loss, degradation, and fragmentation) is by far the biggest current threat to biodiversity since it removes suitable habitat for many species (Lind et al., 2022). The introduction of invasive species to regions where they have not existed for centuries or millennia—either due to intentional or accidental introductions—can also cause the decline or extinction of species, often because the native species have no evolutionary history and therefore no defenses against introduced predators, herbivores, or pathogens. Overexploitation can occur in several ways, including unsustainable fishing or hunting as well as the pet and plant trade when species are taken from nature (Brotherton et al., 2020). Pollutants include excess nutrients that are applied on the land and transported to the water, as well as thousands of human-made chemicals that are released into the environment (e.g., pesticides, petroleum products, microplastics) (Habibullah et al., 2022). Finally, in relation to aquatic ecosystems, global climate change has multiple negative consequences, such as warming of water bodies, altered precipitation patterns, increased storm intensities, increased flooding, increased drought, melting ice sheets, and higher sea levels, all of which impact aquatic life.
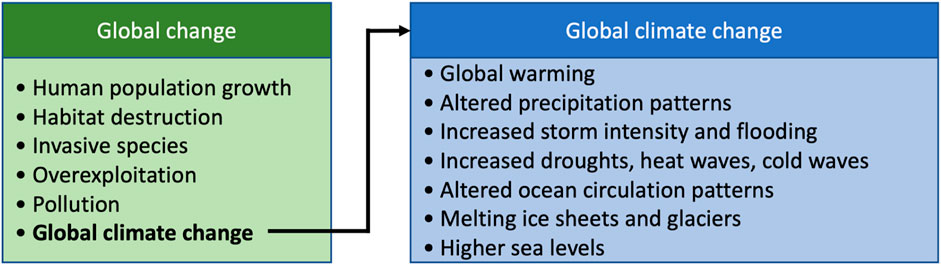
FIGURE 1. An overview of the concepts of global change and global climate change. Based on Friedland and Relyea (2023).
Collectively, these five broad types of global change are impacting physical, chemical, and biological processes in our world, and they often work in complex combinations. As a result, it can be difficult to understand the many ways in which global changes are affecting the planet at local, regional, and global scales. Given the immense scale and complexity of global change, there is an inherent challenge of quantifying the dynamics of chemical, physical, and biological conditions across the planet, so that we can understand current impacts of human activities and accurately predict future consequences. A rapidly growing approach to this problem is to deploy autonomous sensor networks. In this prospective article, our goal is to share our collective experiences with autonomous aquatic sensors in aquatic ecosystems by highlighting the importance of their role as spatial and temporal information providers and highlighting the many challenges that may not be immediately obvious to researchers who are considering sensors as part of their environmental monitoring programs.
In the broadest sense, sensors allow us to measure physical, chemical, and biological parameters of the environment to better monitor, understand, and mitigate global change. Deployable in-situ sensors gather data in real-time, offering a tremendous number of advantages over traditional monitoring in which we manually collect water samples every few weeks from a limited number of locations (Figure 2) (Donohoe et al., 2021; Arndt et al., 2022). For example, having sensors in multiple locations allows improved spatial coverage to detect localized changes in the environment that might be missed when monitoring a single location. In-situ sensors can also allow much more frequent sampling, which can be critically important when the parameters of interest exhibit dramatic fluctuations on the scale of days, hours, or even minutes. For instance, rain and snowmelt events cause large pulses in streams and rivers, causing rapid changes in flow, turbidity, pollutants, and nutrients; such fluctuations can be over in a matter of hours, even though their impacts on the ecosystem can be long lasting (McCaul et al., 2016). In lakes, Langmuir circulation, pollution inputs, and harmful algal blooms can vary on scales of hours or minutes. Traditional monitoring will fail to detect these critically important dynamics that impact water quality and biota. While we may commonly think of the deployments of individual sensors, we can also deploy multiple sensors on a single large sensor platform (more efficiently sharing power and data communication), and further integrate multiple sensor platforms into a large sensor network using Internet-of-Things technologies (Aguzzi et al., 2019).

FIGURE 2. (A) Autonomous phosphate analyser incorporating a microfluidic reagent-based yellow method; (B) Deployment location at the River Liffey (Palmerstown, Dublin) during a cold snap in which temperatures dropped to −5.5°C; (C) Data (636 measurements, grey squares) generated by the analyser over a period of 28 days (21 February 2018–20 March 2018). The data can be divided into three phases, (1) Phosphate levels gradually declining from ca. 15 μM to ca. 5 μM, water level fluctuations (blue line) due to upstream dam at Leixlip (2) Analyser not generating data points due to sampling tube freezing (1 March–4 March); (3) Rapid rise in water level from 4 March due to snow melt is clearly correlated with a synonymous increase in phosphate concentration [adapted with permission from Donohoe et al. (2019)].
In-situ sensing can also provide direct data inputs for predictive models and make data available to a wide variety of audiences. Predictive computer models are designed to understand and predict the dynamics of weather, water runoff, ocean and lake circulation patterns, and food webs (Borrelli et al., 2023). Having real-time data from sensors allows these models to rapidly calibrate to current conditions and then predict how the environment will change in the days, weeks, and months to follow, which can allow ecosystem managers to be rapidly informed and able to take mitigating actions. Real-time data can also be transmitted to data portals on web sites that the public can view, thereby increasing community interest and engagement by residents, researchers, government regulatory agencies, and non-governmental organizations who are interested in monitoring and mitigating global change (Hintz et al., 2020; Sendra et al., 2023). For example, in the Great Lakes of North America, there is an observation system of sensors that provides a wide range of weather and water quality data which is available online (https://glos.org/data/).
In addition, in-situ sensors, spectroscopic remote sensing using satellites, airplanes, boats and drones enable parameters such as temperature, color, turbidity, algal biomass, algal productivity, and the dynamics of harmful algal blooms to be tracked from local to global scales (Cook et al., 2023). Satellite remote sensing in particular has provided striking and irrefutable evidence of the impact of global change in sea-surface temperature and polar ice-loss over time (e.g.; see https://climate.nasa.gov/). Coupling data from remote spectroscopic and imaging sources with widely deployed in-situ sensors adds a powerful new capability, broadening the range of accessible parameters while also enabling mutual ground-truthing of data (Fekete et al., 2015; McCaul et al., 2016; Schierenbeck and Smith, 2017; Liu et al., 2022).
As we have just seen, sensors, sensor platforms, and sensor networks have the potential to provide tremendous amounts of spatiotemporal data. While the value offered by these sensors is substantial, so are the challenges associated with their use. Below, we identify eight major challenges that must be considered when deploying in-situ sensing platforms.
• Sensor location: the location of sensors can affect the value of their data. For example, placing a sensor in a river upstream of a pollution source is of little value unless combined with other sensors placed downstream of the source. Thus, it is important to have a clear sense of the research question of interest and how the measured parameters likely vary over space. This includes background knowledge of the expected levels of the analyte being measured at the location this will determine the sensor type, sensor analytical specification and calibration for the deployment site. In addition, less robust sensors require more frequent servicing and should therefore be placed at more accessible locations.
• Sensor type and analytical specification: different types of sensors can vary widely in robustness and analytical performance depending on the analyte being measured, the sample matrix and the expected concentration range. For instance, detecting pollutants at nM or pM concentrations will usually require much more complex instrumentation than mM or μM concentrations. Similarly, detecting an analyte in a relatively clean matrix is simpler than in the presence of multiple interferents in an extremely aggressive matrix. Therefore, the sensor configuration adopted depends on the analyte of interest, its concentration, the sample matrix and the location (ease of access, potential for storm damage etc.).
• Sensor calibration: calibration should be performed at regular intervals with calibration standards traceable to standard methods and/or national and international standards. Effective calibration begins by using the guidelines provided by the manufacturer, but in our experience, it is important to explore variations in calibration conditions, including the volume of water used to calibrate the sensors, the number of calibration points used (e.g., two versus three), and the range of parameter values that typically occur in the environment when the sensors are being deployed. By reducing the range of values to the relevant range, one can achieve improved calibration for the given water body. However, integrating calibration results in a more complex instrument, as fluidic handling technology (pumps, valves, interconnecting tubing, control electronics) must also be incorporated. Furthermore, for chemical sensors that are deployed with calibration reagents (e.g., nutrient sensors), the reagents must be stable for the duration of the service interval.
• Sensor drift: calibrated sensors can drift over time, which affects their accuracy. The amount of signal drift depends on the sensor type and deployment environment, and can be caused by changes in temperature, pH, pressure, fouling or other environmental factors, as well as degradation of sensing membranes and calibrants. Drift is much more problematic in chemical-sensing platforms and calibration is essential prior and during to the field deployment to ensure that sensor is functioning correctly, and the sensor readings are accurate and precise.
• Environmental conditions: environmental conditions such as rainfall, humidity, wind, water level, temperature, pressure, and salinity can affect the sensor performance. It is therefore good practice to interpret data from the deployed sensors in parallel with these parameters, so that impacts from changing environmental conditions can be identified.
• Sensor fouling: sensors can become fouled during deployments by organic or inorganic matter. The type and rate of fouling is determined by the sensors location and the material used in the sensor fabrication that is directly exposed to the sample medium. Fouling can result in blockage of sampling ports (for platforms that pull a sample into the device to perform the measurement) or contamination of the responsive sensor surface (if this is directly immersed in the sample medium), leading to total device failure or inaccurate data.
• Service Interval: longer service intervals1 are essential for large-scale deployments and for in-situ monitoring at remote or difficult to access locations. This has proven to be a key challenge for detecting aquatic chemical or biological analytes [unless by surrogate indicators, like colour to detect Harmful Algal Blooms (HAB)s] as the methods involved are more complex, often involving reagent-based chemistries.
• Cost of ownership: sensors for monitoring chemical and biological analytes have a very high unit purchase cost, and high maintenance costs due to short service intervals (i.e., days to a few weeks). As further detailed below, there is also a large effort required for reviewing the reliability of the data.
As we consider these challenges, Figure 3 weighs cost, difficulty, and scalability of in-situ autonomous sensing deployments in relation to sensor type and the environment in which the sensors will be deployed. For example, physical transducers are the most reliable, rugged, and low-cost sensors and air/gas sensing occurs in the least aggressive environment. Therefore, it is not surprising that there are numerous examples of large-scale deployments of physical transducers to monitor air quality, while there are no examples of similar biosensor deployments in the remote oceans. Chemical sensors lie between transducers and biosensors in terms of cost, complexity and ruggedness, and there is increasing evidence of their use in air-quality and freshwater monitoring, albeit at a lower-scale compared to transducers.
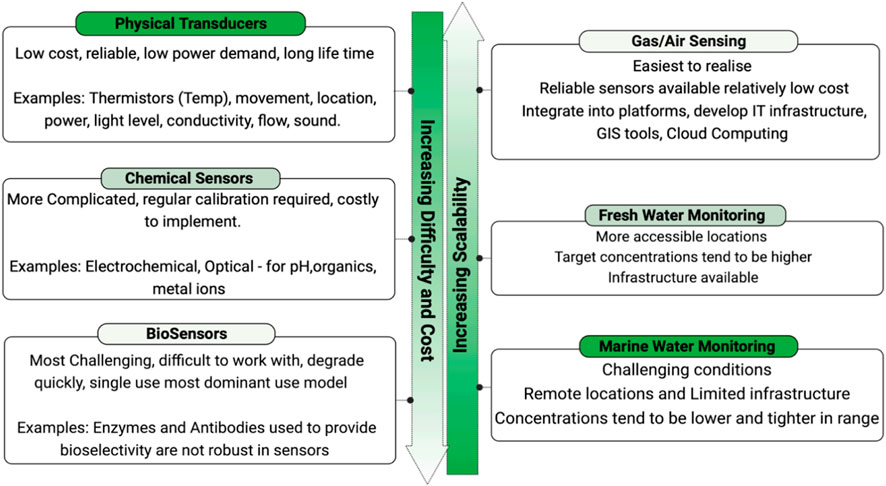
FIGURE 3. Sensor complexity and deployment environment hierarchies associated with long-term in-situ autonomous sensing.
The impact of implementing relatively reliable and mature chemical sensors compared to transducer-based sensors is strikingly illustrated in the data generated by the ARGO project (Figure 4), which uses global-scale sensor deployments to monitor changes in the ocean environment (see https://argo.ucsd.edu/). The Argo sensors are deployed on ‘floats’ that are robust platforms designed to support the sensor function over the deployment lifetime (see https://argo.ucsd.edu/how-do-floats-work/technological-innovations/ for more information). The basic floats track location, depth, temperature, and conductivity, and use satellite communication to transfer data and receive new mission instructions. The biogeochemical floats are fitted with more complex sensors for measuring oxygen, nitrate, chlorophyll a, suspended particles and downwelling irradiance (Bittig et al., 2019). Of the 3,858 total floats (May 2023) only 14% are biogeochemical floats (533 floats) and only 1% (38 floats) are equipped with the complete range of biogeochemical sensors (Sekhar et al., 2010).
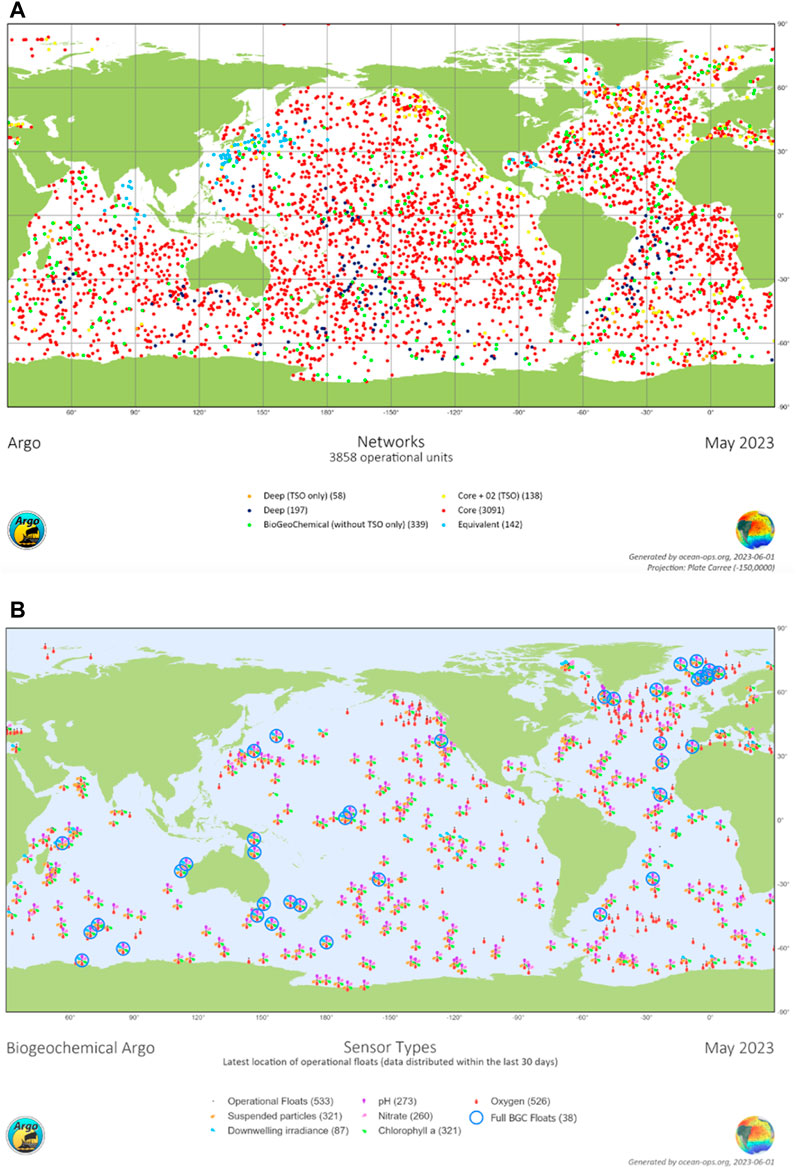
FIGURE 4. Comparison of Argo ‘Core’ Transducer-based Float deployments (A) and Biogeochemical Float deployments (B); data from https://biogeochemical-argo.org/float-map-network-status-maps.php. Deep: floats that can reach to 6,000 m depth (normal is 2,000 m); TSO: Temperature, Salinity and Oxygen; Core: Temperature, Salinity, Pressure; see https://argo.ucsd.edu/organization/ for more information.
Clearly there are significant challenges involved in upscaling even the most simple, reliable, and robust sensors for chemical and biological parameters in the ocean environment. An appreciation of the complexity associated converting the raw data from these ‘biogeochemical’ parameters can be gained from ARGO data processing publications, which emphasise in their preambles the need to compensate for local temperature, salinity and pressure fluctuations (Schmechtig and Thierry, 2016; Thierry et al., 2022). Moreover, none of these float deployments involve more complex sensors incorporating microfluidic methods to allow wet chemistry operations to be performed on the sample prior to measurement. Issues like in-situ calibration, complexity, ruggedness, stability, and cost remain significant barriers that must be addressed before an expansion in the range of biochemical parameters amenable to ocean deployment can be expected. Consequently, solutions to these issues are currently being addressed through less challenging freshwater/estuarine/wastewater deployments. Approaches that lead to advances in freshwater/estuarine/wastewater monitoring capabilities may be adopted for use in marine deployments, which are more challenging in terms of the expected analyte concentration ranges, hostility of the environment, high saline matrix, and accessibility. For example, more rugged microfluidics based on monolithic units can be validated in freshwater deployments prior to adoption in more challenging marine deployments. The same applies to testing stability of reagents for in-situ calibration and validation of analytical methods, power and communications management, and ruggedisation of device design and enclosure, in accordance with the axiom “if the approach does not work in freshwater deployments, it definitely will not work in the marine environment” (Ribotti et al., 2015).
In addition, in-situ deployments of sensors, sensor platforms, and sensor networks incur substantial additional costs related to maintenance. Automated sensors can collect large amounts of data, thereby reducing the need for researchers to collect these data in traditional ways, the reduced staff used for field sampling is offset by the additional staff needed to maintain the sensors. The skills needed to maintain sensor networks may also require hiring a different suite of staff to visit the sensor platforms on a regular schedule. Maintenance also requires replacing individual probes that attach to sensor systems, so there is often a substantial budget needed for regular probe replacement (Ribotti et al., 2015).
While some sensor platforms come with a few algorithms for sampling at different times or depths, we have found that having staff who can write custom algorithms for adaptive sampling can be a real asset to a research program. For example, temperate lakes in the summer experience temperature stratification, with a layer of warm, less dense water (the epilimnion) sitting on top of a layer of cold, more dense water (the hypolimnion). In between these layers is the thermocline, which is a relatively thin layer of water that experiences a rapid change in temperature in just a few meters of depth (Lofton et al., 2022). A great deal of lake chemistry and biology changes above, below, and within the thermocline (Lind et al., 2022) By using a vertical profiler that uses a computer-controlled winch to lower a suite of sensors from the lake surface to near the lake bottom, the depth of the thermocline can be determined (Li et al., 2022). On the subsequent lowering of the sensors, adaptive sampling algorithms can be used to increase the frequency of sampling while moving through the thermocline and decreased through the epilimnion and hypolimnion, enabling the sensors to optimally sample at the depths where the most interesting dynamics are occurring (Moriarty et al., 2021).
While automated sensors can collect orders of magnitude more environmental data, which is an enormous benefit, there is also the enormous challenge of storing and handling the data, which may be beyond the experience of many researchers. This requires access to an appropriate cyberinfrastructure to communicate the data to a central server with the storage capacity, which could occupy terabytes of storage space (Schmidt and Kerkez, 2023; Yousif et al., 2022; Won et al., 2023). As the data arrive in large quantities, most research groups may find it overwhelming to check the quality of the massive inputs of data generated without appropriate IT-literate staff. Thus, it helps to have personnel dedicated to quality assurance/quality control (QA/QC) efforts, including writing algorithms to automate the identification of data outliers and discontinuous data that can occur when an older probe with a drifting calibration is replaced with a new probe and there is a stepwise change in the recorded data.
An effective QA/QC effort can pay additional dividends. For longer-term (i.e.; multiannual) deployments, in addition to more regular routine checks, it is good practice to review data on a quarterly basis and to produce annual summaries of the collected data. In doing so, a research team can better assess how often different sensor probes need to be recalibrated or replaced. They can also predict the expected number of data points and identify if data is becoming lost in the data transmission steps, from the probe to the sensor platform to the central server. Identifying where these data losses occur can produce much more efficient data collection. Given that researchers commonly want to archive different versions of sensor data, it is often advisable for the QA/QC team to archive datasets in multiple forms: 1) raw data, 2) flagged data, 3) and corrected data. Depending on the requirements of funding agencies, the QA/QC team can also be given the responsibility of publicly archiving the data in its various forms. With the personnel required for sensor purchasing, deployment, maintenance, and data QA/QC, it can be easy to overlook the fact that a research team also needs personnel to analyze and interpret the massive amount of data that is being produced. This is a multi-investigator effort that can be aided by data visualization efforts. It is also aided by targeted research questions, to ensure a sensor network is not built to collect large amounts of environmental data without the guidance of appropriate hypotheses.
Finally, an important consideration when deploying sensors, sensor platforms, or sensor networks is the potential for their damage and destruction. We have witnessed all forms of damage over the years, including flash floods, ice flows, vandalism, and boaters running over large, well-lit sensor platforms that are anchored in lakes. One must plan for these eventualities and be sure to obtain insurance to cover the full cost of replacement. Given the high cost of sensors, you will be glad you did!
The high cost of in-situ chemical sensing remains a major barrier to creating scalable sensor deployments. This is true even for chemical analytes such as nutrients (e.g., nitrogen, phosphorus) for which methods are well known. Progress towards low-cost platforms (below €5,000) (Schierenbeck and Smith, 2017; McCaul et al., 2021; Droujko and Molnar, 2022; Li et al., 2022) has not been as rapid as might have been expected, despite considerable efforts over several decades to deliver autonomous sensors to monitor nitrogen and phosphorus. Nitrogen commonly occurs in the form of ammonia (NH4+), nitrate (NO3−), and nitrite (NO2−), collectively called total nitrogen (TN), while phosphorus is commonly measured as either total phosphorus (TP) or orthophosphate (nominally orthophosphate PO43−). TP typically employs a traditional laboratory approach that includes a digestion step followed by analytical measurement. In contrast, orthophosphate can be measured using colorimetric methods, in which reagent chemistries produce an analyte specific colour which can be measured using an appropriate light source and photodetector. For reagent-based chemical sensing, consumables such as reagents, calibration standards, and flush solutions remain a limiting factor as they require frequent routine maintenance due to reagent stability issues and/or reagent replenishment (Donohoe et al., 2021). Progress requires miniaturisation and simplification of the chemical methods and the internal fluidics.
Advances in microfluidics enables chemistry analyses that historically have been done in a laboratory to be performed at point-of-need, broadening the range of accessible analytes and providing early alerts of changes to water chemistry, thereby enabling rapid responses to pollution events in water bodies (Donohoe et al., 2019). In recent years, advanced fabrication techniques such as 3D printing (Weisgrab et al., 2019; Nadagouda et al., 2020) have driven down the unit cost of microfluidic chips through integration of sub-components that previously had to assembled to create the chip (Diamond et al., 2020). These advances now allow researchers to quickly develop custom fluidics (e.g., change optical pathlength, add reagent inputs, integrate more complex multistage chemistries), while simultaneously improving reliability and ruggedness (e.g., reduced failure due to leakage). This dramatically reduces component costs during prototype development and simplifies manufacturing during initial scale-up towards full commercialisation.
The example in Figure 5A, B, D estimates a 50-fold reduction in the cost of microfluidic chips designed to perform reagent chemistry analysis of phosphate due to these advances. As the chip is the most expensive component in the analyser, this results in a significant reduction of the overall unit cost, while also improving reliability by removing multiple potential leakage sources. Together, such improvements open the way to scaled up deployments of more units at more locations.
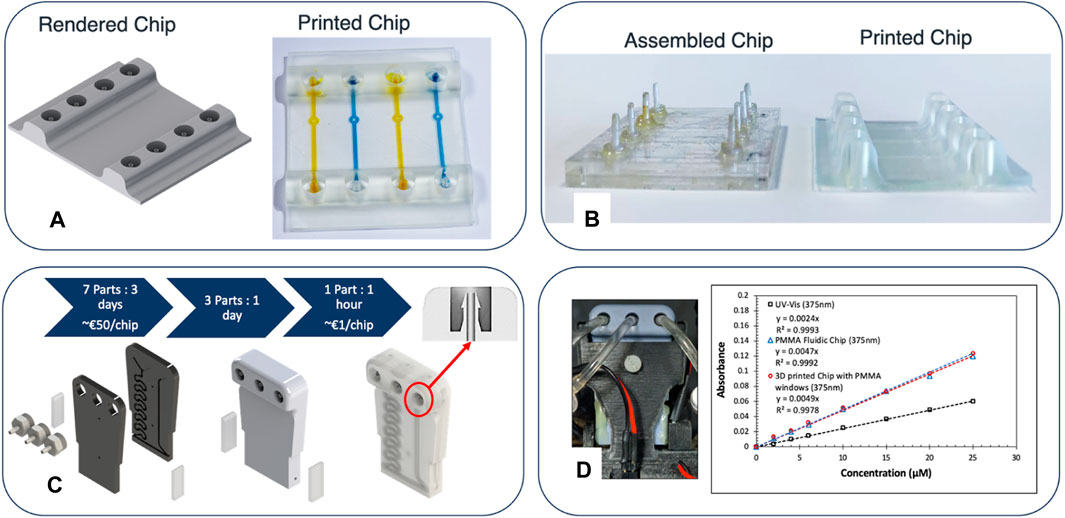
FIGURE 5. Impact of rapid prototyping based on 3D printing. (A) Left: Rendered image of a simple 4-channel fluidic chip with four fluid inputs and four outputs; Right: Actual chip printed as a single monolithic 3D unit; (B) Left: Four channel chip produced using conventional machining, as a 2-layer unit glued together, and 8 assembled fluidic connections; Right: Same design produced as a monolithic unit in a single 3D print run; (C) Evolution from an expensive multicomponent fluidic chip to a much lower cost monolithic version (€50/unit → €1/unit); (D) Left: Chip based on the design shown in (C) mounted in a prototype phosphate analyser; Right: Calibration plots produced by the prototype analyser comparing the monolithic chip to an equivalent 3-part chip with separate optical windows [Central design in (C)] showing equivalent linearity and sensitivity. A reference plot of data generated with the same reagent based yellow method in a bench UV-VIS is also included. The manual assembly required for multi-subcomponent chips is expensive and less reproducible and provides many more points at which leakage can occur compared to the monolithic chip. A major advance is the incorporation of barbed fluidic interconnectors conforming to standard dimensions into the chip design, as shown in (C) inset highlighted with red arrow [reproduced with permission from Diamond et al. (2020)].
Understanding the causes and increasingly detrimental effects of climate change on our world and informing strategies to mitigate and ultimately reverse these effects, is arguably the most important task confronting humanity. Undertaking this task will require a global effort, based on the best scientific evidence available. Using sensors, sensor platforms, and sensor networks to monitor key environmental parameters on a continuous basis from local to global scale lies at the heart of this effort. A key near-term goal must be to integrate data from multiple sources, including the integration of in-situ sensor data with spectroscopic remote sensing using satellites, planes, drones, boats. With respect to aquatic ecosystems, satellites provide global coverage of changes in the status of indicators such as sea-surface temperature, weather patterns, air pollution, the presence of large-scale algal blooms, with sophisticated modeling that predicts future trends. In-situ deployments of autonomous sensors provides access to complementary information, via sensors for a growing range of analytes available at more locations. Improvements in wireless communications technologies enable the data from these scaled-up deployments to be shared locally and globally, while integration with remote sensing data enables the in-situ sensors to operate in an adaptive manner, for example, by varying the sampling rate in accordance with predicted weather patterns that are known to affect the concentration of the targeted analyte. Likewise, in-situ sensing can be combined with depth sampling technologies that enable 3D distributions of analytes in water bodies to be constructed. This provides critically important insights, for example, with regard to large lakes in which temperate climates are stratified in the summer. In this way, we can improve the quality of the data being collected to answer a water-quality question and optimize the use of limited power and data communication.
The original contributions presented in the study are included in the article/Supplementary Material, further inquiries can be directed to the corresponding author.
DD: Writing–original draft, Writing–review and editing. RR: Writing–original draft, Writing–review and editing. MM: Writing–original draft, Writing–review and editing.
The author(s) declare financial support was received for the research, authorship, and/or publication of this article. We gratefully acknowledge funding from the following sources that has enabled the research that informed this article: The European Commission through the Holifab project, Grant number 760927 (H2020NMBP-PILOTS-2017), Science Foundation Ireland through the INSIGHT Centre, Grant Number SFI/12/RC/2289-P2, cofounded by the European Regional Development Fund, and The U.S. National Science Foundation (2130661).
We wish to acknowledge the many friends and colleagues who have worked along with us on our goal of providing ways to more clearly understand changes happening in our environment, and to make these known to the public at large and the political system so that policies to tackle global change are properly informed.
The authors declare that the research was conducted in the absence of any commercial or financial relationships that could be construed as a potential conflict of interest.
All claims expressed in this article are solely those of the authors and do not necessarily represent those of their affiliated organizations, or those of the publisher, the editors and the reviewers. Any product that may be evaluated in this article, or claim that may be made by its manufacturer, is not guaranteed or endorsed by the publisher.
1After extensive consultation with instrument manufacturers, Government agencies, relevant research centres, academics and end users, a service interval of 3 months was set as a key target specification for nutrient analysers listed in the Nutrient Challenge, organised by the US Alliance for Coastal Technologies (ACT), see https://www.act-us.info/nutrients-challenge/.
Abbass, K., Qasim, M. Z., Song, H., Murshed, M., Mahmood, H., and Younis, I. (2022). A review of the global climate change impacts, adaptation, and sustainable mitigation measures. Environ. Sci. Pollut. Res. 29, 42539–42559. doi:10.1007/s11356-022-19718-6
Aguzzi, J., Chatzievangelou, D., Marini, S., Fanelli, E., Danovaro, R., Flögel, S., et al. (2019). New high-tech flexible networks for the monitoring of deep-sea ecosystems. Environ. Sci. Technol. 53, 6616–6631. doi:10.1021/acs.est.9b00409
Arndt, J., Kirchner, J. S., Jewell, K. S., Schluesener, M. P., Wick, A., Ternes, T. A., et al. (2022). Making waves: time for chemical surface water quality monitoring to catch up with its technical potential. Water Res. 213, 118168. doi:10.1016/j.watres.2022.118168
Bittig, H. C., Maurer, T. L., Plant, J. N., Schmechtig, C., Wong, A. P. S., Claustre, H., et al. (2019). A BGC-argo guide: planning, deployment, data handling and usage. Front. Mar. Sci. 6, 502. doi:10.3389/fmars.2019.00502
Borrelli, J. J., Schuler, M. S., Hintz, W. D., Alldred, M., Mattes, B., Schermerhorn, C., et al. (2023). Putting a lake together: integrating synthetic data and field observations to build a better food web. Food Webs 37, e00315. doi:10.1016/j.fooweb.2023.e00315
Brotherton, S., Joyce, C. B., and Scharlemann, J. P. W. (2020). Global offtake of wild animals from wetlands: critical issues for fish and birds. Hydrobiologia 847, 1631–1649. doi:10.1007/s10750-020-04188-z
Cook, K. V., Beyer, J. E., Xiao, X., and Hambright, K. D. (2023). Ground-based remote sensing provides alternative to satellites for monitoring cyanobacteria in small lakes. Water Res. 242, 120076. doi:10.1016/j.watres.2023.120076
Diamond, D., Shinde, A., Donohoe, A., Barrett, R., McCaul, M., et al. (2020). Futuristic microfluidics incorporating bioinspired functionalities. Spain: National Centre for Sensor Research.
Dirzo, R., Ceballos, G., and Ehrlich, P. R. (2022). Circling the drain: the extinction crisis and the future of humanity. Phil. Trans. R. Soc. B 377, 20210378. doi:10.1098/rstb.2021.0378
Donohoe, A., Diamond, D., and McCaul, M. (2021). Emerging technologies for autonomous in-situ monitoring of water quality. Monit. Environ. Contam., 19–55. doi:10.1016/B978-0-444-64335-3.00001-3
Donohoe, A., Lacour, G., Harrison, D. J., Diamond, D., and McCaul, M. (2019). Fabrication of rugged and reliable fluidic chips for autonomous environmental analyzers using combined thermal and pressure bonding of polymethyl methacrylate layers. ACS Omega 4, 21131–21140. doi:10.1021/acsomega.9b01918
Droujko, J., and Molnar, P. (2022). Open-source, low-cost, in-situ turbidity sensor for river network monitoring. Sci. Rep. 12, 10341. doi:10.1038/s41598-022-14228-4
Fekete, B. M., Robarts, R. D., Kumagai, M., Nachtnebel, H.-P., Odada, E., and Zhulidov, A. V. (2015). Time for in situ renaissance. Science 349, 685–686. doi:10.1126/science.aac7358
Friedland, A., and Rick, R. (2023). Environmental science for the AP course author(s): andrew Friedland; Rick Relyea. Fourth Edition. Macmillan Learning.
Habibullah, M. S., Din, B. H., Tan, S.-H., and Zahid, H. (2022). Impact of climate change on biodiversity loss: global evidence. Environ. Sci. Pollut. Res. 29, 1073–1086. doi:10.1007/s11356-021-15702-8
Hintz, W. D., Schuler, M. S., Borrelli, J. J., Eichler, L. W., Stoler, A. B., Moriarty, V. W., et al. (2020). Concurrent improvement and deterioration of epilimnetic water quality in an oligotrophic lake over 37 years. Limnol. Oceanogr. 65, 927–938. doi:10.1002/lno.11359
Li, H., Fang, T., Tan, Q.-G., and Ma, J. (2022). Development of a versatile smartphone-based environmental analyzer (vSEA) and its application in on-site nutrient detection. Sci. Total Environ. 838, 156197. doi:10.1016/j.scitotenv.2022.156197
Lind, L., Eckstein, R. L., and Relyea, R. A. (2022). Direct and indirect effects of climate change on distribution and community composition of macrophytes in lentic systems. Biol. Rev. 97, 1677–1690. doi:10.1111/brv.12858
Liu, S., Glamore, W., Tamburic, B., Morrow, A., and Johnson, F. (2022). Remote sensing to detect harmful algal blooms in inland waterbodies. Sci. Total Environ. 851, 158096. doi:10.1016/j.scitotenv.2022.158096
Lofton, M. E., Howard, D. W., Thomas, R. Q., and Carey, C. C. (2023). Progress and opportunities in advancing near-term forecasting of freshwater quality. Glob Chang Biol. 29 (7), 1691–1714. doi:10.1111/gcb.16590
McCaul, M., Barland, J., Cleary, J., Cahalane, C., McCarthy, T., and Diamond, D. (2016). Combining remote temperature sensing with in-situ sensing to track marine/freshwater mixing dynamics. Sensors 16, 1402. doi:10.3390/s16091402
McCaul, M., Magni, P., Jordan, S. F., McNamara, E., Satta, A., Diamond, D., et al. (2021). Nutrient analysis in arctic waters using a portable sensing platform. Front. Sens. 2, 711592. doi:10.3389/fsens.2021.711592
Moriarty, V. W., Lucius, M. A., Johnston, K. E., Borrelli, J. J., Mattes, B. M., Pezzuoli, A. R., et al. (2021). Fluorometer optical path interference via zooplankton phototaxis: implications for high-frequency data collection. Limnol. Ocean Methods 19, 160–175. doi:10.1002/lom3.10411
Nadagouda, M. N., Ginn, M., and Rastogi, V. (2020). A review of 3D printing techniques for environmental applications. Curr. Opin. Chem. Eng. 28, 173–178. doi:10.1016/j.coche.2020.08.002
Ribotti, A., Magni, P., Mireno, B., Schroeder, K., Barton, J., McCaul, M., et al. (2015). “New cost-effective, interoperable sensors tested on existing ocean observing platforms in application of European directives: the COMMON SENSE European project,” in OCEANS 2015 - Genova, Genova, Italy, 18-21 May 2015. doi:10.1109/OCEANS-Genova.2015.7271340
Schierenbeck, T. M., and Smith, M. C. (2017). Path to impact for autonomous field deployable chemical sensors: a case study of in situ nitrite sensors. Environ. Sci. Technol. 51, 4755–4771. doi:10.1021/acs.est.6b06171
Schmechtig, C., and Thierry, V. (2016). Argo quality control manual for biogeochemical data. Bio-Argo group. doi:10.13155/40879
Schmidt, J. Q., and Kerkez, B. (2023). Machine learning-assisted, process-based quality control for detecting compromised environmental sensors. Environ. Sci. Technol. 57 (46), 18058–18066. doi:10.1021/acs.est.3c00360
Sekhar, P. K., Brosha, E. L., Mukundan, R., and Garzon, F. (2010). Chemical sensors for environmental monitoring and homeland security. Electrochem. Soc. Interface 19, 35–40. doi:10.1149/2.F04104if
Sendra, S., Parra, L., Jimenez, J. M., Garcia, L., and Lloret, J. (2023). LoRa-based network for water quality monitoring in coastal areas. Mob. Netw. Appl. 28, 65–81. doi:10.1007/s11036-022-01994-8
Song, D., Qiao, B., Wang, X., Zhao, L., Li, X., Zhang, P., et al. (2023). Degradation of Perfluorooctanoic Acid by chlorine radical triggered electrochemical oxidation system. Environ Sci Technol. 57 (25), 9416–9425. doi:10.1021/acs.est.3c02025
Thierry, V., Bittig, H., Gilbert, D., Kobayashi, T., Kanako, S., and Schmid, C. (2022). Processing Argo oxygen data at the DAC level. Ifremer. doi:10.13155/39795
Weisgrab, G., Ovsianikov, A., and Costa, P. F. (2019). Functional 3D printing for microfluidic chips. Adv. Mater. Technol. 4, 1900275. doi:10.1002/admt.201900275
Won, J., Seo, J., Lee, J., Choi, J., Park, Y., Lee, O., et al. (2023). Streamflow predictions in ungauged basins using recurrent neural network and decision tree-based algorithm: application to the southern region of the Korean peninsula. Water 15, 2485. doi:10.3390/w15132485
Keywords: climate change, global change, sensors, remote sensing, autonomous, in-situ
Citation: Diamond D, Relyea RA and McCaul M (2023) Understanding and mitigating global change with aquatic sensors: current challenges and future prospects. Front. Sens. 4:1284043. doi: 10.3389/fsens.2023.1284043
Received: 01 September 2023; Accepted: 14 November 2023;
Published: 04 December 2023.
Edited by:
Rahul Kumar, Pandit Deendayal Petroleum University, IndiaReviewed by:
Rutuja Bhusari, Luxembourg Institute of Science and Technology (LIST), LuxembourgCopyright © 2023 Diamond, Relyea and McCaul. This is an open-access article distributed under the terms of the Creative Commons Attribution License (CC BY). The use, distribution or reproduction in other forums is permitted, provided the original author(s) and the copyright owner(s) are credited and that the original publication in this journal is cited, in accordance with accepted academic practice. No use, distribution or reproduction is permitted which does not comply with these terms.
*Correspondence: Margaret McCaul, bWFyZ2FyZXQubWNjYXVsQGRjdS5pZQ==
Disclaimer: All claims expressed in this article are solely those of the authors and do not necessarily represent those of their affiliated organizations, or those of the publisher, the editors and the reviewers. Any product that may be evaluated in this article or claim that may be made by its manufacturer is not guaranteed or endorsed by the publisher.
Research integrity at Frontiers
Learn more about the work of our research integrity team to safeguard the quality of each article we publish.