
94% of researchers rate our articles as excellent or good
Learn more about the work of our research integrity team to safeguard the quality of each article we publish.
Find out more
ORIGINAL RESEARCH article
Front. Sens., 02 May 2023
Sec. Chemical Sensors
Volume 4 - 2023 | https://doi.org/10.3389/fsens.2023.1170280
 Chuanlai Zang1
 Haolong Zhou1Kaijie Ma2
 Yasuo Yano2
 Shuowei Li1
 Hiroyasu Yamahara1
 Munetoshi Seki1Tetsuya Iizuka1
 Hitoshi Tabata1,2*
To mimic the human olfactory system, an electronic nose (E-nose, also known as artificial olfactory) has been proposed based on a multiple gas sensor array and a pattern recognition algorithm. Detection of volatile organic components (VOCs) has many potential applications in breath analysis, food quality estimation, and indoor and outdoor air quality monitoring, etc. In this study, a facile single-needle electrospinning technology was applied to develop the four different semiconductor metal oxide (MOS) nanofibers sensor arrays (SnO2, CuO, In2O3 and ZnO, respectively). The array shows a smooth surface and constant diameter of nanofiber (average of 150 nm) resulting in high sensitivity to multiple target analyte gases. Five human health related VOCs gases were measured by fabricated E-nose and different response patterns were obtained from four MOS nanofibers sensors. Combined with feature extraction from the response curves, a principal component analysis (PCA) algorithm was applied to reduce the dimension of feature matrix, Thus, the fabricated E-nose system successfully discriminated five different VOCs gases. Real-time and non-invasive gas monitoring by E-nose is very promising for application in human health monitoring, food monitoring, and other fields.
Due to their promising ability to detect a wide range of gases, metal oxide gas sensors have been widely used in various fields, such as indoor and outdoor air monitoring (Lee et al., 2021; Zhang et al., 2021), and the food and beverage industry (Li et al., 2019; Abegg et al., 2020; Mohd Ali et al., 2020). However, their poor selectivity limited their use in certain applications. Researchers have attempted to improve the selectivity of metal oxide sensors using various methods such as doping and heterojunction modification (Park et al., 2020). However, the mechanisms underlying these improvements are not completely understood. An alternative approach is to use sensor arrays composed of different metal oxide materials, combined with pattern recognition algorithms to improve selectivity (Liu et al., 2020; Chu et al., 2021). Electronic noses (E-noses) are artificial olfactory systems that use cross-reactive sensor arrays to generate a fingerprint pattern for target molecules. The development of E-noses has been inspired by the mammalian olfactory system and aims to replicate or even surpass human olfaction (Gao et al., 2021). Since Persaud and Dodd proposed an E-nose for odor classification using chemical sensor array systems in 1982, and the E-nose has attracted considerable attention over past 2 decades. However highly sensitive, intelligent and robust E-nose remains a big challenge. The electronic nose is a kind of gas detection instrument developed to simulate the human olfactory system. Its working process is mainly divided into three steps: first of all, gas sensor arrays often use different semiconductor oxides, two-dimensional materials, or conductive organic substances to obtain different response for different target gas. After the sensor array contacts the target gas molecules, adsorption, reaction and desorption of gas molecules occur on its surface, which changes the electronic properties of the sensor and generates signals. Then, through the sensor analog front-end (AFE) circuit, the generated signal is amplified (Cho et al., 2020), A/D converted, collected and processed, and then transmitted to the computer. Different from the common analysis method, electronic nose detection is not the specific content of a certain component in the experimental sample, but the overall information of volatile components in the sample, which is called “fingerprint” data. Finally, the signal is analyzed by a pattern recognition algorithm to recognize the detected gas molecules.
In recent years, electronic noses (E-noses) have been increasingly utilized for the detection of respiratory gases and human health monitoring (Hsieh and Yao, 2018; Lekha and M, 2021). E-noses consist of arrays of sensors that are able to detect and discriminate a wide range of volatile organic compounds, making them suitable for the detection of respiratory gases. In the field of medical diagnostics, E-noses have been used for the non-invasive monitoring of respiratory gases in order to detect and diagnose diseases. Research has shown that the detection of specific gases such as carbon dioxide, oxygen, and nitric oxide can provide valuable information about the health of the respiratory system and aid in the diagnosis of conditions such as asthma, chronic obstructive pulmonary disease, and pneumonia. Furthermore, E-noses have also been used to detect other gases such as volatile organic compounds which are associated with certain diseases, including but not limited to, lung cancer, tuberculosis and other lung infections. The use of E-noses for the detection of these gases holds the potential to improve patient outcomes and reduce healthcare costs (Park et al., 2019). These devices have proven to be non-invasive, efficient, and cost-effective tools for the diagnosis and management of a wide range of respiratory diseases (Güntner et al., 2016).
In this paper, we presented four nanofibers (SnO2, CuO, ZnO and In2O3, respectively) semiconductor metal oxide electronic nose (MOS E-nose) for respiratory gas diagnosis by facile electrospinning technology. The metal oxide E-nose consists of an array of metal oxide sensors that are sensitive to different gases. Then, the characteristic of the response pattern was extracted by calculating of the transient parameter and a pattern recognition algorithm, which is used to classify the gases based on their fingerprint patterns.
Ethanol, N, N-dimethylformamide (DMF), and Polyvinylpyrrolidone, (PVP; Mw = 1,300,000 g/mol) were purchased from Sigma Aldrich. Tin(II) Chloride Dihydrate (SnCl2·2H2O), Copper (II) Chloride Dihydrate (CuCl2·2H2O), Zinc Acetate (CH3COO)2Zn), Indium (III) Nitrate Trihydrate (In(NO3)3·3H2O) were purchased from FUJIFILM. All chemicals were used as received without further purification. Deionized water was used for all the synthesis processes.
The morphological features of the fabricated nanofibers were analyzed by scanning an electron microscope (SEM, Regulus8230, Hitachi High-Technologies Co., Japan). The oxidation state of the fabricated nanofibers was characterized by X-ray photoelectron spectrometer (XPS, JPS-9010MC, JEOL, Japan) and the chemical composition and distribution were evaluated by energy dispersive spectroscopy (EDS, Inca Energy for JSM, JEOL, Japan).
First, the original silicon wafer substrate had a 525 μm-thick (1 0 0) p-type silicon layer and was covered by a 100 μm-thick top layer acting as an insulator. The wafer dicing process is performed by a silicon stealth dicing machine (DFL7340, DISCO, Japan). For the gas sensing measurements, Pt interdigital electrodes with ∼100 nm thickness were deposited on the substrate by the traditional lift-off process by laser lithography and sputtering (S-QAM, ULVAC Inc., Japan). To prepare the electrospinning precursor solution, 0.45 g of SnCl2·2H2O, 3.4 g of CuCl2·2H2O, 0.366 g, CH3COO)2Zn and 0.71 g In(NO3)3·3H2O were separately dissolved in a mixed solution of 5 mL ethanol and 5 mL DMF under stirring for 1 h at room temperature until the powder was completely dissolved. Then, 1 g of PVP was slowly added into the above solution under stirring for 3 h at 50 °C until a viscous precursor solution was formed. The electrospinning machine was purchased from Fuence Co., Ltd. (Japan). The prepared precursor solution was loaded into a glass syringe, with a stainless-steel needle. The electrospinning experiments were performed at a flow rate of 5 mL/min under an applied voltage of 25 kV with a distance of 20 cm from the needle tip collector for 1 h. The schematic diagram of the electrospinning process is shown in Figure 1. During the electrospinning process, copper tape was used to protect the contact pin of electrode during electrospinning process. The as-spun nanofibers were placed in a programmable furnace and raised the temperature to 500 °C within 2 h and calcined at 500 °C for 2 h (Song et al., 2022; Chen et al., 2023). The electronic connection of the sensor chip and ceramic dual inline package (DIP) was performed by a manual wire bonder (7476D, WestBond Inc., Japan).
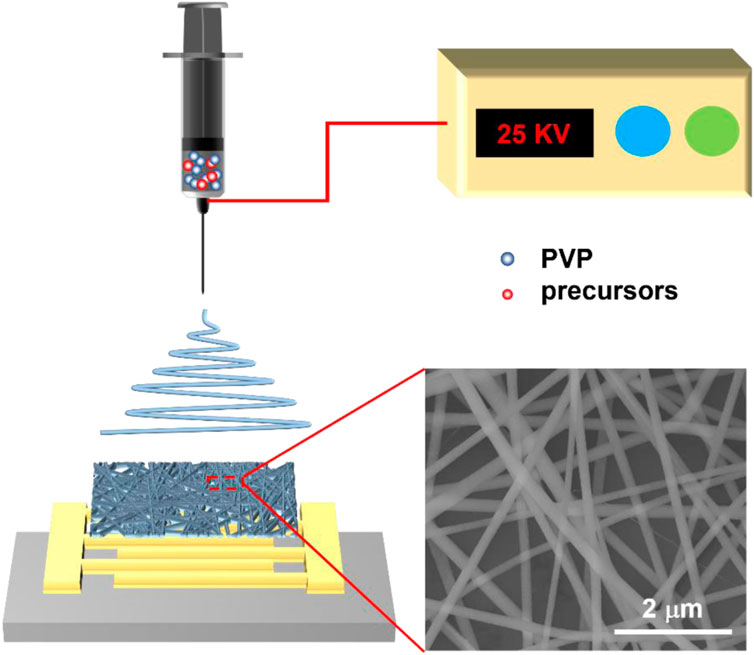
FIGURE 1. Schematic diagram of the electrospinning process and electron microscope image of as-spun nanofibers.
The gas sensing tests were carried out with a homemade setup based on a test chamber with a test probe inside and a Keithley 4200A-SCS semiconductor analyzer. The Keithley applied a steady DC voltage of 1 V and the resistance was calculated by recording the current. The concentration of test gas was controlled by the amount of gas injection. The operating temperature was controlled at 300 °C using a heating plate by applying different DC voltages. The response of the gas sensor was defined by the equation response (R) = Ra/Rg for n-type metal oxide gas sensors and R = Rg/Ra for p-type metal oxide gas sensors, where Ra and Rg are the electrical resistance of the sensor under air and target gas atmosphere, respectively.
A schematic illustration of the fabrication of a gas sensor array based E-nose chip by general single-needle electrospinning technology was shown in Figure 2A. Four Pt interdigital electrodes were deposited by traditional lift-off process via laser lithography and sputtering on the SiO2/Si substrate. Furthermore, four MOS (SnO2, CuO, In2O3 and ZnO) nanofibers sensing material were deposited on the interdigital electrodes by facile single-needle electrospinning technology followed by a calcination process to remove PVP and oxidation (Wang et al., 2016). Finally, the E-nose chip was loaded on a ceramic dual inline package by wire bonding and the optical image is shown in Figure 2B. These four semiconductor metal oxides were always the popular choice for E-nose and their typical physical and chemical property is listed in Table 1.
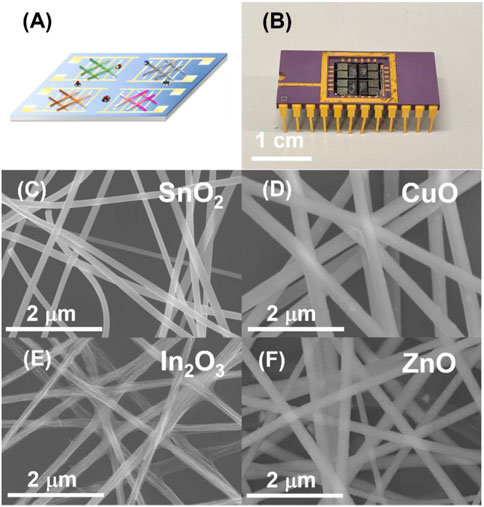
FIGURE 2. Morphological characterization of the four gas sensor array by SEM. (A) Conceptual image of the four gas sensor array with various gas analytes. (B) Photo image of four gas sensor array mounted on a DIP chip carrier by wire bonding. SEM image of the four electrospinning nanofibers gas sensors (C): SnO2, (D) CuO, (E) In2O3 and (F) ZnO, respectively).
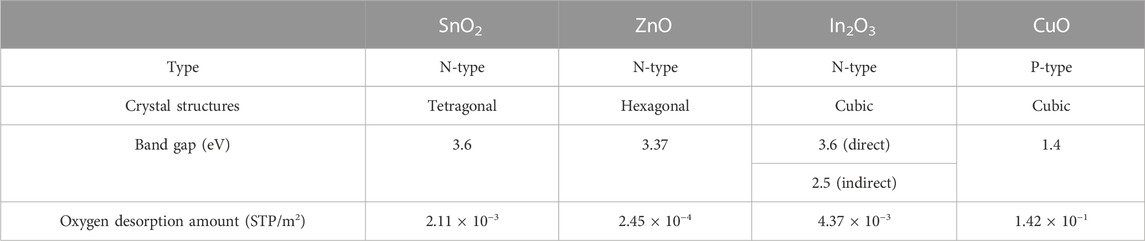
TABLE 1. The physical and chemical properties of semiconductor metal oxide (Iwamoto et al., 1978; Zhai et al., 2009).
Scanning electron microscopy (SEM) images were used to analyze the electrospinning nanofibers of four different metal oxides. The SEM image of four MOS nanofibers is shown in Figures 2E,F. The diameter of the as-spun electrospinning nanofibers contained PVP and metal elements. The nanofibers were randomly distributed in the wafer substrate, which formed a multichannel conduction channel between integrated digital electrodes. Different MOS nanofibers were demonstrated to be a homogeneous structures with a approximately similar diameter (≈150 nm). From the SEM result, high diameter uniformity, high density of nanofibers, and surface smoothness guarantee the stability and sensitivity of the fabricated nanofibers for use in gas sensing The large high specific surface area also leads to high sensitivity of the nanofiber-based gas sensor (Mirzaei et al., 2019).
SEM and energy dispersive X-ray spectroscopy (EDS) mapping of the nanofibers were conducted to investigate the morphology, elemental composition and distribution of the four MOS nanofibers gas sensor arrays (Figures 3A–H). The results indicated that the four semiconductor metal oxide nanofibers (CuO, In2O3, SnO2, and ZnO) were successfully fabricated. Additionally, the EDS mapping analysis was also used to investigate the distribution of elements within the nanowires. From the EDS mapping result, four types of elements (Sn, Cu, Zn and In) were uniformly distributed throughout the nanofibers, indicating that the synthesis process had been successful in fabricating homogenous nanowires.
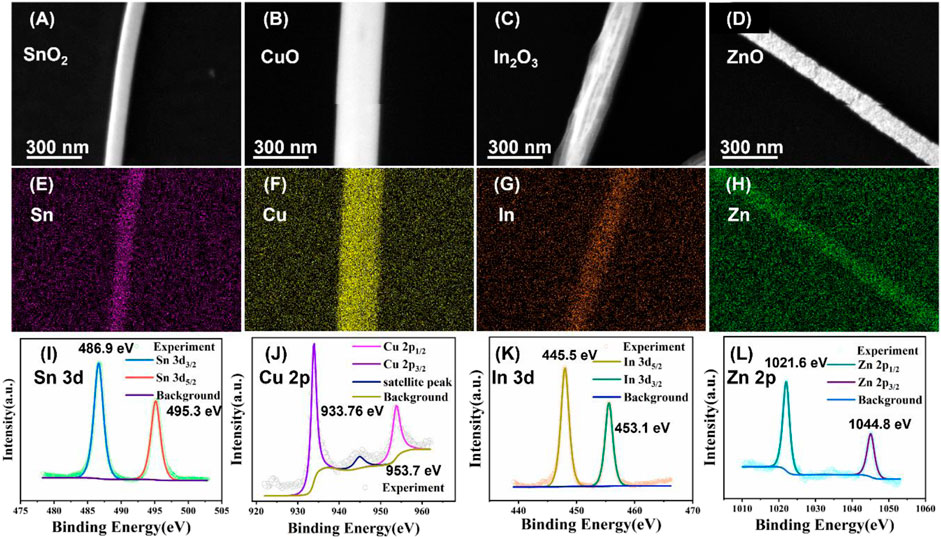
FIGURE 3. Magnified SEM image of the four nanofibers (A) SnO2, (B) CuO, (C) In2O3, and (D) ZnO gas sensor. EDS mapping of four nanofibers (E) SnO2, (F) CuO, (G) In2O3, and (H) ZnO gas sensor. XPS spectra of four nanofibers (I) SnO2, (J) CuO, (K) In2O3, and (L) ZnO gas sensor.
To precisely confirm the oxidation states and elemental chemistries of the four gas sensor arrays, X-ray photoelectron spectroscopy (XPS) analysis was conducted and discussed below (Figures 3I–L). Figure 3I, two peaks are clearly observed in the SnO2 XPS analysis. Two characteristic peaks centered at 495.3 (3d3/2) eV and 486.9 (3d5/2) eV, respectively, which are attributed to the Sn4+ state. The tin chloride precursor was transformed into Sn4+ phases, rather than Sn2+ phases during the thermal calcination oxidation process. In the XPS spectrum of the CuO channel shown in Figure 3J, two characteristic peaks for 2p1/2 and 2p3/2 were observed at a binding energy of 953.7 eV and 933.76 eV, respectively, corresponding to the binding energy of Cu2+. This result indicates that the copper chloride precursor is transformed into CuO phases, rather than Cu2O phases during the thermal calcination oxidation process. In the survey of the In2O3 spectrum (Figure 3K), two characteristic peaks for and were shown at a binding energy of 453.1 eV and 445.5 eV, respectively, corresponding to In3+. The oxidation state of the ZnO nanofibers was clearly shown in Figure 3L. Two characteristic peaks in the XPS analysis at 1021.6 eV and 1044.8 eV. Overall, the XPS results clearly demonstrated the oxidation state of four different MOS nanofibers.
The gas sensing responses of the fabricated gas sensor were measured toward five kinds of target VOCs analyte gases (ammonia, ethanol, acetaldehyde, isoprene and acetone). These five gases were selected for measurement mainly because each gas is closely related to human health and disease. For example, ammonia has been proven to be closely related to body fatigue and hepatitis. Isoprene is commonly used to identify the blood cholesterol level. Acetaldehyde is a well-known biomarker for lung cancer. Moreover, acetone is well known to be associated with fat burning and diet. Ethanol is a well-known detection target to represent the alcohol drinking level. Some typical properties of selected gases are listed in Table 2. These health marks VOCs gases exhaled from human breath and skin from ppb to ppm order. So, the smart electronic nose should have the ability to detect these five VOCs analyte gases in ppb to ppm level and discriminated them from interfering gases. Since the exhaled gases contain a large concentration of water vapor, the effect of humidity should also be quantitatively evaluated in the future (Tai et al., 2020; Dong et al., 2022). The practical applications of gas sensors are determined by their sensitivity, stability, and selectivity. However, it is unclear whether the fabricated gas sensor can produce a stable response to minute changes in the gas concentration, as well as whether the sensor array can specifically identify different gas components. These aspects should be studied in detail in the future (Sanchez et al., 2019).
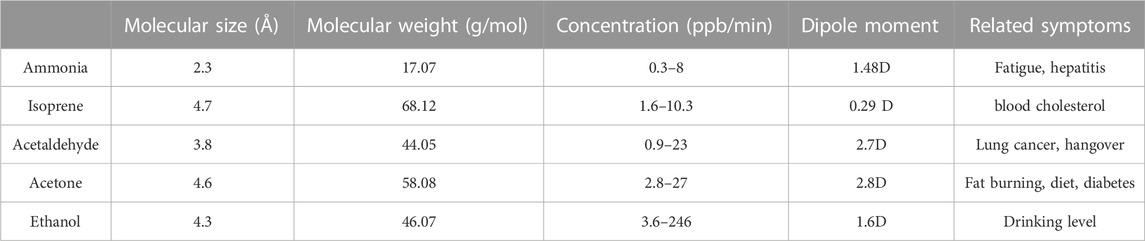
TABLE 2. Summary of typical VOCs and their related symptoms (Menezes et al., 2013; Belizario et al., 2021).
Here, these five VOCs analyte gases were tested together by fabricated MOS E-nose and distinguished with the combination with PCA algorithm (Khan et al., 2020). The concentrations of five kinds of VOCs analyte gases were set to 20 ppm. The analytes were injected into a homemade gas testing chamber in series. The resistances of the channels were tested using proble station, and the variations of the electrical resistances of the four MOS nanofibers gas sensors were recorded by Keithley 4200A-SCS semiconductor analyzer. The testing temperature was set at 300 °C.
The response of each gas sensor toward various target VOCs analytes was defined by the equation response = Ra/Rg for n-type MOS (SnO2, In2O3 and ZnO) gas sensor, and response = Rg/Ra for p-type MOS (CuO) gas sensor for further PCA analysis. Here, Ra represents the base electrical resistance (baseline) of the sensor under air atmosphere, and Rg represents the electrical resistance that occurs when the target VOCs analytes gases were introduced. The definition of response is different due to the different sensing mechanisms of n-type and p-type semiconductors, such as different main charge carriers and different charge transport pathways (Kang et al., 2020). For example, the SnO2 nanofibers gas sensor showed gas response values ranging from 3.4 (acetaldehyde) to 23.8 (ethanol) (Figure 4A). Ethanol showed relatively active properties among all four types of metal oxide semiconductors, and isoprene and acetaldehyde showed relatively inactive properties among all four kinds of metal oxide semiconductors. The p-type metal oxide semiconductor CuO channel provided relatively low response sensitivity compared with the other channels. These low response sensitivities was due to the electrical properties and the sensing mechanism of p-type metal oxide semiconductors (Lupan et al., 2016). Figure 4F shows the standardized fingerprint of four sensor arrays for five different gases. The standardization method is simple: the response of each gas is divided by the maximum response obtained among the five gases. This helps to normalize the data and make it easier to compare the responses of the four sensors to each gas. The fingerprint shows the unique patterns of the four sensor arrays and highlights the specific gas-sensing properties of each one, providing a comprehensive overview of the performance of the sensors in detecting different gases, making it a useful tool for evaluating the efficiency and effectiveness of the sensor arrays.
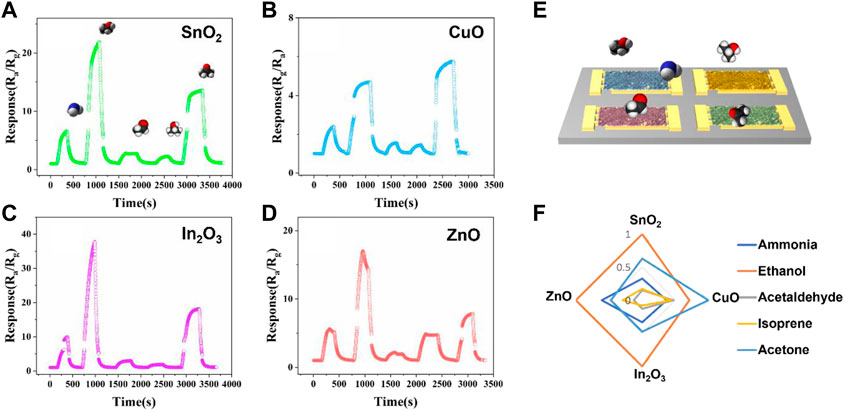
FIGURE 4. Sensing performance of the fabricated four types of nanofibers (A) SnO2, (B) CuO, (C) In2O3 and (D) ZnO MOS gas sensor array to five different target gases (from left to right: 20 ppm samples of ammonia, ethanol, acetaldehyde, isoprene and acetone were introduced in series). (E) Diagram of fabricated nanofibers gas sensor array E-nose. (F) Standardized fingerprint response of the four-channel nanofibers electronic nose.
The mechanism of MOS gas sensing is summarized in Figure 5. The detection of gas molecules is based on the electrical conductivity of an oxide semiconductor changes in response to the adsorption of gas molecules. Figure 5A and 5B shows the particle model for n-type and p-type MOS, and Figures 5C, D show the nanowire model for n-type and p-type MOS. In the n-type oxide semiconductors, the adsorption of oxygen and its ionization to O2-, O−, and O2- at temperatures ranging from 100°C to 450 °C creates the core-shell electronic configuration. The core is semiconducting while the shell is a resistive electron depletion layer (EDL). For particles larger than twice thickness of the EDL, the electron must overcome the Schottky barrier at the grain boundary. Thus, conduction is explained by the serial connection between the semiconducting cores and the resistive shells. In contrast, p-type oxide semiconductors have a different electronic configuration, with the ionized oxygen on the surface attracting the majority of charge carriers (holes) to form the core-shell structure. The core is less conductive, while the shell is a semiconducting hole accumulation layer (HAL). For particle diameters larger than twice thickness of the HAL, conduction is determined by the parallel competition between two pathways, one through the semiconducting HAL with the narrower cross-sectional area and the other through the less conductive core with the wider cross-sectional area. When electrons are injected into the sensing materials due to the reaction between ionized oxygen and the reducing gas, the electron concentration in the EDL increases in n-type chemiresistors, while the hole concentration in the HAL decreases in p-type chemiresistors, resulting in opposite chemiresistive variations. Therefore, n-type oxide semiconductors with serial conduction paths are more advantageous for achieving higher sensor resistance variations than p-type semiconductors with parallel conduction paths.
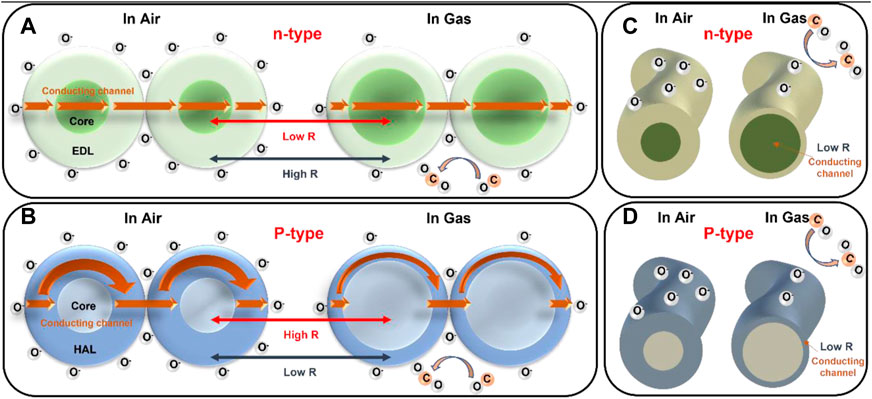
FIGURE 5. Schematic diagram of gas sensing mechanism and conduction model for (A) n-type MOS particle model, (B) p-type MOS particle model, (C) n-type MOS nanowire model, (D) p-type MOS nanowire model.
To investigate the gas classification performance of the fabricated multiple nanofibers array E-nose system, pattern recognition analysis was conducted by PCA analysis to distinguish between the five different target VOCs analytes gases. First, feature extraction was calculated from the response curve for the following PCA analysis (Yan and Zhang, 2015). In this work, these four features were calculated based dynamic process of surface gas sensing, which includes gas adsorption, reaction, and recovery. ΔR is defined as the difference value of the maximum resistance and the baseline resistance.
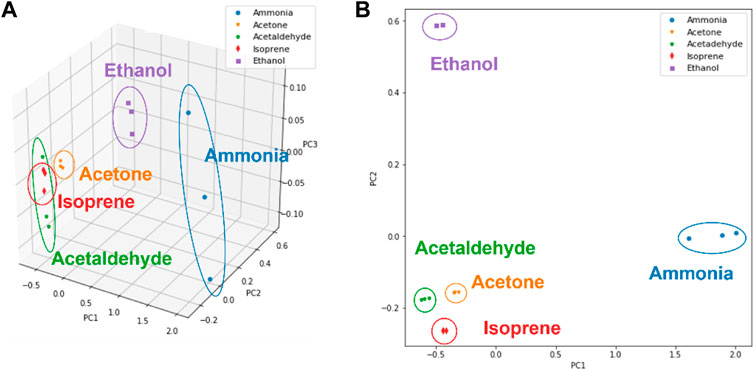
FIGURE 6. Gases recognization for five kinds of VOCs (ammonia, ethanol isoprene, acetaldehyde, isoprene and acetone) by PCA algorithm. (A) 3D PCA result. (B) 2D PCA result.
In this study, a high-performance four MOS nanofibers E-nose system was developed by a facile electrospinning technology. Four different semiconductor metal oxide (MOS) nanofibers sensor arrays (SnO2, CuO, In2O3 and ZnO, respectively) exhibited smooth surfaces and constant diameter of nanofibers (an average of 150 nm) resulting in high sensitivity toward the multiple target analyte gases. Five kinds of human health-related target VOCs analyte gases (ammonia, ethanol, acetaldehyde, isoprene and acetone) were measured by the fabricated MOS E-nose and different response patterns were obtained by four MOS nanofibers gas sensors. The feature of different response patterns was extracted and applied to PCA algorithm. It was found that five kinds of target gases were successfully identified. Furthermore, the demonstration of breath detection also revealed the potential application in real-time and non-invasive breath analysis and health monitoring.
The raw data supporting the conclusion of this article will be made available by the authors, without undue reservation.
CZ carried out the experiment with support from YY. CZ wrote the manuscript with support from HZ, KM, HY, MS. SL, and TI fabricated the chip package and multiple gases test. HT supervised the project and instructed the manuscript writing. All authors contributed to the article and approved the submitted version.
This research was partially supported by AMED under Grant Number JP22zf0127006, JSPS KAKENHI Grant Number JP20H05651, and Institute for AI and Beyond for the University of Tokyo. This work was also partially supported by the Graduate Program for International Graduate Program of Innovation for Intelligent World (IIW) of The University of Tokyo by MEXT (Ministry of Education, Culture, Sports, Science and Technology).
The authors would like to express their gratitude to Professor Tomoyuki Yokota and Dr. Chihiro Okutani for their guidance of instruments and valuable suggestions.
The authors declare that the research was conducted in the absence of any commercial or financial relationships that could be construed as a potential conflict of interest.
All claims expressed in this article are solely those of the authors and do not necessarily represent those of their affiliated organizations, or those of the publisher, the editors and the reviewers. Any product that may be evaluated in this article, or claim that may be made by its manufacturer, is not guaranteed or endorsed by the publisher.
Abegg, S., Magro, L., van den Broek, J., Pratsinis, S. E., and Güntner, A. T. (2020). A pocket-sized device enables detection of methanol adulteration in alcoholic beverages. Nat. Food 1 (6), 351–354. doi:10.1038/s43016-020-0095-9
Belizario, J. E., Faintuch, J., and Malpartida, M. G. (2021). Breath biopsy and discovery of exclusive volatile organic compounds for diagnosis of infectious diseases. Front. Cell. Infect. Microbiol. 10, 564194. doi:10.3389/fcimb.2020.564194
Chen, L., Shi, H. Z., Ye, C. J., Xia, X. Y., Li, Y., Pan, C. Y., et al. (2023). Enhanced ethanol-sensing characteristics of Au decorated In-doped SnO2 porous nanotubes at low working temperature. Sensors Actuators B-Chemical 375, 132864. doi:10.1016/j.snb.2022.132864
Cho, S. Y., Lee, Y., Lee, S., Kang, H., Kim, J., Choi, J., et al. (2020). Finding hidden signals in chemical sensors using deep learning. Anal. Chem. 92 (9), 6529–6537. doi:10.1021/acs.analchem.0c00137
Chu, J., Li, W., Yang, X., Wu, Y., Wang, D., Yang, A., et al. (2021). Identification of gas mixtures via sensor array combining with neural networks. Sensors Actuators B Chem. 329, 129090. doi:10.1016/j.snb.2020.129090
Dong, H., Qian, L. B., Cui, Y. X., Zheng, X. B., Cheng, C., Cao, Q. P., et al. (2022). Online accurate detection of breath acetone using metal oxide semiconductor gas sensor and diffusive gas separation. Front. Bioeng. Biotechnol. 10, 861950. doi:10.3389/fbioe.2022.861950
Gao, Z., Chen, S., Li, R., Lou, Z., Han, W., Jiang, K., et al. (2021). An artificial olfactory system with sensing, memory and self-protection capabilities. Nano Energy 86. doi:10.1016/j.nanoen.2021.106078
Güntner, A. T., Koren, V., Chikkadi, K., Righettoni, M., and Pratsinis, S. E. (2016). E-nose sensing of low-ppb formaldehyde in gas mixtures at high relative humidity for breath screening of lung cancer? ACS Sensors 1 (5), 528–535. doi:10.1021/acssensors.6b00008
Hsieh, Y.-C., and Yao, D.-J. (2018). Intelligent gas-sensing systems and their applications. J. Micromechanics Microengineering 28 (9), 093001. doi:10.1088/1361-6439/aac849
Iwamoto, M., Yoda, Y., Yamazoe, N., and Seiyama, T. (1978). Study of metal-oxide catalysts by temperature programmed desorption .4. Oxygen-adsorption on various metal-oxides. J. Phys. Chem. 82 (24), 2564–2570. doi:10.1021/j100513a006
Kang, H., Cho, S. Y., Ryu, J., Choi, J., Ahn, H., Joo, H., et al. (2020). Multiarray nanopattern electronic nose (E-Nose) by high-resolution top-down nanolithography. Adv. Funct. Mater. 30 (27), 2002486. doi:10.1002/adfm.202002486
Khan, M. A. H., Thomson, B., Debnath, R., Motayed, A., and Rao, M. V. (2020). Nanowire-based sensor array for detection of cross-sensitive gases using PCA and machine learning algorithms. IEEE Sensors J. 20 (11), 6020–6028. doi:10.1109/jsen.2020.2972542
Lee, J., Jung, Y., Sung, S.-H., Lee, G., Kim, J., Seong, J., et al. (2021). High-performance gas sensor array for indoor air quality monitoring: The role of Au nanoparticles on WO3, SnO2, and NiO-based gas sensors. J. Mater. Chem. A 9 (2), 1159–1167. doi:10.1039/d0ta08743b
Lekha, S., and Suchetha, M. (2021). Recent advancements and future prospects on E-nose sensors technology and machine learning approaches for non-invasive diabetes diagnosis: A review. IEEE Rev. Biomed. Eng. 14, 127–138. doi:10.1109/RBME.2020.2993591
Li, Z., Paul, R., Ba Tis, T., Saville, A. C., Hansel, J. C., Yu, T., et al. (2019). Non-invasive plant disease diagnostics enabled by smartphone-based fingerprinting of leaf volatiles. Nat. Plants 5 (8), 856–866. doi:10.1038/s41477-019-0476-y
Liu, H., Meng, G., Deng, Z., Li, M., Chang, J., Dai, T., et al. (2020). Progress in research on VOC molecule recognition by semiconductor sensors. Acta Phys. Chim. Sin. 38 (5), 2008018. doi:10.3866/pku.Whxb202008018
Lupan, O., Postica, V., Cretu, V., Wolff, N., Duppel, V., Kienle, L., et al. (2016). Single and networked CuO nanowires for highly sensitive p-type semiconductor gas sensor applications. Phys. status solidi (RRL) - Rapid Res. Lett. 10 (3), 260–266. doi:10.1002/pssr.201510414
Menezes, H. C., Amorim, L. C. A., and Cardeal, Z. L. (2013). Sampling and analytical methods for determining VOC in air by biomonitoring human exposure. Crit. Rev. Environ. Sci. Technol. 43 (1), 1–39. doi:10.1080/10643389.2011.604239
Mirzaei, A., Lee, J.-H., Majhi, S. M., Weber, M., Bechelany, M., Kim, H. W., et al. (2019). Resistive gas sensors based on metal-oxide nanowires. J. Appl. Phys. 126 (24), 241102. doi:10.1063/1.5118805
Mohd Ali, M., Hashim, N., Abd Aziz, S., and Lasekan, O. (2020). Principles and recent advances in electronic nose for quality inspection of agricultural and food products. Trends Food Sci. Technol. 99, 1–10. doi:10.1016/j.tifs.2020.02.028
Park, K.-R., Cho, H.-B., Lee, J., Song, Y., Kim, W.-B., and Choa, Y.-H. (2020). Design of highly porous SnO2-CuO nanotubes for enhancing H2S gas sensor performance. Sensors Actuators B Chem. 302, 127179. doi:10.1016/j.snb.2019.127179
Park, S. Y., Kim, Y., Kim, T., Eom, T. H., Kim, S. Y., and Jang, H. W. (2019). Chemoresistive materials for electronic nose: Progress, perspectives, and challenges. InfoMat 1 (3), 289–316. doi:10.1002/inf2.12029
Sanchez, C., Santos, J. P., and Lozano, J. (2019). Use of electronic noses for diagnosis of digestive and respiratory diseases through the breath. Biosens. (Basel) 9 (1), 35. doi:10.3390/bios9010035
Song, Y. H., Dong, H., Liu, W. X., Fu, X., Fu, Z., Li, P. L., et al. (2022). Electrostatic jet engineering of flexible composite pressure sensors for physical applications. Acs Appl. Polym. Mater. 4 (2), 868–878. doi:10.1021/acsapm.1c01357
Tai, H., Wang, S., Duan, Z., and Jiang, Y. (2020). Evolution of breath analysis based on humidity and gas sensors: Potential and challenges. Sensors Actuators B Chem. 318, 128104. doi:10.1016/j.snb.2020.128104
Wang, Y., Zhang, H., and Sun, X. (2016). Electrospun nanowebs of NiO/SnO2 p-n heterojunctions for enhanced gas sensing. Appl. Surf. Sci. 389, 514–520. doi:10.1016/j.apsusc.2016.07.073
Yan, K., and Zhang, D. (2015). Feature selection and analysis on correlated gas sensor data with recursive feature elimination. Sensors Actuators B Chem. 212, 353–363. doi:10.1016/j.snb.2015.02.025
Zhai, T. Y., Fang, X. S., Liao, M. Y., Xu, X. J., Zeng, H. B., Yoshio, B., et al. (2009). A comprehensive review of one-dimensional metal-oxide nanostructure photodetectors. Sensors 9 (8), 6504–6529. doi:10.3390/s90806504
Keywords: metal oxide, gas sensor, sensor array, electronic nose, breath analysis
Citation: Zang C, Zhou H, Ma K, Yano Y, Li S, Yamahara H, Seki M, Iizuka T and Tabata H (2023) Electronic nose based on multiple electrospinning nanofibers sensor array and application in gas classification. Front. Sens. 4:1170280. doi: 10.3389/fsens.2023.1170280
Received: 20 February 2023; Accepted: 20 April 2023;
Published: 02 May 2023.
Edited by:
Ziyu Qin, Hainan University, ChinaCopyright © 2023 Zang, Zhou, Ma, Yano, Li, Yamahara, Seki, Iizuka and Tabata. This is an open-access article distributed under the terms of the Creative Commons Attribution License (CC BY). The use, distribution or reproduction in other forums is permitted, provided the original author(s) and the copyright owner(s) are credited and that the original publication in this journal is cited, in accordance with accepted academic practice. No use, distribution or reproduction is permitted which does not comply with these terms.
*Correspondence: Hitoshi Tabata, dGFiYXRhQGJpb2VuZy50LnUtdG9reW8uYWMuanA=
Disclaimer: All claims expressed in this article are solely those of the authors and do not necessarily represent those of their affiliated organizations, or those of the publisher, the editors and the reviewers. Any product that may be evaluated in this article or claim that may be made by its manufacturer is not guaranteed or endorsed by the publisher.
Research integrity at Frontiers
Learn more about the work of our research integrity team to safeguard the quality of each article we publish.