- 1Department of Physics, University of Zululand, KwaDlangezwa, South Africa
- 2Department of Physics, University of the Free State, Bloemfontein, South Africa
- 3Department of Physics, University of Limpopo, Sovenga, South Africa
The detection and monitoring of H2S gas at high and lower concentrations is very crucial since this gas is highly toxic and can affect tissues and organs, especially in occupational environment. This work reports on the synthesis of WO3 nanostructures-based sensors for highly sensitive and selective H2S detection at low operating temperatures. These WO3 nanostructures were synthesized using pressurized hydrothermal process. Different acids from weak to strong (HNO3, H2SO4, and HCl) were employed as precipitants to form supposedly hierarchical and cube-like nanostructures of WO3. These WO3 nanostructures were characterized by XRD, SEM, TEM, XPS and BET analysis. The fabricated WO3 sensors were exposed to different target gases (CO2, H2, CH4, NH3, LPG and H2S) at different concentrations. They were found to be selective to H2S, and the WO3 precipitated by HCl otherwise referred to as WO3-HCl was found to be highly sensitive, with high response of S = 1394.04 towards 150 ppm of H2S at 125°C operating temperature. The WO3 precipitated by H2SO4 named WO3-H2SO4 showed a high response of 141.64 at 125°C operating temperature. Lastly, WO3 precipitated by HNO3 called WO3-HNO3, recorded a H2S response of 125.75 also at 125°C operating temperature. The HCl-precipitated WO3 is a promising candidate for selective detection of H2S, being the most sensitive in the series.
1 Introduction
There has been an increasing demand in the monitoring and the detection of toxic gases. Hydrogen sulphide (H2S) is one of the most toxic, flammable, and corrosive gas that is produced widely from various industrial processes, e.g., during the production of crude oil and in mines (Cheng et al., 2019). This colourless pollutant gas can cause breathing difficulties, loss of consciousness and death when concentration exceeds its threshold limit of 20 ppm in air (Xiao et al., 2015; Cheng et al., 2019). Moreover, the threshold limit for H2S is 10 ppm over an 8-h exposure according to the American Conference of Governmental Industrial Hygienists (Sun et al., 2022). Therefore, the selective detection and monitoring of H2S gas is paramount. Metal oxide semiconductor-based sensors such as CuO (Park et al., 2016), ZnO (Kim and Yong, 2011), and MoO3 (Xiao et al., 2015; Cheng et al., 2019), to mention a few, have been widely used for detection of H2S gas. However, these sensors have some limitations when detecting H2S at operating temperatures below 200°C. They exhibit low sensor response, long response, and recovery time (Xiao et al., 2015; Cheng et al., 2019). WO3 metal oxide is one of the most promising materials for gas sensing application due to its fascinating properties such as wide band gap (2.7 eV), excellent electron mobility and chemical stability (Chen et al., 2018; Liu et al., 2020; Shen et al., 2021).
Many significant efforts have been made towards the developments of H2S sensors-an example is the addition of metal nanoparticles such as Pt (Van Toan et al., 2021), Pd (Wu et al., 2019), Ru (Kruefu et al., 2015), and Ni (Vilic and Llobet, 2016; Karaduman Er et al., 2022) on metal oxides semiconductors, for catalytic effects. This was done for the purpose of enhancing their gas sensing performance towards H2S at low operating temperatures. However, besides the high cost of these metals, low sensor responses were observed due to the inhomogeneity of the final structure of the gas sensing layers, which underwent unavoidable aggregation; thus worsening their gas sensing performance (Vilic and Llobet, 2016; Karaduman Er et al., 2022), (Wang et al., 2022). High sensor response, short response, and recovery times remain paramount in H2S detection (Vilic and Llobet, 2016; Karaduman Er et al., 2022), (Vilic and Llobet, 2016; Karaduman Er et al., 2022). Wang et al. (Vilic and Llobet, 2016) synthesized bimodal carbon modified porous WO3 using methanol solution to obtain C/WO3 precipitates as the final product. The C/WO3-based sensor was used to detect H2S at 200 °C. However, the sensor could not attain its initial resistance in air until a high temperature pulse of 275°C was applied at the desorption process (Vilic and Llobet, 2016). Pankaj S. Kolhe et al. (Wang et al., 2020) synthesized the Al doped ZnO thin film for 600 ppm H2S detection at 100°C, however, the response and recovery times were high at this low operating temperature. Shorter response and recovery times of 90 s and 209 s respectively were achieved at a much higher operating temperature of 200°C. (Kolhe et al., 2018).
It has been reported in previous studies that the gas sensing performance of semiconductor metal oxide materials is greatly influenced or enhanced by its exposed crystal facets, surface area, crystal structure, surface morphology, and crystallite size (Lavanya et al., 2017), (Johnson et al., 2020), (Simion et al., 2018). Therefore, the desired properties of gas sensing materials could be obtained by rational control and design of the above-mentioned parameters. It has also been reported in the literature that the surface morphology of metal oxide nanostructures, oxygen vacancies and chemisorbed oxygen on metal oxides nanostructures play a very crucial role in gas detection and that these properties of metal oxide nanostructures can be achieved based on the synthesis method used (Lavanya et al., 2017), (David et al., 2020). In this study, the WO3 nanostructures were synthesized using hydrothermal method. Various surface morphologies of WO3 were achieved by using different acids (HNO3, H2SO4, and HCl) as precipitants to form supposedly hierarchical and cube-like nanostructures of WO3 to investigate the effect of the sample preparation conditions on the H2S gas detection of the as-synthesized WO3 nanostructures.
2 Experimental details
2.1 Synthesis procedure
The chemical reagents used in this study were of high-quality analytical grade and were purchased from Sigma Aldrich and were without any impurities. WO3 samples were prepared via a simple hydrothermal method (David et al., 2020). To synthesize the WO3 samples, a 10 mmol of Na2WO4.2H2O was dissolved in deionized water and the pH was controlled using HNO3, H2SO4 and HCl acids reagents, to obtain different samples referred to as WO3-HNO3, WO3-H2SO4, and WO3-HCl, respectively. This 10 mmol of Na2WO4.2H2O was completely dissolved in the 100 mL deionized water under vigorous and continuous stirring using a magnetic stirrer bar for 30 min at room temperature. The pH value of the solution was first adjusted to 0.14 by dropwise addition of HNO3 acid to the solution; a sea-foam green precipitate was observed, and the uniform solution was then transferred into 500 mL Teflon-lined stainless-steel autoclave, which was then tightly sealed and kept at 180°C for 24 h in a laboratory oven. After cooling down, the WO3 precipitate was washed several times with deionized water, and then with ethanol, using the centrifuge, to remove any residual chlorides salt. The obtained precipitate was dried at 60°C for 12 h in a laboratory oven and the solid precipitate was obtained after drying. Porcelain mortar and pestle were used for crushing the solid precipitate into powder and the powder sample labelled WO3-HNO3 was transferred into the sample container for characterization. Following the same procedure described above, the WO3 nanostructures were also synthesized using H2SO4 and HCl acids to control the pH until a neon yellow WO3-H2SO4 and mint green WO3-HCl precipitates, respectively, were obtained.
2.2 Structural characterization
The crystal structure of these powder samples was characterized by using a Bruker D8 Advance X-ray diffractometer fitted with Cu-Kα (λ = 0.1541 nm) radiation source with a scan rate of 0.3 per min. Images of the surface morphology and particle size of the powder samples were captured using a scanning electron microscope (SEM, Carl ZEISS Sigma VP-03-67). High-resolution transmission electron microscopy (HR-TEM) images were recorded using a JEOL 1400 system. PHI 5000 Scanning ESCA Microprobe was used to examine the chemical state of the samples by X-ray photoelectron spectroscopy (XPS) analysis using A 100 μm diameter monochromatic Al Kα (1486.6 eV) X-ray beam at a pressure of 9.3 × 10⁻¹⁰ Torr. The samples were sputter-etched using Ar+ with energy of 2 kV and 2 µA. A low energy Ar + ion gun and low energy neutralizer electron gun were used to minimize charging on the surface. The binding energy calibration was done by using the high energy peak of Cu 2p3 at 932.62 eV and the low energy peak of Au 4f7 at 83.96 eV. The retard linearity was set to keep the difference between these two peaks constant at 848.66 eV. The work function of the analyzer was set to 3.7 eV for the Ag3d5 peak to be at 368.27 ± 0.1 eV N2 adsorption-desorption isotherms and Brunauer-Emmett-Teller (BET) surface area studies were performed using a Micromeritics TRISTAR II (USA) surface area analyser. The samples were degassed at 150°C for 3 h. The BET surface area, pore size and pore volume were measured using nitrogen at 77 K.
2.3 Gas sensors fabrication and measurement
To fabricate the WO3-based gas sensors (WO3-HNO3, WO3-H2SO4 and WO3-HCl), each powder sample was mixed with ethanol and sonicated. The resulting WO3 solution was drop-casted onto alumina substrate screen-printed with platinum electrodes. The sensing layer of the fabricated WO3-sensor were allowed to dry overnight at room temperature. The sensors were placed, simultaneously, in an airtight chamber with electrical and gas feeds for sensing measurement to be performed. The KS026K16 (KENOSISTEC model, Italy) gas testing system at University of Zululand, was used to measure the gas sensing performance of the fabricated sensors. The first WO3 sensor device (WO3-HNO3) was placed inside the climatic gas testing chamber of the Kenosistec system. First, the dry air was introduced into chamber for the sensor to attain equilibrium, while a bias voltage of 5 V was applied across the sensors’ terminals. The humidity was maintained at 0.2 %RH before H2S target gas was allowed into the chamber. After the initially conditions were set, the WO3 sensor devices were operated at various temperatures (25°C, 75°C, 125°C, 175°C and 225°C) during H2S detection at different concentrations. It was observed that the three WO3-based sensor devices, prepared using different acids, have the optimal operating temperature of 125°C towards H2S. WO3 synthesized using HCl (WO3-HCl) exhibited the highest sensor response compared to the WO3-HNO3, and WO3-H2SO4 based sensors. The responses of the sensors were calculated, using Eq. 1.1, for a reducing gas. Ia and Ig are the currents when the gas sensor device is exposed to air and the target gas respectively.
The response and recovery times of the sensors were also determined. The response time of a gas sensor is the time taken to attain 90% of its maximum current when exposed to a target gas. The recovery time is the time taken to regain 90% of the initial current when the target gas is stopped. WO3-based gas sensor devices were also exposed to various concentrations of CO2, H2, LPG, NH3 and CH4, to ascertain the selectivity and sensitivity of the sensors.
3 Results and discussion
3.1 Structural and morphological characteristics of WO3 sensors
Figure 1 shows X-ray diffraction patterns of as-synthesized WO3-HNO3, WO3-H2SO4 and WO3-HCl samples represented with strong and sharp diffraction peaks indicating good crystalline nature. The samples exhibited highly crystalline diffraction patterns that corresponds to the monoclinic phase of WO3 according to the JCPDS card no. 89–4476, with the miller indices (002), (020), (200), (120), (112), (022), (202), (222), (004), (040), (140) and (420) (Vilic and Llobet, 2016; Karaduman Er et al., 2022).
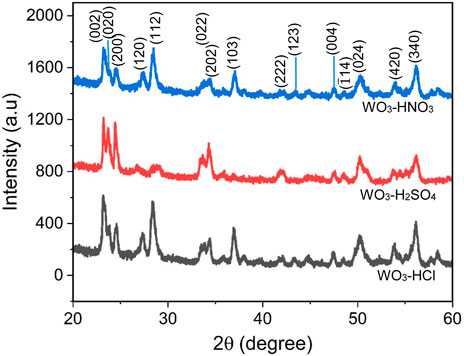
FIGURE 1. X-ray diffraction patterns of WO3 synthesized using three different acids- HNO3, H2SO4, and HCl—for precipitation.
The crystallite size of all the WO3 samples was estimated using the most intense peaks which are the peaks at 2θ = 23.22 corresponding to (002) plane of the monoclinic WO3. The Debye-Scherrer Eq. 1.2 was used to calculate the crystallite size of the samples.
Where λ is the X-ray wavelength,

TABLE 1. The crystallite size, dislocation density and strain of WO3-HNO3, WO3-H2SO4 and WO3-HCl samples calculated from the peak corresponding to (002) crystal plane using Debye-Scherrer equation.
The surface morphology and the corresponding elemental composition of WO3-HNO3, WO3-H2SO4 and WO3-HCl samples was examined by SEM and energy dispersive X-ray analysis (EDX) as shown in Figures 2A–F. It can be observed in Figures 2A, B that WO3-HNO3 consists of hierarchical nanostructures and the EDX spectrum confirms the presence of tungsten (W) and oxygen (O) elements in the sample. The copper (Cu) and carbon (C) elements might have resulted from sample preparation procedure prior to SEM and EDX analysis, however this does not have any effect on other characterization that were performed in this study. Figure 2C shows that WO3-H2SO4 consists of nano-cubes like structures; Figure 2E also shows hierarchical nanostructures of WO3-HCl, however, small nanoparticles can be observed on the surface morphology of this sample, which are more noticeable than on the WO3-HNO3. It is clear that, the type of acids precipitants (HNO3, H2SO4, and HCl) influenced the morphological structure of the samples, which also affects their gas sensing performance (Karaduman Er et al., 2022).
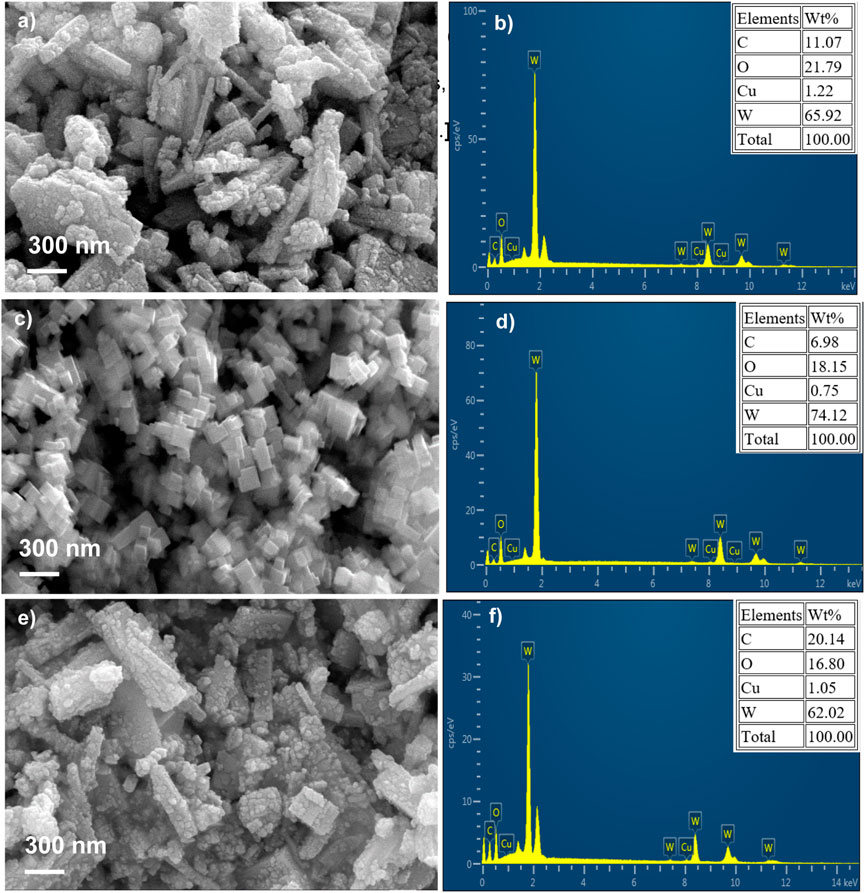
FIGURE 2. Scanning electron microscope (SEM) micrographs and their corresponding energy dispersive x-rays (EDX) of WO3 samples synthesized using different acids (A, B) HNO3, (C, D) H2SO4, (E, F) HCl.
The EDX composition maps further confirmed the homogenous distribution of W and O in all the samples. Figures 3–5 shows the EDX composition maps for WO3-HNO3, WO3-H2SO4 and WO3-HCl sample. Figures 3A, 4A, 5A shows the morphology of WO3-HNO3, WO3-H2SO4 and WO3-HCl samples respectively. It is obvious that the morphologies of the samples agree with the results obtained from SEM analysis (Figure 2). All the samples consist of high percentage of W atoms as shown in Figure 2, where WO3-HNO3, WO3-H2SO4 and WO3-HCl consists of 65.92 wt%, 74.12 wt% and 62.02 wt% respectively. This agrees with morphologies of the samples shown in Figures 3A, 4A, 5A, where W atoms was more dominant and evenly distributed in all the samples. However, the composition for WO3-HCl consists of 62.02 wt% of W atoms, which is slightly small compared to other samples. The oxygen composition (wt%) of the samples were also not the same as can be seen in Figure 2, Where WO3-HCl consists of reasonable amount of oxygen (16.80 wt%) for the formation of WO3 sample.
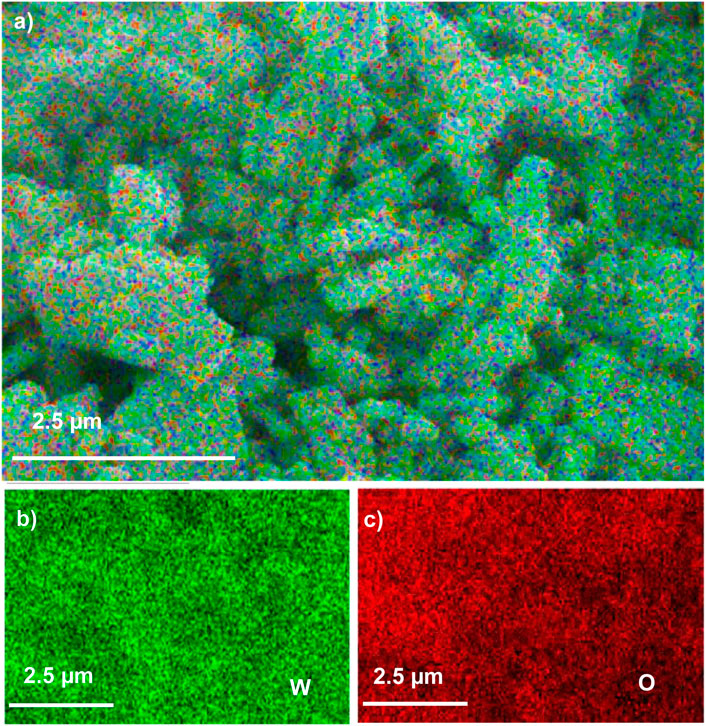
FIGURE 3. The EDX micrograph of (A) WO3-HNO3 sample, and its corresponding elements mapping of (B) W, and (C) O, based on SEM images of WO3-HNO3.
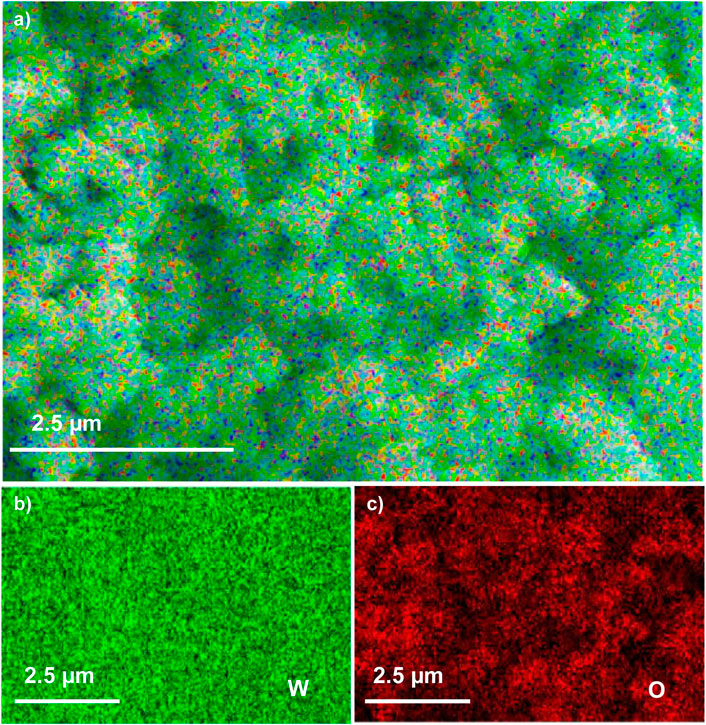
FIGURE 4. The EDX micrograph of (A) WO3-H2SO4 sample, and its corresponding elements mapping of (B) W, and (C) O, based on SEM images of WO3-H2SO4.
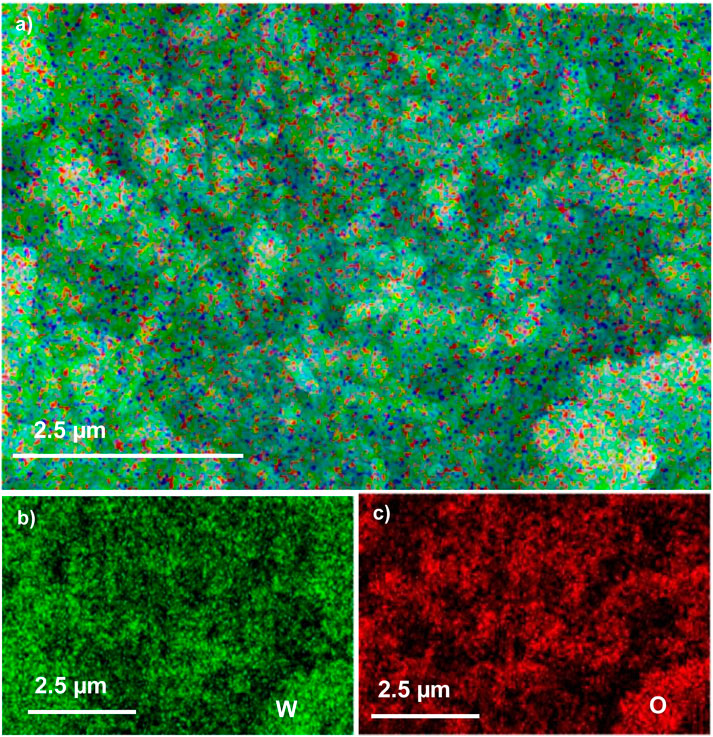
FIGURE 5. The EDX micrograph of (A) WO3-HCl sample, and its corresponding elements mapping of (B) W, and (C) O, based on SEM images of WO3-HCl.
The microstructure of WO3 samples were further investigated using transmission electron microscopy (TEM) and high-resolution transmission electron microscopy (HRTEM) combined with selected area electron diffraction (SAED) technique. The images are shown in Figure 6A–F. It can be observed in Figures 6A, C, E, that the TEM images of WO3-HNO3, WO3-H2SO4 and WO3-HCl respectively, are not really the same. This indicates that, different morphologies of a particular sample could be obtained by using different acid precipitants during synthesis. Figure 6A, E of WO3-HNO3 and WO3-HCl respectively show that WO3-HCl has small nanoparticles, which are more prominent as compared to those of WO3-HNO3. This is in consonance with what was observed in the EDX images. It is observable in Figure 6C that, the WO3-H2SO4 sample consists of cube-like nanostructures similar to the SEM results. The inset of Figures 6B, D, F is the selected area electron diffraction (SAED) image of WO3-HNO3, WO3-H2SO4 and WO3-HCl samples respectively. The bright dots in the SAED of Figure 6B implies that WO3-HNO3 sample is single-crystalline. In Figures 6D, F, the SAED patterns for WO3-H2SO4 and WO3-HCl shows that these samples were single crystalline. The WO3-HCl sample was highly crystalline compared to other samples because very bright SAED spots were observed for this sample, and this agrees with the XRD results; Figures 6B, D, F also shows the corresponding HRTEM of WO3-HNO3, WO3-H2SO4 and WO3-HCl samples respectively. The lattice spacing of 0.386 nm, 0.366 nm and 0.364 nm are attributed to (002), (020) and (200) planes of monoclinic WO3 (Vilic and Llobet, 2016), and this agrees with the XRD results.
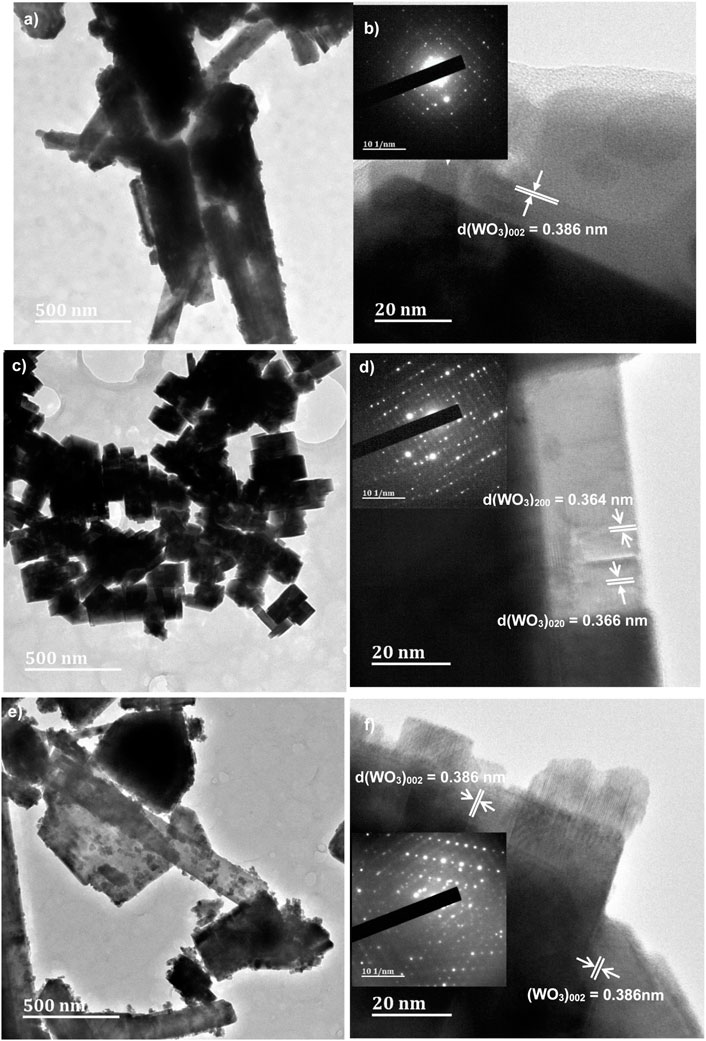
FIGURE 6. High Resolution-Transmission Electron Microscope (HR-TEM) of the acids assisted synthesis of WO3 samples, and the inset SAED images of (A, B) WO3-HNO3, (C, D) WO3-H2SO4 and (E, F) WO3-HCl samples.
The nitrogen adsorption-desorption measurements of WO3-HNO3 and WO3-HCl samples were conducted to get information about their specific surface area and the pore size distribution. Figure 7 reveals the adsorption-desorption isotherms of the samples. The BET surface area analysis was done to further distinguish between WO3-HNO3 and WO3-HCl samples since their morphology from SEM almost looks the same. The results reveal that WO3-HNO3 sample has Brunauer-Emmett-Teller (BET) surface area of 13.65 m2/g and WO3-HCl sample has BET surface area of 11.79 m2/g calculated from adsorption desorption isotherms presented in Figures 7A, B respectively. It is noteworthy that, although WO3-HNO3 sample has larger surface area compared to WO3-HCl, its gas sensing performance was not as good as that of WO3-HCl-this is contrary to expectation (Vilic and Llobet, 2016), (He et al., 2019). The pore size distribution graph of the WO3-HNO3 sample exhibits highest value of 11 nm pore size as shown on the inset Figure 7A; this value is typical of a mesoporous material. On the other hand, the WO3-HCl sample has two peak values (see the inset of Figure 7B), indicating the bimodal porous structure with mesopores and macropores. The high gas sensing performance of WO3-HCl sample can be attributed to its bimodal porous structure which allows sufficient gas adsorption and desorption (Vilic and Llobet, 2016).
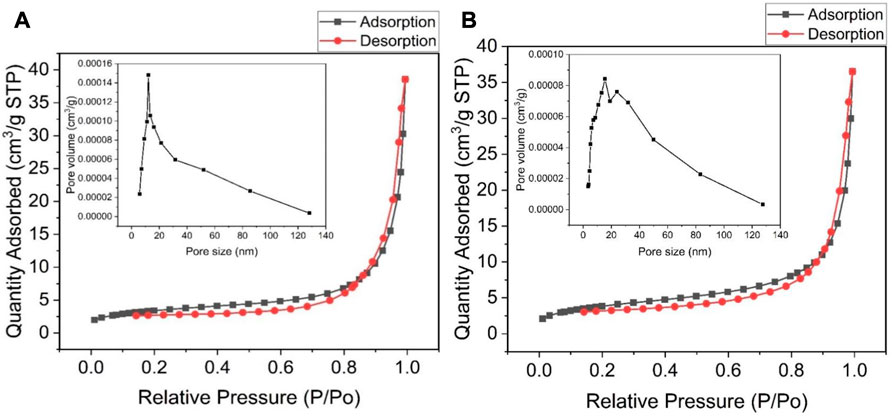
FIGURE 7. Nitrogen adsorption-desorption isotherm of (A) WO3-HNO3, and (B) WO3-HCl, and their corresponding BJH pore size distribution (the insets).
X-ray photo electron spectroscopy (XPS) was performed to investigate the elemental composition and oxidation states of the WO3 samples namely: WO3-HNO3, WO3-H2SO4, and WO3-HCl, as shown in Figure 8. The XPS survey spectrum of WO3-HCl samples shown in Figure 8A confirms the presence of W and O. The survey spectra of the other two samples (WO3-HNO3 and WO3-H2SO4) are presented in Supplementary Figure S1 of the ESI file. On the W 4f spectrum, the peaks corresponding to W 4f 5/2 and W 4f 7/2 of WO3 samples are ascribed to W+6 oxidation state as shown in Figures 8B, D, F. indicating the formation of pure WO3 samples. This was observed from the peaks having binding energies range of 35.5–35.8 eV and 37.6–37.9 eV signifying the spin-orbit split peaks of W 4f 7/2 and W 4f 5/2 respectively (Vilic and Llobet, 2016), (Cao et al., 2022). A very small shift in energy peaks amongst the samples was observed. The O 1s spectra in Figures 8C, E, G of WO3-HNO3, WO3-H2SO4 and WO3-HCl samples respectively, show that all the samples have lattice oxygen (OL) and oxygen vacancies (OV) as it is observed by their corresponding binding energies.
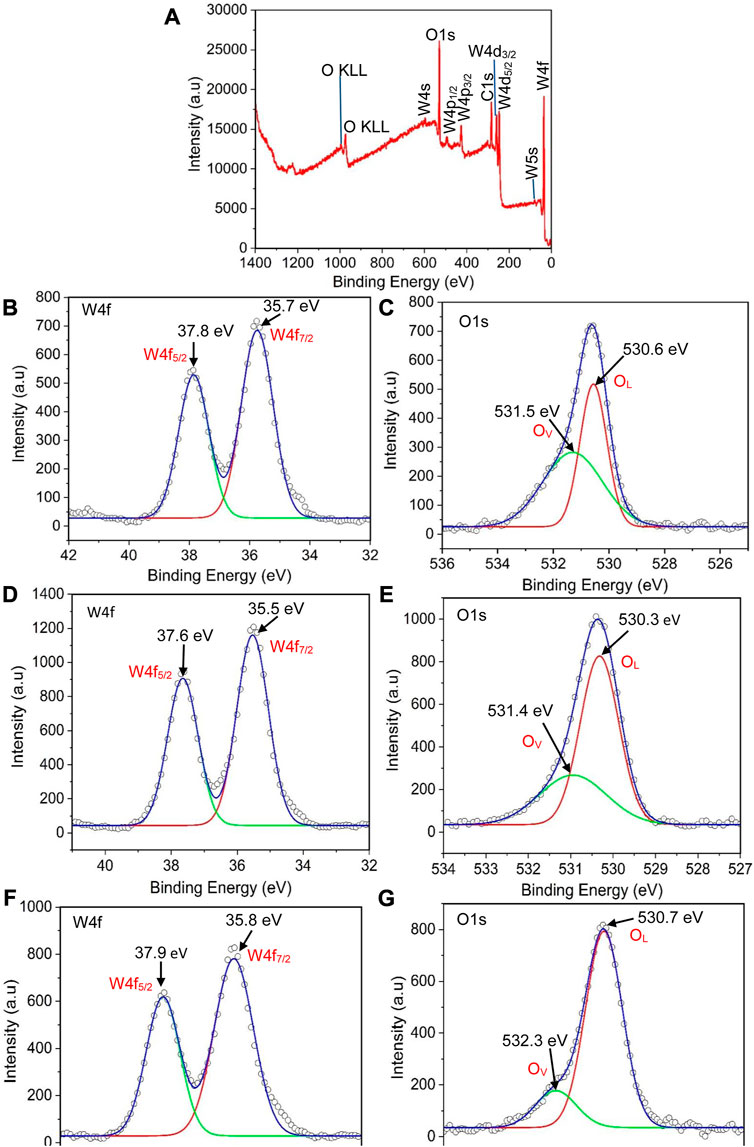
FIGURE 8. (A) XPS survey spectrum of WO3-HCl sample, (B, C) the W 4f and O1s spectra of WO3-HNO3, (D, E), the W 4f and O1s spectra of WO3- H2SO4, and (F, G) the W 4f and O1s spectra of WO3- H2SO4.
3.2 Gas sensing properties
To investigate the gas sensing performance of the WO3-based, the sensors were operated at different operating temperatures (75°C, 125°C, 175°C and 225°C), while detecting H2S target gas, to determine their optimal working temperatures. The sensors based on WO3-HNO3, WO3-H2SO4 and WO3-HCl, exhibited their highest response towards 150 ppm of H2S at the operating temperature of 125°C. Figure 9A demonstrates the operating temperature dependence response of the WO3-based sensors. The sensors’ response values towards H2S gas were 125.75, 141.64 and 1394.04 respectively as shown in Figure 9A. It is quite evident that, the optimal operating temperature of the sensors is 125°C. It is noticeable from the SEM results (Figure 2) that both WO3-HNO3 and WO3-HCl have almost similar surface morphology, which is hierarchical nanostructures. However, small nanoparticles can be observed on WO3-HCl. The WO3-H2SO4 sample consists of cube-like structures. From XRD results (Figure 1), it was observed that these WO3-based sensors consist of different crystallite sizes with the WO3-HCl sensor having the lowest crystallite size of 18 nm. Therefore, the variety in surface morphology and difference in crystallite sizes of the WO3-based sensors might have contributed to different gas sensing responses towards H2S target gas. The dynamic response curves of WO3-HNO3, WO3-H2SO4 and WO3-HCl based sensors towards different concentrations of H2S gas (5 ppm, 10 ppm, 20 ppm, 40 ppm, 60 ppm, 80 ppm, 100 ppm and 150 ppm) at 125°C are shown in Figures 9B–D. All the sensors were able to respond or recover quickly towards different concentrations of H2S gas, indicating a good reversibility. The increase in sensor responses were observed as the concentration increases. The sensor based on WO3-HCl sample, especially, exhibited a good response of 36.91 towards 5 ppm H2S as shown in Figure 9D, which is higher than 5.32 and 13.24 of WO3-HNO3 and WO3-H2SO4 respectively. The results are shown in Figures 9B–C. These results indicate that WO3-HCl based sensor is a good candidate for low concentration detection of H2S. It can be observed from Figures 9B–D that the sensors have different initial currents. Amongst other sensors, WO3-HCl based sensor had the lowest initial current of 3.92 × 10⁻⁶ mA in air, suggesting a highly resistive-type sensor with resistance of 1276MΩ (calculated using the 5 V bias voltage). This was due to different electrical properties induced in the materials by using various acids precipitants (HNO3, H2SO4 and HCl) for synthesis. From Figures 9B–D, the sensors based on WO3-HNO3, WO3-H2SO4 and WO3-HCl samples showed different response times of 138 s, 190 s and 80 s with corresponding recovery times of 110 s, 135 s and 90 s. No significant changes were observed on the response and recovery times of the sensors as the concentration of H2S increased. WO3-HCl based sensor showed short response and recovery times-a desirable quality of gas sensors. The highly sensitive gas sensor has higher response than the other sensors, the sensitivity of the gas sensors can be determined from the slope of the graph of sensor response versus gas concentration.
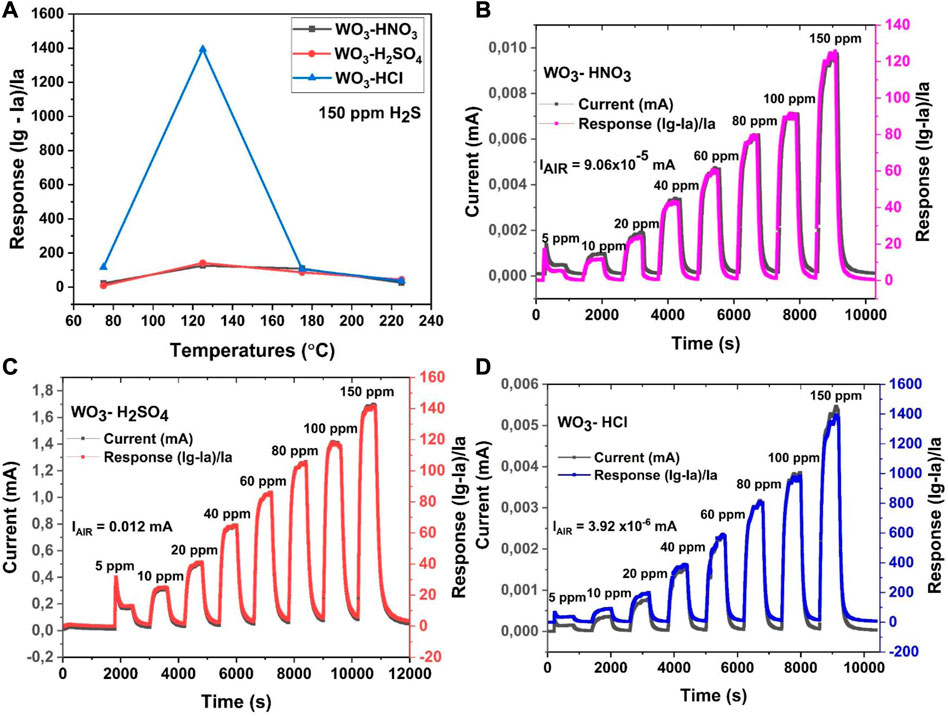
FIGURE 9. (A) Operating-temperature dependence response of WO3 samples towards 150 ppm of H2S, and (B–D) The dynamic response curves of: (B)WO3-HNO3, (C) WO3-H2SO4, and (D) WO3-HCl based sensors: towards 150 ppm of H2S at 125°C.
Figure 10A shows the response/concentration relationship of WO3-HNO3, WO3-H2SO4 and WO3-HCl based sensors towards H2S. The sensors were operated at optimal operating temperature of 125°C. As expected, the response of the sensors increased as gas concentration increased, however the response values of WO3-HCl sensor were very high (sensor response = 1394.04 towards 150 ppm H2S) compared to WO3-HNO3 and WO3-H2SO4 based sensors. The sensitivity of WO3-HCl based sensor was 9.48—A very high value as compared to the other two sensors as shown in Figure 10A. The high sensitivity of WO3-HCl based sensor might have resulted from the fact that WO3-HCl morphology has small nanoparticles, small crystallite size and porous structure as confirmed by XRD and BET results respectively. WO3-HCl consist also of high lattice oxygen and oxygen vacancies as confirmed by XPS results, this might also have contributed to the relatively high sensor response of WO3-HCl towards H2S gas (Vilic and Llobet, 2016; Gupta et al., 2019). The WO3 sample synthesized using HCl acid precipitant (WO3-HCl) exhibited high sensor response towards H2S gas compared to the other two WO3 samples synthesized using HNO3 and H2SO4 acid precipitants (WO3-HNO3 and WO3-H2SO4). In comparison with previous works, the WO3-HCl based sensor demonstrated excellent gas sensing ability towards H2S gas (Szilágyi et al., 2010; Kruefu et al., 2015; Vilic and Llobet, 2016; Gupta et al., 2019; Wang et al., 2020). Low concentration detection ability of WO3-HCl based sensor was also observed as shown in Figure 9A. the sensor also demonstrate sensitivity towards low concentration (5 ppm) of H2S was at low operating temperature of 75°C, and the sensor response was found to be 4.32; whereas the other two sensors based on WO3-HNO3 and WO3-H2SO4 showed no low concentration detection ability at 75°C. Therefore, WO3-HCl based sensor stood out to be the best performing sensor. Selectivity is a significant property of gas sensors as it is the ability of the gas sensor to selectively detect one gas when exposed to different gases. The selectivity of the WO3-HNO3, WO3-H2SO4 and WO3-HCl based sensors were tested as shown in Figure 10B. The sensors were exposed to highest acceptable concentrations of different gases of LPG, NH3, CH4, H2, CO2 and H2S at their optimal temperature of 125°C. It can be observed that WO3-HCl sensor was highly selective towards H2S gas, therefore WO3-HCl sensor is the best candidate for H2S detection. To further investigate the high performance of WO3-HCl sensor, repeatability was also measured. This, however, was conducted 18 months after the initial test.
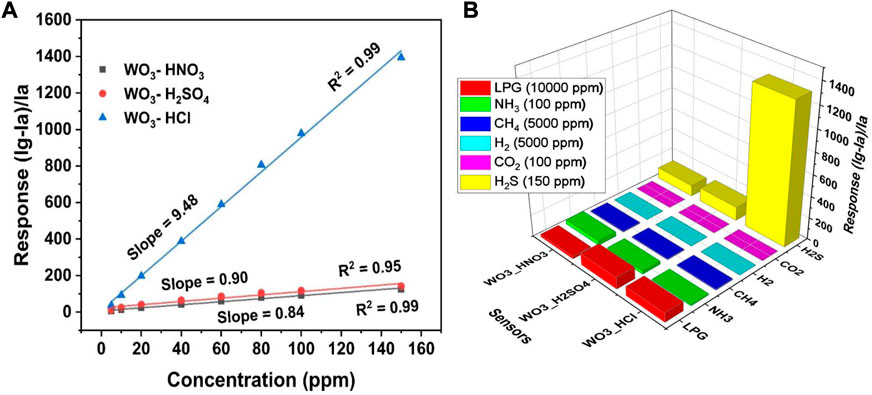
FIGURE 10. (A) Sensors’ response versus H2S concentrations at 125°C, showing the sensitivity of WO3- based sensors, and (B) 3D selectivity plot of the WO3 -based sensor towards, LPG, NH3, CH4, H2, CO2, H2S, at 125°C.
Figure 11A shows three reversible cycles of response and recovery curves towards 100 ppm and 150 ppm of H2S of the WO3-HCl sensor at 125°C. The difference in sensors’ response towards 100 ppm and 150 ppm of H2S is about 400. This shows the ability of the sensor to distinguish between different gas concentrations. The gas sensor response of 132.91 and 281.20 towards 100 ppm and 150 ppm of H2S respectively, was observed after a period of 18 months following the initial measurements. The long-term stability of WO3-HCl based sensor was also evaluated by measuring 150 ppm of H2S after 18 months from initial measurements. The measurement was carried out at the optimal operating temperature of 125°C and the result is shown in Figure 11B. It should be noted that, the sensor was tested several times and under diverse operating conditions before the stability test was eventually conducted. The sensor’s response after 18 months’ period is still relatively high, considering the report of the previous works. The decrease in gas sensor response of WO3-HCl based sensor as compared to the initial value could be owing to its exposure to different working condition over a long period of time.
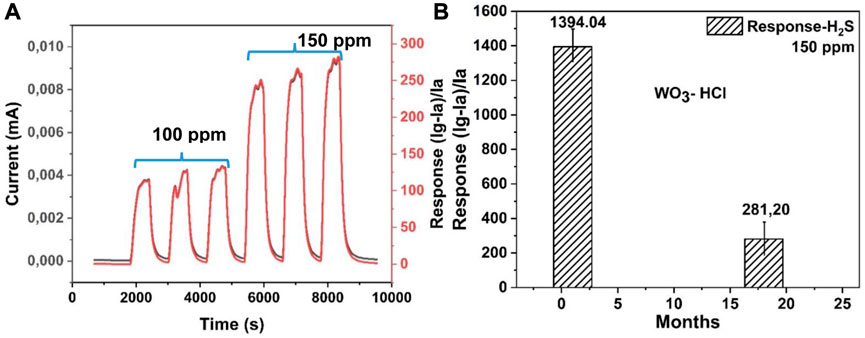
FIGURE 11. (A) Three cycles of response-recovery curves for WO3-HCl based sensor towards 100 ppm and 150 ppm H2S gas at 125°C, showing repeatability, and (B) the long-term stability chart of the WO3-HCl based sensor.
Table 2 summarizes the gas sensing performance in various recent works on H2S sensing as compared to the current study. WO3-HCl based sensor showed the highest gas sensing response towards H2S compared to other sensors, partly, due to its porous hierarchical nanostructures. Therefore, the sensor based on WO3-HCl sample demonstrated high prospect for H2S detection and monitoring to ensure safe working environments.
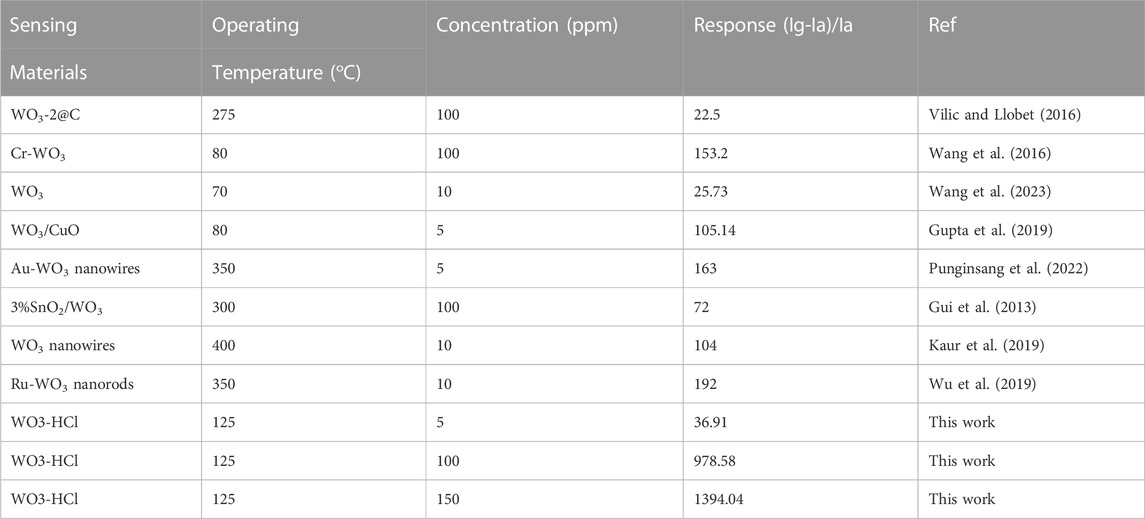
TABLE 2. Comparison of hydrogen sulphide (H2S) gas sensing performance of WO3-HCl based sensor with other sensing materials in previous reports.
3.3 Gas sensing mechanism
Figure 12A is a schematic of the WO3-HCl sample drop-casted on an alumina substrate. The WO3 sensing material is a resistive-type metal oxide semiconductor, and the change of its resistance or current results from the surface reaction of oxygen ions and the target gas. Oxygen molecules capture electrons from the conduction band of WO3 to form oxygen ions (
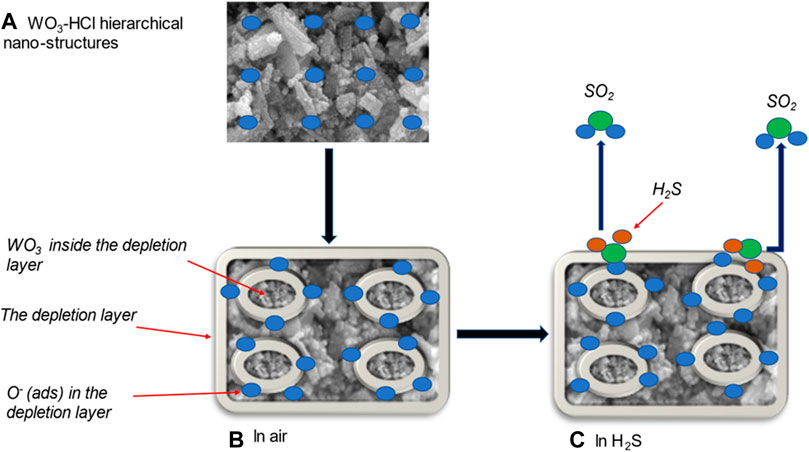
FIGURE 12. (A) hierarchical structure of HCl-precipitated WO3 sample; gas sensing mechanism of WO3-HCl based sensor (B) in air, and (C) towards H2S at 125°C.
When the WO3 sensing material was exposed to H2S at 125°C, the gas was adsorbed on the surface of the sensing layer and react with the pre-adsorbed oxygen ions as expressed in the Eq. 1.6 and in Figure 12C (Poongodi et al., 2017).
As the reducing gas H2S react with oxygen ions on the surface of WO3, it released the electrons back to the conduction band of WO3, which caused the decrease in resistance or increase in current as illustrated in Figures 9B–D, therefore decreasing the thickness of the depletion layer which results in the increased carrier concentration and electron mobility of WO3 nanostructures as indicated in Figure 12C, This mechanism confirms a typical n-type semi-conducting behaviour towards a reducing gas (Poongodi et al., 2017; Kaur et al., 2019). Previous studies have reported that, the reaction that occurs between WO3 metal oxide and H2S gas at a temperature range of 500–800K, is described by Eq. 1.7 (Poongodi et al., 2017; Jain and Khanna, 2021).
Where e- is an electron with negative charge, Ov is the oxygen vacancy formed from the reduction of W6+ (in WO3) to W4+ (in WS2) (Jain and Khanna, 2021). When the flow of H2S gas is stopped, the WS2 layer oxidises back to WO3 in the gas chamber by the reaction illustrated in Eq. 1.8 (Poongodi et al., 2017):
At this point, current returns to its original value (Poongodi et al., 2017). The observed excellent gas sensing performance of WO3-HCl based sensor could be owing to the following reasons:
First, the hierarchical structure of WO3-HCl based sensor possesses mesoporous features as confirmed by BET results. The bimodal porous structures facilitated the rapid adsorption and desorption of gas molecules, resulting in the enhanced sensing performance with respect to response time, recovery time, and high gas response. Second, WO3-HCl was single crystalline, and its surface was more reactive due to more adsorption sites for the target gas, which could have been brought about by the chemical state and the abundance of W+6 ions in the sample, as confirmed by the XPS. The presence of oxygen vacancies as shown by XPS analysis also contributed to the high sensor’s response.
4 Conclusion
In this work, WO3 samples (WO3-HNO3, WO3-H2SO4 and WO3-HCl) were synthesized using hydrothermal method, different acids: HNO3, H2SO4, and HCl: were used as precipitants for the synthesize of the samples. WO3-HCl sample demonstrated an excellent gas sensing performance towards H2S gas at the operating temperature of 125°C. It also exhibited short response and recovery times, high sensitivity, and clear selectivity towards H2S gas. Enhanced sensing performance of WO3-HCl sample is attributable to its bimodal porous hierarchical structures, high reactive surface with adsorbed oxygen. Therefore, cost effective WO3-HCl based sensor is expected to be a solution for the efficient detection and monitoring of H2S low operating temperatures.
Data availability statement
The original contributions presented in the study are included in the article/Supplementary Material, further inquiries can be directed to the corresponding author.
Author contributions
SO and TM, investigation; and writing—original draft, CN, writing-review and editing, HS, XPS analysis, writing-review and editing to the final version of the manuscript, and SN, conceptualization; Methodology; Supervision; Formal analysis; Writing—review & editing. All authors contributed to the article and approved the submitted version.
Acknowledgments
The authors affiliated to UNIZULU wish to thank the research office for research support. National Research Foundation is also duly acknowledged for its consistent support to carry out research nationwide. The authors wish to acknowledge the University of the Free State for its continuing support in the surface science characterisation and analysis.
Conflict of interest
The authors declare that the research was conducted in the absence of any commercial or financial relationships that could be construed as a potential conflict of interest.
Publisher’s note
All claims expressed in this article are solely those of the authors and do not necessarily represent those of their affiliated organizations, or those of the publisher, the editors and the reviewers. Any product that may be evaluated in this article, or claim that may be made by its manufacturer, is not guaranteed or endorsed by the publisher.
Supplementary material
The Supplementary Material for this article can be found online at: https://www.frontiersin.org/articles/10.3389/fsens.2023.1143080/full#supplementary-material
References
Cao, .S., Sui, N., Zhang, P., Zhou, T., Tu, J., and Zhang, T. (2022). TiO2 nanostructures with different crystal phases for sensitive acetone gas sensors. J. Colloid Interface Sci. 607, 357–366. doi:10.1016/j.jcis.2021.08.215
Chen, .M., Zou, L., Zhang, Z., Shen, J., Li, D., Zong, Q., et al. (2018). Tandem gasochromic-Pd-WO3/graphene/Si device for room-temperature high-performance optoelectronic hydrogen sensors. Carbon 130, 281–287. doi:10.1016/j.carbon.2018.01.013
Cheng, J., Liu, J., Wang, T., Sui, Z., Zhang, Y., and Pan, W. P. (2019). Reductions in volatile organic compound emissions from coal-fired power plants by combining air pollution control devices and modified fly ash. Energy & fuels 33, 2926, doi:10.1021/acs.energyfuels.8b04277
David, .S. S., Veeralakshmi, S., Sandhya, J., Nehru, S., and Kalaiselvam, S. (2020). Room temperature operatable high sensitive toluene gas sensor using chemiresistive Ag/Bi2O3 nanocomposite. Sensors Actuators B Chem.
Gui, Y., Dong, F., Zhang, Y., Zhang, Y., and Tian, J. (2013). Preparation and gas sensitivity of WO3 hollow microspheres and SnO2 doped heterojunction sensors. Mater. Sci. Semicond. Process. 16, 1531, doi:10.1016/j.mssp.2013.05.012
Gupta, .S. P., Patil, V. B., Tarwal, N. L., Bhame, S. D., Gosavi, S. W., Mulla, I. S., et al. (2019). Enhanced energy density and stability of self-assembled cauliflower of Pd doped monoclinic WO3 nanostructure supercapacitor. Mater. Chem. Phys. 225, 192–199. doi:10.1016/j.matchemphys.2018.12.077
He, .M., Xie, L., Zhao, X., Hu, X., Li, S., and Zhu, Z. G. (2019). Highly sensitive and selective H2S gas sensors based on flower-like WO3/CuO composites operating at low/room temperature. J. Alloys Compd. 788, 36–43. doi:10.1016/j.jallcom.2019.01.349
Jain, .R. K., and Khanna, A. (2021). CuO-doped WO3 thin film H2S sensors. Sensors Actuators B Chem. 343, 130153. doi:10.1016/j.snb.2021.130153
Johnson, .M. E., Zhang, Q., and Wang, D. (2020). Kxwo is a novel ferroelectric nanomaterial for application as a room temperature acetone sensor. Nanomaterials 10, 225. doi:10.3390/nano10020225
Karaduman Er, .I., Sarf, F., and Yakar, E. (2022). Investigation of H2S gas sensing performance of Ni: WO3 films at room temperature: Nickel precursor effect. J. Mater. Sci. Mater. Electron. 33, 3397–3410. doi:10.1007/s10854-021-07537-3
Kaur, N., Zappa, D., Poli, N., and Comini, E., 2019. Integration of VLS-grown WO3 nanowires into sensing devices for the detection of H2S and O3. ACS omega, 4(15), pp.16336–16343.
Kim, J., and Yong, K. (2011). Mechanism study of ZnO nanorod-bundle sensors for H2S gas sensing. J. Phys. Chem. C 115, 7218, doi:10.1021/jp110129f
Kolhe, .P. S., Shinde, A. B., Kulkarni, S. G., Maiti, N., Koinkar, P. M., and Sonawane, K. M. (2018). Gas sensing performance of Al doped ZnO thin film for H2S detection. J. Alloys Compd. 748, 6–11. doi:10.1016/j.jallcom.2018.03.123
Kruefu, .V., Wisitsoraat, A., Tuantranont, A., and Phanichphant, S. (2015). Ultra-sensitive H2S sensors based on hydrothermal/impregnation-made Ru-functionalized WO3 nanorods. Sensors Actuators B Chem. 215, 630–636. doi:10.1016/j.snb.2015.03.037
Lavanya, .N., Anithaa, A. C., Sekar, C., Asokan, K., Bonavita, A., Donato, N., et al. (2017). Effect of gamma irradiation on structural, electrical and gas sensing properties of tungsten oxide nanoparticles. J. Alloys Compd. 693, 366–372. doi:10.1016/j.jallcom.2016.09.137
Liu, .Y., Han, F., Liu, W., Cui, X., Luan, X., and Cui, Z. (2020). Process-based volatile organic compound emission inventory establishment method for the petroleum refining industry. J. Clean. Prod. 263, 121609. doi:10.1016/j.jclepro.2020.121609
Park, .S., Kim, S., Kheel, H., Hyun, S. K., Jin, C., and Lee, C. (2016). Enhanced H2S gas sensing performance of networked CuO-ZnO composite nanoparticle sensor. Mater. Res. Bull. 82, 130–135. doi:10.1016/j.materresbull.2016.02.011
Poongodi, .S., Kumar, P. S., Mangalaraj, D., Ponpandian, N., Meena, P., Masuda, Y., et al. (2017). Electrodeposition of WO3 nanostructured thin films for electrochromic and H2S gas sensor applications. J. Alloys Compd. 719, 71–81. doi:10.1016/j.jallcom.2017.05.122
Punginsang, .M., Zappa, D., Comini, E., Wisitsoraat, A., Sberveglieri, G., Ponzoni, A., et al. (2022). Selective H2S gas sensors based on ohmic hetero-interface of Au-functionalized WO3 nanowires. Appl. Surf. Sci. 571, 151262. doi:10.1016/j.apsusc.2021.151262
Shen, S. K., Cui, X. L., Guo, C. Y., Dong, X., Zhang, X. F., Cheng, X. L., et al. (2021). Sensing mechanism of Ag/α-MoO3 nanobelts for H2S gas sensor. Rare Met. 40, 1545, doi:10.1007/s12598-020-01647-3
Simion, .C. E., Somacescu, S., Teodorescu, V. S., Osiceanu, P., and Stanoiu, A. (2018). H2S sensing mechanism of SnO2-CuWO4 operated under pulsed temperature modulation. Sensors Actuators B Chem. 259, 258–268. doi:10.1016/j.snb.2017.12.027
Sun, .C., Shao, J., Wang, Z., Liu, H., Li, Z., Zhang, H., et al. (2022). CuO-sensitized amorphous ZnSnO3 hollow-rounded cubes for highly sensitive and selective H2S gas sensors. Sensors Actuators B Chem. 362, 131799. doi:10.1016/j.snb.2022.131799
Szilágyi, .I. M., Saukko, S., Mizsei, J., Tóth, A. L., Madarász, J., and Pokol, G. (2010). Gas sensing selectivity of hexagonal and monoclinic WO3 to H2S. Solid state Sci. 12, 1857–1860. doi:10.1016/j.solidstatesciences.2010.01.019
Van Toan, .N., Hung, C. M., Hoa, N. D., Van Duy, N., Le, D. T. T., Hoa, N. T. T., et al. (2021). Enhanced NH3 and H2 gas sensing with H2S gas interference using multilayer SnO2/Pt/WO3 nanofilms. J. Hazard. Mater. 412, 125181. doi:10.1016/j.jhazmat.2021.125181
Vilic, .T., and Llobet, E. (2016). Nickel doped WO3 nanoneedles deposited by a single step AACVD for gas sensing applications. Procedia Eng. 168, 206–210. doi:10.1016/j.proeng.2016.11.163
Wang, .C., Zhang, Y., Sun, X., Sun, Y., Liu, F., Yan, X., et al. (2020). Preparation of Pd/PdO loaded WO3 microspheres for H2S detection. Sensors Actuators B Chem. 321, 128629. doi:10.1016/j.snb.2020.128629
Wang, .X., Lu, J., Han, W., Cheng, P., Wang, Y., Sun, J., et al. (2022). Carbon modification endows WO3 with anti-humidity property and long-term stability for ultrafast H2S detection. Sensors Actuators B Chem. 350, 130884. doi:10.1016/j.snb.2021.130884
Wang, Y., Liu, B., Xiao, S., Wang, X., Sun, L., Li, H., et al. (2016). Low-temperature H2S detection with hierarchical Cr-doped WO3 microspheres. ACS Appl. Mater. interfaces 8, 9674, doi:10.1021/acsami.5b12857
Wang, .Y., Zhang, S., Xiao, D., Wang, S., Zhang, T., Yang, X., et al. (2023). CuO/WO3 hollow microsphere PN heterojunction sensor for continuous cycle detection of H2S gas. Sensors Actuators B Chem. 374, 132823. doi:10.1016/j.snb.2022.132823
Wu, .C. H., Zhu, Z., Huang, S. Y., and Wu, R. J. (2019). Preparation of palladium-doped mesoporous WO3 for hydrogen gas sensors. J. Alloys Compd. 776, 965–973. doi:10.1016/j.jallcom.2018.10.372
Keywords: metal oxides, monoclinic, acid precipitants, gas sensing, H2S sensors
Citation: Mpanza T, Ogundipe SA, Ndlangamandla CL, Swart HC and Nkosi SS (2023) The effect of acids precipitants on the synthesis of WO3 hierarchical nanostructures for highly selective and sensitive H2S detection. Front. Sens. 4:1143080. doi: 10.3389/fsens.2023.1143080
Received: 12 January 2023; Accepted: 21 February 2023;
Published: 17 March 2023.
Edited by:
Abdullah A. A. Ahmed, Thamar University, YemenReviewed by:
Viruntachar Kruefu, Maejo University, ThailandYang Wang, Northeast Electric Power University, China
Copyright © 2023 Mpanza, Ogundipe, Ndlangamandla, Swart and Nkosi. This is an open-access article distributed under the terms of the Creative Commons Attribution License (CC BY). The use, distribution or reproduction in other forums is permitted, provided the original author(s) and the copyright owner(s) are credited and that the original publication in this journal is cited, in accordance with accepted academic practice. No use, distribution or reproduction is permitted which does not comply with these terms.
*Correspondence: Steven S. Nkosi, c3RldmVuLnNvbGV0aHUubmtvc2lAZ21haWwuY29t
 Thokozani Mpanza
 Sunday A. Ogundipe1
 Hendrik C. Swart
 Steven S. Nkosi