 N. Mekgoe
 N. Mabuba
 K. Pillay
- Department of Chemical Sciences, University of Johannesburg, Johannesburg, South Africa
In this study a nanocomposite of graphitic carbon nitride-silver polyvinylpyrrolidone (gCN-AgPVP) was fabricated for the electrochemical detection of paracetamol (PAR). The nanocomposite of gCN-AgPVP showed superior electrocatalytic ability for PAR detection since it is selectively adsorbed by electrostatic interactions of the nanocomposite of gCN-AgPVP. This selective adsorption is also facilitated by charge assisted interactions between the PAR and gCN-AgPVP surfaces. The stability of the GCE/gCN-AgPVP was characterised using cyclic voltammetry (CV) at potentials ranging from −0.2 to +0.7 V and a scan rate of 50 mV/s. Square wave voltammetry (SQWV) was employed to characterise and detect PAR. The analysis was conducted on modified GCE/gCN-AgPVP in 0,1M phosphate buffer solution (PBS) and pH 6.1. GCE/gCN-AgPVP showed excellent performance in detecting PAR in the concentration range of 0.2–100 µM with a correlation coefficient of 0.9951 respectively. The calculated detection limit (LOD) was 0.079 µM.
1 Introduction
Carbon nanomaterials, have gained recognition in analytical chemistry for sensor modification due to their unique properties (Kang et al., 2010). Graphitic carbon nitride (gCN) nanostructures have pyridinic and graphitic groups which are rich in nitrogen thereby rendering them suitable for electrocatalytic applications (Kesavan and Chen, 2020a). In the recent decades, graphitic carbon nitride (gCN) has acquired a lot of interest as a new two-dimensional material (Wen et al., 2017). gCN has been used in catalysis, electronics, biomedical imaging and sensor field due to its unique physical and chemical properties (Wang and Wang, 2022). The gCN and its composites are applied in manufacturing fluorescence, photoelectrochemical, electrogenic chemiluminescence, optical, and electrochemical sensors (Zhang et al., 2014; Hang et al., 2017). Several published articles have reported gCN as a modifier material and it has formed composites with materials such as metals, semiconductors, graphene, etc. (Adhikari et al., 2015). Contrarily, gCN has inferior water solubility and a bulky size which renders it unsuitable for electrochemical applications. In an attempt to improve water-solubility, and to achieve low toxicity and high photoluminescence quantum yields direct ultrasonication of bulk gCN in water has been performed (Vinoth et al., 2021). Graphitic carbon has a limited electrochemical sensing performance due to its chemical inertness, specific surface area and conductivity (Zhang et al., 2014). However, due to some drawbacks such as low electrical conductivity and a bulk limited structure, the application of this structure was limited (Dai et al., 2017; Zhao et al., 2017). There have been few reports on the development of electrochemical sensors based on gCN modification with nanomaterials such as polymers and metal nanoparticles to broaden their application (Zhang et al., 2014; Adhikari et al., 2015; Afshari et al., 2019; Munusamy et al., 2021; Vinoth et al., 2021). The composite of gCN modified with silver (Ag) and polyvinylpyrrolidone was therefore strategically prepared to achieve excellent electronic band structure, stability, and conductivity which are the key characteristics of a good electrochemical sensor (Veerakumar et al., 2018; Lütfi and Atar, 2019). The use of silver and Polyvinylpyrrolidone will increase the surface area of the modified material, and this will make them less prone to aggregation. Therefore, gCN was hydrothermally grown on smaller PVP, and Ag nanoparticles to improve conductivity and the surface area of the electrode for the detection of paracetamol.
Paracetamol (acetaminophen) with the IUPAC name N-(4-hydroxyphenyl) ethanamide is known for its antipyretic, analgesic and anti-inflammatory properties which render it suitable for the treatment of fever, miscellaneous pains, coughing and colds (Teker and Aslanoglu, 2020; Annadurai et al., 2021). Paracetamol (PAR) is a weak acid with PKa = 9.5 which is easily retained by cells and is released from the human body as urine (Niedzia, 2019a; Mangaiyarkarasi et al., 2020). Generally, no harmful side effects are observed when it is used in moderation. On the other hand, excessive use may cause kidney damage, gastrointestinal bleeding, rashes liver damage and even lethal effects such as coma or death (Haridas et al., 2021). Only 1–4% of PAR remains unaltered in the urine after human consumption and it is discharged into the sewage systems (Niedzia, 2019b). PAR is often found in aquatic environments, in concentrations ranging from μM to mM due to sewage disposal (Niedzia, 2019b), (Pinyou, Blay, Chansaenpak, Lisnund), because PAR is prescribed for most diseases which means that tons of it are used in a year (Raymundo-pereira et al., 2017). The guidelines recommend maximum concentrations of acetylcysteine of 200 mg/kg in a 4 h period, then 100 mg/kg after 16 h. The detection of paracetamol is therefore imperative and is extensively under investigation globally (Wong et al., 2020).
For this purpose analytical techniques such as high performance liquid chromatography (Palur et al., 2020), spectrophotometry (Khaskheli et al., 2007) and titrimetric methods (Ali et al., 2015), have been used previously. Unfortunately, these methods have also demonstrated shortcomings such as high cost and time consumption, low sensitivity, tedious operation and also require a skilled person to operate the instruments (Analysis, 2003; Fanjul-bolado et al., 2009; Premlatha and Ramesh Bapu, 2018). Due to the electroactive nature of paracetamol, electrochemical detection has been identified as a better method for its detection. This technique offers advantages such as high sensitivity, low cost, less time-consumption, detection of a wide concentration range and renders rapid responses (Fanjul-bolado et al., 2009).
Electrochemical techniques therefore present an excellent alternative for PAR determination as consequently have been extensively applied for the determination of paracetamol in pharmaceutical samples (Burç et al., 2020; Murtada et al., 2020). The most popular working electrodes which have been applied for the electrochemical sensing of PAR include carbon-based electrodes, such as glassy carbon electrodes (GCEs), and screen-printed carbon electrodes (SPCEs) (Boumya et al., 2021) and carbon paste electrodes (CPEs) (Liu et al., 2017; Paul et al., 2020; Saravanan et al., 2021). One of the disadvantages of using conventional electrodes, is difficult oxidation of PAR and poor response due to slow electrode kinetics. For this reason, chemically modified electrodes have become more popular as electrochemical sensors for PAR (Mangaiyarkarasi et al., 2020).
In this study, the fabrication of a novel nanocomposite, namely gCN-AgPVP is reported. It has further been utilised for the electrochemical detection of PAR. According to literature, gCN-AgPVP nanocomposite has not been explored as an electrochemical sensor. In the present work, the synthesis of gCN and gCN-AgPVP nanocomposites was conducted in a series of steps. Then both the nanocomposites were fabricated on GCE and used for selectivity electrochemical assay of paracetamol. In addition, GCE/gCN-AgPVP was applied for the detection of PAR in real paracetamol tablets and gave satisfactory results.
2 Experimental
2.1 Materials and Reagents
Paracetamol, melamine, sodium hydroxide, polyvinylpyrrolidone, disodium hydrogen phosphate, ferro/ferricyanide and sodium dihydrogen phosphate were purchased from Sigma Aldrich (South Africa). Unless otherwise stated chemicals are of analytical grades. HCL and NaOH stock solution was prepared using deionised water, 1 mM paracetamol stock solution was prepared using 0.1M Phosphate buffer (pH 6.1) as supporting electrolyte, deionised water was used for all the solutions that were prepared.
2.2 Apparatus
A field emission scanning electron microscope (FESEM) on a Zeiss Crossbeam 540 FEG SEM coupled with Oxford Instruments energy dispersive X-ray spectrophotometer (EDS) detector (United Kingdom) was used to obtain the SEM images of both the unmodified and nano-modified electrodes. All electrochemical experiments were performed by using an Ivium Compactstat potentiostat (Netherlands). This involved a three-electrode system which included a platinum wire counter electrode, glassy carbon working electrode and Ag/AgCl (3 M KCl) reference electrode. All electrochemical impedance spectroscopy (EIS) measurements were conducted using a bias potential of 0.22 V and frequencies ranging from 100 kHz to 100 mHz. The cyclic voltammetry experimental conditions were as follows: potential of −0.2–1.0 V, E-step of 0.03 V, current range of 1 μA and a scan rate of 50 mV/s in ferro/ferricyanide solution. A Thermo Fisher (ICAP6500 Duo, China) instrument was used for the validation studies which included the use of square wave voltammetry and UV-Vis spectrometry.
2.3 Synthesis of gCN-AgPVP Electrode
Melamine was pyrolyzed to synthesise graphitic carbon nitride. This was achieved by heating melamine (10.0 g) which was placed in a porcelain crucible. The heating was conducted in an electric furnace at a rate of 10°C min−1until 550°C was reached. This temperature was maintained for 4 h (Zhang et al., 2014). The obtained yellow polymer was milled into a powder for further use. Thereafter, 6 g bulk-graphitic nitride (b-gCN) powder in 10 ml deionised water was ultrasonicated for 5 h. The resulting suspension was centrifuged at 6000 rpm for 20 min to remove aggregates. The product which was pale-yellow in colour was dried at 60°C for 24 h to yield gCN. Silver (Ag) modified gCN composite was synthesized by photo deposition: 4 g gCN nanosheets, 100 ml deionised water and 0.01 M AgNO3 were added together and stirred for 30 min. This was followed by the addition of 50 mg of carboxymethyl cellulose (used as a binder) and continuous stirring of the solution for another 30 min. Thereafter the solution was transferred into a cylindrical reactor and irradiated under visible light illumination equipped with UV-cut off filter (Xenon lamp-solar light XPS 300™), the solution was stirred for 2 h and the solution colour changed from yellow to silver-yellow (Ago/cell), the solution was centrifuged at 6000 rpm for 10 min, washed with deionised water and ethanol and air-dried at 60°C for 24 h. Finally, the powder was weighed and stored in an airtight container for further use. Furthermore, 2g of gCN-Ag and 6g of PVP was added into 20 ml of deionised water and stirred for 1h and the mixture was centrifuged, washed with water and ethanol and air dried 60°C for 24 h. Finally, the nanoparticles were stored in an airtight container for further use.
2.4 Preparation and Electrochemical Characterisation of the Modified GCE/gCN-AgPVP
The unmodified GCEs were polished with 1, 0.3 and 0.05 μm alumina powder on a polishing pad. This aluminium powder was first rinsed with deionised water and sonicated with 1:1 deionised-ethanol for 5 min. After cleaning was completed, the electrodes were activated by cyclic voltammetry from −0.2 to 0.7 V in 0.1 M PBS at pH 6 at a scan rate of 50 mV/s. The GCE was modified with graphitic carbon nitride silver polyvinylpyrrolidone nanoparticles (gCN-AgPVP). Afterwards, 10 mg of gCN-AgPVPs was weighed and placed in the flask, 5 ml N, N-dimethylformamide (DMF) and 5 ml of 5%wt nafion (binder) were added. In order to obtain a stable and homogenous mixture (1 mg/ml dispersion) the mixture was sonicated for 30 min at 50 kHz. A total volume of 6 µL (3 × 2 µL portions) of the suspension was dropped onto GCE and the suspension was evaporated at room temperature as shown in Scheme 1. This includes the modification of GCE by the drop-casting method, oxidation mechanism and detection principle of PAR. The modified electrode was reported as gCN-AgPVP. The procedure was repeated for the modification of gCN-Ag electrode. Cyclic voltammetry studies were conducted for 5 scans to reactivate in 0.1 M PBS in a potential range between −0.2 and +0.7 V at a scan rate of 50 mV/s. Scheme 1; shows that the nanomaterial was deposited onto GCE by the drop-casting method. The nanocomposite gCN-AgPVP is formed by electrostatic interactions between Ag, PPVP and gCN. Each material has its function in the material, gCN is not an active material on its own, it requires supporting materials. Silver (Ag) was added to improve the conductivity of the electrode. The addition of AgNPs increase the surface area for bonding on the material (Lütfi and Atar, 2019)- (Teker and Aslanoglu, 2020). AgNP were also reported to have excellent conductivity, greatly enhanced the sensitivity of the GCE electrode. Polymer PVP was added as a host or a support system of the material to avoid leaching during the detection of the PAR. PVP has significant binding ability and can form complexes with many different compounds, as a charge transfer complex compound, it will have electron transfer, atomic rearrangement and chemical bond destruction and formation with Ag elemental substance. In the reaction process, PVP molecules (as a surfactant) are adsorbed on the surface of silver, due to the mutual attraction of intermolecular forces (van der Waals forces), moreover an -O on the hydroxyl group of PVP molecules will combine with Ag to form Ag-O bond, which results in chemical adsorption. When gCN-AgPVP was drop casted onto GCE, the N group on gCN bonds with carbon in the GCE to form a covalent bond. Carbon material with silver improves selectivity because the coordination capacity of the carbonyl groups with the silver cation is based on purely electrostatic cation-dipole interactions. PBS was used as an electrolyte to stabilize the potential of PAR. Another reason why PAR detection is facilitated by the gCN framework is that it contains additional carbon atoms, that will increase the number of active sides thereby enhancing the conductivity of the electrode. gCN and PAR are the only compounds reacting, the NH2 in gCN are active groups. H will attack on the oxidized form of PAR, i.e., N-acetyl-p-quinoneimine and reduced back to PAR. The gCN-AgPVP will oxidize the PAR for detection.
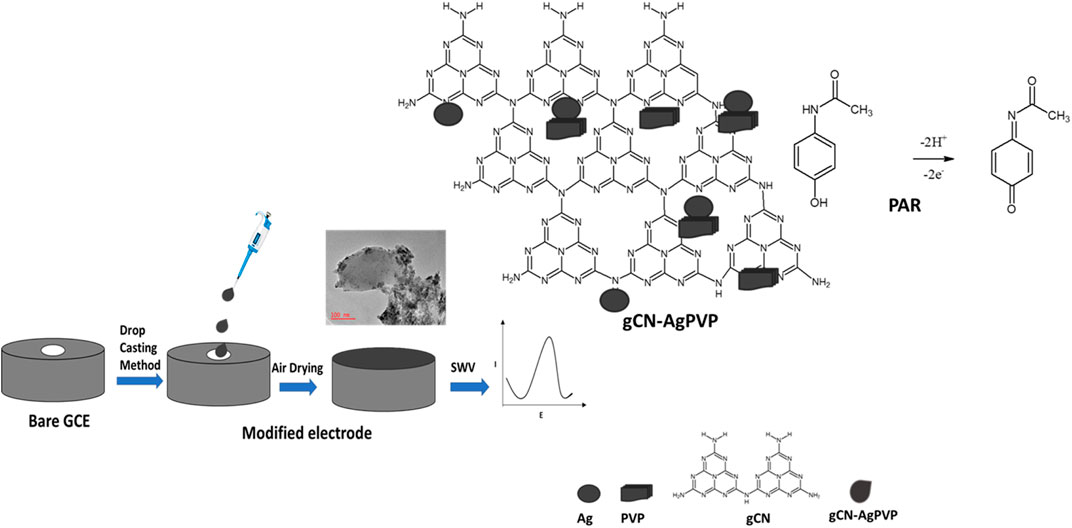
SCHEME 1. Modifying GCE by drop-casting method, oxidation reaction of paracetamol; to N-acetyl-p-benzoquinone imine and detection principle of PAR.
Paracetamol detection, and Cyclic Voltametric (CV) measurements were performed in a static PBS (pH 6.1) at a scan rate of 50 mV/s with the potential range of −0.2–0.8 V. The square wave voltammogram (SQWV) was performed with the parameters as follows: square wave frequency 30.0 Hz, pulse amplitude 50.0 mV, step potential 4 mV, initial potential 0.20 V and final potential 1.00 V.
3 Results and Discussion
3.1 Characterisation of Synthesised gCN-AgPVP Nanoparticles
Figure 1A shows the FTIR spectra of gCN, gCN-Ag, gCN-PVP and gCN-AgPVP. The peaks observed from 884 to 1700 cm−1 are indicative of heterocyclic C=N, C-N and C-N-H stretching modes in gCN from melamine thermal polycondensation reaction (Zhao et al., 2020). The addition of Ag and PVP decreased the intensity of the peaks at 884–1700 cm−1. The prominent change could be observed in GCN-AgPVP composite whereby the graphitic structure of GCN-AgPVP leads to the partial deterioration (Paul et al., 2020). The presence of a tris-triazine group is also evident in the peak observed at 818 cm−1 (Zhu et al., 2020). It is further noted that uncondensed terminal amino groups such as –NH2 and = N groups are present and these are indicated by the broad band observed at 3500 to 3200 cm−1 which confirm the vibration stretching modes of the OH and NH groups (Liu et al., 2016). Figure1A shows that most peaks have decreased in intensity due to Ag-PVP doped on gCN as reason that Ag-PVP strongly interacted with gCN (Zhang et al., 2016; Kesavan and Chen, 2020a; Kesavan and Chen, 2020b). The gCN-AgPVP FTIR spectrum showed lower peak intensities than the corresponding peaks in gCN. This was due to the deposition of Ag and PVP on the gCN.
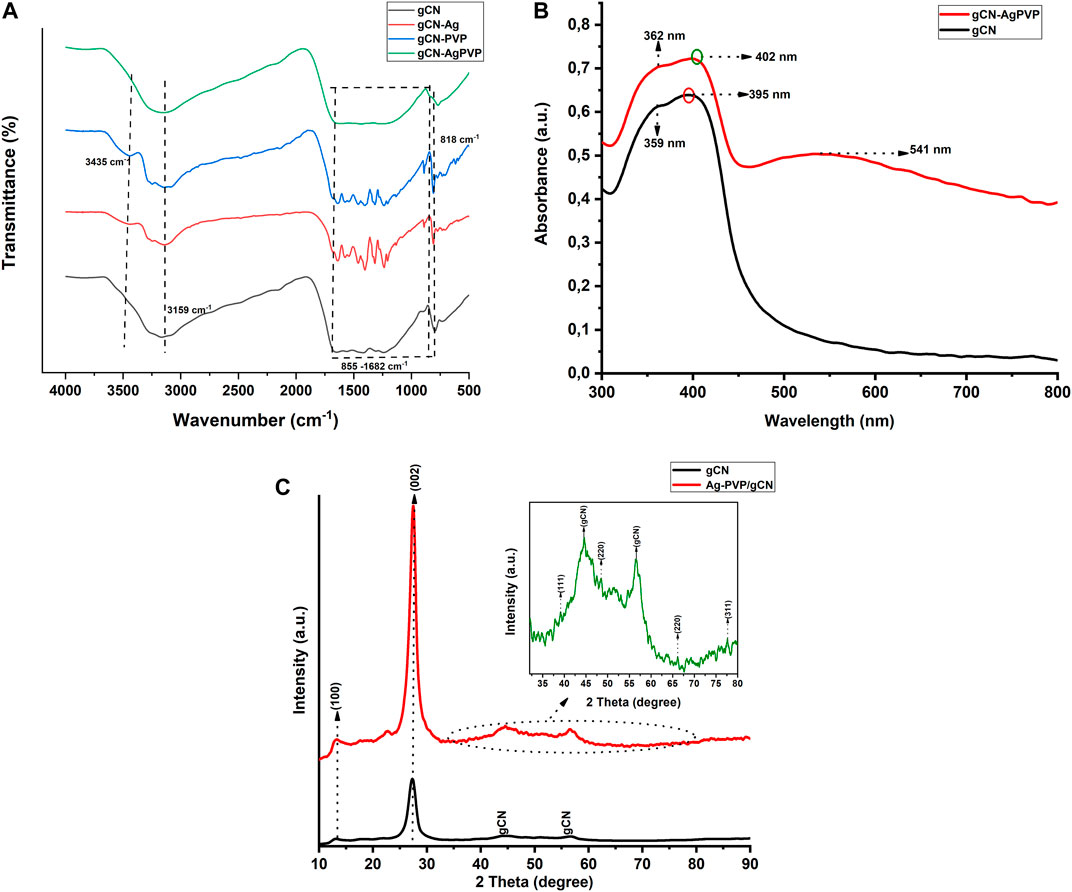
FIGURE 1. (A) FTIR spectra of the gCN, gCN-Ag, gCN-PVP and gCN-AgPVP composite. (B) UV-vis diffusion reflectance spectra of prepared gCN and gCN-Ag PVP composite. (C) XRD patterns of the prepared, a) GCN and b) GCN-AgPVP composite.
The optical absorption spectrum of gCN at ca. 359 and 395 nm is seen in the ultraviolet-visible diffuse reflectance spectra (UV–vis DRS) of gCN and gCN-AgPVP (Figure 1B). These bands are assigned to π −π* and n−π* of triazine unit in gCN (Kesavan and Chen, 2020a). Consequently, three peaks were observed in gCN-AgPVP spectrum. The peaks observed at 362 and 402 nm are assigned to π−π* and n−π* of gCN spectrum while the peak observed at 541 nm are those of Ag-PVP transitions. A slight blue shift was observed in the triazine unit of gCN (Vinoth et al., 2020) and a broad peak of Ag-PVP which is indicated that the Ag-PVP doped with gCN (Kesavan and Chen, 2020a; Vinoth et al., 2020).
The X-ray diffraction patterns for gCN and Ag-PVP/gCN nanocomposite are shown in Figure 1C. The four peaks at 12.7◦and 27.34°, 44.65° and 56.59° in the gCN diffractogram confirms the formation of gCN from thermal polycondensation of melamine (Kesavan and Chen, 2020a). The diffraction peaks of Ag-PVP in gCN was observed while peaks of pure Ag are 39.07°, 47.47°, 66.11°, 77.29 which are corresponding to (111), (200), (220), and (311) planes which matched with JCPDS65-2871 (Kesavan and Chen, 2020a). The other peaks were increased because of Ag-PVP effectively doped on CN (Zhang et al., 2016; Saeb and Asadpour-Zeynali, 2022).
The morphology of the synthesized gCN-AgPVP and gCN are illustrated by FE SEM images in Figures 2A,B at the same magnifications. Figure 2A shows the SEM image of GCN in which the material is dispersed homogeneously and the nanoparticles were agglomerated. Figure 2B SEM shows image of gCN-AgPVP agglomerated nanoparticles. The small size and large surface energy of the nanocrystals result in agglomeration. Further effects of the small size of the spherical particles and very thin layered structures, include a possible increase in the surface area which results in improved surface interaction between the gCN-Ag molecules with the PVP surface. The microstructured layers are also very attractive for use in sensors. The EDX spectrum of gCN and gCN-AgPVP in Figure 2C verifies the following elemental composition: C (43.74) and N (56.26%). In Figure 2D, the elemental composition of gCN-AgPVP is Ag (3.88%), N (60.11%), C (33.69%) and O (2.33%). Therefore, the addition of Ag (3.88%) was verified by the EDX spectrum of gCN-AgPVP.
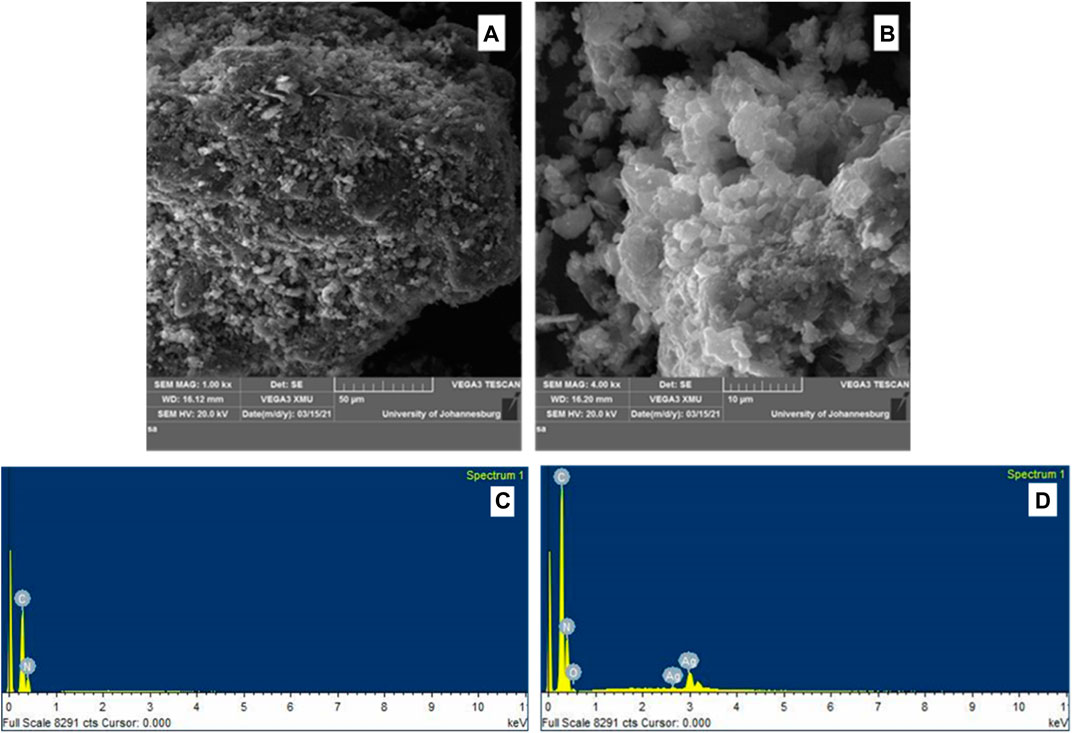
FIGURE 2. FESEM micrographs of (A) gCN, (B) gCN-AgPVP, and EDX spectrum of (C) gCN and (D) EDX spectrum gCN-AgPVP.
Transmission electron microscopy (TEM) was also used to determine particle size. Figures 3A,B shows TEM micrographs of gCN-AgPVP which were recorded at magnifications 200 and 100 nm. Figure 3A shows the agglomerated dark nanoparticles which were observed at 200 nm. From Figure 3B, the dark particles represented Ag-PVP nanoparticles attached to the white gCN for the formation of the gCN-AgPVP composite (Sanghavi and Srivastava, 2010; Liu et al., 2021). Figure 3C shows that the average particle size of particles lies between 8 and 18 nm.
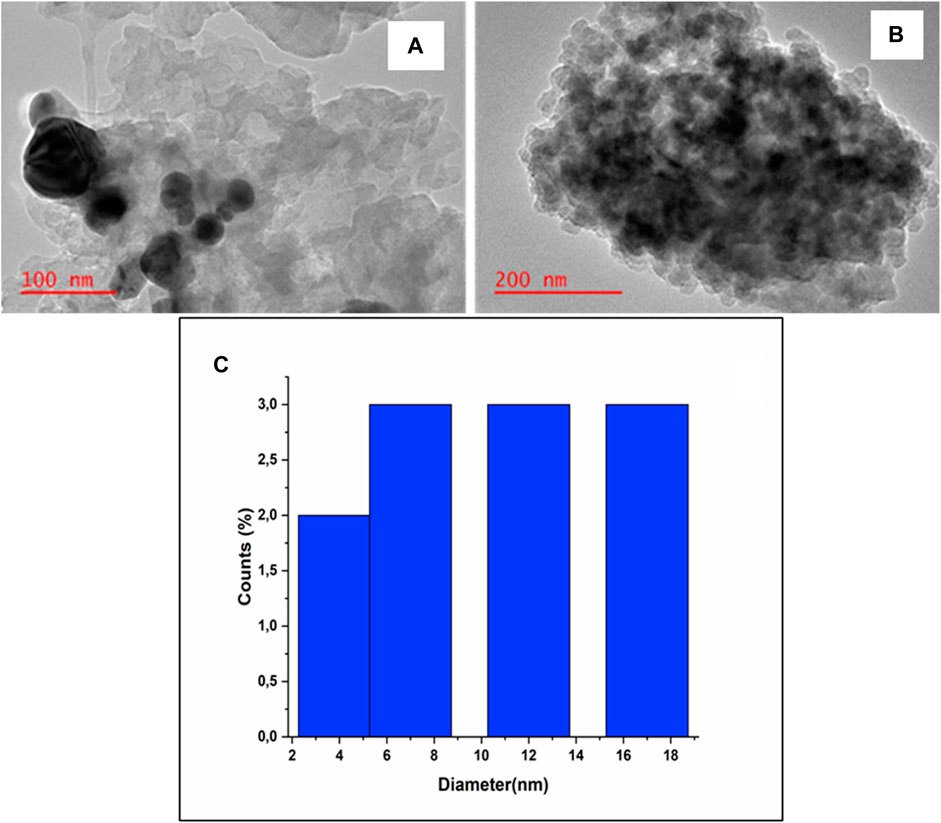
FIGURE 3. TEM images of: (A) gCN and (B) gCN-AgPVP, (C) histogram particle size distribution.
3.2 Characterisation of Electrochemical Behaviour of the Modified Electrodes
The electrochemical sensing of the bare GCE, GCE/gCN, GCE/gCN-Ag, GCE/PVP and GCE/gCN-AgPVP was characterized using a cyclic voltammogram (CV) and electrochemical impedance spectra (EIS) techniques. Figure 4A shows the cyclic voltammograms of bare GCE (black), GCE\gCN (red), GCE/gCN-Ag (green), GCE\gCN-PVP (blue) and GCE\gCN-AgPVP (purple) in 5 mM ferri/ferrocyanide ([Fe (CN)6]3-,4-) with 0.1M KCl as supporting electrolyte at a scan rate of 50 mV/s. Based on the results GCE/gCN-AgPVP has a higher redox peak (40% increase) when compared to the bare GCE. Moreover, GCE/gCN-AgPVP had the largest electroactive surface area. Ferri/ferrocyanide [Fe (CN)6]3-,4-) has a positively charged surface area and gCN, gCN-Ag and gCN-AgPVP have surface areas with negatively charges, which makes it easier for the forward and reverse interaction to occur. Based on the graphs gCN-AgPVP its surface is more negatively charged hence it has the highest potential peaks (Liu et al., 2021; Saeb and Asadpour-Zeynali, 2022).
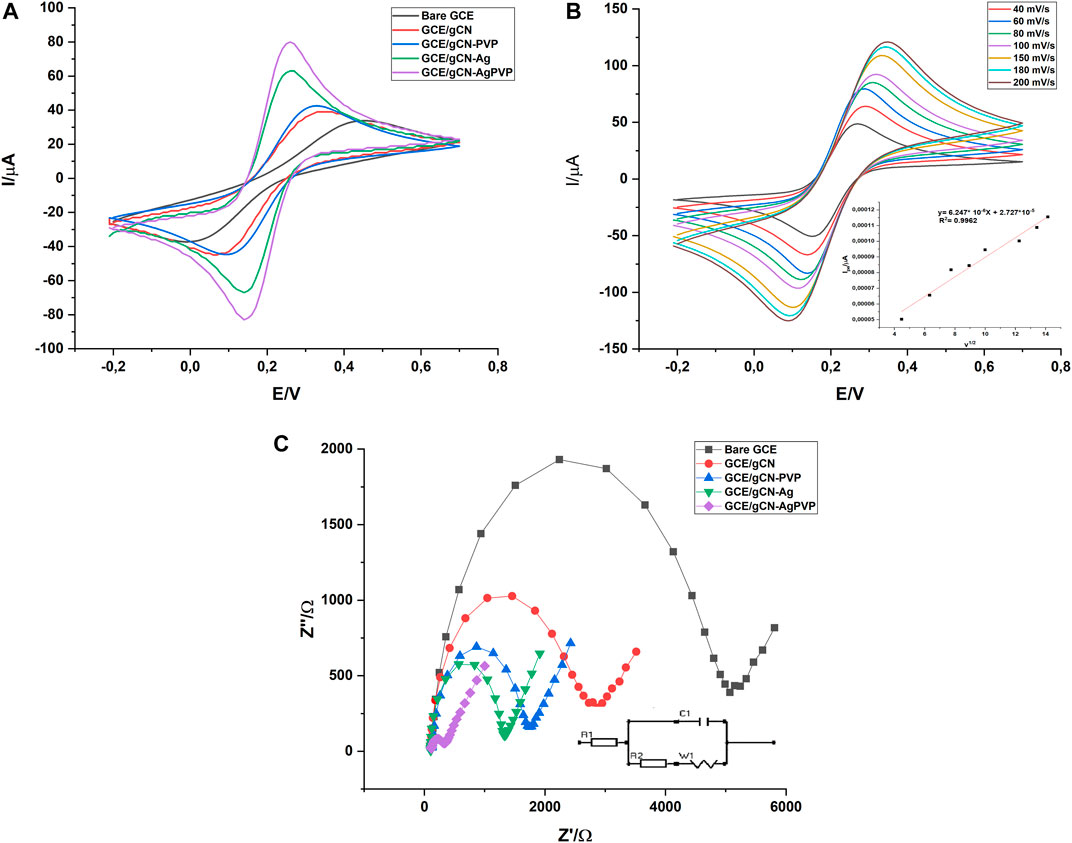
FIGURE 4. (A) CV of the bare, GCE-gCN and GCE-gCN-AgPVP in the presence of 0.1M KCl solution containing 5 mM [Fe(CN)6]3-/4 at scan rate 0.05 Vs−1. (B) Scan rate study of GCE/gCN-AgPVP in the presence of 0.1M KCl solution containing 5 mM [Fe(CN)6]3-/4, insert is Plot of Ipa v0 .5. (C) Nyquist plot of the bare GCE, GCE/gCN; GCE/gCN-PVP; GCE/gCN-Ag and GCE-gCN-AgPVP in the presence of 0.1M KCl solution containing 5 mM [Fe(CN)6]3-/4- at scan rate 0.05 Vs−1.
The plot of anodic peak current (Ipa) versus square root of scan rate (ʋ1/2) shows a direct proportional relationship between the two parameters with a correlation coefficient (R2) of 0.9962 (Figure 4B insert). This displays that it is a diffusion-controlled system which relates the change in current with the concentration of the analyte.
Cyclic voltammetry was carried out on 5 mM M K3/K4 [Fe(CN)6] in 0.1 M KCl at various scan rates using an electrode modified with gCN-AgPVP. This was to evaluate the electroactive surface area of electrodes. The surface area was determined from the equation:
where Ipa is the current response of 5 mM K3 [Fe(CN)6], n is the number of electrons transferred in the process of K3 [Fe(CN)6], A is the electrode surface area, C is the analytical concentration of K3 [Fe(CN)6] in 0.1 M KCl, D is the diffusion coefficient which has a value of 7.6 × 10⁻⁶ cm2 s−1and v is the scan rate (V/s). The cyclic voltammograms of K3 [Fe(CN)6] which were recorded at various scan rates for gCN-AgPVP are shown in Figure 4B. The electroactive surface area for bare GCE, GCE/gCN and GCE/gCNAgPVP were calculated as 0,0863; 0.1335 and 0.2950 cm2 respectively from slope of peak current (Ip) vs. square root of scan rate for electrode (v1/2). Based on the results the surface area of GCE/gCN-AgPVP is higher than the other electrodes and this is often caused by high electron transfer between the solution and the modified electrode. Thus, the oxidation of PAR on gCN-AgPVP modified GCE is most likely to be controlled by adsorption. Thus, the nanoparticles of both PVP and Ag have significantly enhanced the electrochemically active surface area of the modified electrode.
The charge transfer kinetics of the modified electrodes was studied using the EIS technique. Figure 4C shows EIS curves. This study was conducted with 0.1 M KCl solution containing 5 mM [Fe(CN)6]3-/4- at an open circuit potential. The curve constitutes of two major regions: 1) semi-circle area, which denotes the charge transfer from the electrode and electrolyte interface. This area is a high-frequency region. 2) Straight line: representing capacitance inherited by the electrodes. The EIS values are fitted using the equivalent circuit, the diameter of the semi-circle area gives the value of charge transfer resistance (Rct)values are reported. The semicircle portions of the EIS curves at higher frequencies showed charge-transfer resistance (Rct). The linear sections at lower frequencies indicated a diffusion-limited process. Bare GCE (black curve) had a larger semi-circle than gCN, gCN-PVP (blue curve), gCN-Ag (green curve) and gCN-AgPVP (purple curve). The larger semi-circle suggests a high resistance of electrons. However, the Rct value of GCE\gCN-Ag (green curve) is significantly reduced when compared to that of GCE\gCN electrode (red curve), thereby indicating that gCN-AgPVP has a higher conductivity and faster electron transfer rate for redox probes when compared to gCN. This is due to the fast carrier transport from the inside to the surface since gCN-AgPVP composite is ultrathin. The charge transfer resistance values (Rct) were determined as 5070, 2796, 1311, 1295 and 29,06 Ω for bare GCE, GCE-gCN, GCE/gCN-PVP, GCE/gCN-Ag and GCE-gCN-AgPVP, respectively. GCE-gCN-AgPVP has the lowest Rct value. This happens because electron transfer by the Ag and PVP nano modifiers is enhanced. The electron transfer resistance (Rct) at high frequencies can be estimated from the semi-circle diameter and diffusion can be estimated from the linear portion at lower frequencies. In summary, the CV analysis of gCN-Ag-PVP resulted in a high peak current, its surface area was found to be more electroactive and the EIS studies in Figure 4C showed less resistance compared to the bare GCE and other modified electrodes. Therefore, gCN-Ag-PVP is less resistant, has high electron conductivity and fast electron transfer rate to the redox probe.
3.3 Optimisation of the Electrochemical Sensor (gCN-AgPVP)
3.3.1 CV Characterisation of GCE/gCN-AgPVP in the Presence and the Absence of Analyte (PAR) in the Buffer
Cyclic voltammetry technique was employed to understand the electrochemical behaviours and qualitatively determine PAR on the as-prepared catalysts in 0.1 M PBS, (pH 6,1) at a scan rate of 50 mV s−1. As can be observed from Figure 5, Bare GCE did not show any anodic peak in the 0.1 M PBS electrolyte. However, well-defined anodic peak of 1 mM PAR for GCE/gCN and GCE/AgPVP appeared at 0.45 and 0.52 V, respectively. PAR detection is facilitated by the gCN framework because it contains additional carbon atoms, that will increase the number of active sides thereby enhancing the conductivity of the electrode. gCN and PAR are the only compounds reacting, the NH2 in gCN are active groups. H will attack on the oxidized form of PAR, i.e., N-acetyl-p-quinoneimine and reduced back to PAR. The gCN-AgPVP will oxidize the PAR for detection. Therefore, it can be illustrated that the electrochemical oxidation of PAR at the gCN-AgPVP electrode is a two-electron and two-proton process and this is illustrated in Scheme 2.
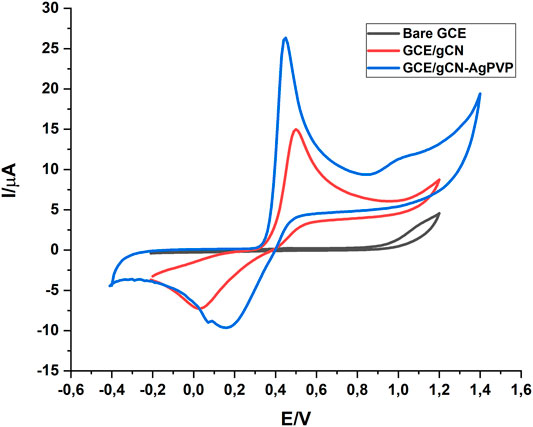
FIGURE 5. CV characterisation of Bare GCE, gCN and Gcn-AgPVP in 0,1 M PBS, pH 6,1.
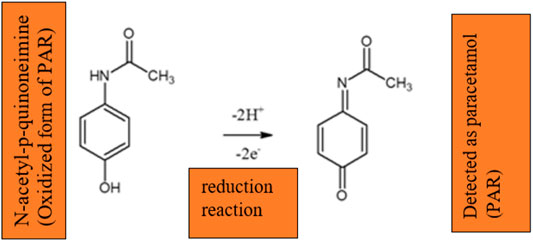
SCHEME 2. The mechanism for the detection of PAR using gCN-AgPVP electrode.
3.3.2 Effect of pH
The electrochemical response of PAR is pH dependent. Hence, the electrocatalytic behaviour of gCN-AgPVP modified electrode for PAR oxidation was examined using square wave voltammetry (SQWV) at pH 2 to 12 in 1 mM PAR as shown in Figure 6. As the pH range increased from 4 to 6 the oxidation peak current of PAR increased from 0.55 to 0.68 and the maximum potential oxidation potential of PAR was observed at pH 6,1 and it gave a high signal. Therefore, the maximum oxidation potential of PAR was reached at pH 6,1. According to literature studies, in decreasing pH values, PAR was presumably hydrolyzed to 4-aminophenol (Li et al., 2018). The slope of about 68 mV/pH was close to the theoretical value of 59 mV/pH based on the Nernst equation (Alavi-tabari et al., 2018), declaring that there were equal proportion of protons and electrons involved in the redox process of paracetamol. Moreover, in increasing pH of alkaline solution, the peak current decreased and became kinetically less suitable, probably due to the presence of the phenoxide. As a result, pH 6,1 was applied for all buffer solution in the following investigation. The effects of pH on the oxidation peak potential (Epa) of PAR at GCE/gCN-AgPVP indicated that the continuous increase in pH of the medium caused the shift of oxidation potential of PAR toward less positive values, suggesting the electrochemical oxidation of analyte was associated with a proton-transfer process. A linear relationship was observed between the oxidation peak potential of amlodipine and pH in the pH range of 2–12 (pH vs. E) According to the equation of Epa(V) = -0.02514pH + 0,7091; R2 = 0.8488 obtained from the plot of Epa versus E.
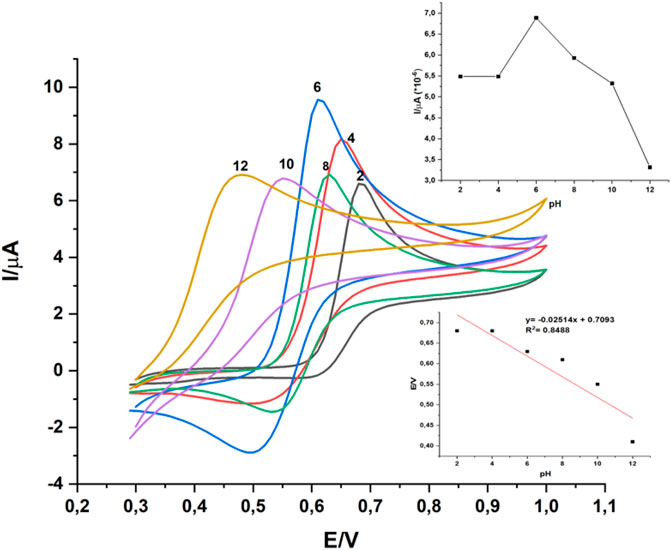
FIGURE 6. Cyclic voltammograms of GCE-gCN-AgPVP in 0.1 M of PBS containing 1 mM PAR under different pH (2., 4, 6, 8, 10 and 12). Scan rate = 10 mV s−1.
3.3.3 Effect of gCN-AgPVP Nanomaterial
Figure 7 illustrates the application of GCE/gCN-AgPVP to sense various concentrations of PAR ranging from 0.2 to 100 µM. The PAR oxidation peak was observed at ∼0.35 V. A direct proportional relationship between concentration of PAR and the anodic peak current is noted. Current density was also plotted against concentration of PAR and this is shown in the inset of Figure 7. This plot showed a direct proportional relationship over the whole concentration range with the equation y = 6.985*10−8x + 4.989*10−6 and a correlation coefficient R2 = 0.9951. Table 1 shows a comparison of the analytical parameters obtained in this study with that of other studies reported in the literature. This comparison showed that the GCE/gCN-AgPVP system is quite sensitive and comparable with values obtained by other researchers (Chen et al., 2018; Annadurai et al., 2021; Vinoth et al., 2020)-[53].
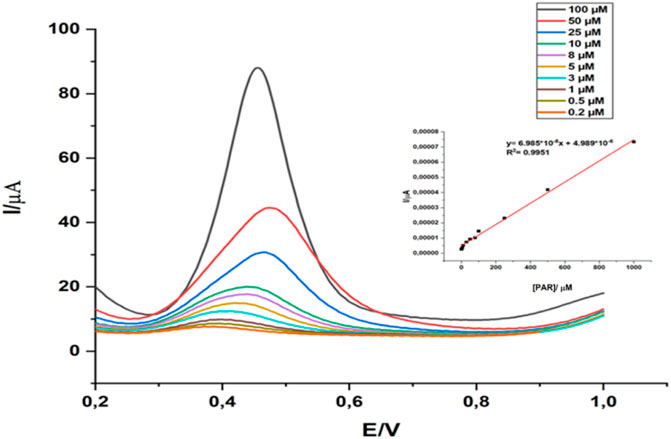
FIGURE 7. GCE\ gCN-AgPVP response to various concentrations of PAR in PBS (pH = 6) and linear calibration plot (concentration of PAR vs. current density) inset graph. Estart = 0,20v; Eend = 1,00 v; Pulse amplitude = 50,0 mV; Estep = 4 mV; SQWV frequenvy = 30,0 Hz.
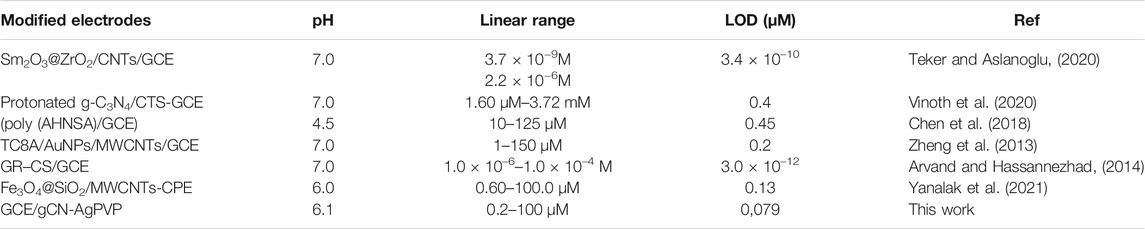
TABLE 1. Comparison of GCE-gCN-AgPVP to another electrode modifying composite.
3.4 Reproducibility, Stability and Interferences GCE/gCN-AgPVP
A repeatability and reproducibility study were performed to ascertain the efficacy of GCE/gCN-AgPVP. The consistency of the results was checked for 10 days, by storing the sensor in an air tight jar after use. For repeatability the SQWV technique was used and the electrochemical response of fabricated GC/gCN-AgPVP was verified by using 0.1 M PBS containing 1 mM of PAR at pH 6.1. SQWV measurements with the same electrodes were performed in triplicate and the relative standard deviation (RSD) value for PAR was 3.21%. For the reproducibility study, seven identical GCE/gCN-AgPVPs were tested and the relative standard deviation RSD was 2.83%. For stability studies, the sensor was prepared to detect the same concentration (Figure 8A), the sensor remained active after 10 days and retained 94.64% of its sensor activity and thus exhibited good stability.
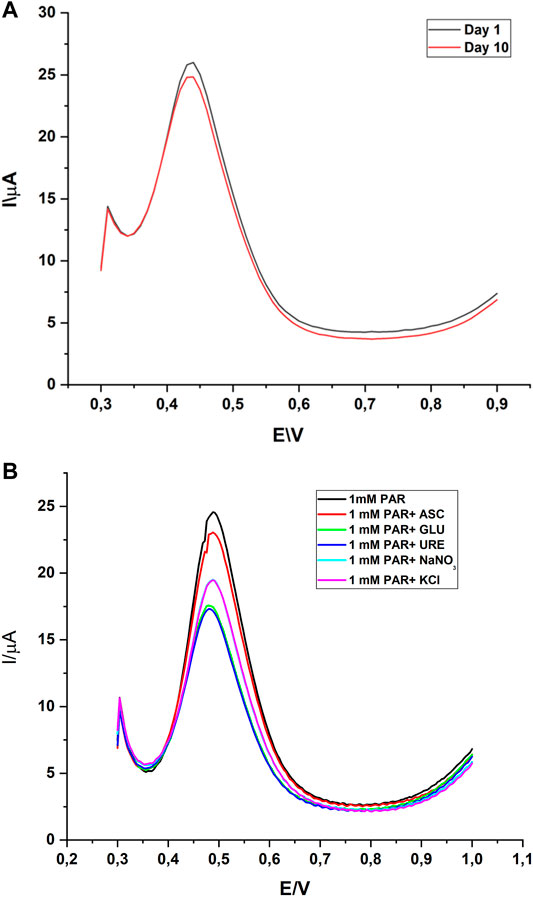
FIGURE 8. (A)Stability studies of GCE/gCN-AgPVP for 1 Mm PAR. (B) Interference study of some co-existing compounds during the electrochemical determination of 1 mM PAR using gCN-AgPVP.
The effects of interferences like ascorbic acid, glucose, urea, sodium nitrate and potassium chloride were inspected in the determination of PAR with GCE/gCN-AgPVP to check the selectivity of the method. The selectivity of the gCN-AgPVP modified on a glassy carbon electrode for the determination of equimolar concentration (1 mM) of PAR was investigated by sensing PAR with competing species such as 1 mM of ascorbic acid (ASC), glucose (GLU), urea (URE), sodium nitrate (NaNO3) and potassium chloride (KCl) by SQWV at pH 6.1. The corresponding oxidation peak currents of, KCl and NaNO3 were interfering with PAR detection. The change in peak current response of PAR was more than 5% with GLU, NaNO3 and URE which showed that the species did not interfere with the determination of paracetamol and the modifier was highly selective (see Figure 8B) for paracetamol.
3.5 Analytical Application
Prior to analysis, one paracetamol tablet was weighed, crushed with a mortar and pestle, transferred to 100 ml volumetric flask and dissolved with a supporting electrolyte (500 mg of South African brand tables). Since, the concentration linear range for the calibration was 0.2–100 µM. Therefore, the concentration of the original sample (500 mg PAR in 1000 ml) was diluted into 100 ml solution in a volumetric flask. From the stock solution, 100, 200, 300, 400 µl were diluted into 50 ml solution together with the electrolyte (PBS). The concentration of PAR was detected by the sensor (Gcn-AgPVP) versus UV Vis spectroscopy.
The experimental conditions were as follows: SQWV technique in PBS (pH 6.1). The recoveries of PAR in were determined as 98,70; 94,25; 98,90 and 97,55% for each of the four samples respectively. The validation was performed by using UV Vis spectroscopy and the recoveries of PAR were found to be 98,93; 98,40; 99,13 and 97,97% for each of the four samples respectively. The results indicated that these two methods gave similar results which means that the prepared nanomaterial (gCN-AgPVP) is reliable and can be used for the determination of PAR in future (see Table 2).
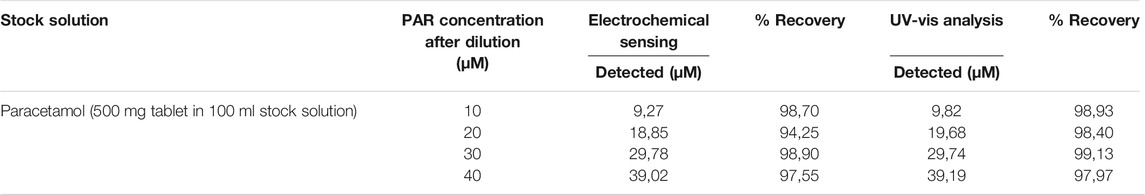
TABLE 2. Recovery rates of commercial PAR samples in 0.1M PBS using GCE-gCN-AgPVP.
The average concentration of PAR in tablet samples at the four different levels was tested for significance by using the t-test method: the null hypothesis corresponds to the obtained results from Uv-Vis method. The calculated t values were found to be 0,9681 and tabulated t value (critical t value) is 2,45. The calculated t values was less than tabulated t value at confidence level of 95% and degree of freedom of n-1, suggesting that the proposed method is appropriate for the determination of PAR. The obtained results suggest that the investigation of PAR concentrations may be possible in the presence of significant interferences using the proposed methodology.
Based on the results presented Table 2, the electrochemical sensing of PAR for the real samples analysis are similar to those obtained with Uv-Vis.
Conclusion
Electrochemical characterisation has shown that GCE/gCN-AgPVP offers advantages such as enhanced conductivity, large surface area and good stability. The interface of GCE/gCN-AgPVP has therefore demonstrated good potential as an electrochemical sensor. The electrochemical response of PAR on GCE/gCN-AgPVP is superior when compared to the bare GCE. This can be due to enhanced properties such as surface adsorption capacity, electron transfer rate constant and the diffusion coefficient of PAR on GCE/gCN-AgPVP which were confirmed by SQWV. The SQWV result showed a wide linear range from 0.2–100 µM and a low detection limit of were 0,079 µM obtained for PAR detection. Ascorbic acid, glucose, urea, sodium nitrate and potassium chloride were used for the effect interferences. It was found that the oxidation peaks of KCl and NaNO3 were interfering with PAR. Change in peak current response of PAR was less than 5% with ASC, GLU and URE which showed that the species did not interfere with the determination of paracetamol and the modifier had a good selectivity. SQWV measurements with the same electrodes were conducted in triplicate and showed that the relative standard deviation (RSD) value for PAR was 3.21%. Seven identical GCE/gCN-AgPVPs were tested for reproducibility and the relative standard deviation RSD value was reported as 2.83%. For stability studies, the sensor was prepared to detect the same concentration, the sensor retained its reactivity after 10 days and retained 94.64% of its sensor activity which exhibited good stability. For the validation of real sample analysis Uv-Vis spectroscopy was used and compared with the electrochemical sensing using gCN-AgPVP and the two methods have similar results for all samples which mean that the prepared nanomaterial is reliable and can be used for the determination of PAR in future.
Data Availability Statement
The raw data supporting the conclusion of this article will be made available by the authors, without undue reservation.
Author Contributions
NMe conducted the experimental work and wrote the manuscript. NMa conceptualised the project, supervised the electrochemical work and edited the manuscript. KP conceptualised the project, supervised the overall project and edited the manuscript.
Funding
The funding from National Research Foundation, Centre for Nanomaterials and the Faculty of Science support open access publication University of Johannesburg (Faculty of Science-University of Johannesburg).
Conflict of Interest
The authors declare that the research was conducted in the absence of any commercial or financial relationships that could be construed as a potential conflict of interest.
Publisher’s Note
All claims expressed in this article are solely those of the authors and do not necessarily represent those of their affiliated organizations, or those of the publisher, the editors and the reviewers. Any product that may be evaluated in this article, or claim that may be made by its manufacturer, is not guaranteed or endorsed by the publisher.
References
Adhikari, B.-R., Govindhan, M., and Chen, A. (2015). Sensitive Detection of Acetaminophen with Graphene-Based Electrochemical Sensor. Electrochimica Acta 162, 198–204. doi:10.1016/j.electacta.2014.10.028
Afshari, M., Dinari, M., and Momeni, M. M. (2019). The Graphitic Carbon Nitride/Polyaniline/Silver Nanocomposites as a Potential Electrocatalyst for Hydrazine Detection. J. Electroanal. Chem. 833 (November 2018), 9–16.
Alavi-tabari, S. A. R., Khalilzadeh, M. A., and Karimi-maleh, H. (2018). Simultaneous Determination of Doxorubicin and Dasatinib as Two Breast Anticancer Drugs Uses an Amplified Sensor with Ionic Liquid and ZnO Nanoparticle. J. Electroanalytical Chem. 811 February, 84–88. doi:10.1016/j.jelechem.2018.01.034
Ali, M., Tufail, S., Sherazi, H., Iqbal, M., Ahmed, S., and Ashraf, M. (2015). Spectrochimica Acta Part A : Molecular and Biomolecular Spectroscopy A Rapid Fourier-Transform Infrared ( FTIR ) Spectroscopic Method for Direct Quantification of Paracetamol Content in Solid Pharmaceutical Formulations. Spectrochim. ACTA PART A. Mol. Biomol. Spectrosc. 141, 64–70.
Annadurai, K., Sudha, V., Murugadoss, G., and Thangamuthu, R. (2021). Electrochemical Sensor Based on Hydrothermally Prepared Nickel Oxide for the Determination of 4-acetaminophen in Paracetamol Tablets and Human Blood Serum Samples. J. Alloys Comp. 852, 156911. doi:10.1016/j.jallcom.2020.156911
Arvand, M., and Hassannezhad, M. (2014). Magnetic Core-Shell Fe3O4@SiO2/MWCNT Nanocomposite Modified Carbon Paste Electrode for Amplified Electrochemical Sensing of Uric Acid. Mater. Sci. Eng. C 36, 160–167. doi:10.1016/j.msec.2013.12.014
Analysis, B. (2003). “Flow-injection Spectrophotometric Determination of Paracetamol in Tablets and Oral Solutions,” vol. 33, pp. 191–197.
Boumya, W., Taou, N., Achak, M., and Barka, N. (2021). Chemically Modified Carbon-Based Electrodes for the Determination of Paracetamol in Drugs and Biological Samples. J. Pharm. Anal. 11, 138–154. doi:10.1016/j.jpha.2020.11.003
Chen, Y., Zheng, G., Shi, Q., Zhao, R., and Chen, M. (2018). Preparation of Thiolated calix[8]arene/AuNPs/MWCNTs Modified Glassy Carbon Electrode and its Electrocatalytic Oxidation toward Paracetamol. Sensors Actuators B: Chem. 277 (May), 289–296. doi:10.1016/j.snb.2018.09.012
Dai, G., Xie, J., Li, C., and Liu, S. (2017). Flower-like Co3O4/graphitic Carbon Nitride Nanocomposite Based Electrochemical Sensor and its Highly Sensitive Electrocatalysis of Hydrazine. J. Alloys Comp. 727, 43–51. doi:10.1016/j.jallcom.2017.08.100
Fanjul-bolado, P., Lamas-ardisana, P. J., Hernández-Santos, D., and Costa-García, A. (2009). Analytica Chimica Acta Electrochemical Study and Flow Injection Analysis of Paracetamol in Pharmaceutical Formulations Based on Screen-Printed Electrodes and Carbon Nanotubes, Electrochemical Study and Flow Injection Analysis of Paracetamol in Pharmaceutical Formulations Based on Screen-Printed Electrodes and Carbon Nanotubes, Analytica Chim. Acta, 638, 133–138. doi:10.1016/j.aca.2009.02.019
Hang, N. T., Zhang, S., and Yang, W. (2017). Efficient Exfoliation of G-C3n4 and NO2 Sensing Behavior of Graphene/g-C3n4 Nanocomposite. Sensors Actuators B: Chem. 248 (2), 940–948. doi:10.1016/j.snb.2017.01.199
Haridas, V., Yaakob, Z., K, R. N., Sugunan, S., and Narayanan, B. N. (2021). Selective Electrochemical Determination of Paracetamol Using Hematite/graphene Nanocomposite Modified Electrode Prepared in a green Chemical Route, Mater. Chem. Phys. 263. February, 124379. doi:10.1016/j.matchemphys.2021.124379
Kang, X., Wang, J., Wu, H., Liu, J., Aksay, I. A., and Lin, Y. (2010). A Graphene-Based Electrochemical Sensor for Sensitive Detection of Paracetamol. Talanta 81 (3), 754–759. doi:10.1016/j.talanta.2010.01.009
Kesavan, G., and Chen, S.-M. (2020). Highly Sensitive Electrochemical Sensor Based on Carbon-Rich Graphitic Carbon Nitride as an Electrocatalyst for the Detection of Diphenylamine. Microchemical J. 159 (October), 105587. doi:10.1016/j.microc.2020.105587
Kesavan, G., and Chen, S.-M. (2020). Highly Sensitive Electrochemical Sensor Based on Carbon-Rich Graphitic Carbon Nitride as an Electrocatalyst for the Detection of Diphenylamine. Microchemical J. 159 (June), 105587. doi:10.1016/j.microc.2020.105587
Khaskheli, A. R., Shah, A., Bhanger, M. I., Niaz, A., and Mahesar, S. (2007). Simpler Spectrophotometric Assay of Paracetamol in Tablets and Urine Samples, 68, 747–751.
Li, M., Wang, W., Chen, Z., Song, Z., and Luo, X. (2018). Electrochemical Determination of Paracetamol Based on Au@graphene Core-Shell Nanoparticles Doped Conducting Polymer PEDOT Nanocomposite. Sensors Actuators B: Chem. 260, 778–785. doi:10.1016/j.snb.2018.01.093
Liu, J., Sun, L., Li, G., Hu, J., and He, Q. (2021). Ultrasensitive Detection of Dopamine via Electrochemical Route on Spindle-like α -Fe 2 O 3 Mesocrystals/rGO Modified GCE. Mater. Res. Bull. 133 (July 2020), 111050.
Liu, L., Lv, H., Wang, C., Ao, Z., and Wang, G. (2016). Fabrication of the Protonated Graphitic Carbon Nitride Nanosheets as Enhanced Electrochemical Sensing Platforms for Hydrogen Peroxide and Paracetamol Detection. Electrochimica Acta 206, 259–269. doi:10.1016/j.electacta.2016.04.123
Liu, X., Zhang, J., Di, J., Long, Y., Li, W., and Tu, Y. (2017). Graphene-like Carbon Nitride Nanosheet as a Novel Sensing Platform for Electrochemical Determination of Tryptophan. J. Colloid Interf. Sci. 505, 964–972. doi:10.1016/j.jcis.2017.05.119
Lütfi, M., and Atar, N. (2019). Development of Molecular Imprinted Sensor Including Graphitic Carbon Nitride/N-Doped Carbon Dots Composite for Novel Recognition of Epinephrine. Compos. Part. B 175 (June), 107113.
Mangaiyarkarasi, R., Premlatha, S., Khan, R., Pratibha, R., and Umadevi, S. (2020). Electrochemical Performance of a New Imidazolium Ionic Liquid crystal and Carbon Paste Composite Electrode for the Sensitive Detection of Paracetamol. J. Mol. Liquids 319, 114255. doi:10.1016/j.molliq.2020.114255
Burç, M., Köytepe, S., Duran, S. T., Ayhan, N., and Seçkin, T., “Development of Voltammetric Sensor Based on Polyimide-MWCNT Composite Membrane for Rapid and Highly Sensitive Detection of Paracetamol,” vol. 151, 2020. 107103. doi:10.1016/j.measurement.2019.107103
Munusamy, S., Sivaranjan, K., Sabhapathy, P., Narayanan, V., and Mohammad, F. (2021). Enhanced Electrochemical and Photocatalytic Activity of. Synth. Met. 272 (December 2020), 116669.
Murtada, K., Salghi, R., Ríos, A., and Zougagh, M. (2020). A Sensitive Electrochemical Sensor Based on Aluminium Doped Copper Selenide Nanoparticles-Modified Screen Printed Carbon Electrode for Determination of L-Tyrosine in Pharmaceutical Samples. J. Electroanalytical Chem. 874, 114466. doi:10.1016/j.jelechem.2020.114466
Palur, K., Archakam, S. C., and Koganti, B. (2020). Chemometric Assisted UV Spectrophotometric and RP-HPLC Methods for Simultaneous Determination of Paracetamol, Diphenhydramine, Caffeine and Phenylephrine in Tablet Dosage Form. Spectrochimica Acta A: Mol. Biomol. Spectrosc. 243, 118801. doi:10.1016/j.saa.2020.118801
Paul, D. R., Sharma, R., Panchal, P., Nehra, S. P., Gupta, A. P., and Sharma, A. (2020). Synthesis, Characterization and Application of Silver Doped Graphitic Carbon Nitride as Photocatalyst towards Visible Light Photocatalytic Hydrogen Evolution. Int. J. Hydrogen Energ. 45 (44), 23937–23946. doi:10.1016/j.ijhydene.2019.06.061
Pinyou, P., Blay, V., Chansaenpak, K., and Lisnund, S. Paracetamol Sensing with a Pencil Lead Electrode Modified with Carbon Nanotubes and Polyvinylpyrrolidone.
Niedzia, P., “Biosensors and Bioelectronics Comparison of the Paracetamol Electrochemical Determination Using boron- Doped diamond Electrode and boron-doped Carbon Nanowalls,” vol. 126, no. October 2018, pp. 308–314. 2019.
Niedzia, P., “Biosensors and Bioelectronics Comparison of the Paracetamol Electrochemical Determination Using boron- Doped diamond Electrode and boron-doped Carbon Nanowalls,” vol. 126, no. July 2018, pp. 308–314. 2019.
Premlatha, S., and Ramesh Bapu, G. N. K. (2018). Fabrication of Co-ni alloy Nanostructures on Copper Foam for Highly Sensitive Amperometric Sensing of Acetaminophen. J. Electroanalytical Chem. 822 (May), 33–42. doi:10.1016/j.jelechem.2018.05.009
Raymundo-pereira, P. A., Campos, A. M., Mendonça, C. D., Calegaro, M. L., Machado, S. A. S., and Oliveira, O. N. (2017). Printex 6L Carbon Nanoballs Used in Electrochemical Sensors for Simultaneous Detection of Emerging Pollutants Hydroquinone and Paracetamol. Sensors Actuators B: Chem. 252, 165–174. doi:10.1016/j.snb.2017.05.121
Saeb, E., and Asadpour-Zeynali, K. (2022). Enhanced Electrocatalytic Reduction Activity of Fe-MOF/Pt Nanoparticles as a Sensitive Sensor for Ultra-trace Determination of Tinidazole. Microchem. J. 172 (PB), 106976.
Sanghavi, B. J., and Srivastava, A. K. (2010). Simultaneous Voltammetric Determination of Acetaminophen, Aspirin and Caffeine Using an In Situ Surfactant-Modified Multiwalled Carbon Nanotube Paste Electrode. Electrochimica Acta 55 (28), 8638–8648. doi:10.1016/j.electacta.2010.07.093
Saravanan, V., Lakshmanan, P., and Ramalingan, C. (2021). Diamond & Related Materials Alumina Surface Modified with Graphitic Carbon Nitride : Synthesis , Characterization and its Application as Photocatalyst. Diam. Relat. Mater. 114 (July 2020), 108291.
Teker, T., and Aslanoglu, M. (2020). Sensitive and Selective Determination of Paracetamol Using a Composite of Carbon Nanotubes and Nanoparticles of Samarium Oxide and Zirconium Oxide. Microchemical J. 158 (April), 105234. doi:10.1016/j.microc.2020.105234
Veerakumar, P., Rajkumar, C., Chen, S.-M., Thirumalraj, B., and Lin, K.-C. (2018). Ultrathin 2D Graphitic Carbon Nitride Nanosheets Decorated with Silver Nanoparticles for Electrochemical Sensing of Quercetin. J. Electroanalytical Chem. 826 (August), 207–216. doi:10.1016/j.jelechem.2018.08.031
Vinoth, S., Sampathkumar, P., Giribabu, K., and Pandikumar, A. (2020). Ultrasonically Assisted Synthesis of Barium Stannate Incorporated Graphitic Carbon Nitride Nanocomposite and its Analytical Performance in Electrochemical Sensing of 4-nitrophenol. Ultrason. Sonochem. 62 (November 2019), 104855. doi:10.1016/j.ultsonch.2019.104855
Vinoth, S., Shalini Devi, K. S., and Pandikumar, A. (2021). A Comprehensive Review on Graphitic Carbon Nitride Based Electrochemical and Biosensors for Environmental and Healthcare Applications. Trac Trends Anal. Chem. 140, 116274. doi:10.1016/j.trac.2021.116274
Wang, J., and Wang, S. (2022). A Critical Review on Graphitic Carbon Nitride (G-C3n4)-Based Materials: Preparation, Modification and Environmental Application. Coord. Chem. Rev. 453, 214338. doi:10.1016/j.ccr.2021.214338
Wen, J., Xie, J., Chen, X., and Li, X. (2017). A Review on G-C 3 N 4 -based Photocatalysts. Appl. Surf. Sci. 391, 72–123. doi:10.1016/j.apsusc.2016.07.030
Wong, A., Isbister, G., McNulty, R., Isoardi, K., Harris, K., Chiew, A., et al. (2020). Efficacy of a Two Bag Acetylcysteine Regimen to Treat Paracetamol Overdose (2NAC Study). EClinicalMedicine 20, 100288. doi:10.1016/j.eclinm.2020.100288
Yanalak, G., Doganay, F., Eroglu, Z., Kucukkececi, H., and Aslan, E. (2021)., 557. January, 149755.Applied Surface Science Ternary Nanocomposites of Mesoporous Graphitic Carbon Nitride/Black Phosphorus/Gold Nanoparticles ( Mpg-CN/BP-Au ) for Photocatalytic Hydrogen Evolution and Electrochemical Sensing of ParacetamolAppl. Surf. Sci.
Zhang, H., Huang, Q., Huang, Y., Li, F., Zhang, W., Wei, C., et al. (2014). Graphitic Carbon Nitride Nanosheets Doped Graphene Oxide for Electrochemical Simultaneous Determination of Ascorbic Acid, Dopamine and Uric Acid. Electrochimica Acta 142, 125–131. doi:10.1016/j.electacta.2014.07.094
Zhang, W., Zhou, L., and Deng, H. (2016). Ag Modified G-C3n4 Composites with Enhanced Visible-Light Photocatalytic Activity for Diclofenac Degradation. J. Mol. Catal. A: Chem. 423 (July), 270–276. doi:10.1016/j.molcata.2016.07.021
Zhao, Q., Wu, W., Wei, X., Jiang, S., Zhou, T., Li, Q., et al. (2017). Graphitic Carbon Nitride as Electrode Sensing Material for Tetrabromobisphenol-A Determination. Sensors Actuators B: Chem. 248, 673–681. doi:10.1016/j.snb.2017.04.002
Zhao, S., Fang, J., Wang, Y., Zhang, Y., Zhou, Y., and Zhuo, S. (2020). Construction of Three-Dimensional Mesoporous Carbon Nitride with High Surface Area for Efficient Visible-Light-Driven Hydrogen Evolution. J. Colloid Interf. Sci. 561, 601–608. doi:10.1016/j.jcis.2019.11.035
Zheng, M., Gao, F., Wang, Q., Cai, X., Jiang, S., Huang, L., et al. (2013). Electrocatalytical Oxidation and Sensitive Determination of Acetaminophen on Glassy Carbon Electrode Modified with Graphene-Chitosan Composite. Mater. Sci. Eng. C 33 (3), 1514–1520. doi:10.1016/j.msec.2012.12.055
Keywords: graphitic carbon nitride-silver polyvinylpyrrolidone, composite, electrochemical sensor (EC), paracetamol, square–wave voltammetry
Citation: Mekgoe N, Mabuba N and Pillay K (2022) Graphic Carbon Nitride-SilverPolyvinylpyrrolidone Nanocomposite Modified on a Glassy Carbon Electrode for Detection of Paracetamol. Front. Sens. 3:827954. doi: 10.3389/fsens.2022.827954
Received: 02 December 2021; Accepted: 28 February 2022;
Published: 24 March 2022.
Edited by:
Wing Cheung Law, Hong Kong Polytechnic University, Hong Kong SAR, ChinaReviewed by:
Pankaj Gupta, Chalmers University of Technology, SwedenAli Benvidi, Yazd University, Iran
Copyright © 2022 Mekgoe, Mabuba and Pillay. This is an open-access article distributed under the terms of the Creative Commons Attribution License (CC BY). The use, distribution or reproduction in other forums is permitted, provided the original author(s) and the copyright owner(s) are credited and that the original publication in this journal is cited, in accordance with accepted academic practice. No use, distribution or reproduction is permitted which does not comply with these terms.
*Correspondence: K. Pillay, a3JpdmVzaGluaXBAdWouYWMuemE=