- 1Supramolecular Nano-Materials and Interfaces Laboratory, Institute of Materials, School of Engineering, École Polytechnique Fédérale de Lausanne (EPFL), Lausanne, Switzerland
- 2CREATE Lab, Institute of Mechanical Engineering, School of Engineering, École Polytechnique Fédérale de Lausanne (EPFL), Lausanne, Switzerland
Laboratory automation requires reliable and precise handling of microplates, but existing robotic systems often struggle to achieve this, particularly when navigating around the dynamic and variable nature of laboratory environments. This work introduces a novel method integrating simultaneous localization and mapping (SLAM), computer vision, and tactile feedback for the precise and autonomous placement of microplates. Implemented on a bi-manual mobile robot, the method achieves fine-positioning accuracies of
1 Introduction
Robotic mobile manipulation platforms are increasingly used for the automation of laboratory sciences as they improve consistency and reliability in experimental data capture while enabling large-scale experiments (Abolhasani and Kumacheva, 2023; Thurow, 2021; Holland and Davies, 2020). However, such mobile manipulators (Ghodsian et al., 2023) often struggle to robustly, precisely, and reliably pick and place labware—typically “well plates,” a fundamental task for many wet laboratory protocols. Performing this task in a laboratory is challenging due to the dynamic nature of the environment, variability in instrument locations (Hvilshøj et al., 2012), and the necessity for robots to work alongside humans for extended periods (Duckworth et al., 2019). Additionally, the precision required is often within the millimeter range (Bostelman et al., 2016; Madsen et al., 2015). In laboratory environments, the positioning of instruments is not always fixed; large, fragile devices may need to be moved for various reasons, such as reconfiguring for different experiments, optimizing workflow efficiency, or performing maintenance. This introduces variability that robots must compensate for when performing tasks such as picking and placing labware. Enhancing the reliability and precision of these robots would expand the range of complex wet laboratory protocols that could be automated.
Mobile manipulators commonly rely on simultaneous localization and mapping (SLAM) (Sánchez-Ibáñez et al., 2021) and predefined maps to reach target locations, yet this approach often lacks the necessary localization accuracy, calling for the integration of additional methods. One popular strategy adopts computer vision-based localization, where a stereo camera detects fiducial markers to estimate the instrument’s pose. This technique has enabled automated cell culture workflows (Lieberherr and Peter, 2021) and has also been applied to automate the synthesis of oxygen-producing catalysts from Martian meteorites (Zhu et al., 2023). Furthermore, it has been shown that a mobile manipulator can interact with different workstations to automate sample preparation for a high-performance liquid chromatography (HPLC) device (Wolf et al., 2024). More complex camera systems have also been used; a dual-handed mobile robot adopted a 3D camera for identifying and handling various types of labware based on object features rather than fiducial markers (Ali et al., 2016). Similarly, a robotic arm paired with a depth camera has been shown to autonomously handle and arrange centrifuge tubes in trays (Nguyen et al., 2024). Also, vision systems have been paired with mobile mini-robots and coupled with static robotic arms to facilitate sample delivery (Laveille et al., 2023; You et al., 2017). However, stereo vision and 3D cameras remain sensitive to light conditions and reflections, which limit their long-term reliability (Kalaitzakis et al., 2021). An alternative localization strategy utilizes touch feedback on a cube to determine multiple bench locations (Burger et al., 2020). When deployed in a laboratory, this method enabled a mobile robot to operate continuously for 6 days to perform catalyst optimization experiments. Although this strategy is less commonly used than vision-based localization, the Cooper Group has consistently validated its robustness, expanding the capabilities of the mobile platform over time (Lunt et al., 2024; Dai et al., 2024). However, this strategy requires adding a cube to the laboratory benches and assumes that instruments remain stationary. To maintain reliability, instruments can be secured to benches, and the system can be recalibrated after any unexpected movement.
The potential for the generalization of visual feedback strategies has also been explored. For instance, Wolf et al. (2023) and Wolf et al. (2022) developed a localization framework integrating fiducial markers and barcodes to store device-specific information. Although these approaches have led to robust applications in some contexts, they often lack generalizability and robustness against instrument movement, highlighting the need for further efforts to achieve universal, reliable robotic localization in dynamic laboratory environments.
In this work, we propose a method that combines visual and tactile detection to precisely estimate the pose of instruments in a laboratory environment. By integrating these methods, we achieve reliable fine detection of the instrument’s pose through tactile feedback while maintaining robustness to unexpected changes using computer vision, thereby leveraging the strengths of both strategies. Additionally, we implemented it on SIMO (smart integrator for manual operations, Figure 1), a bi-manual mobile robot platform. SIMO uses SLAM and VL markers (3D-shaped markers for SLAM) (Wadsten Rex and Klemets, 2019) to localize itself approximately in front of the desired experimental station (defined by a table and one instrument). Then, the robot uses a camera to identify fiducial markers (Benligiray et al., 2019) that are attached to the instruments, thus obtaining their rough pose. Finally, SIMO uses six-point tactile detection on the instrument to obtain its fine pose. We demonstrate the robustness of our method using two mockup instruments by comparing the plate insertion success rate, absolute precision, and mean execution time for different methods. Additionally, we test the generalizability of the concept using three laboratory instruments and perform a “stress test,” where the robot simulates the execution of an experiment five times in a row. We demonstrate that this novel approach can achieve fine positioning (
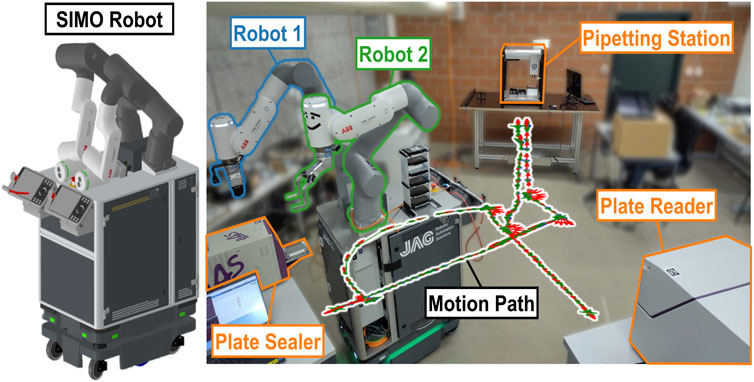
Figure 1. System setup used in this work, consisting of SIMO (left), a bi-manual mobile robot that mounts two robotic arms (
In Section 2, we detail our approach and implementation, including the modifications made to the real instruments. Section 3 describes the experimental setup, custom gripper adaptations, and room design. Section 4 presents our findings using both mockup and real instruments. We then conclude with a summary of the obtained results and highlight future research directions in Section 5.
2 Methods
2.1 Problem statement
Wet laboratory science protocols typically use several bench-top devices and instruments that are spatially distributed in a room. One such protocol is critical micelle concentration (CMC) determination (Mabrouk et al., 2023). This identifies the main physicochemical property of surfactants, which are amphiphilic molecules that decrease surface tension and are key chemicals for disinfection, cleaning, and drug delivery (Falbe 2012; Schramm et al., 2003). This protocol is typically performed by humans; however, this task is work-intensive and prone to errors (Baker, 2016). There is an increasing need for extensive CMC measurements, and thus, a fully automated robotic system is required. To date, no such system exists (Mabrouk et al., 2023).
To automate this task, a robot is required to handle standard microplates (ANSI SLAS 1-2004) with millimeter precision
In this work, we focus on solving the problem of picking and placing microplates between a variety of instruments, where the instruments may be moved or adjusted over time, using a mobile manipulator. This approach is key to enabling many laboratory automation experiments such as CMC.
2.2 SIMO robot platform
The system we have developed for CMC and other wet laboratory experiments is a two-arm robot platform, SIMO. The robot is shown in Figure 1; it mounts two GoFa CRB 15000 (ABB, Switzerland) compliant robot arms, namely,
The dual-arm configuration is beneficial for laboratory automation applications. It mimics human dexterity and bi-manual coordination, enabling robots to handle more complex tasks such as simultaneous manipulation of multiple objects or operating on different parts of an experiment concurrently. The two robotic arms are connected to a robot base (250, MiR, Denmark) via a casing that hosts the arms’ controllers, an onboard PC (NGC-5, Minix, China), and a battery to power the arms. The MiR base uses odometry to estimate its pose with a precision of
Although the developed methods are demonstrated and deployed on this robot, they are potentially generalizable to other mobile manipulators operating in a laboratory environment.
2.3 Instrument perception method
Typically, a robotic mobile base can leverage computer vision and SLAM to achieve a precision of
Figure 2 details the high-level approach of the method. Using a map that has been previously recorded (Figure 7), SIMO moves to a predefined waypoint for each instrument with a precision of
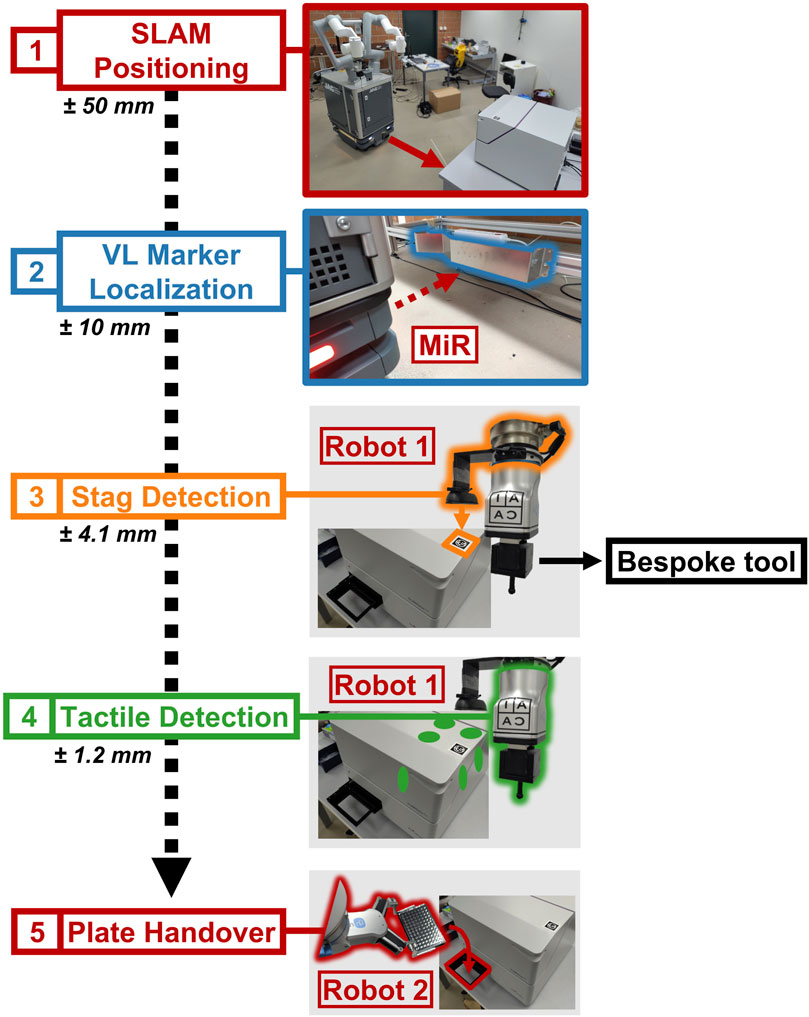
Figure 2. Flow diagram detailing the robot–instrument interaction, highlighting the steps in sequence. SIMO uses SLAM to move to the waypoint, defined for every experimental station (1), and then it localizes the VL Marker, associated with the station (2).
It should be noted that the VL marker localization step shown in Figure 2 may become redundant if additional steps are implemented to close the loop. Therefore, not all strategies discussed in Sections 2.5 and 4.1 incorporate this step. Nonetheless, because the VL marker step enhances the overall robustness of the method, it is included in the optimal strategy used in Sections 4.2 and 4.3.
Additionally, the precision ranges in Figure 2 are assumed to follow a Gaussian (normal) distribution. However, outliers (although rare) may occur, which the system compensates for through real-time corrections using visual and tactile feedback. By using visual and tactile feedback directly on the instrument without the need to add external cubes, as demonstrated by Burger et al. (2020), SIMO is robust to the instrument’s small, unexpected movements (smaller than a few cm). Additionally, this method facilitates the rapid integration of new instruments, as documented in Section 2.4.5.
2.4 Achieving fine positioning
In the following section, we describe the localization strategy once SLAM and VL localization are performed.
Figure 2 shows the approach for precise positioning. Each instrument has an STag marker on a corner.
2.4.1 Assumptions
To develop the algorithms, we make some assumptions about the environment. To describe these assumptions, we introduce several reference frames (see Figure 3).
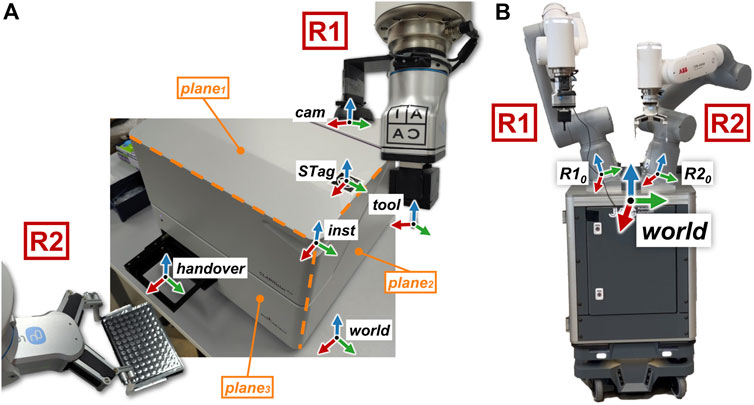
Figure 3. (A): illustration of the main reference frames involved in the robot–instrument interaction, highlighting the touch planes on the instrument. (B): the “world” reference frame is positioned centrally, in between and in front of robotic arms
It is important to note that, as per Assumption II, the perpendicular surfaces can either be part of the instrument’s original design or added using custom 3D-printed components, as detailed in Section 2.4.5. Based on these assumptions, we can now introduce the different elements of the method.
2.4.2 Visual detection of STag markers
Visual detection is used to estimate the instrument’s pose in the reference frame
The camera is rigidly attached to
We recover the desired transform with Equation 2:
Here, the addition and subtraction signs are abstract representations of addition and subtraction in the
After estimating
During each localization run,
2.4.3 Tactile detection of instruments
Given the approximate instrument’s pose using the STag marker,
Considering Assumption II, any instrument can be used as a “reference” cube. Using ABB GoFa’s force-compliant motion (SoftMove),
Specifically, by using three points obtained from the same instrument’s face, we derive the first plane equation
Mathematically, let
and the equation of
To project one of the points on the second face onto
By solving Equation 4 using Equation 5, we obtain the third point
Finally, we can stack the normal vectors to get
An example of the six-point touch feedback task is shown in Figure 4. The velocity graph of
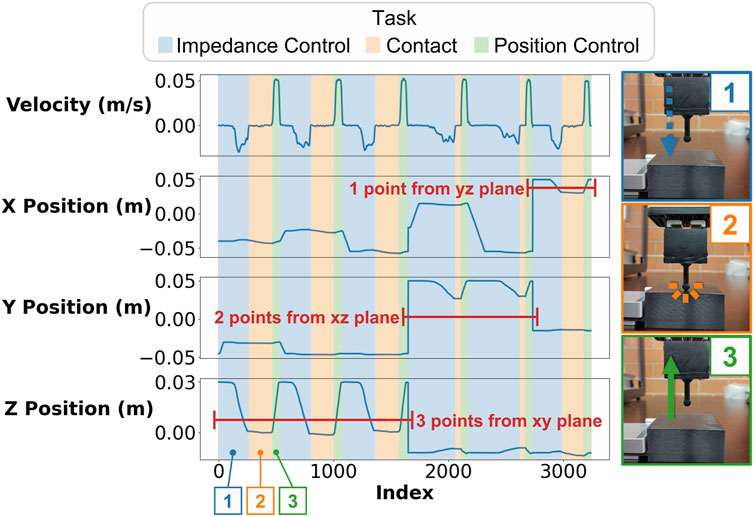
Figure 4. Plots showing the velocity and the position of the tool tip as it executes the touch feedback routine for six points in three perpendicular planes. The plots have different colors depending on the task the robot is executing (impedance control going down, contact, and position control going up). The contact point is estimated by considering when the tool’s velocity is 0 while
While performing the six-point touch feedback, the robot applied a negligible force to the instruments. Given that laboratory equipment typically weighs tens of kilograms and is equipped with high-friction rubber feet, no displacement was observed. However, if this method were to be applied to lighter instruments, there could be a risk of displacement due to the applied force.
2.4.4 Defining the handover position
In the last step of the method, we obtain the location of the handover point, i.e., the point on each instrument where the plate must be picked and placed. Using Assumption I, we can derive
By using
2.4.5 Model generalizability
The framework presented in the previous sections is generalizable. Any instrument that follows assumptions II, III, and IV is suitable, considering some device-specific adjustments. To demonstrate this, we provide four implementation examples; one is represented using the mockup instruments, as shown in Figures 8, 10, and three are real instruments, as shown in Figure 11. We listed them in order of increasing adaptation difficulty:
2.5 Experimental tests
To benchmark this combined approach, we compare three strategies for the placement of the microplates:
All methods use SLAM for navigation, but only the VL strategy uses the “VL” marker for fine positioning. A visual summary of the three strategies is shown in Figure 5.
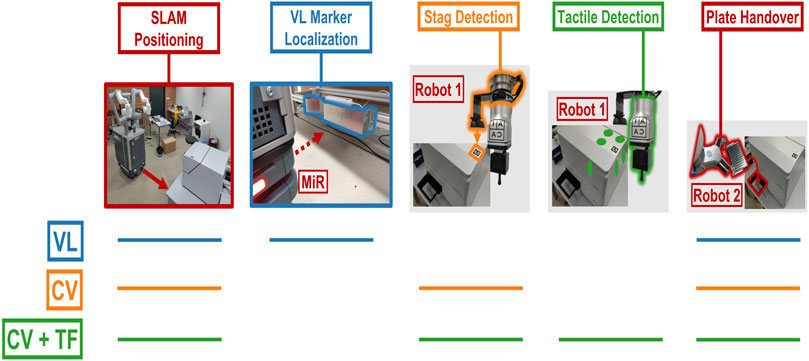
Figure 5. Overview of the strategies to perform the plate pick-and-place task. The colored lines indicate the specific actions performed in each strategy: “VL,” “CV,” and “CV + TF.”
When experiments are repeated, SIMO retracts from the experimental station’s docking point, returns to the same position, and performs the placing task.
3 Experimental setup
3.1 Specialization of the grippers
3.2 System diagram topology
Figure 6 shows the system’s diagram. The central controller orchestrates the full protocol. It prompts SIMO to dock on a specific experimental station and requests to start device-specific action to the different instruments. However, such actions can be categorized into three main classes: “Receive Plate,” which prepares the instrument for plate placement; “Run,” which prompts the instrument to execute its specific task; and “Give Plate,” which sets the instrument to hand the plate back to the mobile robot.
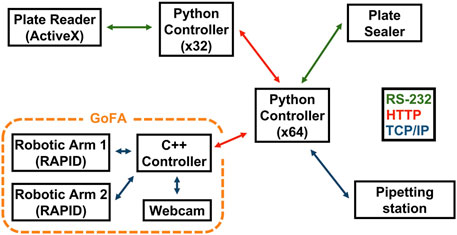
Figure 6. Overview of the hardware modules and their communication protocols; each node represents a module in the workflow. Interconnecting lines represented with different colors detail the communication protocols used between the various modules.
3.3 Mockup instruments
Figures 8, 10 show the two types of mockup instruments that we used to compare the success rate and precision of various plate-placing strategies (see Sections 2.5 and 4.1). The first
3.4 Room
The laboratory map is generated using laser scanning (Figure 7). The highlighted shapes represent the docking stations where the VL markers are physically placed. Every VL marker is associated with an experimental station. We placed three experimental stations at the edges of the room, one for every instrument (pipetting station, plate sealer, and plate reader).
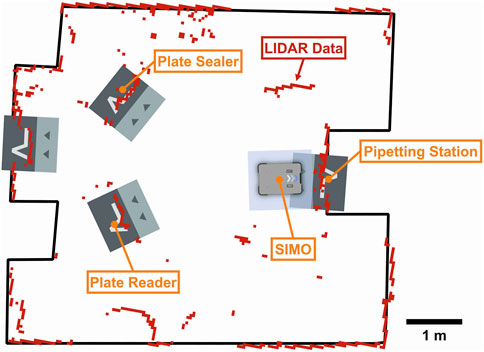
Figure 7. Map of the laboratory, generated by the MiR’s LiDAR, showing the positions of the three experimental stations: the plate sealer, plate reader, and pipetting station. The gray, double-colored squares represent recorded navigation points, while the robot’s current position is shown as a monocolored gray rectangle labeled “SIMO.” The red marks indicate real-time LiDAR data, with the black lines representing the room’s hardcoded layout. If the LiDAR data (red) does not align with the black lines—for example, showing red dots or lines in the room’s interior—this indicates that objects are obstructing the LiDAR sensor.
Typically, laboratory instruments are arranged along various walls, either close together on the same bench or on separate benches, sometimes at different angles to accommodate spacing needs. Although this setup can be challenging, it is not the most complex scenario, as other factors, such as obstacles or additional equipment, can add even greater complications.
4 Results
4.1 Mockup instrument test
Our method is initially validated by comparing it with different localization strategies using the two mockup instruments. The first experiment seeks to identify the success associated with placing a plate in the mockup instrument
Figure 8 shows
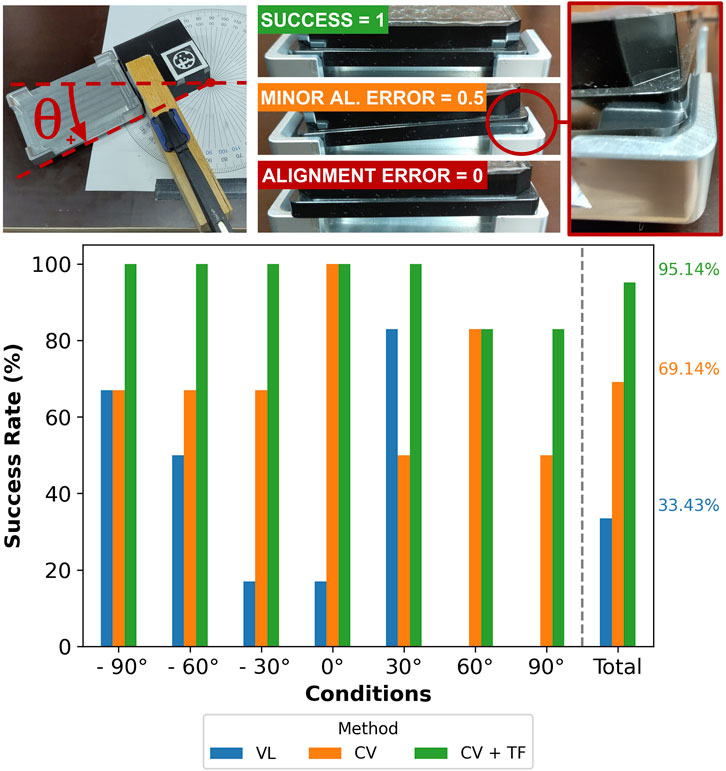
Figure 8. Assessment of the success rate for different methods (“VL,” “CV,” and “CV + TF”) and several angular displacements (ranging from
We tested the three methods (“VL,” “CV,” and “CV + TF”) by placing the mockup instrument in seven different orientations, ranging from
Figures 8, 9 show that while “CV + TF” requires almost double the time compared to “VL,” its global success rate (
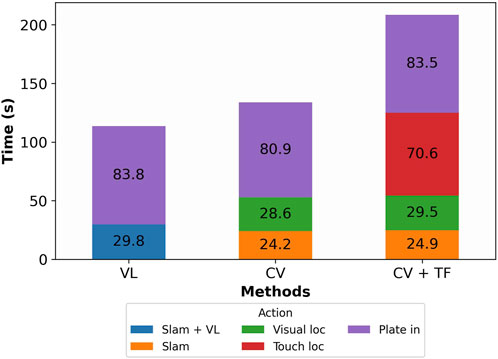
Figure 9. Column plot showing the total execution time for three methods (“VL,” “CV,” and “CV + TF”). The single column is split into colored rectangles that identify different actions performed by the robot; the time to run single actions is enclosed in the corresponding rectangle. “VL” is the fastest method, followed by “CV” and “CV + TF.”
Analyzing the data from Figure 8, Table 1 confirms that at least one group’s mean is statistically different from the others (the ANOVA test). Additionally, the Tukey test shows that the means of all groups are statistically different.
In the second experiment, we use
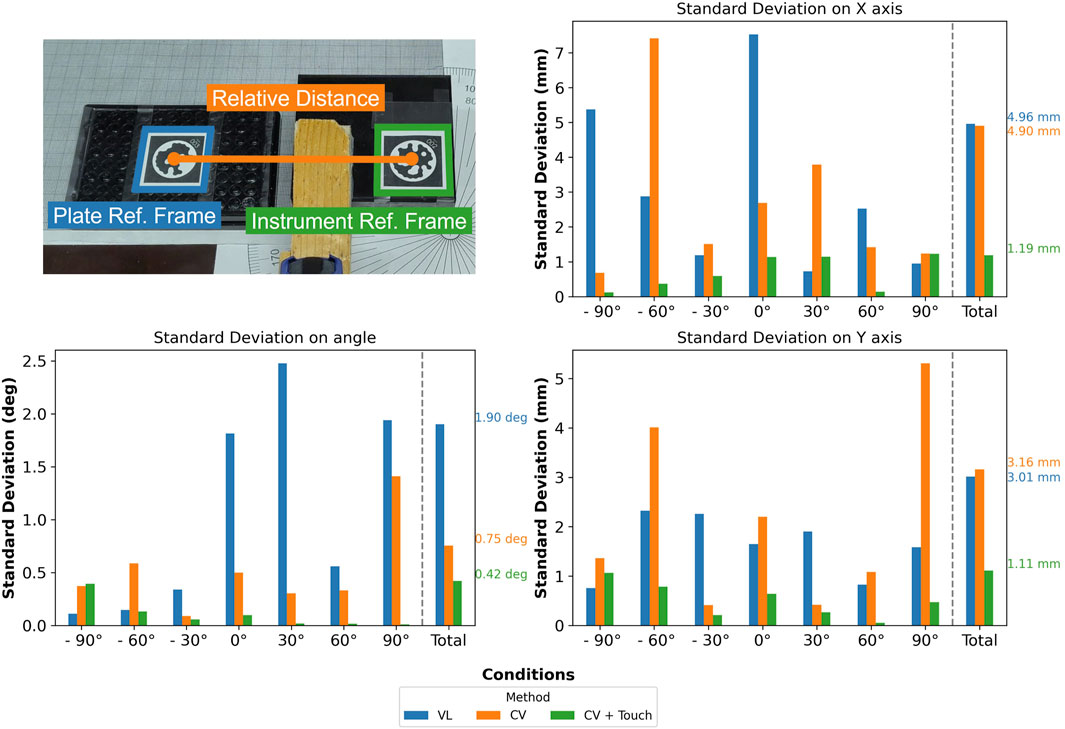
Figure 10. Assessment of the standard deviation (X, Y, and angular) of different methods (“VL,” “CV,” and “CV + TF”) for several angular displacements (ranging from
As in the previous experiment, by using a protractor and a clamp, it was possible to rotate the cube while preventing undesired movements when running the tactile detection; we also tested the same number of conditions to yield 63 experiments in total (21 per method).
From Figure 10, it is noticeable that “CV + TF” consistently outperforms the other strategies, explaining the higher success rate obtained, as shown in Figure 8. Additionally, we hypothesize that “CV’s” lower angular standard deviation, if compared to “VL,” determines the doubling of its success rate since the X and Y standard deviations are comparable.
In conclusion, “CV + TF” delivers the best performance, achieving a precision of
4.2 Real instrument tests
Following the mockup instrument tests, we next evaluate the performance of real instruments that have varied geometries and placement types. By doing this, we want to test the method’s generalizability, first introduced in Section 2.4.5.
Figure 11 illustrates the tested instruments, in order of increasing pick-and-place difficulty, from left to right. Each instrument was tested 10 times adding random noise each time:
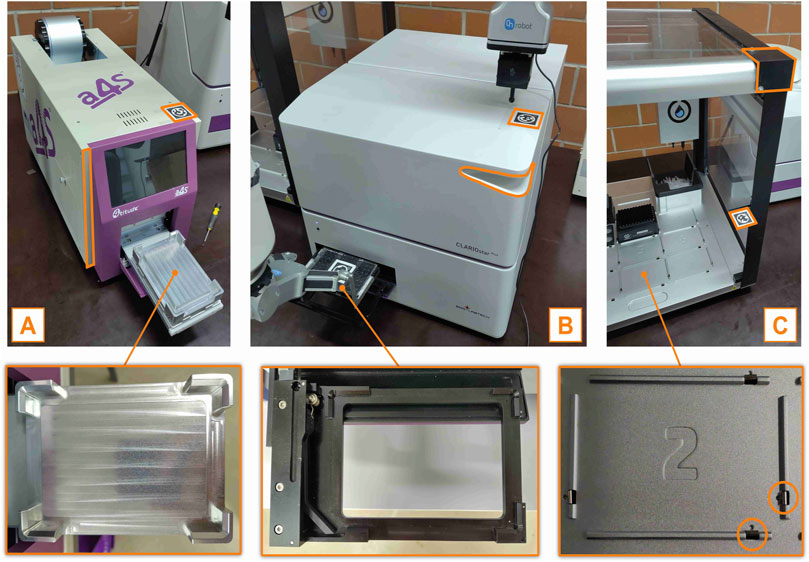
Figure 11. Photographs that show the three real instruments used to test the “CV + TF” method. (A): Plate sealer, (B): Plate reader, (C): Pipetting station. The important implementation details are highlighted in orange, while the photographs in the second row show the instruments’ handover position.
The plate sealer’s handover position has sharp, chamfered edges (Figure 11A) that facilitate plate placement, resulting in a 100% success rate during testing. In contrast, the plate reader’s handover position is less robust, with shorter edges and a smaller chamfer (Figure 11B). Nevertheless, we report a 100% success rate.
The pipetting station presents a more significant challenge for pick-and-place operations. As shown in Figure 11C, the station features very small chamfered edges and small metal lips that guide the plate into position. Although this design simplifies plate insertion for humans, it demands millimeter-level precision from robots to avoid failure. The flexibility of this part allows humans to easily adapt through learned behavior, while robots, which rely more on precise control and have less sophisticated adaptive feedback, are more likely to fail the task. Although this metal part is removable, we decided to test SIMO in a more challenging scenario; we report a 100% success rate.
4.3 Large-scale stress test
Finally, we use SIMO to run an experiment that requires all three instruments mentioned in the last section, CMC determination, to test the method’s robustness over extended periods of time. We defined this to be the “large-scale stress test.” The room was organized as per Section 3.4.
We report that SIMO can run the CMC experiment five times in a row without failure (total time of experiment = 1 h 15 min). Figure 12 shows the robot’s trajectory over one run; after placing the plate in the pipetting station, SIMO brings the standard microplate filled with the reagents to the plate sealer, which applies a plastic cover to the plate to avoid evaporation. Finally, SIMO brings the standard microplate to the plate reader, where the fluorescence signal from the experiment is read; the raw data can be processed to extract the CMC. The analyzed plate is discarded, and a new cycle can start. This consistent performance across multiple cycles underscores the robustness and reliability of our approach.
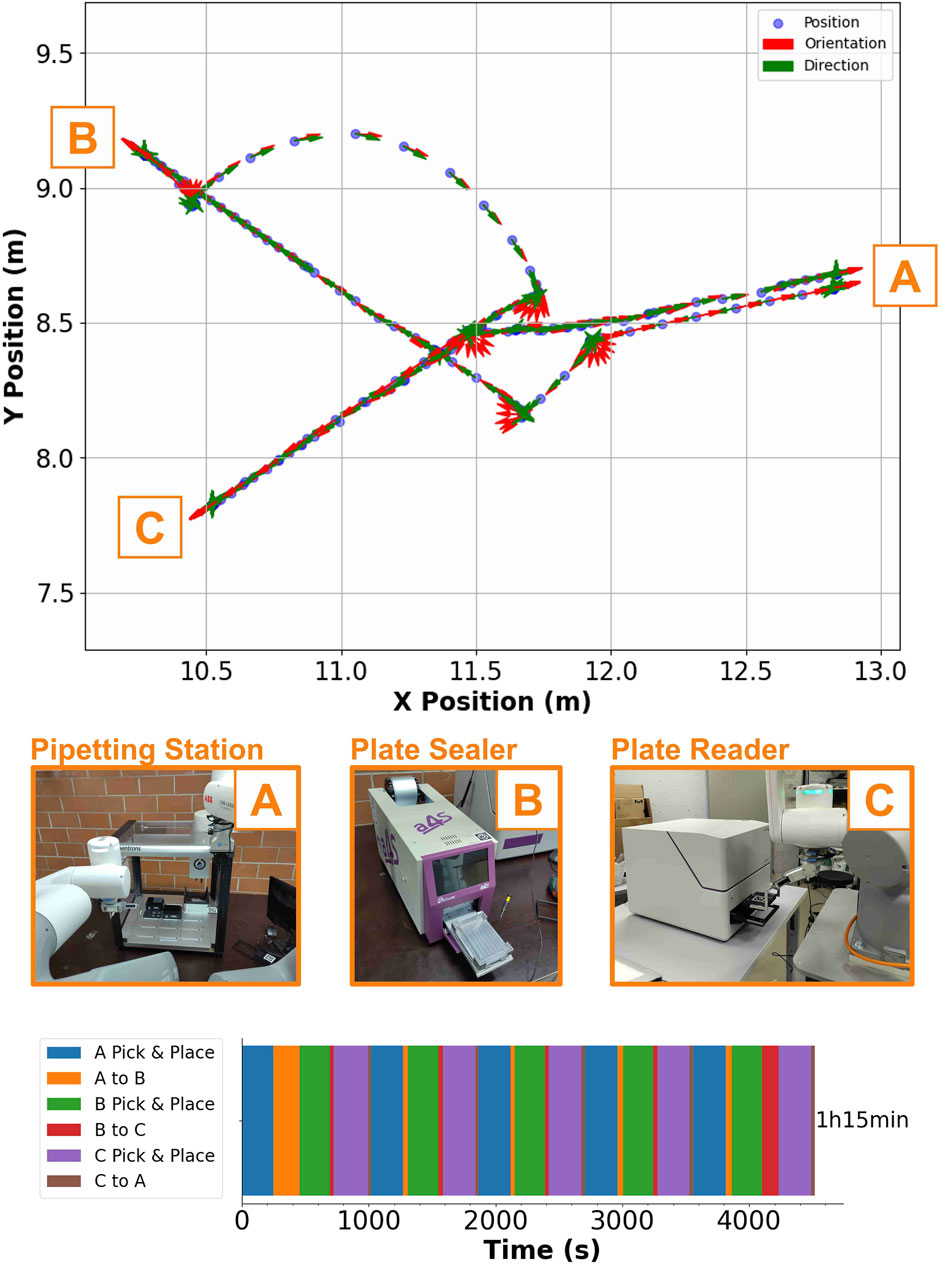
Figure 12. Summary of the large-scale stress test. The upper plot shows the robot’s position in the room as it is executing one round of the CMC experiment; the orange letters highlight the positions of the three experimental stations on the map ((A): Plate sealer, (B): Plate reader, (C): Pipetting station). The photographs in the middle illustrate the robot–instrument interaction, while the single horizontal column plot in the lower part shows the total time to run the CMC protocol five times in a row ((A): Plate sealer, (B): Plate reader, (C): Pipetting station). Every color highlights the time to perform a specific task to complete the experiment.
5 Conclusion
In this work, we present an algorithm that couples visual and tactile feedback to achieve fine pick and place (
Future improvements to our method might include generalizing it to multiple mobile manipulators, designing a single compact gripper capable of vision and touch perception coupled with pick-and-place capabilities, and developing error recovery strategies. For instance, if a marker is not detected by the camera, investigating possible fiducial marker search strategies could be beneficial. Although the presented method demonstrates significant promise, certain bottlenecks may limit its overall throughput and efficiency. One of the primary challenges is represented by the sequential nature of robotic tasks, where the robot must complete one step before advancing to the next. This leads to potential downtime, especially in high-throughput environments, requiring the simultaneous handling of multiple tasks. Additionally, interactions with instruments, such as calibration and localization using fiducial markers, can become time-intensive if environmental conditions change or markers are not promptly detected. To overcome these limitations, future work could focus on enabling parallel task execution with multiple robots, optimizing path planning algorithms to minimize idle time, and advancing sensor fusion techniques to enhance localization speed and accuracy. Finally, it would also be useful to test the wet laboratory experimental robustness of the system by performing real chemistry and biology experiments to assess which additional benefits a robotic platform can bring to the laboratory. These enhancements could significantly boost throughput and fully harness the potential of mobile robotic systems in dynamic laboratory environments.
Efforts to achieve universal, reliable robotic localization in dynamic environments have the potential to reshape wet laboratory research. Automating non-value-adding activities such as labware transportation will improve the reliability and reproducibility of experimental data by virtually eliminating human error.
Human error in laboratory settings can manifest in various ways, such as fatigue, distraction, or minor inconsistencies in manual dexterity, which introduce variability into experimental procedures. Manual data recording errors, such as incorrect measurements or conditions, further compound inaccuracies. Automating repetitive, precision-critical tasks, including pipetting or plate handling, allows for consistent, millimeter-level accuracy and error-free data collection. This can greatly benefit routine protocols like CMC, enabling a new experimental pace with mobile robots that can potentially work continuously, unlike humans.
Data availability statement
The original contributions presented in the study are included in the article/supplementary material; further inquiries can be directed to the corresponding author.
Author contributions
VS: conceptualization, data curation, formal analysis, investigation, software, validation, visualization, writing–original draft, and writing–review and editing. JT: investigation, software, visualization, writing–original draft, and writing–review and editing. FS: conceptualization, funding acquisition, supervision, and writing–review and editing. JH: conceptualization, formal analysis, supervision, validation, and writing–review and editing.
Funding
The author(s) declare that financial support was received for the research, authorship, and/or publication of this article. This work was supported by the ERC Advanced Grant (884114-NaCRe). Open access funding by Swiss Federal Institute of Technology in Lausanne (EPFL).
Acknowledgments
The authors would like to thank Enrico Eberhard (AICA) and Julien Fizet (Jag Jakob AG) for the technical support to the project.
Conflict of interest
The authors declare that the research was conducted in the absence of any commercial or financial relationships that could be construed as a potential conflict of interest.
Publisher’s note
All claims expressed in this article are solely those of the authors and do not necessarily represent those of their affiliated organizations, or those of the publisher, the editors, and the reviewers. Any product that may be evaluated in this article, or claim that may be made by its manufacturer, is not guaranteed or endorsed by the publisher.
Supplementary material
The Supplementary Material for this article can be found online at: https://www.frontiersin.org/articles/10.3389/frobt.2024.1462717/full#supplementary-material
References
Abolhasani, M., and Kumacheva, E. (2023). The rise of self-driving labs in chemical and materials sciences. Nat. Synth. 2, 483–492. doi:10.1038/s44160-022-00231-0
Ali, M. M., Liu, H., Stoll, N., and Thurow, K. (2016). “Multiple lab ware manipulation in life science laboratories using mobile robots,” in 2016 17th international conference on mechatronics-mechatronika (ME), (Prague, Czech Republic: IEEE), 1–7.
Benligiray, B., Topal, C., and Akinlar, C. (2019). Stag: a stable fiducial marker system. Image Vis. Comput. 89, 158–169. doi:10.1016/j.imavis.2019.06.007
Bostelman, R., Hong, T., and Marvel, J. (2016). Survey of research for performance measurement of mobile manipulators. J. Res. Natl. Inst. Stand. Technol. 121, 342. doi:10.6028/jres.121.015
Burger, B., Maffettone, P. M., Gusev, V. V., Aitchison, C. M., Bai, Y., Wang, X., et al. (2020). A mobile robotic chemist. Nature 583, 237–241. doi:10.1038/s41586-020-2442-2
Dai, T., Vijayakrishnan, S., Szczypiński, F. T., Ayme, J.-F., Simaei, E., Fellowes, T., et al. (2024). Autonomous mobile robots for exploratory synthetic chemistry. Nature 635, 890–897. doi:10.1038/s41586-024-08173-7
Duckworth, P., Hogg, D. C., and Cohn, A. G. (2019). Unsupervised human activity analysis for intelligent mobile robots. Artif. Intell. 270, 67–92. doi:10.1016/j.artint.2018.12.005
Falbe, J. (2012). Surfactants in consumer products: theory, technology and application. Springer Science & Business Media.
Ghodsian, N., Benfriha, K., Olabi, A., Gopinath, V., and Arnou, A. (2023). Mobile manipulators in industry 4.0: a review of developments for industrial applications. Sensors 23, 8026. doi:10.3390/s23198026
Holland, I., and Davies, J. A. (2020). Automation in the life science research laboratory. Front. Bioeng. Biotechnol. 8, 571777. doi:10.3389/fbioe.2020.571777
Hvilshøj, M., Bøgh, S., Skov Nielsen, O., and Madsen, O. (2012). Autonomous industrial mobile manipulation (aimm): past, present and future. Industrial Robot An Int. J. 39, 120–135. doi:10.1108/01439911211201582
Kalaitzakis, M., Cain, B., Carroll, S., Ambrosi, A., Whitehead, C., and Vitzilaios, N. (2021). Fiducial markers for pose estimation: Overview, applications and experimental comparison of the artag, apriltag, aruco and stag markers. J. Intelligent & Robotic Syst. 101, 71–26. doi:10.1007/s10846-020-01307-9
Laveille, P., Miéville, P., Chatterjee, S., Clerc, E., Cousty, J.-C., De Nanteuil, F., et al. (2023). Swiss CAT+, a data-driven infrastructure for accelerated catalysts discovery and optimization. Chimia 77, 154–158. doi:10.2533/chimia.2023.154
Lieberherr, R., and Peter, O. (2021). “An autonomous lab robot for cell culture automation in a normal lab environment,” in SiLA conference 12.
Lunt, A. M., Fakhruldeen, H., Pizzuto, G., Longley, L., White, A., Rankin, N., et al. (2024). Modular, multi-robot integration of laboratories: an autonomous workflow for solid-state chemistry. Chem. Sci. 15, 2456–2463. doi:10.1039/d3sc06206f
Mabrouk, M. M., Hamed, N. A., and Mansour, F. R. (2023). Spectroscopic methods for determination of critical micelle concentrations of surfactants; a comprehensive review. Appl. Spectrosc. Rev. 58, 206–234. doi:10.1080/05704928.2021.1955702
Madsen, O., Bøgh, S., Schou, C., Andersen, R. S., Damgaard, J. S., Pedersen, M. R., et al. (2015). Integration of mobile manipulators in an industrial production. Industrial Robot An Int. J. 42, 11–18. doi:10.1108/ir-09-2014-0390
Nguyen, T.-H., Kovács, L., Nguyen, T.-D., and Kovács, L. (2024). The development of robotic manipulator for automated test tube. Acta Polytech. Hung. 21, 89–108. doi:10.12700/aph.21.9.2024.9.7
Sánchez-Ibáñez, J. R., Pérez-del Pulgar, C. J., and García-Cerezo, A. (2021). Path planning for autonomous mobile robots: a review. Sensors 21, 7898. doi:10.3390/s21237898
Schramm, L. L., Stasiuk, E. N., and Marangoni, D. G. (2003). 2 surfactants and their applications. Annu. Rep. Section” C”(Physical Chem.) 99, 3–48. doi:10.1039/b208499f
Thurow, K. (2021). “Automation for life science laboratories,” in Smart biolabs of the future (Springer), 3–22.
Wadsten Rex, J., and Klemets, E. (2019). Automated deliverance of goods by an automated guided vehicle. Sweden: Chalmers University of Technology. Master’s thesis.
Wolf, Á., Wolton, D., Trapl, J., Janda, J., Romeder-Finger, S., Gatternig, T., et al. (2022). Towards robotic laboratory automation plug & play: the “lapp” framework. SLAS Technol. 27, 18–25. doi:10.1016/j.slast.2021.11.003
Wolf, Á., Romeder-Finger, S., Széll, K., and Galambos, P. (2023). Towards robotic laboratory automation plug & play: survey and concept proposal on teaching-free robot integration with the lapp digital twin. SLAS Technol. 28, 82–88. doi:10.1016/j.slast.2023.01.003
Wolf, Á., Beck, S., Zsoldos, P., Galambos, P., and Széll, K. (2024). “Towards robotic laboratory automation plug & play: lapp pilot implementation with the mobert mobile manipulator,” in 2024 IEEE 22nd jubilee international symposium on intelligent systems and informatics (SISY). 000059–000066. doi:10.1109/SISY62279.2024.10737581
You, W. S., Choi, B. J., Moon, H., Koo, J. C., and Choi, H. R. (2017). Robotic laboratory automation platform based on mobile agents for clinical chemistry. Intell. Serv. Robot. 10, 347–362. doi:10.1007/s11370-017-0233-x
Keywords: robot manipulation, automation, computer vision, life science, mobile robotics
Citation: Scamarcio V, Tan J, Stellacci F and Hughes J (2025) Reliable and robust robotic handling of microplates via computer vision and touch feedback. Front. Robot. AI 11:1462717. doi: 10.3389/frobt.2024.1462717
Received: 10 July 2024; Accepted: 09 December 2024;
Published: 07 January 2025.
Edited by:
Kensuke Harada, Osaka University, JapanReviewed by:
Salih Murat Egi, Galatasaray University, TürkiyeKuppan Chetty Ramanathan, SASTRA Deemed to be University, India
Riccardo Minto, University of Padua, Italy
Copyright © 2025 Scamarcio, Tan, Stellacci and Hughes. This is an open-access article distributed under the terms of the Creative Commons Attribution License (CC BY). The use, distribution or reproduction in other forums is permitted, provided the original author(s) and the copyright owner(s) are credited and that the original publication in this journal is cited, in accordance with accepted academic practice. No use, distribution or reproduction is permitted which does not comply with these terms.
*Correspondence: Josie Hughes, am9zaWUuaHVnaGVzQGVwZmwuY2g=
 Vincenzo Scamarcio
 Jasper Tan2
 Josie Hughes