 Tadatoshi Kurogi
 Yuki Inoue
 Takeshi Fujiwara1,2
 Kouta Minamizawa
- 1Toyoda Gosei Co., Ltd., Aichi, Japan
- 2Keio University Graduate School of Media Design, Yokohama, Japan
- 3Graduate School of Informatics and Engineering, The University of Electro-Communications, Tokyo, Japan
Haptic Augmented Reality (HAR) is a method that actively modulates the perceived haptics of physical objects by presenting additional haptic feedback using a haptic display. However, most of the proposed HAR research focuses on modifying the hardness, softness, roughness, smoothness, friction, and surface shape of physical objects. In this paper, we propose an approach to augment the perceived stickiness of a physical object by presenting additional tactile feedback at a particular time after the finger lifts off from the physical object using a thin and soft tactile display suitable for HAR. To demonstrate this concept, we constructed a thin and soft tactile display using a Dielectric Elastomer Actuator suitable for HAR. We then conducted two experiments to validate the effectiveness of the proposed approach. In Experiment 1, we showed that the developed tactile display can augment the perceived stickiness of physical objects by presenting additional tactile feedback at appropriate times. In Experiment 2, we investigated the stickiness experience obtained by our proposed approach and showed that the realism of the stickiness experience and the harmony between the physical object and the additional tactile feedback are affected by the frequency and presentation timing of the tactile feedback. Our proposed approach is expected to contribute to the development of new applications not only in HAR, but also in Virtual Reality, Mixed Reality, and other domains using haptic displays.
1 Introduction
One of the primary goals for researchers involved in haptic presentation is to develop a method that actively replicates all haptic sensations at a level where users feel as if they are touching real objects. Despite various innovative haptic presentation methods proposed, only a limited range of haptic sensations can be reproduced with such high fidelity that users feel as if they are interacting with real objects. This limitation arises from the complexity of human haptic perception, which is influenced by multiple physical factors such as shape, hardness, roughness, friction, warmth, and coldness. Reproducing all these factors convincingly using only haptic displays poses significant challenges. Haptic Augmented Reality (HAR), which overlays haptic stimuli generated by physical objects onto haptic feedback produced by haptic displays (Jeon et al., 2015), holds promise in addressing this challenge. HAR compensates for the limitations of haptic displays by integrating haptic feedback from physical objects with active haptic feedback from the display itself. For instance, in developing a tactile presentation system that actively modulates roughness, HAR could focus on reproducing only the roughness information using tactile displays while supplementing other passive haptic elements (such as shape, hardness, and temperature) using physical objects. Thus, HAR has the potential to offer a wide range of highly realistic haptic experiences and is expected to enhance user experiences across various applications, e.g., tumor palpation training (Jeon et al., 2011; Jeon and Harders, 2014), surgical training (Fani et al., 2017), task performance enhancement (Borst and Volz, 2005; Maisto et al., 2017), prototyping assistance (Withana et al., 2018), and entertainment (Lopes et al., 2018).
Haptic experiences occur so often in healthcare and medicine. For instance, doctors may feel the hardness of tumors by palpating affected areas, or feel stickiness when touching oily or sweaty skin that appears as one of the symptoms of skin diseases (Gerling and Thomas, 2005; Schwartz et al., 2006; Swinn et al., 2003). In particular, the stickiness of skin is a sensation relevant not only in medical contexts but also in daily healthcare, such as when users check the health of their skin or the effectiveness of cosmetics products. Several studies have examined the perception mechanism of the stickiness sensation, revealing two contact modes: friction, which occurs horizontally on the skin surface when tracing an object horizontally, and adhesion-separation, which occurs when an object attached to the skin separates vertically from the skin as the finger lifts off from the object (Jiang and Wang, 2020; Kim et al., 2017; Yeon et al., 2017). These two contact modes were suggested to exhibit different characteristics (Jiang and Wang, 2020) and be indicated to be selectively employed depending on the task, cultural influences, and other factors (Arakawa et al., 2021).
Nonetheless, most prior approaches to modulating stickiness in HAR have primarily concentrated on the friction contact mode, which occurs when a finger moves horizontally over object surfaces. For instance, (Winfield et al., 2007), proposed a method to reduce physical object friction without the need for attaching a tactile device to the fingertip by utilizing the squeeze film effect. (Bau et al., 2010). proposed a method to enhance the frictional force between a physical object surface and a finger by using the electrovibration caused by the electrostatic attraction of the finger to the surface. (Salazar et al., 2020). demonstrated that the stiffness, shape, and friction of a physical object can be modulated by employing a wearable cutaneous stimuli display. These previous findings enabled stickiness modulation by altering the friction force during horizontal movement on the object surface. However, the friction contact mode and the adhesion-separation contact mode involve distinct directions and temporal variations of the forces acting on the finger. Thus, these methods, which do not prioritize the accurate replication of the force exerted when a finger is vertically pulled away from the adhering object, cannot effectively modulate the adhesion-separation contact mode.
Therefore, we propose a method to present the sensation of stickiness in the adhesion-separation contact mode in HAR. A key challenge in accomplishing this is the difficulty of thin and soft tactile displays designed for HAR to accurately reproduce the vertical pulling force exerted by adhesion on the skin of the finger. Several haptic displays capable of simulating adhesion in the adhesion-separation contact mode have been proposed in Virtual Reality (VR) and other related fields. For instance, (Yamaoka et al., 2008), utilized a suction mechanism to simulate the force of adhesion pulling on a finger, thus generating a sensation of stickiness. (Hashimoto et al., 2009). reported that the perception of stickiness could be elicited by applying negative pressure to the palm using a cone-shaped loudspeaker. (Ishihara et al., 2020). introduced a technique for actively modulating physical stickiness by employing a temperature-dependent variable sticky substance. However, these methods typically necessitate covering the finger with bulky haptic displays to simulate suction or adhesion, thereby hindering the conveyance of detailed tactile sensations from the physical object to the user’s finger. To address this limitation, we focused on the mechanism of human sticky perception in the adhesion-separation contact mode.
Several studies exploring the relationship between perceived sticky in this mode and physical variables between skin and object surfaces revealed that the intensity of perceived sticky is not dependent on the force exerted when the finger is lifted off from the attached object (
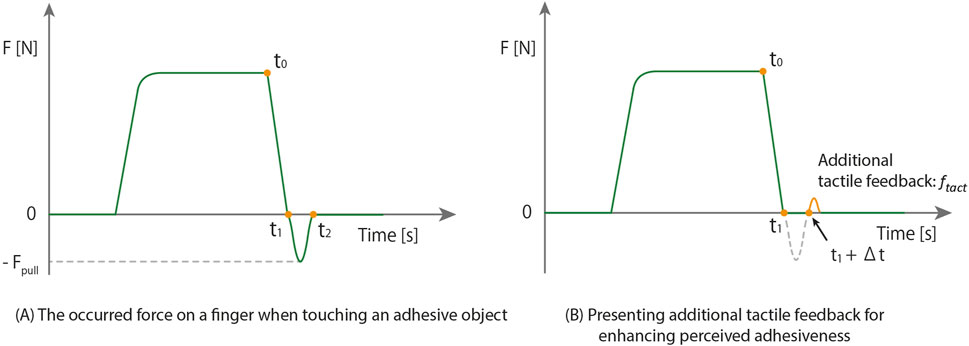
Figure 1. The working principle of a basic dielectric elastomer actuator and developed DEA-based tactile display. (A) the occurred force on a finger when touching an adhesive object. (B) presenting additional tactile feedback for enhancing perceived adhesiveness..
The main contributions of our study are summarized as follows:
The rest of this paper is organized as follows: Section 2 provides a review of related research. Section 3 introduces the tactile display employed for hypothesis testing, covering its structure, performance evaluation, and tactile feedback algorithm. In Section 4, we assess the performance of our stickiness augmentation approach. Section 5 outlines a user study conducted to gain insights into the stickiness experience generated by our approach. Finally, we conclude this paper with a summary of our work in Section 6.
2 Related work
2.1 Haptic augmented reality
Research in HAR explored various applications, including medical training (Jeon et al., 2011; Jeon and Harders, 2014), surgical procedures (Li et al., 2007; Yao et al., 2004), and workplace assistance (Abbott et al., 2007; Abbott and Okamura, 2003; Nojima et al., 2002; Zoran and Paradiso, 2012). However, these studies assumed human interaction with the environment through tools. Conversely, some HAR systems were designed for direct interaction with objects using the user’s finger, akin to clinician palpation. An essential requirement for such HAR systems is to ensure that fine haptic stimuli from physical objects are effectively transmitted to the user’s finger via the haptic display. To address this, researchers proposed different approaches. One method involves haptic presentation techniques that do not encase the finger with a haptic display, e.g., nail-mounted haptic display (Ando et al., 2002), haptic displays on different body parts (Asano et al., 2014; Salazar et al., 2020), fingerpad deformation-restricted display (Tao et al., 2021), electrical muscle stimulation (Lopes et al., 2018), electrovibration (Bau et al., 2010), reverse electrovibration (Bau and Poupyrev, 2012), and the squeeze film effect (Winfield et al., 2007). Another approach is to utilize thin-film, soft tactile displays to convey detailed haptic stimuli from physical objects to the fingers. Examples of such displays include the Fabric Yielding Display (Condino et al., 2016; Fani et al., 2017), electrotactile stimulation (Kajimoto et al., 2004; Withana et al., 2018; Yoshimoto et al., 2015), and DEA (Ji et al., 2021). A study investigating the impact of device rigidity attached to the skin on environmental haptic stimuli found that lower rigidity, determined by device thickness and elasticity, resulted in reduced reduction in tactile sensitivity (Nittala et al., 2019). Therefore, even when a finger is covered with a tactile display, the use of thin film and soft tactile displays can transmit fine tactile stimuli to the finger.
These methods primarily focused on actively modulating the properties such as hardness, softness, friction, shape of physical objects in HAR. However, they do not focus the modulation of the stickiness sensation arising from the adhesion-separation contact mode, which occurs when the finger vertically lifts off from the physical object. Hence, we propose a HAR method aimed at actively augmenting the stickiness perceived by humans during the adhesion-separation contact mode.
2.2 Stickiness haptic presentation method
In VR, some haptic feedback methods have been proposed to reproduce stickiness. While these studies primarily focus on VR rather than HAR, the underlying principles may apply to HAR as well. For instance, (Costes et al., 2019), demonstrated that by pseudo-haptics, which control visual stimuli in response to the user’s finger movements on a touchscreen, it is possible to modulate the perceived stickiness. Although this method primarily targeted interaction on touch screens, thus modulating stickiness in the friction contact mode, its extension to three dimensions suggests potential applicability to the adhesion-separation contact mode. Indeed, (Yem et al., 2018), showed that the perception of stickiness in the adhesion-separation contact mode could be reproduced using pseudo-haptics. Additionally, they demonstrated that stickiness could also be perceived by selectively stimulating the flexor tendons inside the finger through transcutaneous electrical stimulation.
These methods utilizing pseudo-haptics or electrical stimulation of flexor tendons enable the modulation of stickiness in the adhesion-separation contact mode. Furthermore, since there is no need to wear bulky haptic displays on fingertips, these approaches are considered applicable to HAR. However, these approaches rely on proprioceptive senses to induce the perception of stickiness, thus may have limitations on the reproducible stickiness sensation. It has been suggested that pseudo-haptics is an illusion of proprioception that arises from the dominance of visual information when there is a discrepancy between visual input and proprioceptive feedback (Lécuyer, 2009). Therefore, using pseudo-haptics to present stickiness can be regarded as a method of haptic presentation that influences proprioceptive senses. Similarly, transcutaneous electrical stimulation of flexor tendons is a technique that evokes haptic sensations through proprioceptive feedback generated by stimulating the tendons. Consequently, this method can also be considered a method of presenting stickiness by affecting proprioceptive senses, much like pseudo-haptics. Here, proprioceptive senses are less sensitive to stimuli of smaller magnitudes compared to cutaneous sensations. Thus, the contribution of proprioceptive senses to haptic perception decreases as the force on the fingertips diminishes, while the contribution of cutaneous sensations increases (Matsui et al., 2013). Consequently, while proprioceptive-focused stickiness presentation approaches may be suitable for reproducing strong stickiness, they may have limitations in reproducing weak stickiness that is not perceivable through proprioceptive senses alone.
Hence, in this study, we propose a novel approach focusing on stickiness perception derived from cutaneous sensations, aiming to reproduce stickiness perception through the stimulation of tactile sensations.
2.3 DEA-based haptic display
The basic DEA comprises two layers of soft electrodes and one layer of soft dielectric material (Pelrine et al., 1997). When a potential difference is applied between the electrodes, the DEA contracts in the stacking direction while stretching in the in-plane direction due to the Coulomb force between the electrodes (Figure 2B). Upon reducing the potential difference, the DEA returns to its initial shape, driven by the restorative force of the material. Consequently, the DEA can produce various vibrations by adjusting the frequency and voltage of the applied voltage. DEAs demonstrate high efficiency in displacement and actuation force relative to their size and weight, despite being thin and lightweight (Gu et al., 2017). For instance, (Ji et al., 2021), achieved a tactile display with a thickness of only 18
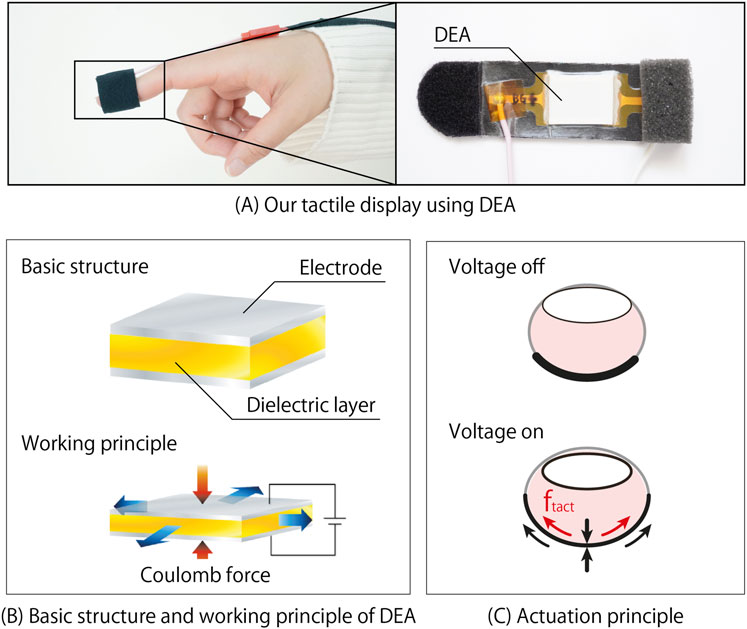
Figure 2. The working principle of a basic dielectric elastomer actuator and developed DEA-based tactile display. (A) our tactile display using DEA. (B) basic structure and working principle of DEA. (C) actuation principle.
Various DEA-based haptic displays proposed, including taxel array tactile displays (Koo et al., 2008), multilayered configurations (Jungmann and Schlaak, 2002), hydrostatic coupling and hydraulic amplification (Carpi et al., 2009), convex protrusion deformation (Koo et al., 2008; Mun et al., 2018), integrated visual-haptic interfaces (Yun et al., 2019), and ultra-thin DEA-based tactile display (Ji et al., 2021). Inspired by these innovations, we developed a thin-film, soft DEA-based tactile display to implement stickiness augmentation method in the adhesion-separation contact mode for HAR.
3 System
3.1 DEA-based tactile display
Our proposed method for stickiness augmentation in the adhesion-separation contact mode for HAR involves introducing additional tactile feedback to evoke the sensation of complete detachment of the object from the skin, thereby altering the perceived stickiness. In this study, we used vibration as the additional tactile feedback instead of skin stretching or quasi-static indentations. This choice was made because vibration is a common and widely used method for tactile presentation. Identifying a technique that can convey stickiness through vibration feedback could make it broadly applicable, not only to the device used in this study but also to other widely used devices. Figure 2 shows the tactile display developed to assess the effectiveness of this approach. Our tactile display comprises a DEA, a stretchable band with Velcro for finger attachment, a sponge for improved wearability, and a protective film. Users wear this tactile display to their fingertips without applying any voltage to the DEA (Figure 2C). Subsequently, when voltage is applied to the DEA at the appropriate timing, it contracts in the stacking direction and stretches in the in-plane direction. Upon cutting off the voltage, the DEA returns to its initial state, providing tactile stimulation to the finger in three dimensions.
Although our DEA was manufactured with a thickness of only 0.672 mm to transmit detailed tactile stimuli from physical objects to the fingertips, its in-plane size was 10.0 mm
For the dielectric layer of our DEA, we utilized a material composed of a blend of silicon and ferromagnetic material (with a relative permittivity of 4 and a Young’s modulus of 0.8 MPa). The electrodes were fabricated from a mixture of carbon black powder and silicon. Each layer of the dielectric material had a thickness of 22.4
3.2 Technical evaluation
As for the basic performance assessment of our DEA-based tactile display, we conducted measurements the output displacement characteristics concerning voltage and frequency. While a camera-based method was initially considered for measuring in-plane displacement, it posed limitations in capturing high-frequency vibrations, such as at 250 Hz (Hayashi et al., 2019). Hence, for this evaluation, we employed a displacement meter to measure the displacement in the stacking direction of our tactile display. Subsequently, we derived the in-plane displacement using the correlation between the stacking direction displacement and the in-plane displacement (Pelrine et al., 1997). Note that we assumed our DEA to have a Poisson’s ratio of 0.5 and to be isotropic in the in-plane direction.
To measure the stacking direction displacement, we placed the tactile display between two fixtures and positioned the displacement meter above it. We applied five different voltages (
Figure 3 depicts the in-plane displacement calculated from the measurement results. Overall, there was a tendency for displacement to increase with higher applied voltage, although it was observed that the displacement varied depending on the frequency. The variation in displacement with frequency is attributed to factors such as the resonance frequency of our tactile display, the response characteristics of the DEA including viscosity, and the voltage drop associated with high-frequency voltage application. This indicates that the output displacement with our tactile display is influenced by both frequency and voltage. We also prepared over 30 combinations of vibration feedback with various frequencies and voltages using our developed tactile display to preliminary internal explore perceivable frequency and voltage combinations. As a result, we determined that our tactile display can provide tactile feedback at
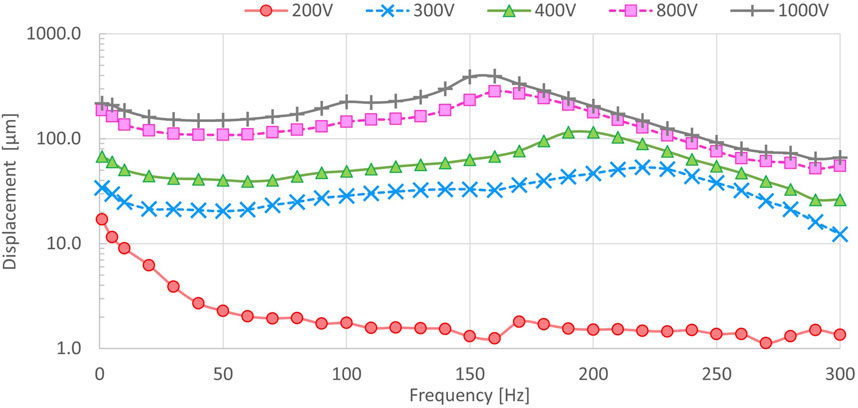
Figure 3. The output displacement of our DEA-based tactile display.
3.3 Tactile feedback algorithm
Our method was designed to provide tactile feedback to the finger to evoke the sensation of complete detachment of the object from the skin. To achieve this, we opted to provide additional tactile feedback for a certain duration
As the tactile feedback parameters varied between experiments, the specific
4 Experiment 1: Perceived adhesion evaluation
The primary objective of this experiment was to investigate whether participants’ perceived stickiness in adhesion-separation contact mode is augmented by providing additional tactile feedback at a certain duration after the finger lifts off from the object. To investigate this, we conducted an experiment varying the timing of the additional tactile feedback presentation.
4.1 Design and conditions
Participants were asked to touch a physical object twice while wearing our tactile display and to compare the two haptic stimuli. In one scenario, the haptic stimulus acted as the reference, producing only haptic sensations from the physical object without any additional tactile feedback from our tactile display. In the other scenario, the haptic stimulus served as a comparison, producing haptic stimulation from the physical object along with additional tactile feedback from our tactile display. After the two contact interactions, participants were tasked with comparing the two haptic stimuli they experienced and indicating which one exhibited stronger stickiness.
The physical object used in this experiment was consistent across all conditions. Additionally, the tactile feedback provided by our tactile display remained constant for all stimuli (
Additionally, we conducted the experiment with a total of eight conditions, including one where no additional tactile feedback was provided. A total of 80 trials were conducted, with 10 trials for each condition. To mitigate any potential order effects between the reference stimulus (without additional tactile feedback) and the comparison stimulus (with additional tactile feedback), the presentation order of each was counterbalanced. The order of presentation for each condition was randomized.
4.2 Participants
Fifteen non-disabled participants (2 female, left-handed: 3, mean age: 24.3, SD: 2.74) participated in this experiment. The experimental protocol was approved by the Toyoda Gosei Co., Ltd. Ethics Committee. All participants provided informed consent and received compensation for their time.
4.3 Apparatus
The experimental setup is depicted in Figure 4. Participants wore our tactile display on the index finger of their right hand and were instructed to focus on a touch screen LCD displaying instructions. Adjacent to the LCD, a platform held a physical object, a cylindrical Petri dish filled with silicone, measuring 60 mm in diameter and 45 mm in height, with a Young’s modulus of 235 kPa (Figure 5). To mitigate potential bias from participants realizing they were touching the same object repeatedly, multiple physical objects were placed on the table. Additionally, a curtain was employed to obstruct the participant’s view of the table, preventing them from discerning which object they were touching. A calibrated load cell positioned beneath the table detected both the pressure exerted by the participant on the physical object and the moment when the participant’s finger lifted from it. To avoid interference from the driving noise of our tactile display, participants wore headphones emitting white noise throughout the experiment.
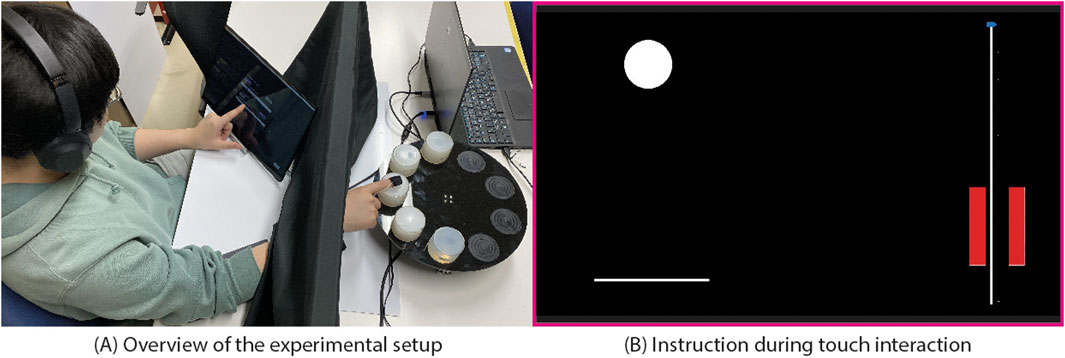
Figure 4. The setup of experiment. (A) overview of the experimental setup. (B) instruction during interaction.
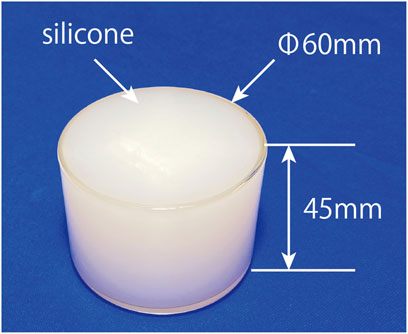
Figure 5. The Petri dish filled with silicone object.
4.4 Procedure
Once the experiment commenced, participants were instructed to position their fingers above the physical object. Guided by instructions presented on the LCD, they proceeded to exert pressure on the object with their fingers. Subsequently, they lifted their fingers off from the object and returned them to the initial position. This sequence was repeated for a second contact interaction following cues displayed on the LCD. Following these two interactions, participants were prompted to complete a questionnaire comparing the two haptic stimuli they perceived. Upon questionnaire completion, the subsequent trial commenced, with participants repeating the same sequence until the experiment ended.
The pressing instruction displayed on the LCD comprised a white circle and a line (Figure 4B). At the start of the experiment, the circle descended to the line over a duration of 1 s, remained stationary on the line for 1 s, and then ascended for 1 s to return to its initial position. Participants were instructed to synchronize their finger movements with the circle’s motion to make contact with the physical object, utilizing the circle as a representation of their finger and the line as the surface of the physical object. Specifically, participants were directed to press down on the physical object with their finger for one second, maintain contact with the physical object for one second, and then retract their finger to its initial position by moving it away from the physical object for one second. This protocol was implemented to control the speed of finger movement and the duration of pressure application on the physical object. It was motivated by previous findings indicating that the duration of pressure application influences the perception of stickiness (Nam et al., 2020). Furthermore, given that finger pressure was showed to influence perceived stickiness (Nam et al., 2020), a pressure slider displayed on the LCD was used to control the pressure applied by the participants (Figure 4A). Participants were instructed to exert pressure on the physical object while monitoring the slider to control the pressure level.
The instructed pressure range was from 1.5 N, the minimum pressure utilized in (Nam et al., 2020), up to a maximum of 2.2 N. However, participants were permitted to exceed 2.2 N if maintaining a stable pressing force within this range proved challenging. This instruction aimed to reduce the participant’s load, allowing them to concentrate on evaluating the tactile sensation. In this experiment, participants were required to adjust the speed of finger movement, the duration of finger contact with the physical object, and the force applied while pressing the object, all according to the provided instructions. Due to the complexity of these tasks, participants were allowed to exceed a pressing force of 2.2 N if maintaining a stable force proved difficult.
After two contact interactions, participants were tasked with rating the perceived haptic stimuli on the following four items: Q1. The second haptic stimulus was stickier. Q2. How sticky was the second haptic stimulus? Q3. The second haptic stimulus was harder. Q4. How hard was the second haptic stimulus? Q1 and Q3 utilized a two-alternative forced choice format, where participants selected “yes” if they perceived the second haptic stimulus as stickier or harder, respectively. Otherwise, they chose “no.” Q2 and Q4 aimed to estimate the magnitude of perceived stickiness and hardness, with a response range from −10 to +10. Participants reported positive values if they perceived the second haptic stimulus as stickier or harder, and negative values if they perceived it as less sticky or softer. They could select 0 if they perceived the intensity between the two haptic stimuli as comparable. The stickiness questions in Q1 and Q2 were adapted from those used in (Lee et al., 2019). Meanwhile, the hardness questions in Q3 and Q4 were created by replacing stickiness with hardness. This addition of hardness questions aimed to detect any acquiescence bias among the participants. If only stickiness questions in Q1 and Q2 were used, participants could infer that the experimenter aimed to modulate stickiness with additional tactile feedback. Consequently, they could report feeling stickiness by acquiescence bias, even if they did not perceived stickiness by the additional tactile feedback. Thus, including questions about hardness, which were not expected to change with this experiment, provided a means to detect such bias. By analyzing responses to Q3 and Q4, any potential occurrence of acquiescence bias could be detected, allowing for a more comprehensive evaluation of the experiment’s outcomes. Finally, after completing all the trials, participants underwent semi-structured interviews addressing the question items (i.e., Q1 through Q4).
4.5 Results
Figure 6 shows the experimental results for each condition. Initially, a Shapiro-Wilk normality test was performed for the recognition rate of the stickier haptic stimulus (Q1) and the recognition rate of the harder stimulus (Q3), indicating a violation of the normality assumption for both data. Consequently, a Wilcoxon signed-rank test with Bonferroni correction was employed. The analysis revealed a significant difference in the recognition rate of the sticker haptic stimulus (Q1) between the condition without additional tactile feedback and the
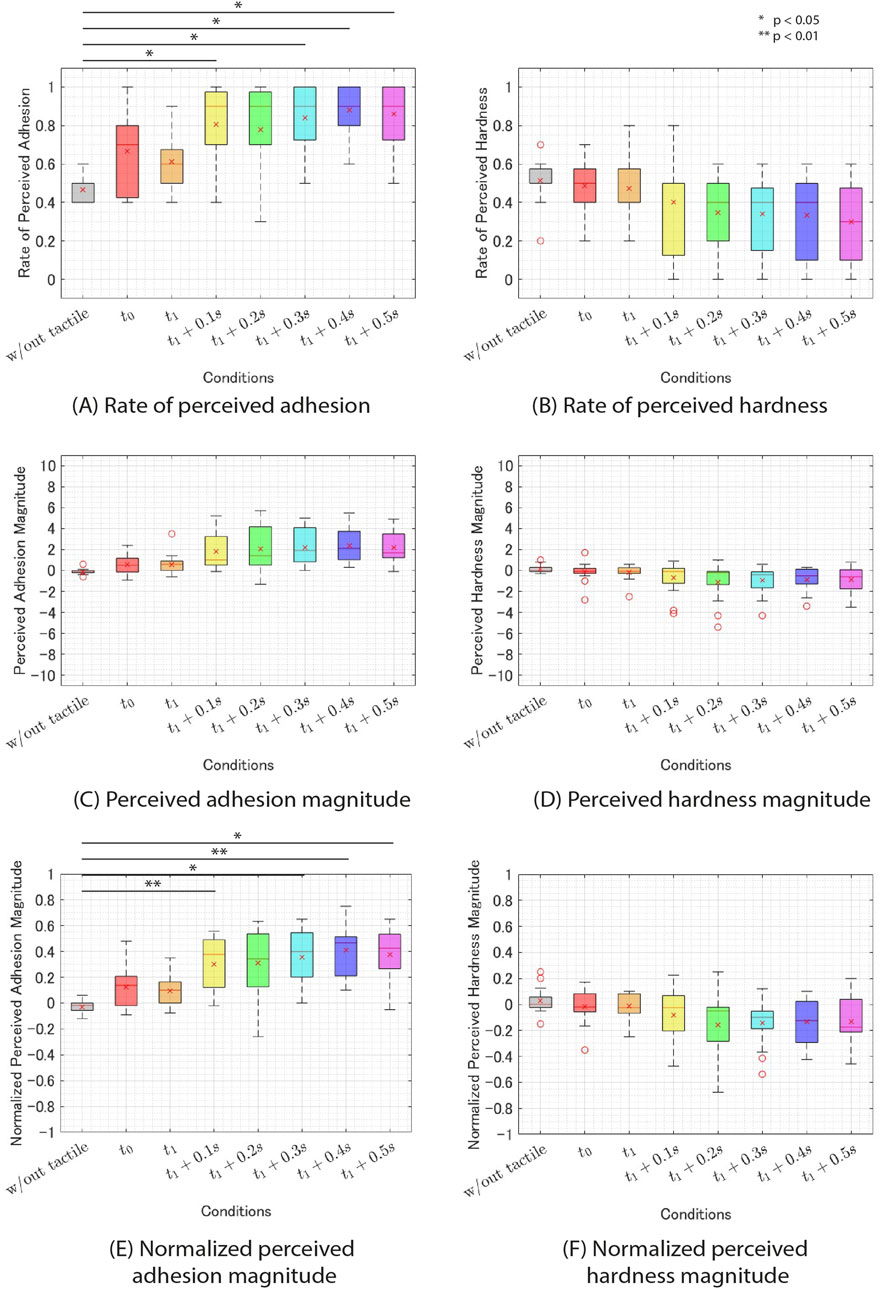
Figure 6. The results of experiment 1. (A) rate of perceived adhesion. (B) rate of perceived hardness. (C) perceived adhesion. (D) perceived hardness magnitude. (E) normalized percevied adhesion magnitude. (F) normalized percevied hardness magnitude.
Next, we analyzed the perceived magnitude of stickiness (Q2) and hardness (Q4). Since the maximum and minimum values of perceived stickiness and hardness varied across participants, the results were normalized by each participant’s maximum absolute response value. The normalized results are presented in Figures 6E, F. A Shapiro-Wilk normality test was conducted on the two sets of normalized results, revealing that both were normally distributed. However, Mendoza’s multisample sphericity test indicated that the normalized perceived stickiness magnitude violated the assumption of sphericity. Therefore, we performed a Wilcoxon signed-rank test with Greenhouse-Geisser adjustment and Bonferroni correction. The results revealed a significant difference in normalized perceived stickiness magnitude between the condition without additional tactile feedback and the
4.6 Discussion
4.6.1 The recognition rate of stickier haptic stimulus
The experimental results for the recognition rate of the stickier haptic stimulus (Q1) revealed that the
The displacement of the tactile feedback used to validate this method and the force applied to the finger were only 26.4
4.6.2 The recognition rate of the harder haptic stimulus
The experimental results for the recognition rate of the harder haptic stimulus (Q3) showed no significant differences between conditions. During post-experiment interviews, some participants (p4, p6, p10, p14, p15) reported little or no perception of differences in hardness. These results align with our expectation that presenting additional tactile feedback when lifting the finger off from the physical object does not alter the perceived hardness. Simultaneously, this outcome dismisses the possibility that the perceived stickiness results obtained in this experiment were influenced by acquiescence bias, thereby increasing the certainty of our analysis that our proposed method augments perceived stickiness.
However, contrary to our expectations, some subjects (p2, p9) reported perceiving more differences in hardness than in stickiness. Another subject (p8) reported that changes in stickiness also influenced the sensation of hardness. To further examine these results, let us consider objects with varying hardness. A hard object requires a strong force for elongation, while a soft object requires a weaker force. Consequently, if both objects possess the same adhesive strength, the hard object would detach the adhesive from the finger shortly after removal, whereas the soft object would take a comparatively longer time for complete detachment. The manipulation of the timing of additional tactile feedback presentation in this experiment may have been perceived as differences in detachment timing due to variations in hardness, thereby participants may have recognized differences in hardness. Further investigation into the relationship between stickiness and hardness sensation could contribute to the development of new haptic presentation techniques and a deeper understanding of human haptic perception mechanisms.
4.6.3 Perceived adhesion magnitude
The results of the experiment on normalized perceived stickiness magnitude (Q2) indicated that the conditions
In the
One possible reason for this result could be attributed to the effect of the small displacement of the additional tactile feedback utilized in this experiment. As noted in Section 4.6.1, the expected displacement and force of the tactile feedback employed in this experiment were only 26.4
Another potential factor is the absence of continuous tension exerted on the finger by the tactile feedback in our method. When interacting with a physically sticky object and subsequently releasing the finger, continuous tension and impulse are exerted on the finger by the adhesive. (Nam et al., 2020). reported that this impulse also correlates with perceived stickiness intensity. However, our approach is unable to reproduce this continuous tension and the impulse exerted by it. Hence, the absence of these factors may account for the weak adhesion perceived with our approach and the lack of correlation between t and perceived adhesion. Further exploration is needed to explore methods for enhancing the perceived adhesion strength using our approach.
5 Experiment 2: Evaluation of haptic experience
Our proposed stickiness augmentation approach for adhesion-separation contact mode in HAR involves presenting additional tactile feedback after a certain time after the user lifts a finger off the physical object. This approach differs from real-life adhesion phenomena, where the finger adheres to a physical object, and does not reproduce the continuous tension experienced between the finger and the adhering object when attempting to detach. Consequently, the stickiness experience generated by our method is not typical of everyday experiences. Hence, it is crucial to gain a deeper understanding of how users perceive the stickiness experience generated by our method to appropriately design applications using our approach. For instance, will users like it? Will the additional tactile feedback harmonize with the haptic stimuli obtained from the physical object? Do differences in the timing of additional tactile feedback presentation affect the stickiness experience? Do differences in the frequency of additional tactile feedback influence perceived stickiness or realism? Is there an interaction between presentation timing and frequency? In this experiment, we conducted a subjective evaluation of the stickiness sensation experience generated by our method to address some of these questions.
5.1 Design and conditions
Participants were instructed to touch a physical object to perceive the haptic sensation and then evaluate their haptic experience. In this experiment, following the protocol of Section 4, participants pressed their fingers onto the physical object in response to the movement of a circle displayed on the LCD screen, and subsequently lifted their fingers from the object. Additional tactile feedback was presented through our tactile display after the removal of the finger from the physical object. Subsequently, participants completed a questionnaire to evaluate the tactile feedback they experienced. Unlike in section 4, participants in this experiment encountered a single haptic feedback and provided subjective ratings solely for that experience. Moreover, participants had the opportunity to experience the haptic sensation multiple times until they were satisfied.
The additional tactile feedback generated by our tactile display can be determined using Equation 2. In this experiment, five frequencies of additional tactile feedback were utilized:
5.2 Participants
Ten non-disabled participants (2 female, mean age: 23.5, SD: 1.63) participated in this experiment. Eight of these participants were the same as those in Experiment 1. The experimental protocol was approved by the Toyoda Gosei Co., Ltd. Ethics Committee. All participants provided informed consent and received compensation for their time.
5.3 Apparatus
The experimental setup was replicated in Section 4. Participants were instructed to wear our tactile display on the index finger of their right hand and to focus on a touchscreen LCD displaying instructions. Adjacent to the LCD, a load cell equipped with a platform holding a physical object was positioned and concealed from the participants’ view by a curtain. Additionally, to avoid auditory distractions, participants wore headphones emitting white noise.
5.4 Procedure
Participants were required to experience additional tactile feedback generated at five different frequencies and three different presentation timings to respond to the questionnaire. Initially, participants were instructed to touch a physical object according to the instructions on the LCD touch panel. Participants were allowed to touch the physical object as many times as they wished until they were satisfied. After touching the physical object, they were required to evaluate their experience on the following 7 items: Q1. I felt adhesive due to the haptic feedback, Q2. I felt hardness due to the haptic feedback, Q3. The haptic feedback was realistic, Q4. The haptic feedback was believable, Q5. The haptic feedback was convincing, Q6. The haptic feedback was pleasant, Q7. The haptic feedback felt out of place. Q1 and Q2 were questions about stickiness and hardness, respectively. Q3, Q4, and Q5 were items to assess the realism of the haptic experience obtained, using questions proposed by (Sathiyamurthy et al., 2021). Q6 evaluated the pleasantness or unpleasantness of the haptic experience obtained, adopting questions used by (Bau et al., 2010). Q7 evaluated the harmony between the additional tactile feedback and the haptic stimuli obtained from the physical object, using questions proposed by (Sathiyamurthy et al., 2021). Participants rated these seven question items using a 7-point Likert scale. A score of 1 indicated “strongly disagree,” while 7 indicated “strongly agree.”
Participants were instructed to select a rating of 1 on all items if they did not perceive any additional tactile feedback after a number of touches. While it is common practice to instruct subjects to select 4, representing a neutral response, in this experiment, they were instructed to select 1 of all items. This instruction aimed to distinguish between instances where participants did not perceive additional tactile feedback and instances where participants selected 4 for all items. In this experiment, Q1 through Q6 represent the positive items in the questionnaire, with a rating of 7 indicating the most positive evaluation. While Q7 represents the negative item, with a rating of 7 indicating the most negative evaluation. Consequently, while it was possible for ratings from Q1 to Q7 to all become 4, it was considered unlikely for all of them to become 1. Thus, it was believed that by selecting 1 for all items, trials where additional tactile feedback was not perceived could be detected. However, since all items rated as 1 introduce bias in the results when analyzing the experimental data, after extracting the trials where additional tactile feedback was not perceived, and the results of these trials were discarded in the subsequent analysis. Finally, after completing all the trials, participants underwent semi-structured interviews addressing the question items (i.e., Q1 through Q7)
5.5 Results
In conditions of
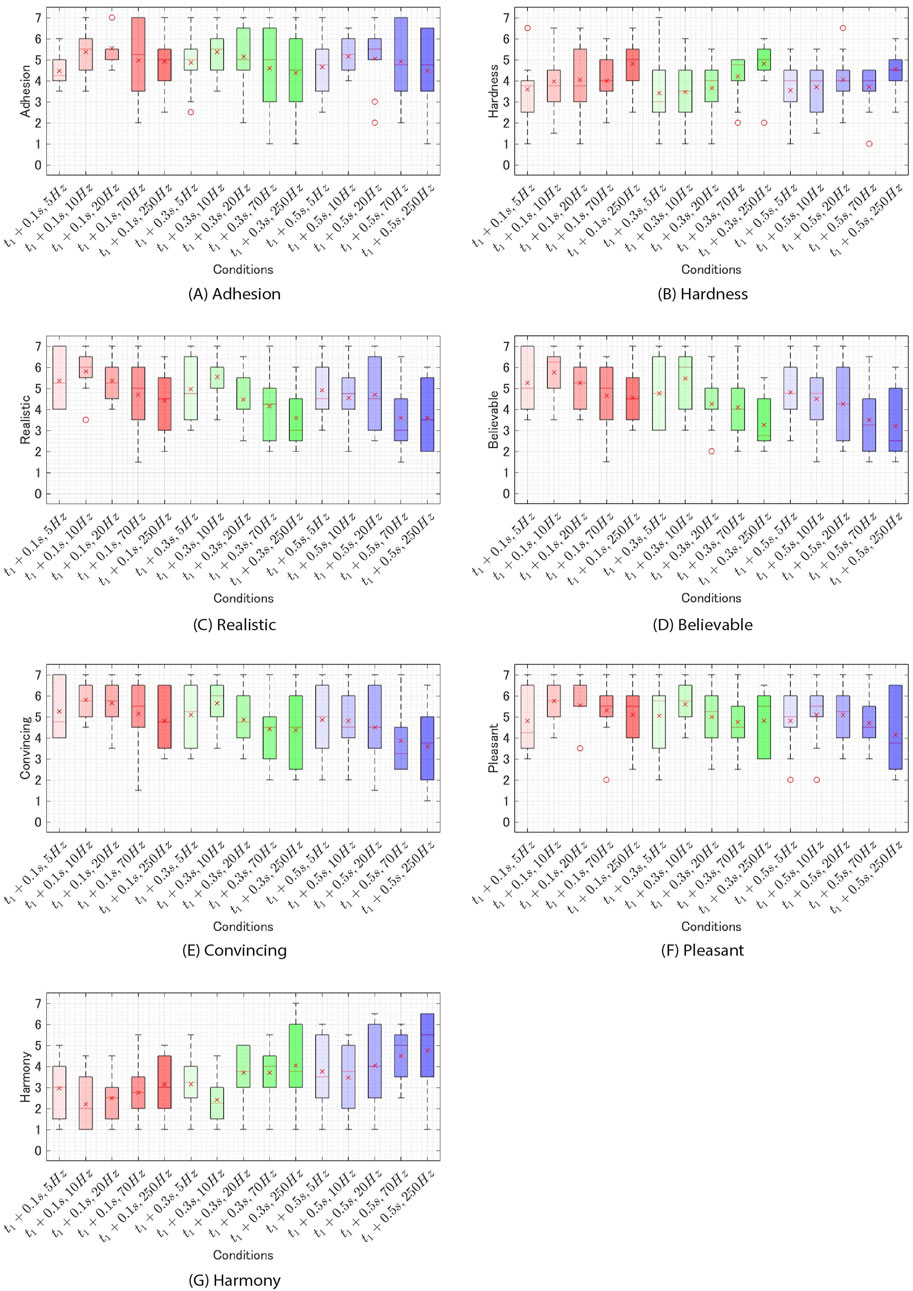
Figure 7. The results of experiment 2 for each condition. (A) adhesion. (B) hardness. (C) realistic. (D) believable. (E) convincing. (F). pleasant. (G). harmony.
Next, for the questions where a main effect of timing was observed (Q3-Q7) and for those where a main effect of frequency was observed (Q2-Q7), a Wilcoxon signed-rank test with Bonferroni correction was conducted. The results revealed significant differences between the conditions as shown in Table 1 (Figures 8, 9).
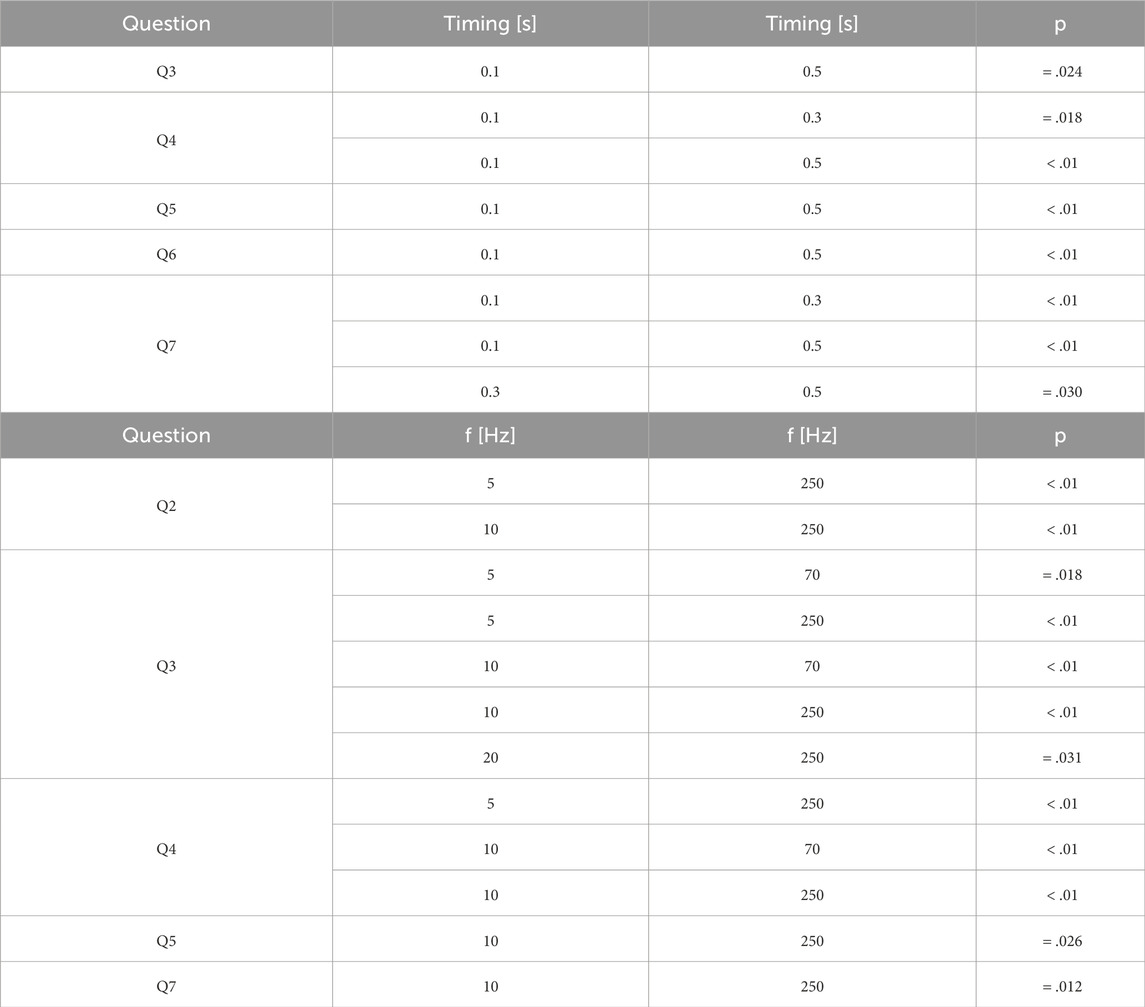
Table 1. Combinations of haptic stimuli with significant differences indicated by multiple comparisons.
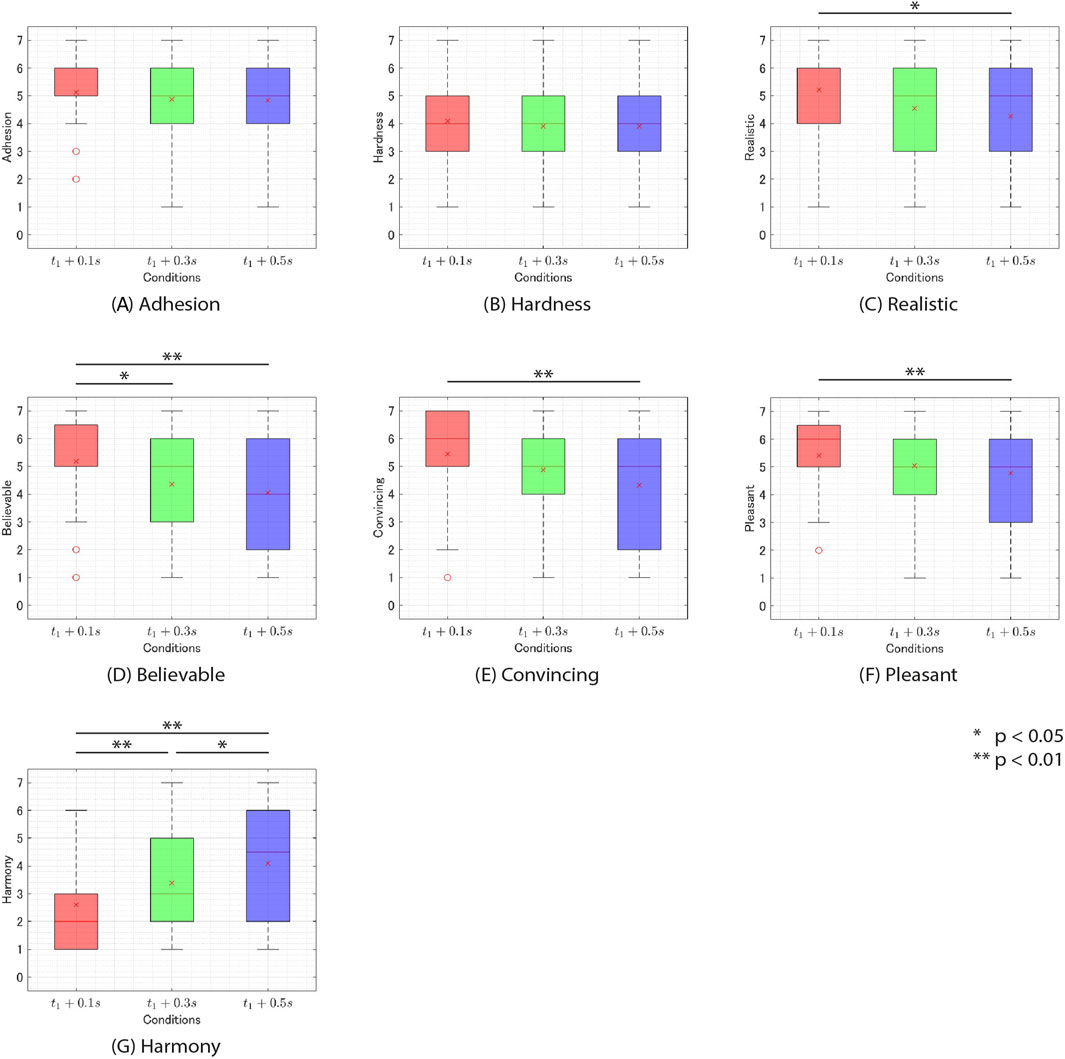
Figure 8. The rating of questionnaire on experiment 2 v. s. feedback timing of additional tactile feedback. (A) adhesion. (B) hardness. (C) realistic. (D) believable. (E) convincing. (F). pleasant. (G). harmony.
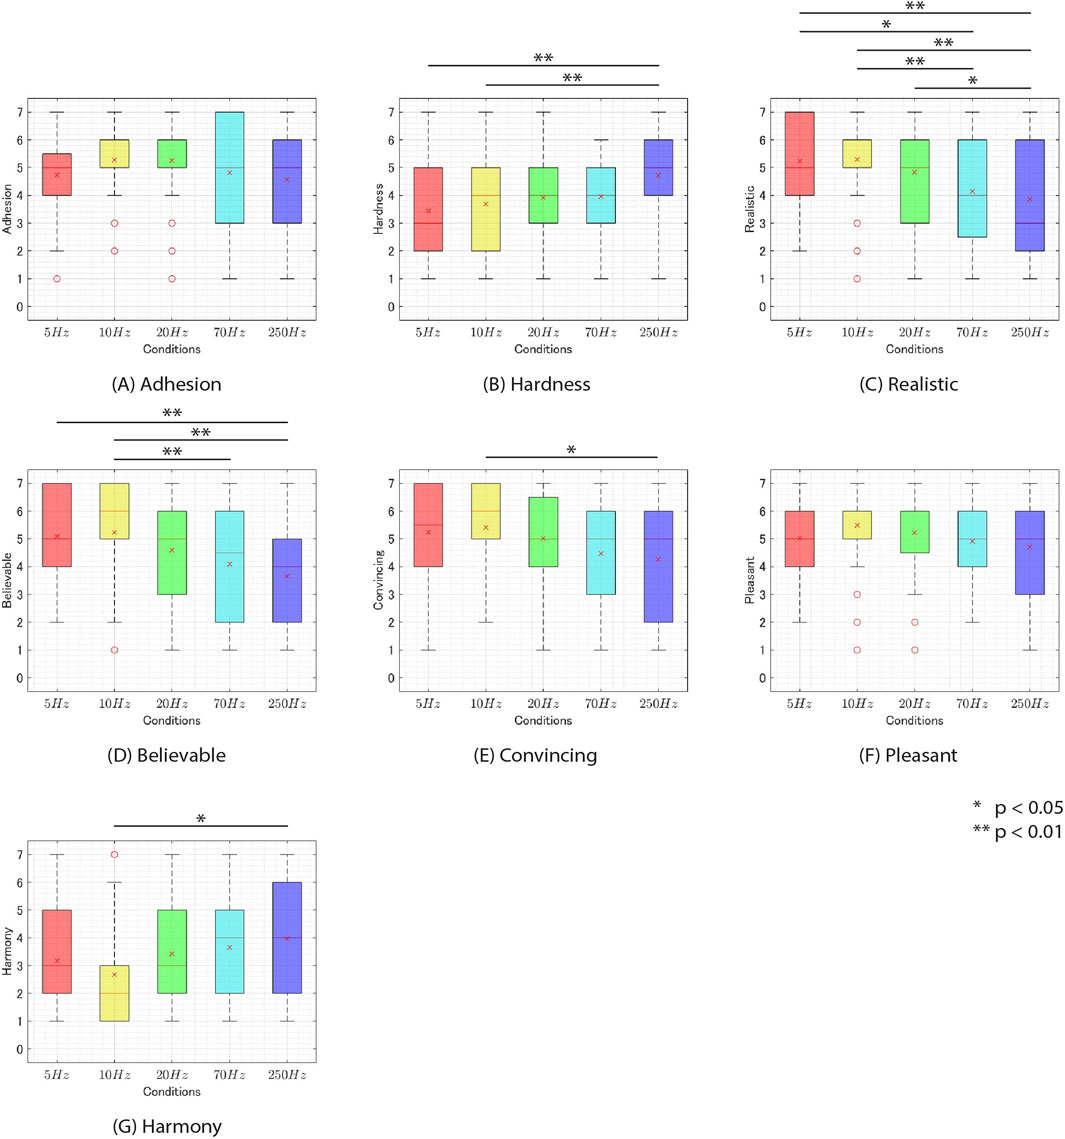
Figure 9. The rating of questionnaire on experiment 2 v. s. frequency of additional tactile feedback. (A) adhesion. (B) hardness. (C) realistic. (D) believable. (E) convincing. (F). pleasant. (G). harmony.
5.6 Discussion
5.6.1 Stickiness
First, the t1+0.1s and f = 20 Hz condition produced the highest score of 5.6. This score falls between “somewhat agree” (5) and “agree” (6), suggesting that subjects may have perceived stickiness on the t1+0.1s and f = 20 Hz condition. Next, A two-way ANOVA with ART correction showed no main effects of frequency and timing or interaction. This result suggests that there were no significant differences between the aforementioned t1+0.1s and f = 20 Hz condition and other stimuli. Therefore, it is possible that stickiness was perceived in all conditions used in this experiment similarly to the t1+0.1s and f = 20 Hz condition. However, the t1+0.3s and f = 70 Hz condition, which had the lowest score, produced a score of 4.4. This score is higher than “strongly disagree” (1) and “neutral” (4) but closer to “neutral” (4) than to “strongly agree” (7), indicating that the stickiness was not clearly perceived. Therefore, it would be appropriate to conduct additional research to determine whether participants could perceive stickiness even under low-scoring conditions such as the t1+0.3s and f = 70 Hz condition.
Moreover, in the
5.6.2 Hardness
Significant differences were observed between the 250 Hz frequency and 5 Hz and between 250Hz and 10 Hz regarding the sensation of hardness in Q2 (Figure 9B). This suggests that lower frequencies of additional tactile feedback made the physical object feel softer, while higher frequencies made the physical object feel harder.
The result is not surprising since, when considering two objects with the same adhesive strength but differing hardness adhering to a finger, it is expected that when the finger detaches from the objects at a constant speed, the softer object will detach more slowly than the harder one. However, it is essential to consider these results alongside the finding that differences in frequency do not affect the perceived stickiness (Q1). This is important because these results suggest the potential to independently control the perceived hardness without altering the perceived stickiness by adjusting the frequency of additional tactile feedback. This outcome implies the existence of optimal parameters for additional tactile feedback for augmentation stickiness based on the hardness of the object. For example, using higher-frequency vibrations around 250 Hz may be ideal for modulating the adhesive sensation of harder objects, while lower frequencies around 10 Hz might work better for softer objects. Investigating methods to design appropriate tactile feedback for augmentation stickiness based on the desired tactile sensation is crucial for realizing applications using this method.
5.6.3 Realism
Q3, Q4, and Q5 were all questions regarding realism. These questions showed significant main effects of both timing and frequency. As depicted in Figures 8C–E, presenting additional tactile feedback at lower
Next, the condition with low-frequency band vibration exhibited significantly higher realism compared to conditions with high-frequency band vibration (Figures 9C–E). This observation could be attributed to the fact that low-frequency vibrations, which evoke the sensation of softness (Section 5.6.2), aligned with users’ expectations that an object taking a certain time to detach from the finger is soft and prone to deformation. Conversely, the absence of a significant difference for the condition with
5.6.4 Pleasant
For pleasantness (Q6), the main effect was observed for timing. The
5.6.5 Harmony
For Harmony (Q7), significant main effects were observed for both frequency and timing. Regarding timing, notable differences were observed across all conditions (Figure 8G). The
In Figure 9G, the
6 Conclusion
In this study, we introduced a novel approach for HAR that augments the perceived stickiness of a physical object during adhesion-separation contact mode by presenting additional tactile feedback after a particular time after the finger lifts off from the physical object. To validate this approach, we developed a DEA-based thin-film, soft wearable tactile display tailored for HAR applications. Through two user experiments, we assessed the effectiveness of our method. In Experiment 1, we investigated the modulation of perceived stickiness by varying the presentation timing of additional tactile feedback. Our findings indicate that presenting additional tactile feedback after a particular time after the finger lifts off augments perceived stickiness. In Experiment 2, we further explored the stickiness experience by testing various frequencies and presenting timings of additional tactile feedback. While stickiness was perceived across all feedback conditions, the realism and harmony of the experience were influenced by the frequency and presentation timing of the additional tactile feedback.
Although this approach was initially designed for HAR, it could be adapted to VR and AR, it may hold promise for a diverse array of applications. We believe that our method will enrich haptic experiences in these domains, contributing to the advancement of haptic technology and the development of innovative applications.
Data availability statement
The raw data supporting the conclusions of this article will be made available by the authors, without undue reservation.
Ethics statement
The studies involving humans were approved by The Ethics Council of Toyoda gosei Co., Ltd. The studies were conducted in accordance with the local legislation and institutional requirements. The participants provided their written informed consent to participate in this study.
Author contributions
TK: Conceptualization, Data curation, Investigation, Methodology, Project administration, Software, Validation, Visualization, Writing–original draft, Writing– review and editing. KM: Conceptualization, Supervision, Writing–review and editing, YI: Resources, Validation, Writing–review and editing, TF: Funding acquisition, Resources, Supervision, Writing–review and editing.
Funding
The author(s) declare that financial support was received for the research, authorship, and/or publication of this article. This work was partially supported by a project, JPNP21004, commissioned by the New Energy and Industrial Technology Development Organization (NEDO).
Acknowledgments
This paper was supported from many people. In particular, we would like to thank Taku Tanichi for help implementation haptic augmented reality application; Kiyoshi Namba for help implementation user test system; Reiko Yamamura and Shiomi Yagi for helpful discussion for this research.
Conflict of interest
Authors YI, TF and TK are employed by Toyoda Gosei Co., Ltd.
The remaining authors declare that the research was conducted in the absence of any commercial or financial relationships that could be construed as a potential conflict of interest.
The author(s) declared that they were an editorial board member of Frontiers, at the time of submission. This had no impact on the peer review process and the final decision.
Publisher’s note
All claims expressed in this article are solely those of the authors and do not necessarily represent those of their affiliated organizations, or those of the publisher, the editors and the reviewers. Any product that may be evaluated in this article, or claim that may be made by its manufacturer, is not guaranteed or endorsed by the publisher.
References
Abbott, J. J., Marayong, P., and Okamura, A. M. (2007). “Haptic virtual fixtures for robot-assisted manipulation,” in Robotics research (Berlin, Heidelberg: Springer).
Abbott, J. J., and Okamura, A. M. (2003). “Virtual fixture architectures for telemanipulation,” in 2003 IEEE International Conference on Robotics and Automation, Taipei, Taiwan, 14–19 Septembe2, 2003.
Ando, H., Miki, T., Inami, M., and Maeda, T. (2002). “The nail-mounted tactile display for the behavior modeling,” in ACM SIGGRAPH 2002 conference abstracts and applications, Taipei, Taiwan, 14–19 Septembe2, 2003.
Arakawa, N., Watanabe, T., Fukushima, K., and Nakatani, M. (2021). Sensory words may facilitate certain haptic exploratory procedures in facial cosmetics. Int. J. Cosmet. Sci. 43, 78–87. doi:10.1111/ics.12671
Asano, S., Okamoto, S., and Yamada, Y. (2014). Vibrotactile stimulation to increase and decrease texture roughness. IEEE Trans. Human-Machine Syst. 45, 393–398. doi:10.1109/thms.2014.2376519
Bau, O., and Poupyrev, I. (2012). Revel: tactile feedback technology for augmented reality. ACM Trans. Graph. (TOG) 31, 1–11. doi:10.1145/2185520.2335440
Bau, O., Poupyrev, I., Israr, A., and Harrison, C. (2010). “Teslatouch: electrovibration for touch surfaces,” in Proceedings of the 23nd annual ACM symposium on User interface software and technology, New York, NY, 03 October, 2010.
Biggs, J., and Srinivasan, M. A. (2002). “Tangential versus normal displacements of skin: relative effectiveness for producing tactile sensations,” in Proceedings 10th Symposium on Haptic Interfaces for Virtual Environment and Teleoperator Systems, Orlando, FL, 14 August, 2016.
Bolanowski, S. J., Gescheider, G. A., Verrillo, R. T., and Checkosky, C. M. (1988). Four channels mediate the mechanical aspects of touch. J. Acoust. Soc. Am. 84, 1680–1694. doi:10.1121/1.397184
Borst, C. W., and Volz, R. A. (2005). Evaluation of a haptic mixed reality system for interactions with a virtual control panel. Presence Teleoperators & Virtual Environ. 14, 677–696. doi:10.1162/105474605775196562
Carpi, F., Frediani, G., and De Rossi, D. (2009). Hydrostatically coupled dielectric elastomer actuators. IEEE/ASME Trans. Mechatronics 15, 308–315. doi:10.1109/tmech.2009.2021651
Condino, S., Viglialoro, R. M., Fani, S., Bianchi, M., Morelli, L., Ferrari, M., et al. (2016). “Tactile augmented reality for arteries palpation in open surgery training,” in International Conference on Medical Imaging and Augmented Reality, Cham, 24–25 March, 2002, 186–197. doi:10.1007/978-3-319-43775-0_17
Costes, A., Argelaguet, F., Danieau, F., Guillotel, P., and Lécuyer, A. (2019). Touchy: a visual approach for simulating haptic effects on touchscreens. Front. ICT 6 (1). doi:10.3389/fict.2019.00001
Fani, S., Ciotti, S., Battaglia, E., Moscatelli, A., and Bianchi, M. (2017). W-fyd: a wearable fabric-based display for haptic multi-cue delivery and tactile augmented reality. IEEE Trans. haptics 11, 304–316. doi:10.1109/toh.2017.2708717
Gerling, G. J., and Thomas, G. W. (2005). Augmented, pulsating tactile feedback facilitates simulator training of clinical breast examinations. Hum. factors 47, 670–681. doi:10.1518/001872005774860050
Gu, G.-Y., Zhu, J., Zhu, L.-M., and Zhu, X. (2017). A survey on dielectric elastomer actuators for soft robots. Bioinspiration & biomimetics 12, 011003. doi:10.1088/1748-3190/12/1/011003
Hashimoto, Y., Nakata, S., and Kajimoto, H. (2009). “Novel tactile display for emotional tactile experience,” in Proceedings of the International Conference on Advances in Computer Entertainment Technology, Chofu, Japan, 20–22 August, 2008.
Hayashi, T., Okui, M., Yonehara, Y., and Nakamura, T. (2019). “Measurement of strain distribution of dielectric elastomer actuator with plural pairs of electrodes via the image correlation method,” in Electroactive Polymer Actuators and Devices (EAPAD) XXI (SPIE), Denver, CO, 13 March, 2019.
Ishihara, Y., Itoh, Y., Shirai, R., Fujita, K., Takashima, K., and Onoye, T. (2020). “Stickytouch: a tactile display with changeable adhesive distribution,” in 2020 IEEE Haptics Symposium (HAPTICS) (IEEE), Crystal City, VA, 28–01 March, 2020.
Jeon, S., Choi, S., and Harders, M. (2011). Rendering virtual tumors in real tissue mock-ups using haptic augmented reality. IEEE Trans. Haptics 5, 77–84. doi:10.1109/toh.2011.40
Jeon, S., Choi, S., and Harders, M. (2015). Haptic augmented reality: taxonomy, research status, and challenges. Boca Raton: CRC Press, 227–256. doi:10.1201/b18703-15
Jeon, S., and Harders, M. (2014). Haptic tumor augmentation: exploring multi-point interaction. IEEE Trans. Haptics 7, 477–485. doi:10.1109/toh.2014.2330300
Ji, X., Liu, X., Cacucciolo, V., Civet, Y., El Haitami, A., Cantin, S., et al. (2021). Untethered feel-through haptics using 18-μ m thick dielectric elastomer actuators. Adv. Funct. Mater. 31, 2006639. doi:10.1002/adfm.202006639
Jiang, R., and Wang, Y. (2020). Study of the human stickiness perception of wet fabric on the volar forearm via two contact modes: friction and adhesion-separation. Perception 49, 1311–1332. doi:10.1177/0301006620976992
Jungmann, M., and Schlaak, H. F. (2002). Miniaturised electrostatic tactile display with high structural compliance. Proc. Eurohaptics, 12–17.
Kajimoto, H., Kawakami, N., Tachi, S., and Inami, M. (2004). Smarttouch: electric skin to touch the untouchable. IEEE Comput. Graph. Appl. 24, 36–43. doi:10.1109/mcg.2004.1255807
Kim, J., Yeon, J., Ryu, J., Park, J.-Y., Chung, S.-C., and Kim, S.-P. (2017). Neural activity patterns in the human brain reflect tactile stickiness perception. Front. Hum. Neurosci. 11, 445. doi:10.3389/fnhum.2017.00445
Koo, I. M., Jung, K., Koo, J. C., Nam, J.-D., Lee, Y. K., and Choi, H. R. (2008). Development of soft-actuator-based wearable tactile display. IEEE Trans. Robotics 24, 549–558. doi:10.1109/tro.2008.921561
Kurogi, T., Yonehara, Y., Peiris, R. L., Fujiwara, T., and Minamizawa, K. (2019). “Haptic plaster: soft, thin, light and flexible haptic display using dea composed of slide-ring material for daily life,” in ACM SIGGRAPH 2019 Emerging Technologies, New York, NY, 28 July, 2019.
Lécuyer, A. (2009). Simulating haptic feedback using vision: a survey of research and applications of pseudo-haptic feedback. Presence Teleoperators Virtual Environ. 18, 39–53. doi:10.1162/pres.18.1.39
Lee, H., Lee, E., Jung, J., and Kim, J. (2019). Surface stickiness perception by auditory, tactile, and visual cues. Front. Psychol. 10, 2135. doi:10.3389/fpsyg.2019.02135
Li, M., Ishii, M., and Taylor, R. H. (2007). Spatial motion constraints using virtual fixtures generated by anatomy. IEEE Trans. Robotics 23, 4–19. doi:10.1109/tro.2006.886838
Lopes, P., You, S., Ion, A., and Baudisch, P. (2018). “Adding force feedback to mixed reality experiences and games using electrical muscle stimulation,” in Proceedings of the 2018 chi conference on human factors in computing systems, New York, NY, 21 April, 2018.
Maisto, M., Pacchierotti, C., Chinello, F., Salvietti, G., De Luca, A., and Prattichizzo, D. (2017). Evaluation of wearable haptic systems for the fingers in augmented reality applications. IEEE Trans. haptics 10, 511–522. doi:10.1109/toh.2017.2691328
Matsui, K., Okamoto, S., and Yamada, Y. (2013). Relative contribution ratios of skin and proprioceptive sensations in perception of force applied to fingertip. IEEE Trans. haptics 7, 78–85. doi:10.1109/toh.2013.71
Mith, S., Carpentier, L., and Monteil, G. (2008). Correlation between the sensorial perception and the descriptive instrumental analysis of the tackiness of silicone elastomers. Surf. Interface Analysis 40, 142–145. doi:10.1002/sia.2795
Mun, S., Yun, S., Nam, S., Park, S. K., Park, S., Park, B. J., et al. (2018). Electro-active polymer based soft tactile interface for wearable devices. IEEE Trans. haptics 11, 15–21. doi:10.1109/toh.2018.2805901
Nam, S., Vardar, Y., Gueorguiev, D., and Kuchenbecker, K. J. (2020). Physical variables underlying tactile stickiness during fingerpad detachment. Front. Neurosci. 14, 235. doi:10.3389/fnins.2020.00235
Nittala, A. S., Kruttwig, K., Lee, J., Bennewitz, R., Arzt, E., and Steimle, J. (2019). “Like a second skin: understanding how epidermal devices affect human tactile perception,” in Proceedings of the 2019 CHI Conference on Human Factors in Computing Systems, New York, NY, 02 May, 2019.
Nojima, T., Sekiguchi, D., Inami, M., and Tachi, S. (2002). “The smarttool: a system for augmented reality of haptics,” in Proceedings IEEE Virtual Reality 2002, Orlando, FL, 24–28 March, 2002.
Pelrine, R., Kornbluh, R., Joseph, J., and Chiba, S. (1997). “Electrostriction of polymer films for microactuators,” in Proceedings IEEE the tenth annual international workshop on micro electro mechanical systems. An investigation of micro structures, sensors, actuators, machines and robots (IEEE), Nagoya, Japan, 26-30 January, 1997.
Salazar, S. V., Pacchierotti, C., de Tinguy, X., Maciel, A., and Marchal, M. (2020). Altering the stiffness, friction, and shape perception of tangible objects in virtual reality using wearable haptics. IEEE Trans. haptics 13, 167–174. doi:10.1109/toh.2020.2967389
Sathiyamurthy, S., Lui, M., Kim, E., and Schneider, O. (2021). “Measuring haptic experience: elaborating the hx model with scale development,” in 2021 IEEE World Haptics Conference (WHC) (IEEE), Montreal, QC, 06–09 July, 2021.
Schwartz, R. A., Janusz, C. A., and Janniger, C. K. (2006). Seborrheic dermatitis: an overview. Am. Fam. physician 74, 125–130.
Swinn, L., Schrag, A., Viswanathan, R., Bloem, B. R., Lees, A., and Quinn, N. (2003). Sweating dysfunction in Parkinson’s disease. Mov. Disord. official J. Mov. Disord. Soc. 18, 1459–1463. doi:10.1002/mds.10586
Tao, Y., Teng, S.-Y., and Lopes, P. (2021). “Altering perceived softness of real rigid objects by restricting fingerpad deformation,” in The 34th Annual ACM Symposium on User Interface Software and Technology, New York, NY, 12 October, 2021.
Winfield, L., Glassmire, J., Colgate, J. E., and Peshkin, M. (2007). “T-pad: tactile pattern display through variable friction reduction,” in Second Joint EuroHaptics Conference and Symposium on Haptic Interfaces for Virtual Environment and Teleoperator Systems (WHC’07), Tsukuba, Japan, 22–24 March, 2007.
Withana, A., Groeger, D., and Steimle, J. (2018). “Tacttoo: a thin and feel-through tattoo for on-skin tactile output,” in Proceedings of the 31st Annual ACM Symposium on User Interface Software and Technology, New York, NY, 11 October ,2018.
Wobbrock, J. O., Findlater, L., Gergle, D., and Higgins, J. J. (2011). “The aligned rank transform for nonparametric factorial analyses using only anova procedures,” in Proceedings of the SIGCHI conference on human factors in computing systems, New York, NY, 07 May, 2011.
Yamaoka, M., Yamamoto, A., and Higuchi, T. (2008). “Basic analysis of stickiness sensation for tactile displays,” in Haptics: Perception, Devices and Scenarios: 6th International Conference, EuroHaptics 2008, Madrid, Spain, 10-13 June, 2008, 427–436. doi:10.1007/978-3-540-69057-3_56
Yao, H.-Y., Hayward, V., and Ellis, R. E. (2004). “A tactile magnification instrument for minimally invasive surgery,” in International Conference on Medical Image Computing and Computer-Assisted Intervention, Berlin, Heidelberg, 06 October, 2004, 89–96. doi:10.1007/978-3-540-30136-3_12
Yem, V., Vu, K., Kon, Y., and Kajimoto, H. (2018). “Effect of electrical stimulation haptic feedback on perceptions of softness-hardness and stickiness while touching a virtual object,” in 2018 IEEE Conference on Virtual Reality and 3D User Interfaces (VR), Reutlingen, Germany, 18–22 March, 2018.
Yeon, J., Kim, J., Ryu, J., Park, J.-Y., Chung, S.-C., and Kim, S.-P. (2017). Human brain activity related to the tactile perception of stickiness. Front. Hum. Neurosci. 11 (8), 8. doi:10.3389/fnhum.2017.00008
Yoshimoto, S., Kuroda, Y., Imura, M., and Oshiro, O. (2015). Material roughness modulation via electrotactile augmentation. IEEE Trans. Haptics 8, 199–208. doi:10.1109/toh.2015.2412942
Yun, S., Park, S., Park, B., Ryu, S., Jeong, S. M., and Kyung, K.-U. (2019). A soft and transparent visuo-haptic interface pursuing wearable devices. IEEE Trans. Industrial Electron. 67, 717–724. doi:10.1109/tie.2019.2898620
Keywords: haptic augmented reality, stickiness, adhesion-separation contact mode, dielectric elastomer actuator, tactile feedback
Citation: Kurogi T, Inoue Y, Fujiwara T and Minamizawa K (2024) Augmenting perceived stickiness of physical objects through tactile feedback after finger lift-off. Front. Robot. AI 11:1415464. doi: 10.3389/frobt.2024.1415464
Received: 10 April 2024; Accepted: 26 August 2024;
Published: 18 September 2024.
Edited by:
Matteo Cianchetti, Sant’Anna School of Advanced Studies, ItalyCopyright © 2024 Kurogi, Inoue, Fujiwara and Minamizawa. This is an open-access article distributed under the terms of the Creative Commons Attribution License (CC BY). The use, distribution or reproduction in other forums is permitted, provided the original author(s) and the copyright owner(s) are credited and that the original publication in this journal is cited, in accordance with accepted academic practice. No use, distribution or reproduction is permitted which does not comply with these terms.
*Correspondence: Tadatoshi Kurogi, dGFkYXRvc2hpLmt1cm9naUBnbWFpbC5jb20=