 Xiaochun Jiang
 Tongqing Lu
- State Key Lab for Strength and Vibration of Mechanical Structures, Soft Machines Lab, Department of Engineering Mechanics, Xi’an Jiaotong University, Xi’an, China
Composite materials have been long developed to improve the mechanical properties such as strength and toughness. Most composites are non-stretchable which hinders the applications in soft robotics. Recent papers have reported a new design of unidirectional soft composite with superior stretchability and toughness. This paper presents an analytical model to study the toughening mechanism of such composite. We use the Gent model to characterize the large deformation of the hard phase and soft phase of the composite. We analyze how the stress transfer between phases deconcentrates the stress at the crack tip and enhances the toughness. We identify two types of failure modes: rupture of hard phase and interfacial debonding. We calculate the average toughness of the composite with different physical and geometric parameters. The experimental results in literature agree with our theoretical predictions very well.
Introduction
Recently, the emergence of novel soft materials such as elastomers and gels, enable enormous applications including soft robots (Wallin et al., 2018; Whitesides, 2018), ionotronics (Lin et al., 2016; Wirthl et al., 2017; Yang and Suo, 2018; Yuk et al., 2019), stretchable electronics (Minev et al., 2015; Park et al., 2018), and wound dressings (Blacklow et al., 2019). These applications impose a big challenge for soft materials to improve their mechanical properties. Many natural materials such as shell, bone, wood, and muscle exhibit excellent mechanical properties in strength, toughness, and fatigue (Currey, 1977; Kamat et al., 2000; Fratzl and Weinkamer, 2007; Ji and Gao, 2010). These materials are all composite materials, made up of phases with different materials. The mechanical properties of the composite increase by orders of magnitude compared to each single phase (Kamat et al., 2000; Ji and Gao, 2010). Developing bioinspired stretchable soft composites is a promising solution to improve mechanical properties of soft materials.
Soft composites such as fiber-reinforced elastomers (Goettler and Shen, 1983) have been studied for many decades. Several recent papers reported fabric reinforced rubber or hydrogel composite with high strength and high toughness for potential use of soft robotics (Huang et al., 2017; Wang et al., 2018; Zhang et al., 2020). For all these soft composites, the fibers are stiff and non-stretchable, which sacrifices the stretchability of the composite. Until recently, Wang et al. and Xiang et al. discover that the stretchable hard phase can also reinforce the soft phase if the modulus ratio and interface bonding meet certain requirements (Wang et al., 2019; Xiang et al., 2020). They design a stretchable composite by periodically arranging hard phase and soft phase with strong adhesion in between. When the composite is stretched, the soft phase near the crack tip greatly shears, the hard phase is greatly stretched and stores most of the elastic energy. When the hard phase ruptures, the stored elastic energy is released. In this design, the composite can be stretched twice of the original length and the toughness of the composite can reach 103–104 J/m2. The composite also has a high fatigue threshold, low hysteresis, and low crack sensitivity. However, these works only report the experimental results and a reliable theoretical model to quantitatively analyze the stretchable composite is still lacking.
The existing theoretical models for unidirectional composites mainly focus on non-stretchable stiff fibers and adopt the theory of linear elasticity (Hedgepeth, 1961; Hedgepeth and Dyke, 1967; Hikami and Chou, 1990; Nedele and Wisnom, 1994; Beyerlein and Phoenix, 1996; Phoenix and Beyerlein, 2000; Swolfs et al., 2015; Hui et al., 2019). For example, Hedgepeth used the shear-lag model to analyze the load transfer process of the composite (Hedgepeth, 1961) and obtained the stress concentration factor of the first intact fiber near the crack tip. Hikami et al. calculated the stress concentration of multiple intact fibers near the crack tip (Hikami and Chou, 1990). Hui et al. treated the composite as an orthotropic plate and obtained an approximate solution of stress concentration at different crack lengths (Hui et al., 2019). To the authors’ best knowledge, no work has analyzed the deformation and stress concentration of highly stretchable soft composite.
In this work, we establish a theoretical model to analyze the stretchable composite with periodically arranged hard phase and soft phase. We use the Gent model to characterize the large deformation of hard phase and soft phase. We calculate the stress concentration of the composite and identify two types of failure modes: rupture of hard phase and interfacial debonding. We calculate the average toughness of the composite and compare the theoretical predictions with the experimental results in literature.
Governing Equations
Consider a stretchable composite consisting of periodically arranged hard phase and soft phase (Figure 1). The top and bottom ends of the composite are clamped. A horizontal crack pre-exists in the middle. The crack tip is at the interface of the hard phase and soft phase. In the undeformed state, the width of hard phase and soft phase are
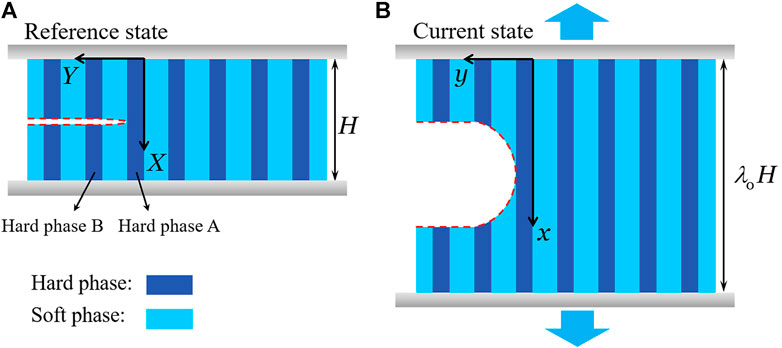
FIGURE 1. A stretchable composite consists of periodically arranged hard phase and soft phase, with the top and bottom ends clamped. (A) In the reference state, no force applies on the composite. A horizontal crack pre-exists in the middle. The coordinate is (X,Y). (B) In the current state, the composite is subject to a uniaxial displacement and the crack opens. The coordinate is (x,y).
When the composite deforms, the geometric relations are
Hard phase A is subject to a uniaxial tension and the shear stress from the soft phase. Hard phase B is subject to shear stress from the soft phase only. We apply the shear-lag model (Kaelble, 1960; Kaelble, 1992) to obtain the force balance of the two hard phases as
We use the Gent model to represent the stress-strain relations of hard phase and soft phase (Gent, 1996). In the hard phase, the tensile stress relates to the tensile stretch as
and in the soft phase the shear stress relates to the shear strain as
The displacements of both hard phase and soft phase at the top and bottom ends are fixed, so we have
At the middle of the hard phase A the displacement is equal to the half of the applied total displacement and the middle of the hard phase B is stress free. We have
We solve the fields of displacement, stress, strain of the three layers combining Eqs 1–7 using MATLAB.
Stress and Strain Analysis
In plotting the results, we use the representative geometric parameters as follows (Wang et al., 2019). The height of the composite is
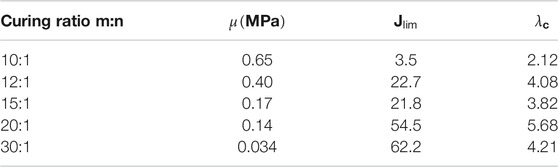
TABLE 1. Parameters of PDMS with different curing ratios.
Figure 2 plots the strain and stress distribution of the three layers close to the crack tip. The material of hard phase A is taken to be PDMS of weight ratio m:n=10:1 and the material of hard phase B is taken to be PDMS of weight ratio m:n=30:1. The total applied stretch to the composite is modest,
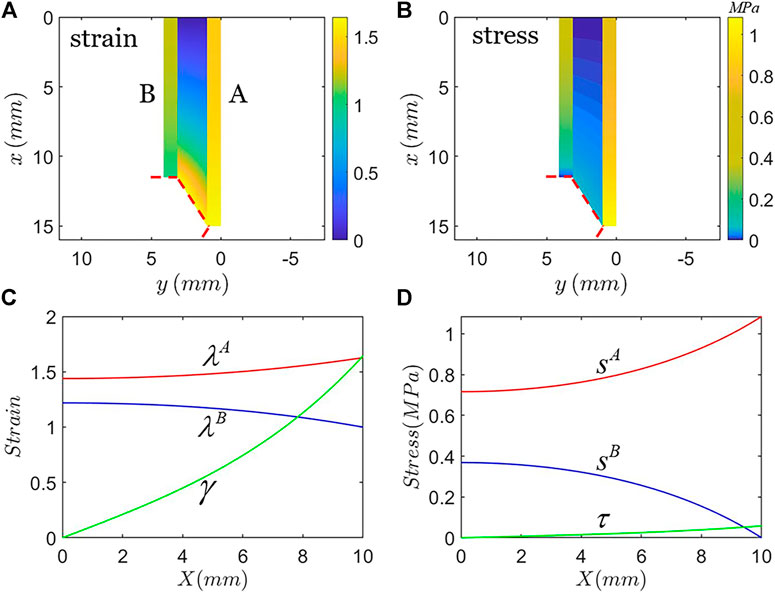
FIGURE 2. Strain field and stress field in the three layers close to the crack when the applied remote stretch is
Figure 3 shows one type of failure mode: rupture of hard phase. In plotting Figure 3, the material of hard phase is taken to be PDMS of weight ratio m:n=10:1 with modulus of 0.65 MPa, Jlim=3.5, and rupture stretch
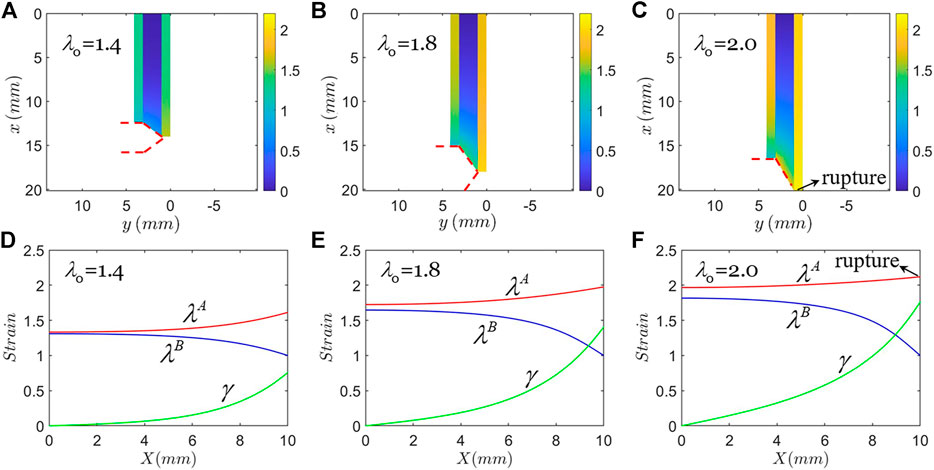
FIGURE 3. Type A Failure: rupture of hard phase. The applied remote stretch gradually increases until the hard phase breaks, while the interface remains intact. (A)–(C) Strain contours plotted in the coordinate of the current state, and (D)–(F) strain distribution plotted in the coordinate of the reference state.
We define the stress concentration factor K at rupture as the maximum stress in hard phase A divided by the applied stress in hard phases remote from the crack tip. With the parameters above, K is calculated to be 1.45 when the hard phase A is about to rupture. The periodic arrangement of soft phase and hard phase significantly reduces the stress concentration at the crack tip. Compared to the case of linear elasticity, the stress concentration factor is on the same order (Hui et al., 2019). For the stretchable composite analyzed herein, we find that K varies slowly as the height of the composite H changes or as the applied total stretch
Figure 4 shows another type of failure mode: interfacial debonding. In plotting Figure 4, the material of hard phase is the same as that in Figure 3, and the material of soft phase is taken to be the PDMS of weight ratio m:n=30:1 with modulus of 0.034 MPa, and Jlim=62.2. When the applied stretch is
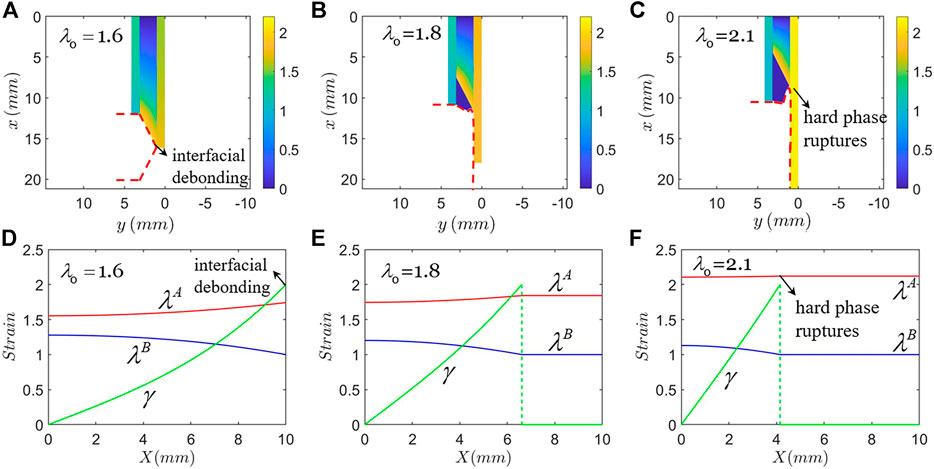
FIGURE 4. Type B Failure: interfacial debonding. The applied remote stretch gradually increases until the interface debonds and the crack kinks, while the hard phase remains unbroken. Further stretch eventually breaks the hard phase. (A)–(C) Strain contours plotted in the coordinate of the current state. (D)–(F) The corresponding strain distribution plotted in the coordinate of the reference state.
Toughness and Comparison With Experiment
Referring to Figure 1, for the pure shear configuration, that is, the cracked sample with the top and bottom ends clamped, the energy release rate of a pure material G is given by
where
Figure 5 shows that the calculated average toughness
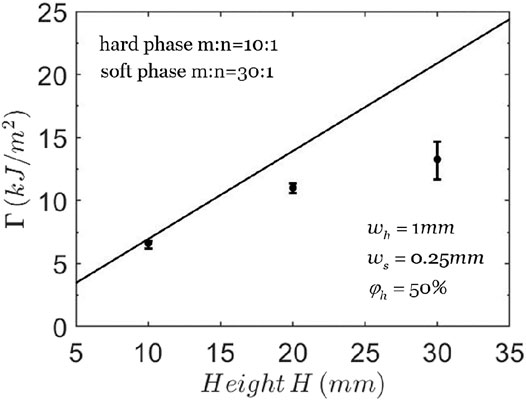
FIGURE 5. The toughness of composites with different heights. The solid line represents the theoretical prediction and the points with error bars represent the experimental data (Wang et al., 2019).
Figure 6 shows that the calculated average toughness
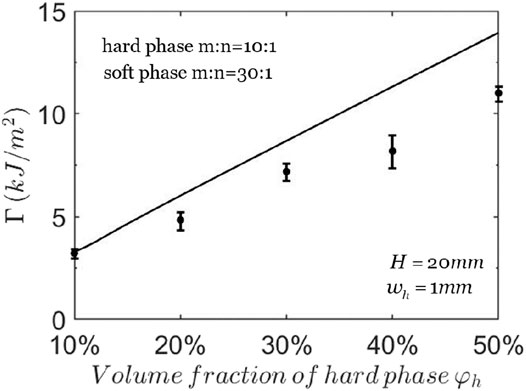
FIGURE 6. The toughness of composites with different volume fractions of hard phase. The solid line represents the theoretical predictions and the points with error bars represent the experimental data (Wang et al., 2019).
Figure 7 shows the effect of the modulus of soft phase. When the modulus of soft phase is 0.034 MPa (curing ratio m:n=30:1), the stress concentration at the crack tip is small, K=1.02. When the modulus of soft phase is 0.40 MPa (curing ratio m:n=12:1), the stress concentration at the crack tip becomes larger, K=1.61, which decreases the critical total stretch,
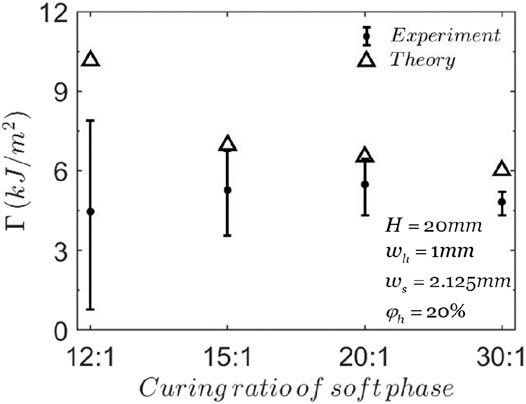
FIGURE 7. The fracture toughness of composites with different curing ratios of soft phase. The triangles represent the theoretical predictions and the points with error bars represent the experimental data (Wang et al., 2019).
According to our calculations, when the soft phase is softer, it is more likely to have Type B failure: interfacial debonding. The experiments show that when the curing ratios of the soft phase are 20:1 and 30:1, the interfacial debonding is observed first in the composite and finally the hard phase ruptures. When the curing ratios of the soft phase are 15:1 and 12:1, only rupture of hard phase is observed in the composite without interfacial debonding.
The theoretical analysis in this work has several idealizations. First, the interfacial bonding strength between hard phase and soft phase of different curing ratios should be different and affects the failure mode of the composite. The criterion of interfacial debonding may depend on the modulus of the two adherends, the method of adhesion, the thickness of the adhesion layer and the local stress concentration. To avoid these complications, throughout the paper we use a simple criterion to describe the interfacial debonding,
Conclusion
We establish a theoretical model to analyze the large deformation and failure of the stretchable composite with periodically arranged hard phase and soft phase. We find that the stress concentration at the crack tip is much reduced in such composite. We analyze two types of failure modes: rupture of hard phase and interfacial debonding. Both failure modes can greatly improve the fracture resistance by stress de-concentration. We calculate the average toughness of the composite with different physical and geometric parameters. We find that the toughness of the composite increases almost linearly with the height of the composite and the volume fraction of hard phase. If the interfacial bonding between the hard phase and the soft phase is too strong, the stress concentration is amplified. A relatively weak interface would be helpful to increase the fracture toughness. Increasing the modulus of the soft phase increases the elastic energy storage in the soft phase but also increases the stress concentration, these two coupling effects influence the toughness simultaneously. The experimental results in literature agree with our theoretical predictions very well. This paper illustrates the toughening mechanism of the unidirectional stretchable composite and may provide a tool to optimize similar stretchable composites in practical applications.
Data Availability Statement
The original contributions presented in the study are included in the article/Supplementary Material, further inquiries can be directed to the corresponding author.
Author Contributions
TL designed research; XJ performed research; XJ and DS completed the experiment; XJ, TL, ZW and TW wrote the paper.
Funding
TL acknowledges the support of NSFC (Nos. 11922210, 11772249). ZW acknowledges the support of NSFC (No. 12002255).
Conflict of Interest
The authors declare that the research was conducted in the absence of any commercial or financial relationships that could be construed as a potential conflict of interest.
Supplementary Material
The Supplementary Material for this article can be found online at: https://www.frontiersin.org/articles/10.3389/frobt.2021.673307/full#supplementary-material
References
Beyerlein, I. J., and Phoenix, S. L. (1996). Statistics for the Strength and Size Effects of Microcomposites with Four Carbon Fibers in Epoxy Resin. Composites Science and Technology. 56 (1), 75–92. doi:10.1016/0266-3538(95)00131-x
Blacklow, S. O., Li, J., Freedman, B. R., Zeidi, M., Chen, C., and Mooney, D. J. (2019). Bioinspired Mechanically Active Adhesive Dressings to Accelerate Wound Closure. Sci. Adv. 5 (7), eaaw3963. doi:10.1126/sciadv.aaw3963
Currey, J. D. (1977). Mechanical-Properties of Mother of Pearl in Tension. Proceedings of the Royal Society Series B-Biological Sciences. 196 (1125), 443–463. doi:10.1098/rspb.1977.0050
Fratzl, P., and Weinkamer, R. (2007). Nature's Hierarchical Materials. Progress in Materials Science. 52 (8), 1263–1334. doi:10.1016/j.pmatsci.2007.06.001
Gent, A. N. (1996). A New Constitutive Relation for Rubber. Rubber Chemistry and Technology. 69 (1), 59–61. doi:10.5254/1.3538357
Goettler, L. A., and Shen, K. S. (1983). Short Fiber Reinforced Elastomers. Rubber Chemistry and Technology. 56 (3), 619–638. doi:10.5254/1.3538144
Hedgepeth, J. M. (1961). Stress Concentrations In Filamentary Structures. NASA Technical Note. D-882
Hedgepeth, J. M., and Van Dyke, P. (1967). Local Stress Concentrations in Imperfect Filamentary Composite Materials. Journal of Composite Materials. 1, 294–309. doi:10.1177/002199836700100305
Hikami, F., and Chou, T.-W. (1990). Explicit Crack Problem Solutions of Unidirectional Composites - Elastic Stress Concentrations. Aiaa Journal 28 (3), 499–505. doi:10.2514/3.10420
Huang, Y., King, D. R., Sun, T. L., Nonoyama, T., Kurokawa, T., Nakajima, T., et al. (2017). Energy-Dissipative Matrices Enable Synergistic Toughening in Fiber Reinforced Soft Composites. Adv. Funct. Mater. 27 (9), 1605350. doi:10.1002/adfm.201605350
Hui, C.-Y., Liu, Z., and Phoenix, S. L. (2019). Size Effect on Elastic Stress Concentrations in Unidirectional Fiber Reinforced Soft Composites. Extreme Mechanics Letters. 33, 100573. doi:10.1016/j.eml.2019.100573
Ji, B., and Gao, H. (2010). Mechanical Principles of Biological Nanocomposites. Annu. Rev. Mater. Res. 40 (1), 77–100. doi:10.1146/annurev-matsci-070909-104424
Kaelble, D. H. (1992). Theory and Analysis of Peel Adhesion: Adhesive Thickness Effects. The Journal of Adhesion. 37 (1-3), 205–214. doi:10.1080/00218469208031262
Kaelble, D. H. (1960). Theory and Analysis of Peel Adhesion: Bond Stresses and Distributions. Transactions of the Society of Rheology. 4, 45–73. doi:10.1122/1.548868
Kamat, S., Su, X., Ballarini, R., and Heuer, A. H. (2000). Structural Basis for the Fracture Toughness of the Shell of the Conch Strombus Gigas. Nature. 405 (6790), 1036–1040. doi:10.1038/35016535
Lin, S., Yuk, H., Zhang, T., Parada, G. A., Koo, H., Yu, C., et al. (2016). Stretchable Hydrogel Electronics and Devices. Adv. Mater. 28 (22), 4497–4505. doi:10.1002/adma.201504152
Minev, I. R., Musienko, P., Hirsch, A., Barraud, Q., Wenger, N., Moraud, E. M., et al. (2015). Electronic Dura Mater for Long-Term Multimodal Neural Interfaces. Science. 347 (6218), 159–163. doi:10.1126/science.1260318
Nedele, M. R., and Wisnom, M. R. (1994). Three-dimensional Finite Element Analysis of the Stress Concentration at a Single Fibre Break. Composites Science and Technology. 51 (4), 517–524. doi:10.1016/0266-3538(94)90084-1
Park, S., Heo, S. W., Lee, W., Inoue, D., Jiang, Z., Yu, K., et al. (2018). Self-powered Ultra-flexible Electronics via Nano-Grating-Patterned Organic Photovoltaics. Nature. 561 (7724), 516–521521. doi:10.1038/s41586-018-0536-x
Phoenix, S. L., and Beyerlein, I. J. (2000). Statistical Strength Theory for Fibrous Composite Materials. Statistical strength theory for fibrous composite materials. 1 (1), 559–639. doi:10.1016/B0-08-042993-9/00056-5
Rivlin, R. S., and Thomas, A. G. (1953). Rupture of Rubber. I. Characteristic Energy for Tearing. J. Polym. Sci. 10 (3), 291–318. doi:10.1002/pol.1953.120100303
Swolfs, Y., McMeeking, R. M., Verpoest, I., and Gorbatikh, L. (2015). Matrix Cracks Around Fibre Breaks and Their Effect on Stress Redistribution and Failure Development in Unidirectional Composites. Composites Science and Technology. 108, 16–22. doi:10.1016/j.compscitech.2015.01.002
Wallin, T. J., Pikul, J., and Shepherd, R. F. (2018). 3D Printing of Soft Robotic Systems. Nat. Rev. Mater. 3 (6), 84–100. doi:10.1038/s41578-018-0002-2
Wang, Y., Gregory, C., and Minor, M. A. (2018). Improving Mechanical Properties of Molded Silicone Rubber for Soft Robotics Through Fabric Compositing. Soft Robotics. 5 (3), 272–290. doi:10.1089/soro.2017.0035
Wang, Z., Xiang, C., Yao, X., Le Floch, P., Mendez, J., and Suo, Z. (2019). Stretchable Materials of High Toughness and Low Hysteresis. Proc. Natl. Acad. Sci. USA. 116 (13), 5967–5972. doi:10.1073/pnas.1821420116
Whitesides, G. M. (2018). Soft Robotics. Angew. Chem. Int. Ed. 57 (16), 4258–4273. doi:10.1002/anie.201800907
Wirthl, D., Pichler, R., Drack, M., Kettlguber, G., Moser, R., Gerstmayr, R., et al. (2017). Instant Tough Bonding of Hydrogels for Soft Machines and Electronics. Sci. Adv. 3 (6), e1700053. doi:10.1126/sciadv.1700053
Xiang, C., Wang, Z., Yang, C., Yao, X., Wang, Y., and Suo, Z. (2020). Stretchable and Fatigue-Resistant Materials. Materials Today. 34, 7–16. doi:10.1016/j.mattod.2019.08.009
Yang, C., and Suo, Z. (2018). Hydrogel Ionotronics. Nat. Rev. Mater. 3 (6), 125–142. doi:10.1038/s41578-018-0018-7
Yuk, H., Lu, B., and Zhao, X. (2019). Hydrogel Bioelectronics. Chem. Soc. Rev. 48 (6), 1642–1667. doi:10.1039/c8cs00595h
Keywords: stretchable composite, large deformation, interfacial debonding, stress concentration, toughness
Citation: Jiang X, Wang Z, Sun D, Lu T and Wang T (2021) Toughening Mechanism of Unidirectional Stretchable Composite. Front. Robot. AI 8:673307. doi: 10.3389/frobt.2021.673307
Received: 27 February 2021; Accepted: 19 April 2021;
Published: 30 April 2021.
Edited by:
Ruobing Bai, Northeastern University, United StatesReviewed by:
Zheng Jia, Zhejiang University, ChinaCanhui Yang, Southern University of Science and Technology, China
Copyright © 2021 Jiang, Wang, Sun, Lu, Wang. This is an open-access article distributed under the terms of the Creative Commons Attribution License (CC BY). The use, distribution or reproduction in other forums is permitted, provided the original author(s) and the copyright owner(s) are credited and that the original publication in this journal is cited, in accordance with accepted academic practice. No use, distribution or reproduction is permitted which does not comply with these terms.
*Correspondence: Tongqing Lu, dG9uZ3FpbmdsdUBtYWlsLnhqdHUuZWR1LmNu