 Janis Krumins
 Maris Klavins
94% of researchers rate our articles as excellent or good
Learn more about the work of our research integrity team to safeguard the quality of each article we publish.
Find out more
ORIGINAL RESEARCH article
Front. Remote Sens. , 01 April 2025
Sec. Land Cover and Land Use Change
Volume 6 - 2025 | https://doi.org/10.3389/frsen.2025.1567002
Biosphere reserves serve as critical areas for balancing conservation with sustainable development. This study investigates land-use and land-cover changes in the North Vidzeme Biosphere Reserve (Latvia) from 1990 to 2018, employing scenario-based modeling to project future trends. Historical analyses reveal overall stability but highlight cyclical agricultural intensification and extensification, forest decline, and expansions in transitional woodland-shrub. Four scenarios—business-as-usual, sustainable development, climate adaptation and mitigation, and conservation-oriented—were evaluated for their ecological and socio-economic implications. Business-as-usual scenario continues historical trends of moderate urban growth and agricultural intensification, risking limited restoration gains. In contrast, sustainable development and climate adaptation and mitigation scenarios emphasize reforestation, biodiversity improvement, and climate resilience, aligning with the European Union 2030 Biodiversity Strategy. Conservation-oriented scenario prioritizes stabilization and minimizing anthropogenic pressures yet lacks proactive restoration measures. Statistical tests confirm that socio-economic factors, zoning, and landscape richness significantly drive land-use and land-cover changes, with most changes adhering to the North Vidzeme Biosphere Reserve regulations. However, certain non-compliant changes, such as forest-to-agriculture conversions, highlight the need for stronger enforcement. While ecological impacts such as land-use transitions, biodiversity shifts, and conservation compliance were considered, socio-economic implications were primarily discussed in relation to zoning and land-use trends rather than through a standalone analysis. These scenario-based insights offer valuable guidance for adaptive land management in protected areas.
Land-use and land-cover (LULC) changes are ongoing processes with far-reaching implications for ecosystem services, biodiversity, and climate change (Gomes et al., 2021). Key drivers such as deforestation, agricultural expansion, urbanization, and infrastructure development contribute to biodiversity loss and ecosystem degradation globally (Roy et al., 2022). Additionally, changes like forest-to-agriculture transitions release greenhouse gases, worsening climate change (Carter et al., 2015). Conversely, climate change affects land-use through changed precipitation patterns and rising temperatures, affecting crop viability, forest health, and water availability (Olesen and Bindi, 2002). These interdependencies create feedback loops, making LULC change both a driver and consequence of climate change.
Moreover, socio-economic dynamics—such as population growth, market demands, and policy decisions—further affect LULC consequences, showing the complexity of managing diverse priorities within a limited land base. In response to these challenges, international and regional policies have increasingly prioritized integrated land management strategies. Key initiatives, including the United Nations Sustainable Development Goals (Carlsen and Bruggemann, 2022), the Convention on Biological Diversity (Chandra and Idrisova, 2011), and the European Union’s 2024 Nature Restoration Law (European Union, 2024), aim to balance ecological protection with land-use demands.
Previous studies have documented significant LULC changes driven by socio-political and economic shifts. Fonji and Taff (2014) analyzed LULC changes in northeastern Latvia between 1992 and 2007, identifying agricultural abandonment as a dominant driver of landscape transformation, leading to substantial forest regrowth, which covered 17.1% of the total study area (Fonji and Taff, 2014). Their findings align with broader trends observed across post-Soviet countries, where land restitution and economic restructuring have shaped land-use decisions (Fonji and Taff, 2014). Similarly, Bell et al. (2009) examined landscape management changes in post-Soviet Latvia, highlighting the long-term impacts of collectivization and subsequent land abandonment (Bell et al., 2009). Their study found that between 1935 and 2000, agricultural land declined from 57.3% to 38.5%, while forest cover nearly doubled (Bell et al., 2009). Historical land-use changes in Latvia were heavily influenced by centralized Soviet-era policies, which replaced traditional agricultural landscapes with collective farming structures (Bell et al., 2009). Bell et al. (2009) further demonstrated how collectivization reshaped settlement patterns and land ownership, ultimately contributing to large-scale land abandonment after 1991 (Bell et al., 2009).
Natural protected areas play a crucial role in conserving biodiversity, yet they remain vulnerable to land-cover changes both within their boundaries and in surrounding areas. Guerra et al. (2019) analyzed 23 years of global land-cover change and found that, while protected areas experience lower change rates than unprotected areas, they are still subject to significant pressures, particularly from surrounding land-use activities (Guerra et al., 2019). Their findings emphasize that conservation efforts must extend beyond protected area boundaries to effectively mitigate spillover effects (Guerra et al., 2019).
Natural protected areas face substantial challenges in balancing conservation with sustainable development within dynamic environmental changes (Leverington et al., 2010; Naughton-Treves et al., 2005). While these areas are intended to conserve biodiversity (Geldmann et al., 2013), pressures such as agricultural expansion, illegal logging, and urban encroachment often compromise their ecological integrity (Jones et al., 2018). Fragmentation caused by infrastructure projects, resource extraction, and human settlements worsens habitat degradation, while edge effects change species composition and ecosystem functions (Fagan et al., 1999; McDonald and Urban, 2006). The presence of human activities in buffer zones further intensifies these issues, especially in the absence of strong enforcement and adequate resources (Smith et al., 2020).
Furthermore, land-use changes around natural protected areas pose significant challenges for biodiversity conservation and sustainable management. Staccione et al. (2023) examined the European protected area network and found that increasing connectivity improves conservation outcomes while minimizing disruptions to ecosystem services (Staccione et al., 2023). Their study used scenario-based modeling to explore how different levels of protection interact with climate and socio-economic factors, highlighting the importance of integrated land management strategies (Staccione et al., 2023). At the same time, DeFries et al. (2007) emphasized that as land use expands outside protected areas, ecological connectivity is often compromised, negatively affecting species survival and ecosystem resilience (DeFries et al., 2007). Their study suggests that regional land management strategies must balance conservation objectives with land-use needs (DeFries et al., 2007).
Essentially, LULC changes in and around protected areas remain a major challenge for biodiversity conservation. In this context, Jiang and Yu (2019) analyzed land-use intensity changes within and outside protected areas globally and found that, while protected areas generally reduce land-use pressures within their boundaries, surrounding landscapes experience increased human activities (Jiang and Yu, 2019). Fortunately, in Europe, the impact of land-use intensity has been relatively lower compared to other regions due to conservation measures such as the Natura 2000 network and others (Jiang and Yu, 2019).
Land-use and climate change are among the most significant threats to biodiversity, with their combined effects expected to reshape ecological communities in the coming decades. In this respect, Newbold (2018) predicts that climate change could soon surpass land-use change as the primary driver of biodiversity loss, with vertebrate communities projected to lose up to 37.9% of their species under a business-as-usual scenario (RCP 8.5) (Newbold, 2018). These findings underline the need for forward-looking scenario analyses to assess how different land-use policies and conservation measures may influence biodiversity outcomes in natural protected areas (Newbold, 2018).
Scenario-based LULC modeling provides an effective approach to address these challenges by advancing understanding into potential land management strategies under varying socio-economic, environmental, and policy conditions (Ren et al., 2019). Cellular Automata–Markov Chain (CA-Markov) models are widely used to quantify LULC changes, with machine learning techniques like multi-layer perceptron (MLP) improving their predictive accuracy (Devi and Shimrah, 2023). By integrating spatial, temporal, and non-linear dynamics, these models allow researchers to evaluate alternative futures, such as Business-as-Usual (BAU), Sustainable Development (SD), Climate Adaptation and Mitigation (CAM), and Conservation-Oriented (C-O) scenarios (Martín-Arias et al., 2022). For instance, Martínez-Vega et al. (2017) applied artificial neural networks to simulate land-use changes in two Spanish national parks and found that, while protected areas remained stable, surrounding landscapes experienced significant transformations due to urban expansion, tourism, and land abandonment (Martínez-Vega et al., 2017). Their study highlights the importance of assessing both internal and external pressures on protected landscapes and demonstrates the effectiveness of modeling in capturing complex land-use dynamics (Martínez-Vega et al., 2017). Nevertheless, uncertainties—arising from changing policies, climate variability, and advancing technologies—complicate long-term projections and must be acknowledged when interpreting scenario outputs.
This study focuses on the North Vidzeme Biosphere Reserve (NVBR) in Latvia, a United Nations Educational, Scientific and Cultural Organization (UNESCO) designated site that represents the challenges of balancing conservation with sustainable development (Bridgewater, 2016). Biosphere reserves under UNESCO’s Man and the Biosphere Programme are typically zoned into core areas (strict conservation), buffer zones (low-impact use), and transition zones (sustainable economic activities) (Batisse, 1997).
Using historical LULC trends (1990–2018) and scenario-based modeling, this research aims to project future changes (2018–2046) and assess their implications for conservation planning. By analyzing persistent areas, net transitions, and swap changes, this study identifies key driving forces of LULC change and provides actionable insights to support sustainable land management. The results contribute to evidence-based policy-making and advance methodologies for LULC modeling in biosphere reserves.
The NVBR (Figure 1), established in 1997, is Latvia’s only biosphere reserve and part of UNESCO’s World Network of Biosphere Reserves (Nature Conservation Agency of the Republic of Latvia, 2024). Spanning 475,514 ha (457,708 ha terrestrial and 17,806 ha marine), the NVBR covers 6% of Latvia’s total land area. It includes varied ecosystems such as the Salaca River basin, Lake Burtnieks, and Vidzeme coast of the Gulf of Riga, with coastal dunes, wetlands, forests, and semi-natural grasslands. It contains approximately 74% of Latvia’s lagoon habitats, 6% of its forest habitats, and 11.6% of its swamp and spring habitats, demonstrating its ecological importance for national biodiversity.
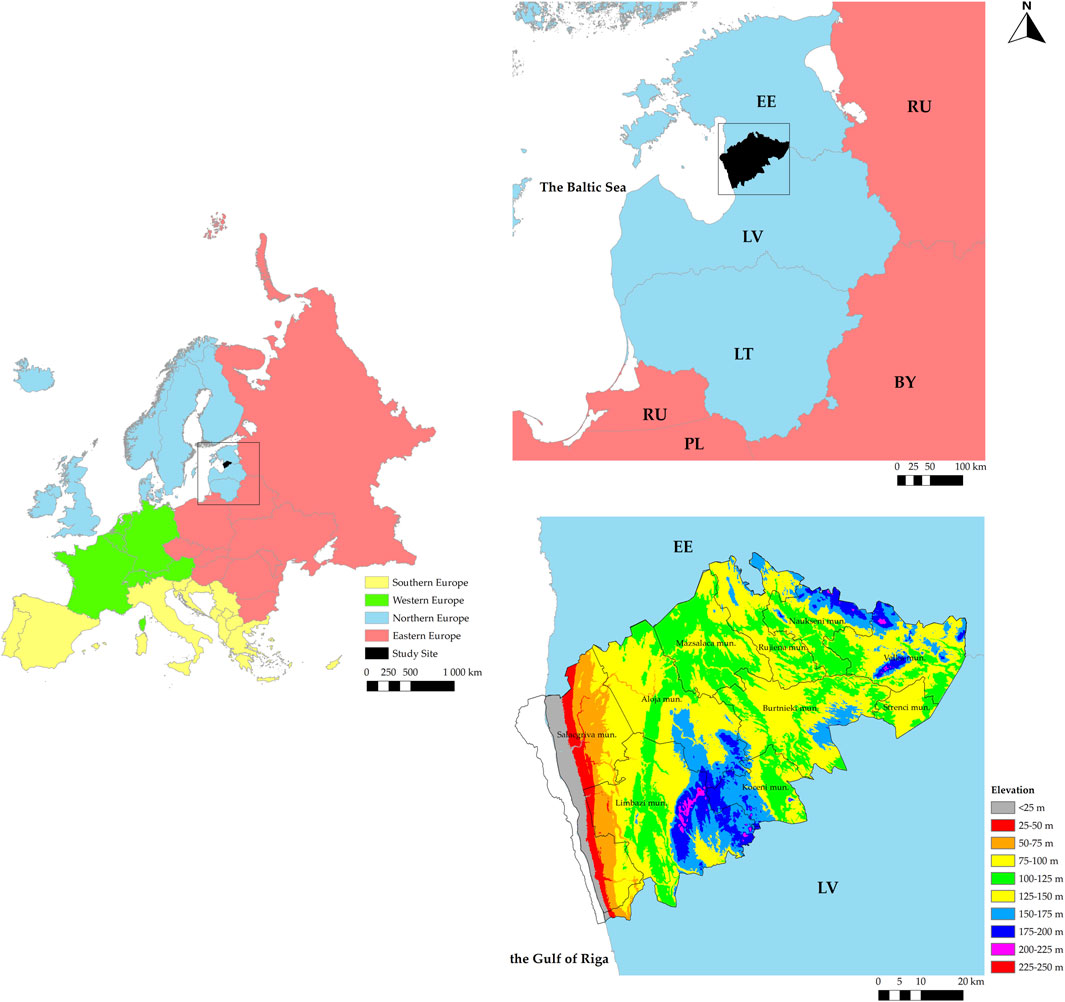
Figure 1. Location map of the North Vidzeme Biosphere Reserve.
Forests cover 45% of the NVBR, serving as essential habitats for biodiversity. However, habitat fragmentation threatens their ecological connectivity, potentially limiting species movement and genetic exchange. Wetlands, accounting for 3.64%, include significant complexes such as Seda Bog and Ziemeļu Bog. These areas have been degraded by historical land reclamation and are now the focus of ecological restoration efforts aimed at preserving their hydrological functions and biodiversity. Grasslands occupy only 0.57% but are vital for biodiversity and require active management to prevent habitat loss. Rivers and lakes, covering 1.42%, support key habitats like salmon spawning grounds along the Salaca River (Nature Conservation Agency of the Republic of Latvia, 2024).
Within this protected area, numerous threatened species are found, many of which are listed in Latvia’s Red Data Book, the EU Habitats and Birds Directives, and the IUCN Red List.
Threatened fauna in NVBR includes mammals such as the lynx (Lynx lynx), European otter (Lutra lutra), and various species of bats. The bird species at risk include the lesser spotted eagle (Clanga pomarina), black stork (Ciconia nigra), corncrake (Crex crex), and white-tailed eagle (Haliaeetus albicilla). Amphibians and reptiles like the European pond turtle (Emys orbicularis) and the fire-bellied toad (Bombina bombina) are also under threat. In aquatic and invertebrate species, the European eel (Anguilla anguilla) and the hermit beetle (Osmoderma eremita) are among those requiring conservation attention. Various butterflies and dragonflies are particularly vulnerable to habitat loss and environmental changes (Nature Conservation Agency of the Republic of Latvia, 2024).
Threatened flora in the NVBR includes species that are characteristic of forests, wetlands, and coastal dunes. Lady’s slipper orchid (Cypripedium calceolus), marsh helleborine (Epipactis palustris), marsh saxifrage (Saxifraga hirculus), and floating water-plantain (Luronium natans) are important wetland and grassland plants at risk. Forest lichens such as tree lungwort (Lobaria pulmonaria) and reindeer lichen (Cladonia stellaris) indicate high-quality, undisturbed forest ecosystems. Coastal and dune plants such as sea thrift (Armeria maritima) are also vulnerable due to increasing human activity and coastal erosion (Nature Conservation Agency of the Republic of Latvia, 2024).
There are no known strictly endemic species exclusive to NVBR, as Latvia’s biodiversity is largely shared with the broader Baltic region and Northern Europe. However, the reserve does contain several regionally rare or unique subspecies and habitat specialists that are significant for conservation. Among them, the freshwater pearl mussel (Margaritifera margaritifera) is particularly important for clean river ecosystems. Other notable species include the Baltic dunlin (Calidris alpina schinzii), the Rannoch looper moth (Macaria brunneata), and the northern birch mouse (Sicista betulina). Several plants such as sheathed sedge (Carex vaginata), bog orchid (Hammarbya paludosa), Baltic sea wormwood (Artemisia campestris ssp. bottnica), and Baltic rush (Juncus balticus) represent Latvia’s wetland and coastal biodiversity. Some of these species have their southernmost or northernmost populations within NVBR, making their conservation particularly important (Nature Conservation Agency of the Republic of Latvia, 2024).
The NVBR is home to approximately 49,644 residents, which is about 2.6% of Latvia’s population, and hosts industries such as agriculture, forestry, tourism, and fishing. Human settlements within NVBR are low-density and dispersed, with no major urban centers. The population is concentrated in small towns, villages, and scattered rural homesteads, mostly along river valleys, coastal areas, and transport routes. The small towns, which typically have 1,000–3,000 residents, serve as service hubs, providing markets, administration, and infrastructure. The majority of residents live in villages, which range from 100 to 1,000 people, clustered around agricultural lands, rivers, and roads. Additionally, some residents live in scattered rural homesteads, which are located in forested areas, grasslands, and wetland edges (Nature Conservation Agency of the Republic of Latvia, 2024).
The conservation policies and management framework of NVBR involve a combination of national legislation, EU environmental directives, and international agreements. At the national level, NVBR is governed under Latvia’s Law on Specially Protected Nature Territories (Supreme Council of the Republic of Latvia, 1993), the Law on Environmental Protection (Saeima, 2006), and the Law on Forests (Saeima, 2000). Additionally, the Latvian Red Data Book (University of Latvia, 2025) provides legal protection for endangered species, while regulations on hunting (Saeima, 2003) and invasive species (Cabinet of Ministers, 2008) management ensure the sustainable use of resources and control of non-native species. NVBR is also part of the EU Natura 2000 network, meaning that it is protected under the EU Habitats Directive (92/43/EEC) (Council of the European Union, 1992) and the EU Birds Directive (2009/147/EC) (European Union, 2009). Other EU policies, such as the Water Framework Directive (2000/60/EC) (European Union, 2000), the Marine Strategy Framework Directive (2008/56/EC) (European Union, 2008), and the EU Biodiversity Strategy 2030 (European Commission, 2025), further contribute to habitat protection and sustainable resource use. Internationally, NVBR is recognized under the UNESCO Biosphere Reserve framework (Nature Conservation Agency of the Republic of Latvia, 2024). Additionally, several wetlands within NVBR are designated under the Ramsar Convention (Ministry of Environmental Protection and Regional Development, 1998), ensuring their protection as internationally important wetland ecosystems. The reserve also falls under the Bern Convention on European Wildlife and Habitats (Council of Europe, 2025).
In practice, conservation management in NVBR focuses on sustainable land-use, habitat restoration, and species monitoring. Sustainable agricultural and forestry policies are in place to balance economic activity with biodiversity conservation. Efforts to control invasive species help prevent biodiversity loss, particularly in forests and wetlands. Scientific research and ecological monitoring programs track changes in species populations, habitat quality, and the effects of climate change. Community engagement initiatives, including eco-tourism and environmental education, help integrate local populations into conservation efforts while promoting sustainable livelihoods.
The NVBR integrates conservation with sustainable development and is managed under the law on North Vidzeme Biosphere Reserve, managed by the Nature Conservation Agency (Saeima, 1997). Zoning ensures a balance between conservation and development, with protected areas focusing on biodiversity and neutral zones permitting sustainable economic activities. Functional zoning categorizes core conservation areas, buffer zones, and transition zones, each governed by specific land-use restrictions that prioritize either ecological integrity or sustainable use.
The research workflow, illustrated in Figure 2, comprised five main steps: 1) data collection, 2) data preprocessing, 3) model calibration and validation, 4) scenario development, and 5) final outputs.
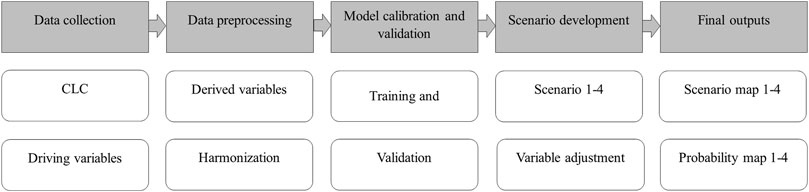
Figure 2. Processing workflow of the land-use and land-cover change modeling.
Data collection incorporated Corine Land Cover (CLC) datasets from 1990, 2000, 2006, 2012, and 2018, alongside key driving variables such as elevation, proximity to roads, climate, and socio-economic factors.
During data preprocessing, additional variables, including slope, distance to roads, and land fragmentation metrics, were derived, while datasets were harmonized through clipping, reclassification, and standardization to ensure consistency.
Model calibration and validation involved training the MLP and CA-Markov model using LULC data from 1990 to 2012 to predict the 2018 LULC map, which was subsequently compared to the actual 2018 LULC data to assess predictive accuracy. Validation metrics, including the Kappa Index (KIA) and Cramer’s V, were employed to evaluate model performance, and necessary refinements were made to improve reliability.
Scenario development encompassed four distinct land-use projections: 1) BAU, 2) SD, 3) CAM, and 4) C-O, each characterized by different transition probabilities, suitability layers, and land-use constraints. Using these scenarios, the model generated LULC projections for 2046, providing insights into potential land-use change trajectories.
The final outputs included scenario-specific LULC maps for 2046, illustrating spatial distributions of land-use change, along with scenario probability maps indicating the likelihood of land-use changes under each modeled future.
This study utilized a varied set of spatial datasets to analyze LULC changes and develop future scenarios in the NVBR. The primary LULC data were derived from the CLC datasets (Table 1), obtained from the Copernicus Land Monitoring Service (CLMS), with a spatial resolution of 100-m for the years 1990, 2000, 2006, 2012, and 2018 (European Environment Agency, 2024). These datasets were clipped to the NVBR boundaries and harmonized across different years to ensure consistency in classification and facilitate accurate trend analysis.
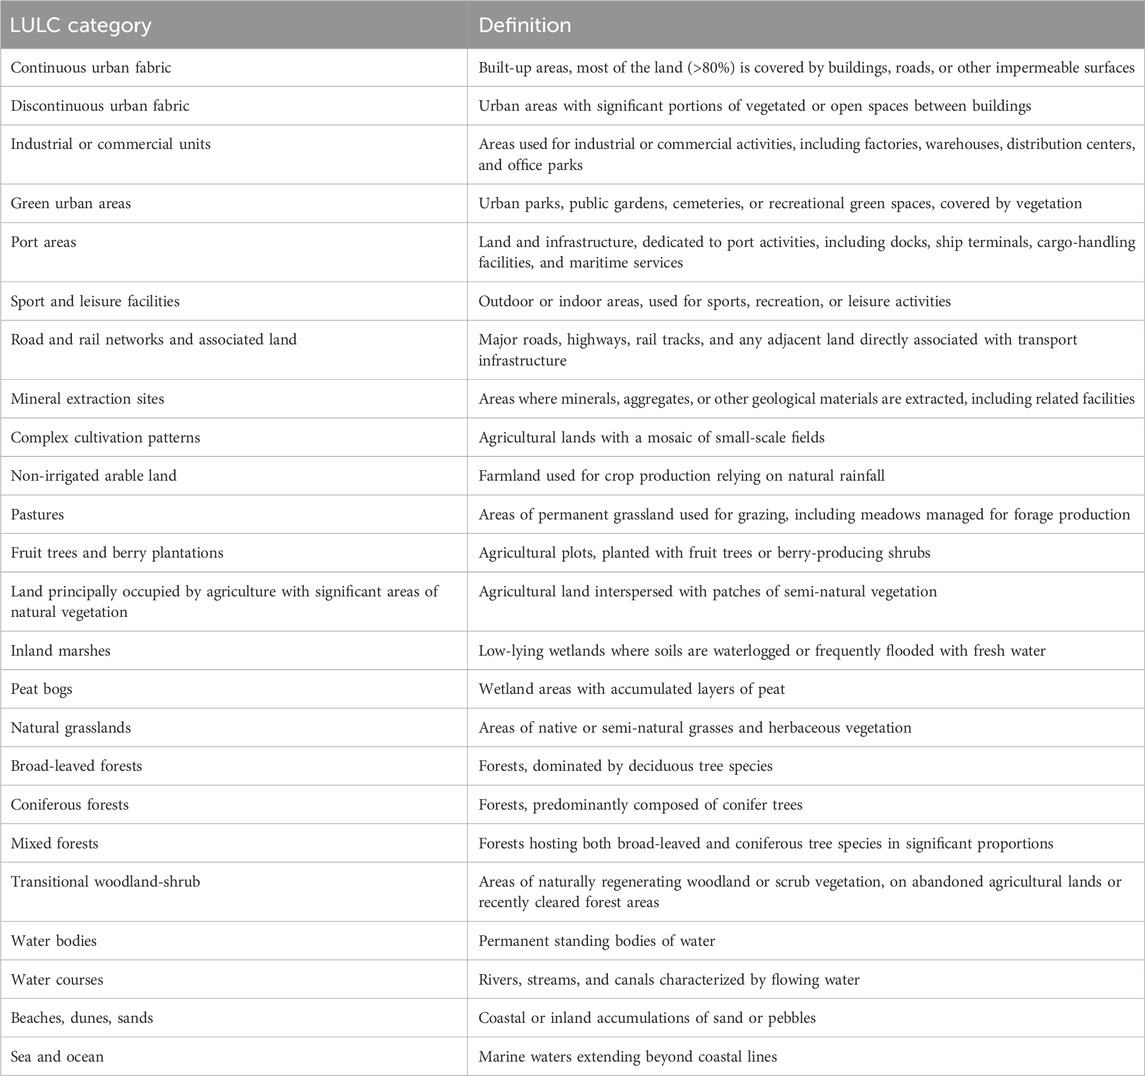
Table 1. Land-use and land-cover categories which are present in the North Vidzeme Biosphere Reserve.
To account for topographical influences on land-use transitions, a Digital Elevation Model (DEM) of Latvia was sourced from Latvian Geospatial Information Agency (LGIA) at 20-m resolution (The Latvian Geospatial Information Agency, 2024). Using spatial analysis tools in ArcMap 10.8.2, slope and aspect layers were derived from the DEM, while contour lines with elevation values, obtained from the Envirotech database (2024), were integrated into the analysis to improve terrain representation (Envirotech, 2024).
Hydrological data, including river networks and lakes, were obtained from Envirotech (2024) and clipped to the NVBR boundaries (Envirotech, 2024). To assess the influence of proximity to water bodies on land-use change, Euclidean distance measures were generated. Similarly, infrastructure and human impact data, such as road networks, settlements, and zoning information, were extracted from GIS Latvia 10.2 (2021) and Envirotech (2024) (Envirotech, 2024; Nature Conservation Agency of the Republic of Latvia, 2020). These datasets were processed to derive distance-based variables, including proximity to roads, settlements, and protected areas, as well as road and river density metrics, which were used to evaluate human-driven land-use dynamics.
Climatic data, including minimum, mean, and maximum annual temperature and precipitation, were obtained from Latvian Environment, Geology, and Meteorology Centre (LEGMC) at 1-km resolution, covering both historical (1991–2020) and projected climate scenarios (2001–2050) under the SSP1-2.6, SSP2-4.5, and SSP3-7.0 pathways (Latvian Environment, Geology, and Meteorology Centre, 2024). These datasets were harmonized to match the NVBR study area and integrated into the land-use transition modeling framework.
Soil datasets were sourced from the Nature Data Management System OZOLS database (2017, 20-m resolution) and preprocessed to align with other spatial layers (Nature Conservation Agency of the Republic of Latvia, 2020). Biodiversity and conservation data, including micro-reserves, protected areas, habitat distribution, and forest ownership, were obtained from Latvian State Forests and Natura 2000 databases (2017–2019) (European Environment Agency, 2023; Latvia’s State Forests, 2024). These datasets provided ecological context for assessing conservation priorities and land-use constraints in scenario development.
Demographic and socio-economic data, specifically population density statistics, urban and rural population, were extracted from the Official Statistics Portal of Latvia (2025) (Central Statistical Bureau, 2024). These data were spatially processed to match the NVBR boundaries, providing insights into population dynamics and their influence on land-use change.
In addition to primary datasets, a set of derived variables was generated to improve the analytical framework. These included landscape structure metrics such as normalized entropy, patch compactness, relative richness, edge density, habitat connectivity, ecological corridors, and terrain resistance to change. Distance-related variables were computed for roads, rivers, protected areas, micro-reserves, and populated places. Proximity to settlements was quantified using Euclidean distance analysis in ArcMap 10.8.2, measuring the straight-line distance from each location to the nearest urban or rural population center. To categorize settlement influence, a buffer zone classification was applied, dividing the landscape into three distance categories: 0–5 km, 5–15 km, and >15 km. The 0–5 km zone represents areas under high human pressure, where urban influence is most pronounced. The 5–15 km range shows areas with moderate human impact, typically characterized by a mix of agricultural and forestry activities. The >15 km zone delineates remote areas where natural ecosystems predominate, with minimal direct anthropogenic influence. Hydrological modeling was integrated using flow length, water flow direction, and cost corridor analyses, enabling assessments of terrain-driven water movement and its implications for land-use transitions.
All datasets were preprocessed to ensure uniform spatial resolution, format, and coordinate system to maintain consistency across all model inputs. No modifications were made to the original CLC classification scheme, and land-cover categories retained their native classifications without reclassification.
The analytical framework for this study integrated geospatial analysis, statistical validation, and scenario modeling to assess and project LULC changes (Tariq and Mumtaz, 2023) in the NVBR from 1990 to 2046. Historical analyses were based on CLC datasets for 1990, 2000, 2006, 2012, and 2018. These datasets were clipped to the NVBR boundaries and standardized into a uniform spatial grid of 649,333 cells, each representing approximately 1.37 ha. Preprocessing steps included harmonization of land cover categories across years to ensure consistency in spatial resolution and classification parameters. Temporal comparisons of LULC changes were conducted using TerrSet software (Clark University, 2024), which facilitated the calculation of cell counts and conversion to percentages.
Driving variables (Allan et al., 2022) were categorized into seven thematic groups to capture ecological, socio-economic, and spatial dynamics affecting LULC changes. 1) Topographical variables, such as slope and aspect, accounted for natural constraints and land-use suitability. 2) Hydrological variables, including river density and proximity to water bodies, were integrated to assess water-dependent land-use and conservation priorities. 3) Climate and soil data, encompassing precipitation, temperature, and soil type, supported analyses of land-use suitability and transitions under climate adaptation scenarios. 4) Accessibility and infrastructure data, such as proximity to roads and settlements, captured development pressures and human influences on the NVBR landscape. 5) Landscape structure and complexity were represented by metrics such as edge density, normalized entropy, and resistance to change, which reflected fragmentation and spatial heterogeneity. 6) Socio-economic variables, including population density and rural-urban ratios, demonstrated human pressures and policy constraints. 7) Historical and dynamic variables, such as change hotspots and spatial clusters, captured past LULC changes and areas prone to future change.
No modifications were made to the original CLC classification scheme, as all land cover datasets were sourced from CLMS and maintained identical classifications, eliminating the need for standardization. Consequently, no reclassification of CLC categories was performed in this study. However, to ensure consistency across all model inputs, external datasets, including driving variables and derived variables, were resampled and spatially aligned with the CLC grid. Although these datasets did not require categorical reclassification, preprocessing steps were implemented to ensure uniform resolution, format, and spatial reference across all layers used in the modeling process. Given that the analysis aimed to preserve finer details in observed land cover changes, no similar land cover classes were grouped or merged, and no explicit reclassification rules were applied. This approach maintained the integrity of the original classifications while ensuring consistency across all inputs, making reclassification unnecessary and without added analytical value.
A multi-layer perceptron neural network was configured with a hidden layer of 30 nodes, a starting learning rate of 0.01 (decreasing to 0.001), and a momentum factor of 0.9. A maximum of 10,000 iterations, an RMS threshold of 0.01, and a target accuracy of 85% served as stopping criteria. Each LULC category included a training sample of 10,000 pixels, with a 50/50 split between training and testing data to evaluate model performance (Kruse et al., 2022; Kumar and Agrawal, 2023; Nguyen et al., 2020).
Four scenarios were developed to project potential future LULC changes (Mallampalli et al., 2016) in the NVBR for the period 2018–2046. These scenarios, designed to explore a range of socio-economic and environmental trajectories, included BAU, SD, CAM, and C-O. Each scenario was informed by historical LULC trends, key drivers of change, and policy contexts.
The BAU scenario assumed the continuation of historical LULC dynamics without significant policy interventions or management changes (Hamad et al., 2018). Essentially, no artificial constraints or incentives were applied, maintaining observed transition probabilities from 1990 to 2018. It included 73 observed transitions from 1990 to 2018, excluding any transition that accounted for less than 0.1% of total changes, which minimized noise. Rare transitions, which lacked sufficient representation in the training dataset, were excluded to prevent overfitting and ensure model generalizability. This filtering process retained 22 key transitions, ensuring the model remained robust while reflecting dominant land-use trajectories.
The SD scenario emphasized balanced land-use practices, promoting ecological restoration, efficient resource use, and improved human wellbeing (Shi et al., 2021). This forward-looking scenario included changes supporting biodiversity conservation and carbon sequestration, such as the conversion of agricultural land to pastures or forests. SD scenario incorporated land-use transitions promoting biodiversity and sustainable resource use, such as the conversion of low productivity agricultural land to pastures/forests (informed by policies promoting agri-environmental schemes). Transitions that leads to habitat loss or ecological degradation were restricted, while new transitions supporting afforestation and wetland restoration were added. The SD scenario was structured to emphasize balanced land-use practices, ecological restoration, efficient resource use, and improved human wellbeing. To align with these principles, the model incorporated transitions that promote sustainability while excluding those linked to significant ecological degradation. Unlike the BAU scenario, where only past LULC transitions were used, the SD scenario introduced historically unobserved transitions to reflect proactive land-use planning and environmental policies. Key transitions included non-irrigated arable land to forests, natural grasslands, or transitional woodland-shrub, promoting afforestation and biodiversity conservation. Additionally, complex cultivation patterns shifting to diversified agriculture (e.g., fruit trees, berry plantations, or agroforestry systems) were included to improve soil health and carbon sequestration. Other transitions, such as mineral extraction sites converting into woodland-shrub ecosystems, were integrated to reflect long-term ecological restoration efforts.
The CAM scenario prioritized improving landscape resistance to climate change by incorporating changes that improved carbon storage, water regulation, and biodiversity conservation (Santos et al., 2021). Key changes included afforestation, wetland restoration, and the conversion of degraded lands to more resilient ecosystems, limiting land-use intensification in climate-sensitive areas. The CAM scenario focused on enhancing ecosystem resilience, increasing carbon sequestration, and improving water regulation in response to climate change. This scenario prioritized LULC transitions that improve carbon storage, biodiversity conservation, and adaptive capacity. Historically observed transitions, such as complex cultivation patterns shifting to fruit trees and berry plantations, were retained due to their potential for carbon sequestration and soil improvement. Additionally, the model introduced new transitions, such as the conversion of non-irrigated arable land and pastures to broad-leaved forest, coniferous forest, or mixed forest, reflecting afforestation and reforestation as climate mitigation strategies. Transitions supporting wetland restoration, such as water bodies to inland marshes, were included to enhance hydrological regulation. Furthermore, transitions like non-irrigated arable land to sustainable agricultural systems with natural vegetation integration were incorporated to balance food security with biodiversity conservation.
The C-O scenario focused on strict biodiversity preservation and ecological integrity. This scenario emphasized changes that improved habitat connectivity and restored degraded ecosystems, such as the conversion of transitional woodland-shrub to mature forests and the rewilding of abandoned lands (Cameron et al., 2022), limiting land-use conversions that fragment ecosystems. Transitional woodland-shrub was actively converted to mature forests to simulate stricter conservation efforts. The C-O scenario prioritized biodiversity protection, habitat connectivity, and landscape restoration by incorporating LULC transitions that minimize fragmentation and enhance ecological integrity. This scenario retained only transitions that align with conservation principles, ensuring that land-use changes reinforce natural processes rather than disrupt them. Key transitions included converting mineral extraction sites to woodland-shrub habitats, facilitating the recovery of degraded landscapes, and promoting afforestation efforts by transitioning non-irrigated arable land and pastures into forested areas, natural grasslands, or transitional woodland-shrub. The scenario also integrated transitions from transitional woodland-shrub to mature forests to strengthen habitat connectivity. Wetland restoration was supported through transitions such as water bodies to inland marshes, improving ecosystem functionality. Sustainable agricultural transitions, such as complex cultivation patterns shifting toward agroforestry and diversified land-use systems, were retained to balance conservation with land productivity.
Transition probability grids and suitability maps were generated using a CA-Markov model, refined by the MLP neural network to improve spatial allocation via non-linear relationships between driving variables and LULC changes (Devi and Shimrah, 2023).
Final scenario outcomes were visualized for 2046, providing perception into potential trade-offs and synergies between conservation and development goals. These projections were designed to inform evidence-based land management and policy-making in the NVBR.
The statistical analysis aimed to validate historical LULC trends, assess transition dynamics, and evaluate spatial patterns to ensure the robustness of scenario projections. Temporal trends in LULC changes were analyzed using the non-parametric Mann-Kendall test at p ≤ 0.05, suitable for detecting monotonic trends in non-linear datasets (Chen et al., 2020; Chughtai et al., 2021). This test was applied to each LULC category across individual time intervals (1990–2000, 2000–2006, 2006–2012, and 2012–2018) as well as the entire historical period (1990–2018). Positive Z-values indicated upward trends, while negative Z-values indicated downward trends.
Transition matrices were constructed for historical LULC changes, and their statistical significance was evaluated using Chi-square tests and Cramer’s V, which quantified the relationship between observed and expected transitions (Ren et al., 2019). Persistent areas, defined as areas where land-cover remained unchanged over time, were calculated to highlight stable zones, while swap changes, indicating bidirectional transitions between categories, were quantified using cross-tabulation matrices (Camacho Olmedo and García-Álvarez, 2022).
Principal Component Analysis (PCA) was conducted to identify key variables influencing LULC changes. Components with eigenvalues greater than 1, following the Kaiser criterion, were retained, explaining over 80% of total variance (Balicki, 2014). These results were used to refine transition probability grids and scenario-specific adjustments.
Spatial metrics were employed to assess landscape fragmentation and connectivity. Moran’s I measured spatial autocorrelation to identify clustering or dispersion patterns. Contiguity was defined using both Rook’s case (edge-sharing neighbors) and King’s case (edge- and corner-sharing neighbors) (Dubin, 2009). These analyses identified fragmentation hotspots and connectivity corridors. All statistical analyses were performed using R, with additional preprocessing and geospatial operations conducted in ArcGIS and TerrSet.
To assess the accuracy of the LULC classification and ensure the reliability of model projections, the KIA, which measures classification consistency across historical time periods (1990–2018), was used (Mondal et al., 2016). A higher KIA indicates stronger spatial stability. This metric was applied to historical LULC transitions from 1990 to 2018 to validate model performance before applying it to future scenario projections.
Legal compliance was assessed to ensure that the projected LULC changes under each scenario adhered to the regulatory framework of the NVBR and relevant conservation policies. The NVBR operates under Law on Specially Protected Nature Territories (1993), which defines functional zoning to balance conservation and sustainable development (Supreme Council of the Republic of Latvia, 1993). Law on North Vidzeme Biosphere Reserve (1997) (Saeima, 1997), Natura 2000 guidelines (European Commission, 2024), EU Birds (European Union, 2009) and Habitats (Council of the European Union, 1992) directives, and site-specific management plans further regulate land-use activities in priority conservation areas.
LULC changes were classified into permissible (fully aligned with regulations), conditionally permissible (requiring specific mitigation or approval), or prohibited (explicitly disallowed in certain zones). Examples include banning deforestation in core conservation areas or urban expansion in critical habitats. Spatial overlays of LULC data with zoning maps identified conflicts or alignments with conservation objectives.
Scenario-specific compliance was evaluated by aligning projected changes with legal and ecological priorities. The SD, CAM, and C-O scenarios integrated these legal constraints into transition probability grids, disallowing transitions that contravened conservation objectives. The BAU scenario was evaluated post hoc to show potential conflicts in a no-intervention future, where no additional measures would be taken to change current trends, policies, or management strategies. This legal compliance assessment ensured that scenario outcomes were not only ecologically relevant but also adhered to the NVBR’s conservation mandates and broader policy frameworks.
A limitation of this study is the reliance on CLC datasets, which are updated every 6 years, potentially limiting the detection of short-term land-use changes. However, given the NVBR’s protected status and stable environmental policies, rapid land-use changes are unlikely. Additionally, many key geographic features—such as cities, villages, lakes, rivers, roads, slope, and elevation—have remained largely unchanged over the study period, reducing the impact of this limitation. While more frequent datasets could provide additional insights, CLC remains a valuable source due to its consistent classification methodology and long-term comparability across Europe.
Another limitation is the CLC dataset’s 25-ha minimum mapping unit, which generalizes small-scale land-use changes, potentially leading to underestimation or aggregation. However, given the broad spatial scale of the NVBR (475,514 ha), such minor changes (less than 0.0055%) would be difficult to detect or meaningfully visualize on a map, furthermore such small land patches do not affect the broader trends of LULC changes.
Classification noise in CLC datasets can introduce unrealistic land-use changes, particularly in cross-tabulation matrices. This issue is particularly relevant for agricultural lands (e.g., pastures and non-irrigated arable land), where reclassification between categories may introduce uncertainty. In this study, the observed land-use changes were substantial, making it unlikely that classification noise alone accounts for the identified trends. Nonetheless, classification uncertainties in CLC cannot be fully eliminated.
The disappearance of urban areas in NVBR may seem counterintuitive but reflects regional socio-economic trends rather than dataset errors. However, in post-Soviet contexts, rural depopulation, economic decline, and land abandonment have led to the degradation and reclassification of previously built-up areas—a phenomenon widely documented across Eastern Europe. In this study, instances where urban fabric disappeared were not followed by reappearance in later time steps, suggesting a permanent change rather than a classification artifact. Thus, in this regional context, the loss of urban land shows socio-economic changes rather than a dataset error. Despite mitigation efforts, limitations in temporal resolution, spatial scale generalization, and classification accuracy remain inherent challenges in LULC modeling. Yet, through rigorous dataset harmonization, methodological validation, and contextual analysis, these issues were mitigated as much as possible.
Between 1990 (Figure 3A) and 2018 (Figure 3B), the NVBR experienced gradual but significant LULC changes (Table 2). In 1990, the area was dominated by agricultural activities, with non-irrigated arable land (19.77%) and complex cultivation patterns (9.40%) comprising the largest categories. Urbanization was minimal, with discontinuous urban fabric covering only 0.43% of the area. Forests provided considerable ecological diversity, with broad-leaved, coniferous, and mixed forests collectively covering 48.52%. Semi-natural habitats, including peat bogs (3.48%), and hydrological features also contributed to the area’s biodiversity. Spatial metrics showed a highly cohesive landscape with a Moran’s I value of 0.9790, indicating strong clustering of LULC categories and minimal fragmentation.
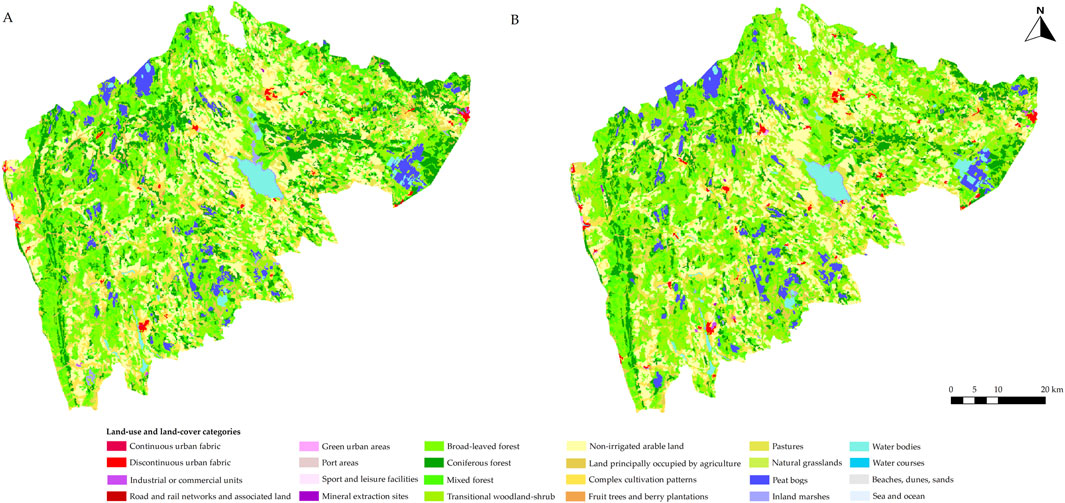
Figure 3. Land-use and land-cover distribution in (A) 1990 and (B) 2018, illustrating major changes over time.
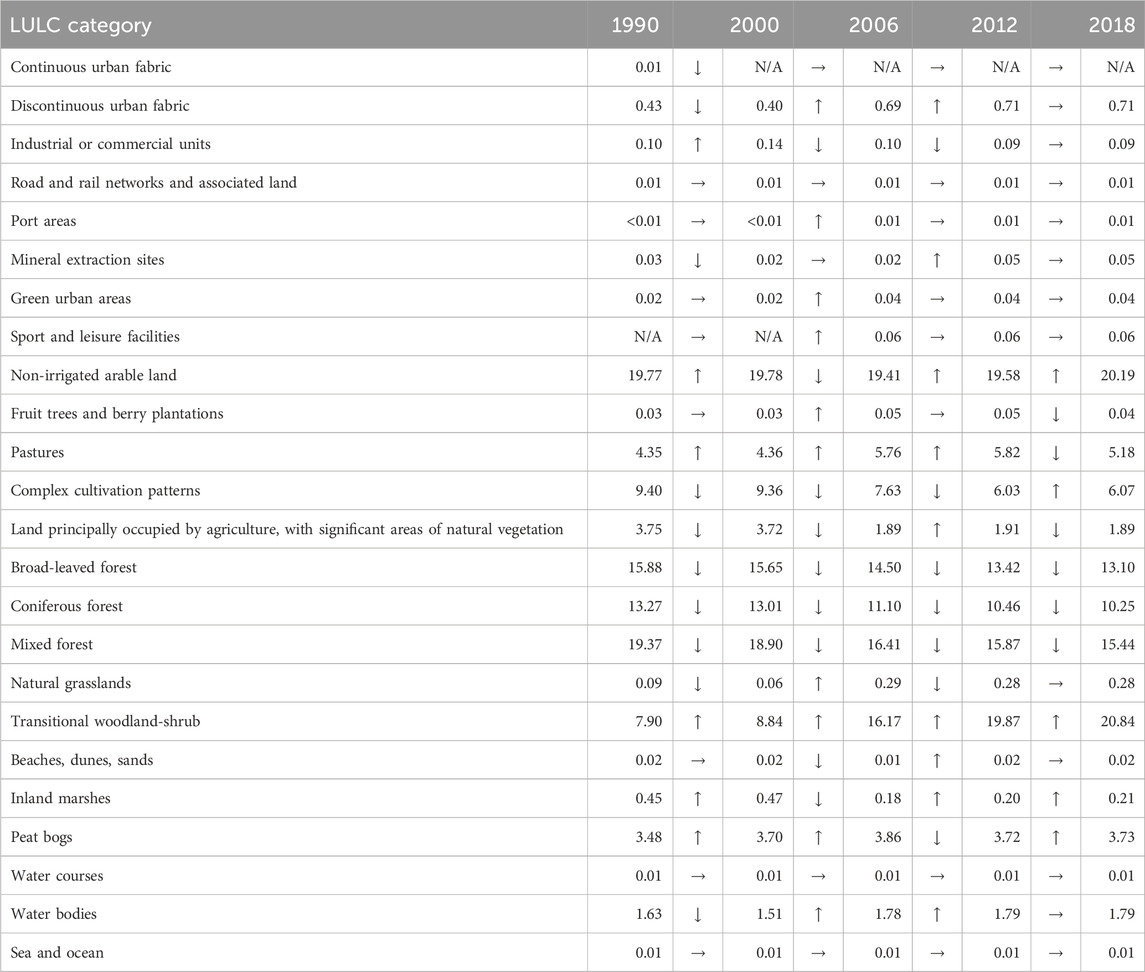
Table 2. Historical land-use and land-cover distribution (% of the total area, ↓ - decrease, ↑ - increase, → no change).
By 2000, subtle changes in LULC patterns emerged (Table 2). Urban areas declined slightly to 0.40%, while industrial activity grew marginally. A Chi-square value of 23,688.576 (p < 0.0001) between 1990 and 2000 and a high Cramer’s V of 0.9339 indicated significant changes despite their small magnitude. Agricultural land-use patterns remained stable, with minor changes in non-irrigated arable land (19.78%) and pastures (4.36%). The area of transitional woodland-shrub expanded to 8.84%, driven by land abandonment and natural succession. Some changes, such as complex cultivation patterns to discontinuous urban fabric (3.01%), did not fully comply with the NVBR’s legal framework. The Moran’s I value remained consistent at 0.9794, indicating continued spatial cohesion.
Between 2006 and 2012, the pace of change accelerated (Table 2). Urban growth was notable, with discontinuous urban fabric increasing to 0.71% by 2012. Transitional woodland-shrub expanded to 19.87%, showing widespread ecological succession. Agricultural land displayed mixed dynamics, with non-irrigated arable land at 19.58% in 2012 and pastures peaking at 5.82%. Forest cover declined steadily (e.g., broad-leaved forest at 13.42% by 2012). Statistical tests showed significant reductions in forest categories (Z = −2.20, p = 0.03) and expansions in transitional woodland-shrub (Z = 2.20, p = 0.03). Spatial patterns showed gradual diversification, with Moran’s I declining slightly to 0.9771.
By 2018, the area exhibited relative stability (Table 2). Non-irrigated arable land increased to 20.19%, while pastures declined to 5.18%. Forest declines slowed, with broad-leaved forests (Figure 4A) covering 13.10%, and transitional woodland-shrub (Figure 4B) reached 20.84%. Spatial metrics suggested persistent but slightly weakened clustering (Moran’s I: 0.9769), indicating a balanced mix of stability and gradual change.
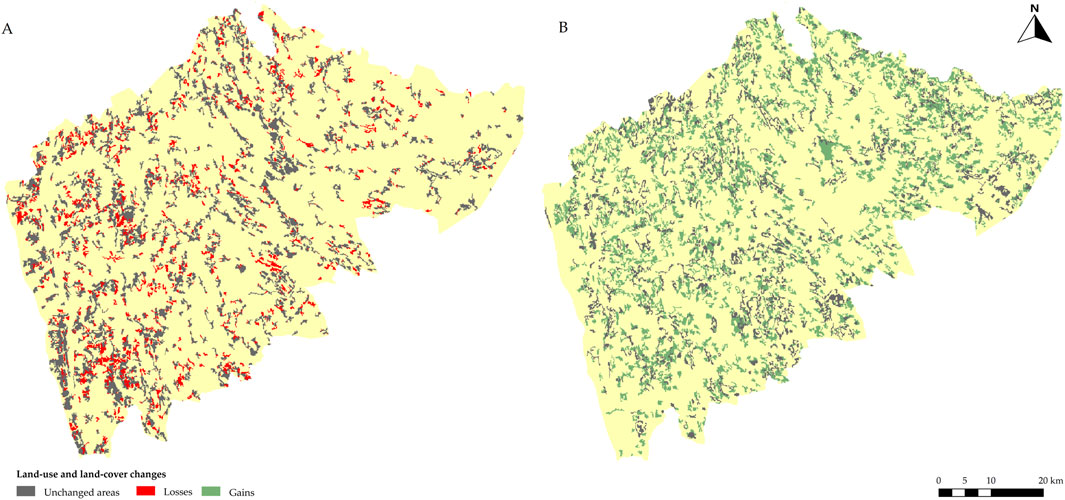
Figure 4. (A) Areas of broad-leaved forest in 1990 (gray) with losses by 2018 highlighted in red. (B) Transitional woodland-shrub gains by 2018 (green) compared to 1990, with unchanged areas depicted in dark gray. Gray represents areas existing in 1990, and red or green indicate changes by 2018.
Over the historical period, 8.44% of the NVBR underwent net LULC changes (Table 2), primarily in agricultural (Figure 5A) and semi-natural (Figure 5B) categories. Key transitions included the conversion of complex cultivation patterns to non-irrigated arable land (29.70%) and the intensification of pastures into cropland, which accounted for 16.45% of changes. Further Chi-square tests and Cramer’s V values approached near-perfect levels (e.g., Cramer’s V = 0.9829 by 2012–2018), suggesting an increasingly stable yet gradually developing landscape.
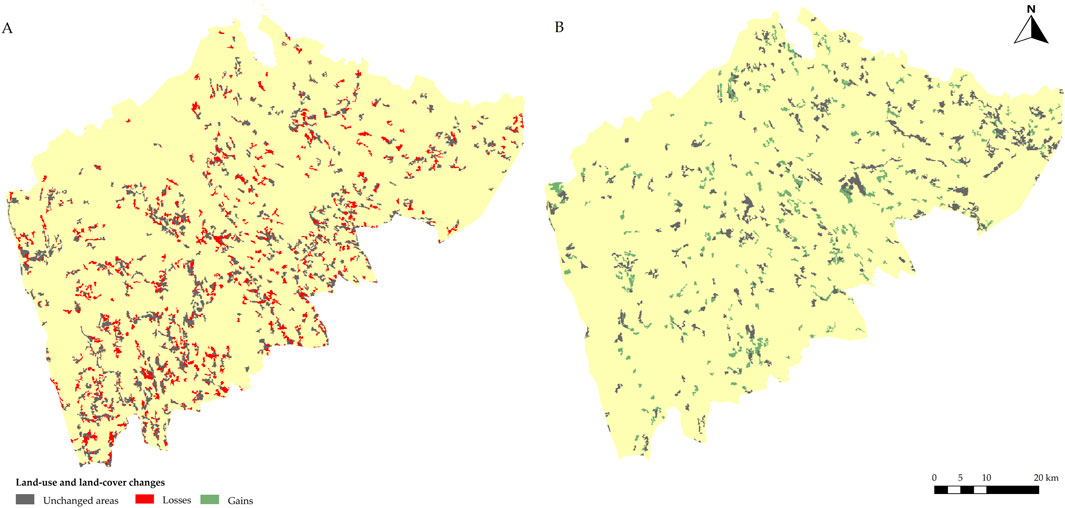
Figure 5. (A) Areas of complex cultivation patterns in 1990 (gray) with losses by 2018 highlighted in red. (B) Pasture gains by 2018 (green) compared to 1990, with unchanged areas depicted in dark gray. Gray represents areas existing in 1990, and red or green indicate changes by 2018.
Historical persistence patterns highlight the relative stability of certain LULC categories. Between 1990 and 2018, approximately 17.72% of the NVBR demonstrated no LULC changes. Highly persistent categories included port areas (100%) and green urban areas (92.36%), demonstrating their designated purposes and controlled use. Non-irrigated arable land displayed significant persistence at 77.71%, while discontinuous urban fabric exhibited moderate persistence at 73.66%, suggesting limited urban expansion. Pastures and complex cultivation patterns showed lower persistence levels (45.20% and 61.56%, respectively), indicating dynamic changes between grazing, cultivation, and abandonment. Forested categories had moderate persistence, although some forest-to-agriculture transitions conflicted with NVBR conservation regulations. Meanwhile, transitional woodland-shrub displayed rapid changes, showing ongoing ecological succession.
Bidirectional swaps indicate dynamic changes within the NVBR. From 1990 to 2000, industrial/commercial units and discontinuous urban fabric exhibited significant interactions (23.65%), while agricultural changes between non-irrigated arable land and pastures accounted for 3.20%. From 2006 to 2012, forested categories demonstrated notable swaps, with mixed forests and transitional woodland-shrub exchanging 5.87%. By 2018, swaps became more localized, with interactions between non-irrigated arable land and fruit trees (5.28%) suggesting agricultural diversification. High swap changes emphasized areas of dynamic change, while low swaps (<1%) showed stable conservation measures. Some swaps, such as forested lands reverting to agricultural use, were partially restricted under NVBR regulations, highlighting the need for stricter enforcement.
PCA identified two components explaining 99.13% of the variance in driving variables (Table 3). Component 1 (97.92%) was dominated by spatial distances such as proximity to protected areas, corridors, and area size, reflecting large-scale land-use patterns. Component 2 (1.21%) emphasized connectivity and micro-level ecological interactions, with notable contributions from corridor types and micro reserves.

Table 3. Variables driving the land-use and land-cover change in the North Vidzeme Biosphere Reserve within principal component 1.
The analysis suggest that the land patch size is the most significant driver of LULC change in the NVBR, contributing a dominant 67.03% to the total variance explained by the first principal component (Table 3). This suggests that the size of land parcels (Figure 6A) plays a critical role in forming LULC dynamics, influencing land management decisions and suitability for various land uses. The size of land parcels determine their suitability for various uses. Larger areas targeted for extensive agricultural projects or large-scale developments, while smaller parcels are more prone to fragmentation or specific land-use. Following this, corridors between broad-leaved and coniferous forest (Figure 6B), with a contribution of 4.07%, highlights the importance of ecological corridors in maintaining connectivity and biodiversity. Corridors between coniferous and mixed forests and between coniferous and transitional woodland-shrubs also play notable roles, contributing 3.59% and 3.29%, respectively, indicating the ecological significance of these corridors in driving changes. Ecological corridors, especially those dominated by broadleaf and coniferous species, facilitate species movement and genetic exchange. The presence and quality of these corridors affect land-use decisions, such as forest conservation efforts or the development of infrastructure that disrupt these pathways. Similarly, distance to protected areas contributes 3.70%, highlighting the spatial impact of proximity to conservation zones on land-use practices. Proximity to protected areas dictates land management practices. Areas closer to protected zones experience stricter land-use regulations, limiting certain developments, while areas farther away are more susceptible to agricultural expansion or urbanization.
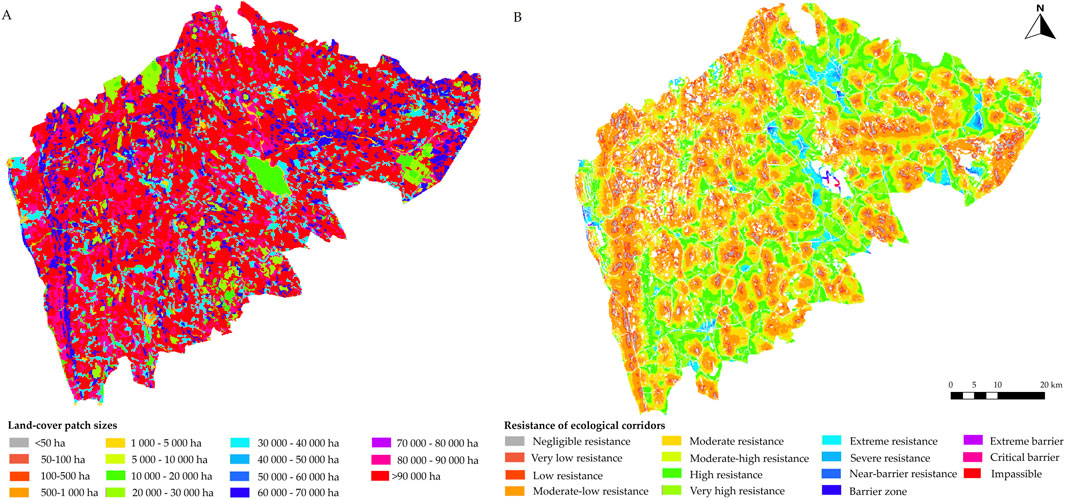
Figure 6. (A) Land-use and land-cover patch sizes in 2018 and (B) ecological corridors between broad-leaved and coniferous forests.
Under the BAU scenario (Figures 7A, B), historical LULC trends continue, with moderate urban expansion and agricultural intensification by 2046. Discontinuous urban fabric increases to 0.94%, while non-irrigated arable (Figure 8A) land grows to 22.31%. Forest cover continues to decline, with broad-leaved forests (Figure 8B) contracting to 12.86% (Table 4). Statistical analysis shows a Chi-square value of 23,618,140.0000 (p < 0.0001) and Cramer’s V = 0.9120, confirming significant but less cohesive changes than in more conservation-oriented scenarios.
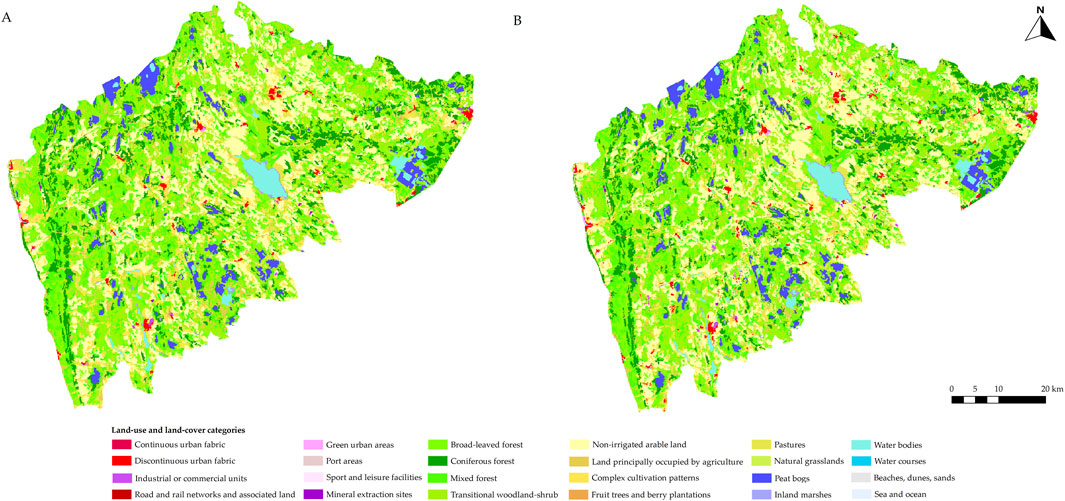
Figure 7. Land-use and land-cover distribution in (A) 2018 and (B) 2046 under the business-as-usual scenario, illustrating changes over time.
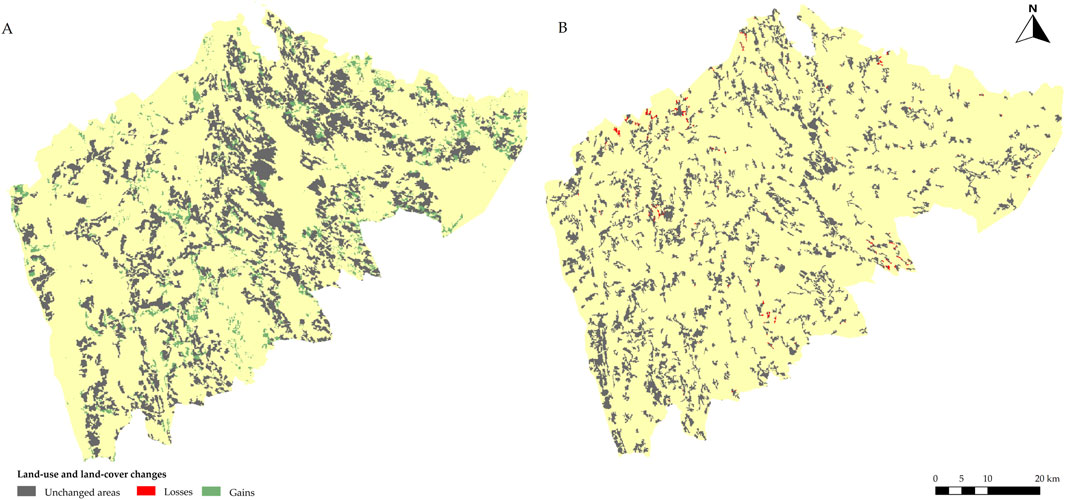
Figure 8. (A) Areas of non-irrigated arable land in 2018 (gray) with gains by 2046 highlighted in green. (B) Broad-leaved forest losses by 2046 (red) compared to 2018, with unchanged areas depicted in dark gray. Gray represents areas existing in 2018, and red or green indicate changes by 2046 according to business-as-usual scenario.
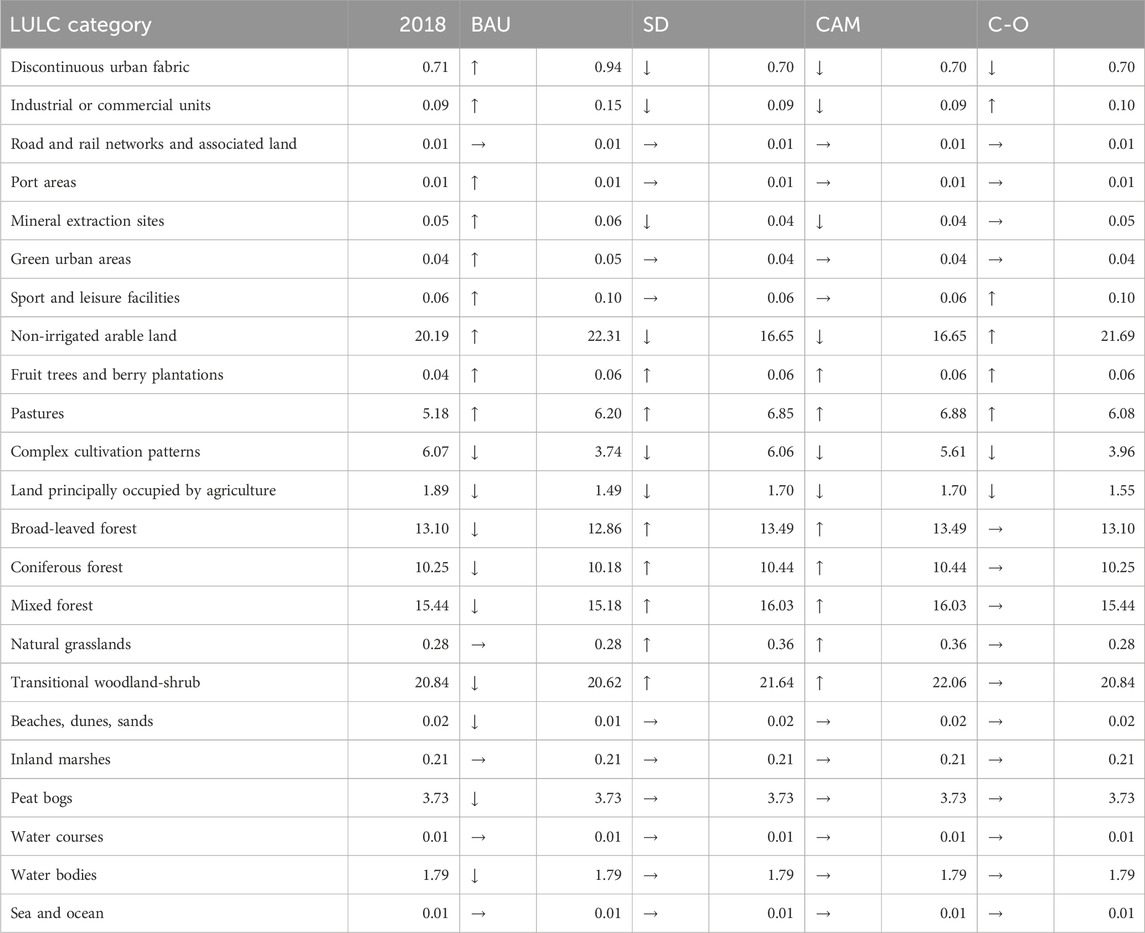
Table 4. Projected land-use and land-cover distribution (% of the total area, ↓ - decrease, ↑ - increase, → no change).
Persistence rates under BAU increase to 26.51%, suggesting stabilizing trends in urban and agricultural categories. However, swap changes highlight dynamic changes, particularly between non-irrigated arable land and pastures, which demonstrate significant exchanges driven by land-use intensification. Legally, only 26 of the 73 observed transitions fully comply with NVBR regulations, showing potential conflicts with conservation objectives. The BAU scenario also shows minimal alignment with the EU 2030 Biodiversity Strategy (European Commission, 2025), emphasizing anthropogenic expansion over restoration.
The SD scenario (Figures 9A, B) emphasizes balanced land-use and ecological restoration. By 2046, non-irrigated arable land decreases to 16.65% (Figure 10A), while pastures expand to 6.85%. Forest recovery is notable, with broad-leaved forests increasing to 13.49% (Figure 10B; Table 4). The Chi-square value (26,725,324.0000, p < 0.0001) and high Cramer’s V (0.9702) indicate strongly cohesive land-use changes aligned with sustainability goals.
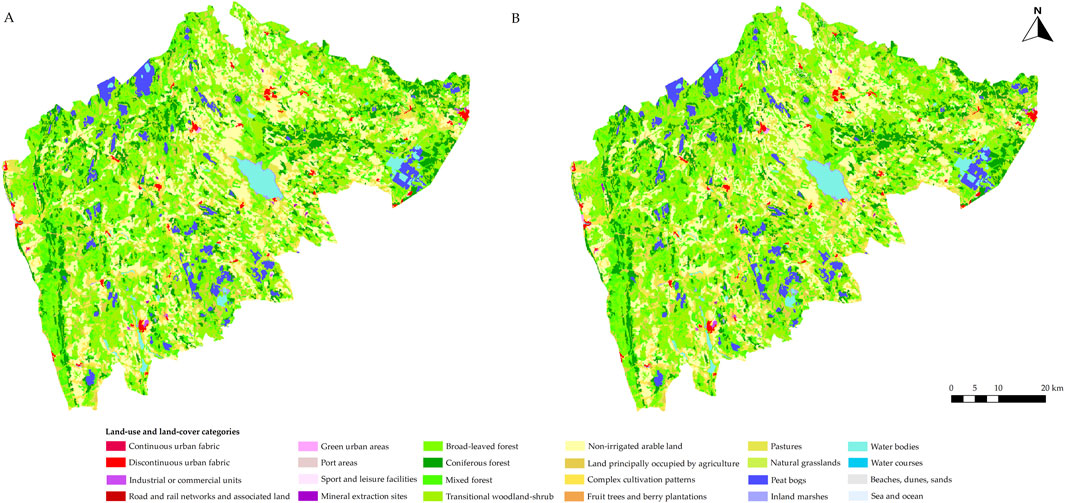
Figure 9. Land-use and land-cover distribution in (A) 2018 and (B) 2046 under the sustainable development scenario, illustrating changes over time.
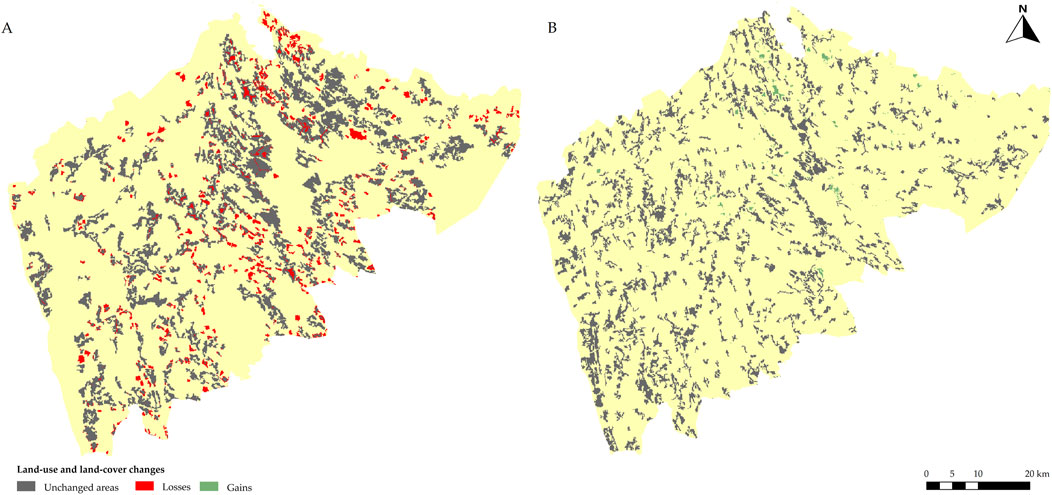
Figure 10. (A) Areas of non-irrigated arable land in 2018 (gray) with losses by 2046 highlighted in red. (B) Broad-leaved forest gains by 2046 (green) compared to 2018, with unchanged areas depicted in dark gray. Gray represents areas existing in 2018, and red or green indicate changes by 2046 according to the sustainable development scenario.
Persistence rates reach 22.39%, suggesting the scenario’s focus on stability and biodiversity enhancement. No swap changes appear under SD, indicating controlled, unidirectional transitions aligned with conservation goals. Legal compliance is higher than BAU, as prohibited transitions involving wetlands or sensitive habitats are minimized. This scenario aligns well with the EU 2030 Biodiversity Strategy (European Commission, 2025) by integrating restoration and sustainable resource management.
The CAM scenario (Figures 11A, B) prioritizes resilience and carbon sequestration. Forest recovery accelerates, with mixed forests (Figure 12A) reaching 16.03% by 2046. Pastures expanded to 6.88%, while non-irrigated arable land (Figure 12B) declines to 16.65% (Table 4). Statistical analysis yields a Chi-square value of 26, 486, 284.0000 (p < 0.0001) and a Cramer’s V of 0.9658, indicating a highly structured transition focused on climate resilience.
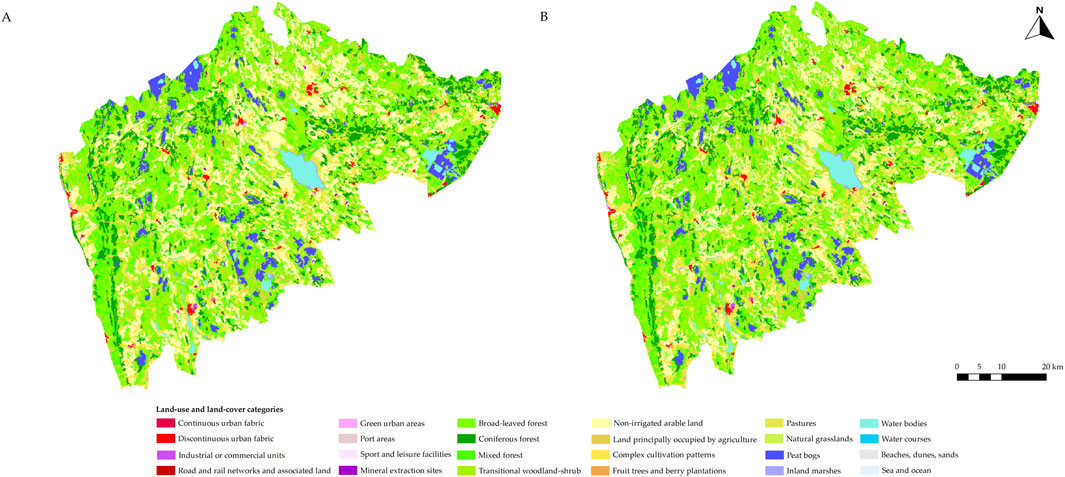
Figure 11. Land-use and land-cover distribution in (A) 2018 and (B) 2046 under the climate adaptation and mitigation scenario, illustrating changes over time.
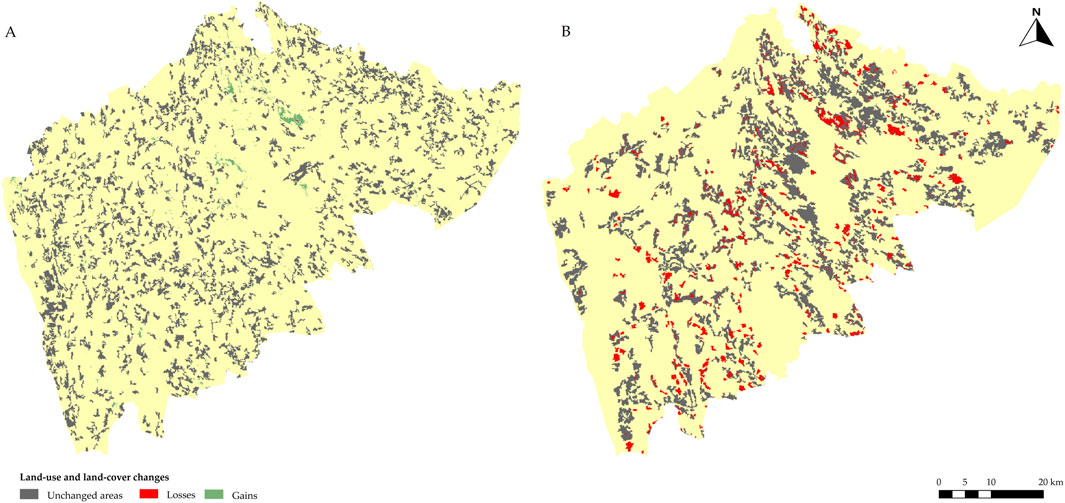
Figure 12. (A) Areas of mixed forests in 2018 (gray) with gains by 2046 highlighted in green. (B) Non-irrigated arable land losses by 2046 (red) compared to 2018, with unchanged areas depicted in dark gray. Gray represents areas existing in 2018, and red or green indicate changes by 2046 according to climate adaptation and mitigation scenario.
The persistence rate under CAM is 21.97%, with no significant swap changes, reflecting the scenario’s focus on structured transitions and ecological restoration. Most changes, such as wetland expansion and afforestation, comply with NVBR’s legal framework, boosting alignment with climate directives and the EU 2030 Biodiversity Strategy. This scenario demonstrates how targeted reforestation and wetland recovery can increase carbon storage and ecosystem stability.
The C-O scenario (Figures 13A, B) focuses on maintaining existing ecosystems with limited human interventions. Non-irrigated arable land (Figure 14A) increases to 21.69%, while complex cultivation patterns (Figure 14B) decline to 3.96% (Table 4). The Chi-square value (25,042,214.0000, p < 0.0001) and Cramer’s V (0.9391) reveal significant but slightly less cohesive changes than the SD or CAM scenarios, indicating a steadier, less transformative approach.

Figure 13. Land-use and land-cover distribution in (A) 2018 and (B) 2046 under the conservation-oriented scenario, illustrating changes over time.
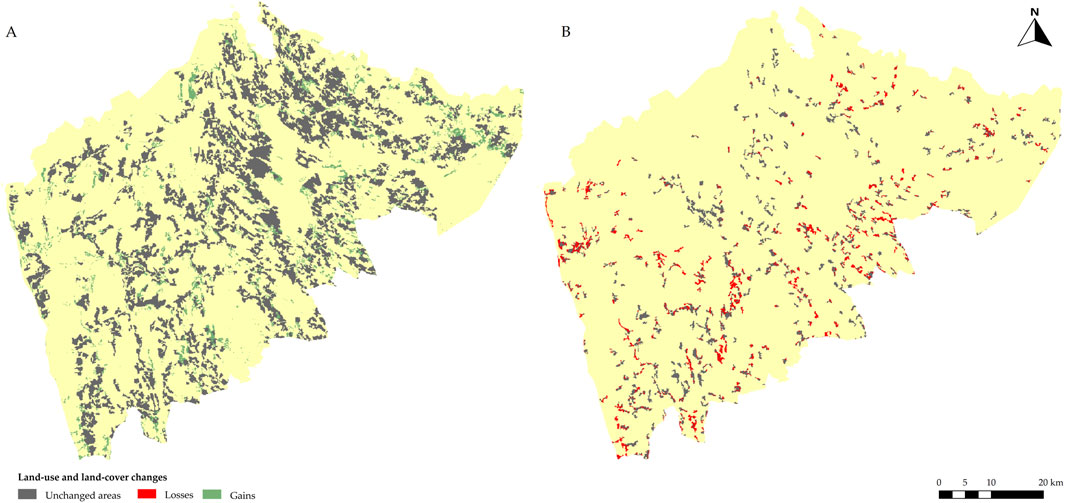
Figure 14. (A) Areas of non-irrigated arable land in 2018 (gray) with gains by 2046 highlighted in green. (B) Complex cultivation patterns losses by 2046 (red) compared to 2018, with unchanged areas depicted in dark gray. Gray represents areas existing in 2018, and red or green indicate changes by 2046 according to conservation-oriented scenario.
Persistence rates reach 24.71% (marginally below BAU) but emphasize stability in critical land-use categories (e.g., essential infrastructure and agricultural areas). Controlled bidirectional transitions (swap changes) appear in limited domains, such as discontinuous urban fabric ↔ industrial units, suggesting adaptive reuse and minimized expansion. Although this scenario effectively limits high-impact development, its less proactive restoration efforts only partially align with the EU 2030 Biodiversity Strategy. Compliance with NVBR regulations is high where new development is restricted, though certain agricultural expansions may require conditional approvals.
Since future projections cannot be directly validated against reality, the validation process focused on assessing the historical accuracy of the model before applying it to future scenarios. Hence, future validation was assessed indirectly (e.g., checking simulated future patterns against expected ecological trajectories). The accuracy of LULC classifications was evaluated using the KIA, which measures the level of agreement between modeled and observed land cover for past time periods. The MLP model was trained on historical land-use transitions for the periods 1990–2000, 2000–2006, 2006–2012, and 2012–2018, and was subsequently used to predict land cover for 2000, 2006, 2012, and 2018. These predicted LULC maps were then compared with observed historical land cover to assess the model’s performance.
The overall KIA values indicate strong classification accuracy, ranging from 0.83 (1990) to 0.98 (2006), suggesting high consistency across most LULC categories. Categories such as road networks, water bodies, and urban areas exhibited KIA values near 1.0, indicating minimal misclassification. Conversely, transitional woodland-shrub and industrial units showed moderate agreement (KIA = 0.53–0.76), reflecting the inherent variability in these categories due to changing land-use policies and economic activities. The lower KIA values observed in earlier periods can be attributed to higher variability in land-use transitions, particularly following post-Soviet land reforms, as well as the lower resolution of LULC classifications available at the time. The improvement in satellite-based LULC mapping in later years (2006–2018) resulted in greater consistency, contributing to higher validation scores in more recent periods.
Additional validation methods were applied to assess the statistical robustness of the LULC modeling framework. The Mann-Kendall trend analysis was conducted to evaluate long-term changes in LULC categories. Statistically significant trends were observed for forest cover decline (Z = −2.20, p = 0.03) and the expansion of transitional woodland-shrub (Z = 2.20, p = 0.03). Other categories, such as pastures and water bodies, exhibited modest upward trends, but these were not statistically significant. The results of the Chi-square test further confirmed significant differences in LULC distributions between time periods, with high Cramer’s V values (0.7166–0.9829) indicating strong associations among land categories.
The MLP model validation was performed using Root Mean Square Error (RMSE) and accuracy metrics. The training RMSE was 0.2223, while the testing RMSE was 0.2327, with an overall model accuracy of 85.67%. The skill measure (0.8209) demonstrated a high level of predictive reliability. The sensitivity analysis revealed that LULC clusters, drainage basins, and proximity to micro-reserves were among the most influential variables affecting transition probabilities, whereas relative richness and normalized entropy had minimal impact.
Finally, the transition probability validation in the CA-Markov model confirmed that simulated transitions closely matched observed land cover trends. Hard and soft predictions for the 2046 LULC maps were evaluated using intermediate transition stages, ensuring that the projected land-use dynamics followed historically validated patterns. The exclusion of rare transitions (<0.1% of the total dataset) reduced classification noise and improved model generalization.
The validation process demonstrates that the LULC model produces highly reliable predictions, with strong classification accuracy, robust statistical validation, and spatial consistency. The results confirm that the scenario-based LULC projections for 2046 provide a realistic and policy-compliant representation of potential land-use changes in the NVBR.
The historical period analyzed by Tērauds et al. (2008) highlights substantial forest recovery and the reduction of agricultural land from 1930 to 2002 (Tērauds et al., 2008). During this time, forest cover increased from 31.6% to 48.6%, driven by widespread farmland abandonment and natural succession. This trend suggests socio-economic shifts, such as rural depopulation and reduced agricultural activity, particularly in marginal areas. By contrast, the results of the present study, which focus on 1990 to 2018, indicate a plateau and a decline in forest cover (e.g., broad-leaved forests declining to 13.10% by 2018). These trends represent a change from earlier phases of forest recovery to a more stabilized landscape, where forests face competing pressures from urban growth and agricultural intensification.
Yet, an important distinction between the two studies lies in their spatial focus. The paper by Tērauds et al. (2008) examines LULC dynamics in the eastern part of the NVBR, an area characterized by varied landscape types, including drumlin fields, depressions, and hilly areas (Tērauds et al., 2008). In contrast, this study analyzes the NVBR as a whole, encompassing its entire area. Hence, this broader scope accounts for some differences in observed trends, as the western and central parts of the NVBR contribute additional dynamics not captured in the eastern-focused analysis.
For instance, urbanization trends differ markedly between the two analyses. Tērauds et al. (2008) note minimal urban impact, consistent with the socio-economic context of the earlier period (Tērauds et al., 2008). In contrast, this study observes significant urban expansion, with discontinuous urban fabric increasing. This variance highlights the growing impact of modern development pressures and socio-economic changes following Latvia’s independence and subsequent integration into the European Union.
Both studies utilize landscape metrics to assess LULC changes, but their findings diverge due to differing temporal dynamics and spatial focuses. Tērauds et al. (2008) report a decrease in forest patch numbers but an increase in patch size and interior habitat between 1930 and 2002, indicative of reduced fragmentation and ecological recovery (Tērauds et al., 2008). Conversely, this study identifies stable spatial clustering of LULC categories, with Moran’s I values declining only slightly, suggesting a persistent but gradually diversifying landscape. These patterns suggest the transition from historical recovery to modern pressures that balance fragmentation and connectivity.
At the same time, our findings on forest cover change in the NVBR are consistent with broader land cover trends observed across Latvia. Bāders et al. (2018) reported that forest cover increased by 1% nationally between 1990 and 2014, largely due to agricultural abandonment and afforestation (Baders et al., 2018). Similar dynamics are reflected in the NVBR, where conservation-driven EU land-use policies promote continued forest expansion.
Over nearly three decades, the NVBR experienced explicit urban expansion, changes toward sustainable agricultural practices, a net forest decline of approximately 2.78%, and substantial growth in transitional habitats (from 7.90% in 1990 to 20.84% in 2018). These trends align with global observations of LULC changes, emphasizing the interaction between urbanization, agricultural changes, and natural habitat transformations (Gomes et al., 2021). The observed changes suggest a balance between ecological resilience and anthropogenic pressures, with the area maintaining spatial cohesion—evidenced by high Cramer’s V values (e.g., 0.9829 by 2012–2018)—while adapting to advancing dynamics. Mann-Kendall tests further showed significant declines in forest categories (Z = −2.20, p = 0.03) and expansions in transitional woodland-shrub (Z = 2.20, p = 0.03). These results highlight zones requiring targeted conservation efforts while emphasizing the NVBR’s resilience under current management practices.
LULC changes between 1990 and 2018 primarily affected agricultural, semi-natural, and urban categories (Table 2). Legal compliance checks showed that 26 of the 73 observed changes fully adhered to NVBR regulations, whereas several forest-to-agriculture or wetland-to-urban conversions conflicted with conservation mandates. The intensification and extensification cycles in agriculture (Caraveli, 2000) were particularly notable, evidenced by changes from non-irrigated arable land to pastures and vice versa. These cycles suggest interactions between land management practices and climatic factors, including changes in precipitation patterns and temperature, which affect agricultural viability and decision-making (Olesen and Bindi, 2002). Similar trends have been observed across Europe, where policy reforms, market dynamics, and agri-environmental measures drive land-use exchanges (Plieninger and Bieling, 2013). These dynamics underline the importance of adaptive management strategies that account for changing economic incentives and farmer decision-making processes.
The expansion of transitional woodland-shrub, which occupied 20.84% of the NVBR by 2018, mirrors patterns seen in post-agricultural landscapes across Europe. Marginal farmlands often revert to secondary vegetation, improving biodiversity and carbon sequestration but sometimes posing challenges when woody encroachment threatens open habitats of conservation value (Holl and Aide, 2011). Strategic management approaches that balance natural regeneration with targeted conservation of open habitats could help maintain habitat diversity and ecological resilience (Navarro and Pereira, 2012). Controlled urbanization in the NVBR contrasts with unregulated urban sprawl observed in many global biodiversity hotspots (Seto et al., 2012). The limited expansion of urban areas, coupled with low industrial changeability, suggests that zoning regulations and conservation efforts have been effective, although localized industrial and extractive activities raise concerns about habitat fragmentation and water quality. Continuous monitoring, combined with strong environmental impact assessments, will be critical to addressing these potential issues.
The results also show areas where land-use changes conflict with the NVBR’s conservation objectives, such as some prohibited conversions from forest to mineral extraction sites. Similar challenges have been documented in other protected areas where weak enforcement and unsustainable resource exploitation compromise ecological integrity (Jones et al., 2018). Strengthening governance, increasing stakeholder engagement, and providing financial incentives could reduce undesirable LULC changes and better align land-use practices with conservation priorities. Despite these challenges, the NVBR demonstrates overall resilience, supported by effective management practices and legal frameworks. However, continued forest decline, even at a relatively slow rate, remains a concern given the ecological and cultural importance of mature forests (Lindenmayer and Franklin, 2010). The observed agricultural abandonment offers opportunities for habitat restoration if strategically managed (Lasanta et al., 2015; Poyatos et al., 2003; Van Der Zanden et al., 2017). These results collectively stress the importance of further integrating the NVBR’s legal framework with adaptive land management to preserve long-term biodiversity and ecosystem services.
Results on driving forces align with global studies highlighting area size, ecological corridors, and proximity to protected areas as key factors influencing LULC changes. Research on land use near protected areas suggests that human activities can reduce their effective size, compromising biodiversity conservation (DeFries et al., 2007). Furthermore, studies assessing the role of protected areas in land-use change dynamics have found that proximity to these zones can limit certain types of development while promoting conservation-compatible land-use, affecting overall landscape dynamics (Schmitz et al., 2023).
Essentially, the historical land-use trends observed in the NVBR align with broader European patterns of forest recovery followed by stabilization and localized declines. Similar changes have been documented in the Carpathian Mountains, where afforestation dominated post-agricultural landscapes until recent years, when pressures from urbanization and agricultural expansion altered these dynamics (Munteanu et al., 2014). Likewise, studies in Scandinavian boreal forests have shown that initial forest gains following rural depopulation have slowed due to competing land-use pressures (Kuemmerle et al., 2016). These findings reinforce the idea that while long-term afforestation trends have been a dominant force in European landscapes, contemporary socio-economic changes are changing land-use priorities.
However, certain aspects of the NVBR’s trajectory diverge from these broader trends. Unlike the large-scale afforestation observed in some post-socialist landscapes, the NVBR’s forest decline suggests that conservation policies alone are insufficient to counteract urban and agricultural pressures. This is consistent with findings by Plieninger and Bieling (2013), who reported that while EU agricultural policies promote afforestation, localized land management decisions and economic drivers still dictate land-use outcomes (Plieninger and Bieling, 2013). Additionally, urban expansion in the NVBR, as reflected in the increase in discontinuous urban fabric, aligns with trends in other protected landscapes across Europe, where urban pressures gradually encroach on conservation zones despite regulatory frameworks (Seto et al., 2012).
These changes indicate that while the NVBR maintains overall ecological resilience, targeted interventions are needed to prevent further forest fragmentation. This is particularly important given the role of transitional woodland-shrub expansion, which mirrors findings from Mediterranean and Central European landscapes where post-agricultural succession leads to secondary vegetation growth, affecting both biodiversity and ecosystem services (Navarro and Pereira, 2012).
Tesfaw et al. (2018) highlighted that protected areas frequently experience legal downgrading, downsizing, or de-gazettement, particularly when economic pressures outweigh conservation benefits (Tesfaw et al., 2018). Their study found that ineffective protected areas, where deforestation rates matched those of surrounding lands, were more likely to lose protection. This finding underlines the importance of integrating policy-driven land-use modeling, as different governance scenarios can change future conservation outcomes. Meanwhile, DeFries et al. (2007) proposed a ‘small loss–big gain’ approach, where strategic land-use restrictions outside protected areas can yield significant biodiversity benefits (DeFries et al., 2007). Staccione et al. (2023) similarly found that while an expanded and better-connected protected area network enhances conservation, land-use intensification often occurs outside the network due to compensatory shifts in resource extraction (Staccione et al., 2023). Their findings highlight the necessity of planning not only for protected areas but also for the surrounding land system, ensuring that conservation efforts are not undermined by external pressures. In the SD and C-O scenarios, targeted afforestation and land management policies improved ecosystem connectivity while maintaining agricultural viability. This underlines the need for integrated regional land-use planning to improve long-term conservation effectiveness.
The BAU scenario projects moderate urban expansion, with discontinuous urban fabric increasing from 0.71% in 2018 to 0.94% by 2046, and industrial/commercial units growing slightly from 0.09% to 0.15%. These changes are consistent with historical trends in protected landscapes, where population pressures and economic growth drive limited urban development (Angel et al., 2011). Agricultural intensification dominates, with non-irrigated arable land expanding from 20.19% to 22.31%, while complex cultivation patterns and land occupied by agriculture with natural vegetation decline sharply. These changes indicate a narrowing of agricultural diversity, favoring high-intensity practices over multifunctional systems (Rounsevell and Reay, 2009). Forest cover continues to decline, with broad-leaved forest reducing to 12.86%, coniferous forest to 10.18%, and mixed forest to 15.18%. This trend shows ongoing anthropogenic pressures and mirrors global patterns of deforestation (Curtis et al., 2018).
Statistical analysis produced a Chi-square value of 23,618,140.0000 (p < 0.0001) and a Cramer’s V of 0.9120, suggesting significant but less cohesive changes compared to more conservation-oriented scenarios. Persistence under BAU increases to 26.51% of the NVBR, indicating stability in urban and infrastructure categories (often >99% persistence). However, swap changes between non-irrigated arable land and pastures remain high, implying ongoing cycles of intensification and extensification. Policy alignment with the EU 2030 Biodiversity Strategy is limited, as this scenario emphasizes anthropogenic expansion over restoration, suggesting a need for more robust conservation measures.
The scenario modeling results indicate that strong conservation policies help maintain forest cover and biodiversity within protected areas, whereas weaker policies can lead to increased land-use pressures. This aligns with findings by Tesfaw et al. (2018), who demonstrated that protected areas with lower conservation effectiveness are more vulnerable to policy downgrades or removals (Tesfaw et al., 2018). Their study suggests that governance and enforcement directly impact the sustainability of protected areas, reinforcing the need for long-term policy planning.
The SD scenario presents a transformative approach to LULC management, balancing ecological restoration, sustainable resource use, and human wellbeing. This approach is consistent with recent European land-use strategies, which integrate ecological restoration with socio-economic viability. Studies on reforestation policies in Germany and France have demonstrated that policy-driven afforestation can enhance carbon sequestration, biodiversity, and rural economies when coupled with incentives for sustainable land management (Haseeb et al., 2024). Urban growth is minimized, with discontinuous urban fabric declining slightly to 0.70%, while non-irrigated arable land decreases significantly to 16.65%, and pastures expand to 6.85%. Forest recovery (Haseeb et al., 2024) is a defining feature, with broad-leaved forest increasing to 13.49% and mixed forest to 16.03%. These changes align with reforestation initiatives observed in European protected areas (Curtis et al., 2018). Notably, the SD scenario exhibits no swap changes, displaying its focus on stability and purposeful land-use transitions. This suggests that active conservation management, rather than passive protection, is essential for achieving long-term forest stability.
A Chi-square value of 26,725,324.0000 (p < 0.0001) and Cramer’s V of 0.9702 underline strong internal coherence in LULC changes. Persistence reaches 22.39%, slightly lower than BAU but indicating more biodiversity-friendly transitions. Policy-wise, the SD scenario closely aligns with the EU 2030 Biodiversity Strategy (European Commission, 2025), promoting habitat restoration, controlled urban expansion, and sustainable agricultural practices. Legal compliance is also higher than BAU, as fewer changes conflict with NVBR regulations. Overall, the SD scenario offers a compelling framework for reconciling ecological resilience with socio-economic goals.
The SD scenario’s conservation policies help mitigate biodiversity loss within protected areas, though external pressures like agricultural expansion and urbanization remain challenges. For instance, Newbold (2018) found that land-use change, and climate pressures act together to change vertebrate communities, with the most severe losses occurring under high-emission, high-development scenarios (RCP 8.5) (Newbold, 2018). These findings highlight the importance of integrating conservation strategies that address both direct land-use changes and broader climatic influences, ensuring the long-term stability of protected areas.
Like the SD scenario, the CAM scenario prioritizes climate adaptation and mitigation through carbon sequestration and targeted ecological restoration. It serves as a model for leveraging LULC transitions for climate resilience, with afforestation and wetland recovery as key strategies. This approach aligns with studies demonstrating that land-use interventions can mitigate climate impacts by improving carbon storage and hydrological regulation (Newbold, 2018). Forest recovery accelerates, with mixed forests expanding to 16.03% and transitional woodland-shrub growing to 22.06%. The CAM scenario’s projected expansion of transitional woodland-shrub (22.06%) reflects trends observed in Portugal and Spain, where ecological restoration efforts have resulted in secondary woodland expansion in post-agricultural landscapes (Lasanta et al., 2015). However, as noted in previous studies, excessive woody encroachment can conflict with conservation objectives by reducing open habitat availability (Holl and Aide, 2011). Therefore, adaptive management strategies that balance natural regeneration with habitat-specific conservation are crucial. Still, these outcomes align closely with global strategies for improving ecosystem resilience and biodiversity conservation. Persistence under CAM reaches 21.97%, suggesting stability within urban and agricultural categories while accommodating targeted ecological changes. No swap changes occur, underlining the scenario’s structured approach to land-use management.
Statistical analysis yields a Chi-square value of 26,486,284.0000 (p < 0.0001) and a Cramer’s V of 0.9658, demonstrating a highly cohesive landscape. Compared to BAU, CAM achieves stronger alignment with both NVBR regulations and the EU 2030 Biodiversity Strategy, emphasizing reforestation, wetland recovery, and reduced anthropogenic pressures. This scenario provides a model for leveraging carbon sequestration and biodiversity gains in a protected setting.
The C-O scenario focuses on preserving existing ecosystems, with minimal urban growth and stable forest cover. Non-irrigated arable land and pastures increase modestly, indicating the persistence of traditional agricultural practices. While C-O achieves high stability in urban and infrastructure categories, its limited restoration efforts contrast with the proactive approaches of SD and CAM. This shortfall stresses the need to integrate conservation priorities with adaptive strategies to improve biodiversity and ecosystem resilience. While it minimizes anthropogenic fragmentation and aligns with EU biodiversity policies, its focus on passive conservation rather than active land management may limit long-term ecological resilience. Similar concerns have been raised in studies on conservation policy effectiveness in Eastern Europe, where static protection measures have sometimes failed to prevent habitat degradation due to surrounding land-use pressures (Jiang and Yu, 2019).
A Chi-square value of 25,042,214.0000 (p < 0.0001) and Cramer’s V of 0.9391 confirm that C-O fosters significant yet less cohesive changes than SD or CAM. Persistence reaches 24.71%, offering moderate stability. Some bidirectional transitions (swap changes) occur between discontinuous urban fabric and industrial/commercial units, and between pastures and non-irrigated arable land. Although these changes are more controlled than in BAU, the CO scenario’s minimal focus on reforestation or wetland restoration limits full alignment with the EU 2030 Biodiversity Strategy. Nonetheless, C-O surpasses BAU in minimizing anthropogenic fragmentation and conflicts with the NVBR’s legal framework.
Scenario-based projections suggest continued forest expansion under C-O and SD scenarios, aligning with historical land-use changes in Latvia. Bell et al. (2009) found that during the Soviet era, large-scale land-use restructuring, followed by post-1991 agricultural abandonment, significantly increased forest cover. Bell et al. (2009) found that large-scale land-use restructuring during the Soviet era, followed by agricultural abandonment in the post-1991 period, led to a significant increase in forest cover (Bell et al., 2009). This supports findings that policy-driven conservation efforts and socio-economic conditions play a crucial role in changing Latvia’s future landscape.
Across all four scenarios (Table 4), statistical results (Chi-square, Cramer’s V) and legal compliance checks confirm significant yet varied trajectories for the NVBR. BAU preserves historical trends but lags in biodiversity protection, SD and CAM offer structured and sustainability-focused pathways, and C-O takes a conservative stance prioritizing stability over proactive restoration. Scenarios emphasizing reforestation, sustainable agriculture, and climate resilience (SD, CAM) align more closely with the EU 2030 Biodiversity Strategy, while C-O and BAU highlight either insufficient restoration or unmanaged intensification. These results stress the importance of targeted management and legal enforcement to balance conservation, climate adaptation, and socio-economic objectives in biosphere reserves like the NVBR.
The results suggest that stricter conservation policies reduce land-use pressures within protected areas, but surrounding landscapes may still face increased agricultural expansion and urban development. This aligns with Jiang and Yu (2019), who found that while protected areas globally have helped mitigate land-use intensity, many still experience increased human activity in their buffer zones (Jiang and Yu, 2019). These findings suggest that effective long-term conservation in biosphere reserves requires integrated land-use planning beyond protected area boundaries. In this context, Guerra et al. (2019) found that while protected areas globally show lower land cover change rates, surrounding landscapes often experience intensified land-use pressures, leading to potential spillover effects (Guerra et al., 2019).
The results of this study reinforce the critical role of policy alignment in shaping LULC outcomes. Protected areas are not immune to external pressures, and land-use spillover effects can undermine conservation objectives if surrounding landscapes are not managed effectively. This is evident in other studies on biosphere reserves, where fragmentation and land-use intensification in buffer zones have been found to reduce the effectiveness of core conservation areas (DeFries et al., 2007).
Scenario modeling provides valuable insights into how different policy pathways can influence conservation success. The comparison between BAU and SD scenarios highlights that without active intervention, protected areas may gradually experience land degradation despite their formal designation. The SD and CAM scenarios demonstrate that integrated landscape planning can create synergistic benefits for conservation, climate adaptation, and rural livelihoods. This is particularly relevant in the context of European policy frameworks, where recent directives emphasize multifunctional landscapes as a strategy to balance conservation with economic development.
Future research should explore the socio-economic drivers behind observed LULC changes, particularly the role of agricultural subsidies, land ownership policies, and demographic trends. Additionally, further refinement of scenario modeling methods could enhance predictive accuracy by integrating agent-based modeling approaches that simulate individual land-use decisions within broader socio-economic contexts (Rounsevell and Reay, 2009). Future research should integrate additional ecosystem services, such as carbon sequestration and water retention, to enhance the applicability of LULC models for conservation planning. This approach would provide a more holistic framework for sustainable land management in biosphere reserves.
Historically, the NVBR demonstrated substantial stability in LULC over nearly three decades, suggesting the effectiveness of protected area management, conservation policies, and zoning regulations. Key changes, between 1990 and 2018, included cycles of agricultural intensification and extensification, the expansion of transitional woodland-shrub to 20.84% of the total area by 2018, and controlled urban growth. While these trends highlight the resilience of the NVBR, challenges such as gradual forest decline and localized industrial pressures require targeted management interventions.
Statistical analysis revealed that socio-economic pressures and ecological processes drive LULC changes in the NVBR. Land patch size, ecological corridors, and connectivity emerged as critical drivers, highlighting the need for integrated land management strategies. Most changes complied with the NVBR’s legal framework, suggesting effective governance. However, non-compliant changes, such as forest-to-agriculture changes, emphasize the need to strengthen enforcement and engage local communities to improve conservation outcomes.
Scenario-based projections indicate diverse trajectories for the NVBR, with substantial implications for ecological and socio-economic outcomes. The BAU scenario predicts continued agricultural intensification and moderate urban expansion, risking habitat fragmentation and limited ecological restoration. In contrast, the SD and CAM scenarios prioritize ecological restoration, biodiversity improvement, and climate resilience. These scenarios project substantial forest recovery, reduced agricultural intensification, and improved ecosystem connectivity, aligning with the EU 2030 Biodiversity Strategy. The C-O scenario focuses on stabilization and reducing anthropogenic pressures but lacks proactive restoration efforts, limiting its potential to address biodiversity and climate adaptation goals.
Persistence analysis shows that critical LULC categories, such as infrastructure, hydrological features, and specialized agricultural systems, remain stable across all scenarios. However, the BAU scenario, while demonstrating the highest overall persistence, emphasizes intensification over ecological restoration. The SD and CAM scenarios offer more dynamic changes toward sustainability, emphasizing reforestation and habitat recovery. The C-O scenario preserves stability but lacks the proactive measures needed for significant ecological and climate benefits.
Future management efforts should prioritize protecting mature forests, balancing natural succession in transitional habitats with habitat conservation, and strengthening compliance with conservation policies. Scenarios such as SD and CAM provide actionable pathways for integrating ecological restoration with sustainable land-use practices, serving as effective models for protected area management. Expanding stakeholder engagement, improving adaptive management, and improving monitoring frameworks will be essential to achieving long-term conservation and sustainability goals in the NVBR. These results contribute to broader discussions on LULC modeling and management in biosphere reserves, offering valuable insights for balancing socio-economic development with ecological preservation in protected areas.
The raw data supporting the conclusions of this article will be made available by the authors, without undue reservation.
JK: Conceptualization, Formal Analysis, Investigation, Methodology, Resources, Software, Validation, Visualization, Writing – original draft, Writing – review and editing. MK: Conceptualization, Data curation, Funding acquisition, Project administration, Supervision, Visualization, Writing – original draft, Writing – review and editing.
The author(s) declare that financial support was received for the research and/or publication of this article. This research was funded by the Horizon Europe project ‘Towards Sustainable Land-use Strategies in the Context of Climate Change and Biodiversity Challenges in Europe’ (Grant Agreement No: 101081307) and institutional support (base funding) ‘Attraction of human resources for the development of scientific research in earth and environmental sciences (Sustainable use of natural resources in the context of climate change)’.
The authors declare that the research was conducted in the absence of any commercial or financial relationships that could be construed as a potential conflict of interest.
The author(s) declare that no Generative AI was used in the creation of this manuscript.
All claims expressed in this article are solely those of the authors and do not necessarily represent those of their affiliated organizations, or those of the publisher, the editors and the reviewers. Any product that may be evaluated in this article, or claim that may be made by its manufacturer, is not guaranteed or endorsed by the publisher.
Allan, A., Soltani, A., Abdi, M. H., and Zarei, M. (2022). Driving forces behind land use and land cover change: a systematic and bibliometric review. Land 11, 1222. doi:10.3390/land11081222
Angel, S., Parent, J., Civco, D. L., Blei, A., and Potere, D. (2011). The dimensions of global urban expansion: estimates and projections for all countries, 2000–2050. Prog. Plan. 75, 53–107. doi:10.1016/j.progress.2011.04.001
Baders, E., Zarins, J., Krisans, O., Jansons, A., and Jansons, J. (2018). Recent land cover changes in Latvia. Res. Rural. Dev. 1, 34–39. doi:10.22616/RRD.24.2018.005
Balicki, J. (2014). “Advances in applied and pure mathematics: proceedings of the 2nd international conference on mathematical, computational and statistical sciences (MCSS ’14),” in Proceedings of the 7th international conference on finite differences, finite elements, finite volumes, boundary elements (F-and-B ’14), Gdansk, Poland, 15–17 May, 2014 (Greece: WSEAS).
Batisse, M. (1997). Biosphere reserves: a challenge for biodiversity conservation and regional development. Environ. Sci. Policy Sustain. Dev. 39, 6–33. doi:10.1080/00139159709603644
Bell, S., Nikodemus, O., Penēze, Z., and Krūze, I. (2009). Management of cultural landscapes: what does this mean in the former Soviet Union? A case study from Latvia. Landsc. Res. 34, 425–455. doi:10.1080/01426390903020328
Bridgewater, P. (2016). The Man and Biosphere programme of UNESCO: rambunctious child of the sixties, but was the promise fulfilled? Curr. Opin. Environ. Sustain. 19, 1–6. doi:10.1016/j.cosust.2015.08.009
Cabinet of Ministers (2008). Regulations regarding restriction of the distribution of invasive alien plant species. Available online at: https://likumi.lv/ta/en/en/id/177513-regulations-regarding-restriction-of-the-distribution-of-invasive-alien-plant-species (Accessed December 14, 2024).
Camacho Olmedo, M. T., and García-Álvarez, D. (2022). “Basic and multiple-resolution cross-tabulation to validate land use cover maps,” in Land use cover datasets and validation tools. Editors D. García-Álvarez, M. T. Camacho Olmedo, M. Paegelow, and J. F. Mas (Cham: Springer International Publishing), 99–125.
Cameron, D. R., Schloss, C. A., Theobald, D. M., and Morrison, S. A. (2022). A framework to select strategies for conserving and restoring habitat connectivity in complex landscapes. Conserv. Sci. Pract. 4, e12698. doi:10.1111/csp2.12698
Caraveli, H. (2000). A comparative analysis on intensification and extensification in mediterranean agriculture: dilemmas for LFAs policy. J. Rural. Stud. 16, 231–242. doi:10.1016/S0743-0167(99)00050-9
Carlsen, L., and Bruggemann, R. (2022). The 17 United Nations’ sustainable development goals: a status by 2020. Int. J. Sustain. Dev. World Ecol. 29, 219–229. doi:10.1080/13504509.2021.1948456
Carter, S., Herold, M., Rufino, M. C., Neumann, K., Kooistra, L., and Verchot, L. (2015). Mitigation of agricultural emissions in the tropics: comparing forest land-sparing options at the national level. Biogeosciences 12, 4809–4825. doi:10.5194/bg-12-4809-2015
Central Statistical Bureau (2024). Official statistics of Latvia. Available online at: https://stat.gov.lv/en (Accessed January 16, 2025).
Chandra, A., and Idrisova, A. (2011). Convention on Biological Diversity: a review of national challenges and opportunities for implementation. Biodivers. Conserv. 20, 3295–3316. doi:10.1007/s10531-011-0141-x
Chen, Q., Chen, H., Zhang, J., Hou, Y., Shen, M., Chen, J., et al. (2020). Impacts of climate change and LULC change on runoff in the Jinsha River Basin. J. Geogr. Sci. 30, 85–102. doi:10.1007/s11442-020-1716-9
Chughtai, A. H., Abbasi, H., and Karas, I. R. (2021). A review on change detection method and accuracy assessment for land use land cover. Remote Sens. Appl. Soc. Environ. 22, 100482. doi:10.1016/j.rsase.2021.100482
Clark University (2024). TerrSet geospatial monitoring and modeling software. Available online at: https://www.clarku.edu/centers/geospatial-analytics/terrset/(Accessed January 16, 2025).
Council of Europe (2025). Bern convention. Available online at: https://www.coe.int/en/web/bern-convention/home (Accessed March 1, 2025).
Council of the European Union (1992). Council directive 92/43/EEC of 21 may 1992 on the conservation of natural habitats and of wild fauna and flora. Available online at: https://environment.ec.europa.eu/topics/nature-and-biodiversity/habitats-directive_en (Accessed November 19, 2024).
Curtis, P. G., Slay, C. M., Harris, N. L., Tyukavina, A., and Hansen, M. C. (2018). Classifying drivers of global forest loss. Science 361, 1108–1111. doi:10.1126/science.aau3445
DeFries, R., Hansen, A., Turner, B. L., Reid, R., and Liu, J. (2007). Land use change around protected areas: management to balance human needs and ecological function. Ecol. Appl. 17, 1031–1038. doi:10.1890/05-1111
Devi, A. R., and Shimrah, T. (2023). Modeling LULC using Multi-Layer Perceptron Markov change (MLP-MC) and identifying local drivers of LULC in hilly district of Manipur, India. Environ. Sci. Pollut. Res. 30, 68450–68466. doi:10.1007/s11356-023-27153-4
Dubin, R. (2009). “Spatial weights,” in The SAGE handbook of spatial analysis (London England EC1Y 1SP United Kingdom: SAGE Publications, Ltd), 125–157.
Envirotech (2024). Open GIS data. Available online at: https://envirotech.maps.arcgis.com/home/user.html?user=Publicetajs_Envirotech (Accessed November 19, 2024).
European Commission (2024). Managing and protecting Natura 2000 sites. Available online at: https://environment.ec.europa.eu/topics/nature-and-biodiversity/natura-2000/managing-and-protecting-natura-2000-sites_en (Accessed November 19, 2024).
European Commission (2025). Biodiversity strategy for 2030. Available online at: https://environment.ec.europa.eu/strategy/biodiversity-strategy-2030_en (Accessed November 19, 2024).
European Environment Agency (2023). Natura 2000 viewer. Available online at: https://natura2000.eea.europa.eu/(Accessed November 19, 2024).
European Environment Agency (2024). Copernicus land monitoring service. Available online at: https://land.copernicus.eu/en/products/corine-land-cover (Accessed November 19, 2024).
European Union (2000). Directive 2000/60/EC of the European Parliament and of the Council of 23 October 2000 establishing a framework for Community action in the field of water policy. Official Journal of the European Communities, L 327, 1–73. https://eur-lex.europa.eu/legal-content/EN/ALL/?uri=CELEX:32000L0060
European Union (2008). Directive 2008/56/EC of the European Parliament and of the Council of 17 June 2008 establishing a framework for community action in the field of marine environmental policy (Marine Strategy Framework Directive) (Text with EEA relevance). Official Journal of the European Union, L 164, 19–40. https://eur-lex.europa.eu/eli/dir/2008/56/oj/eng
European Union (2009). Directive 2009/147/EC of the European parliament and of the Council of 30 november 2009 on the conservation of wild birds. Available online at: https://environment.ec.europa.eu/topics/nature-and-biodiversity/birds-directive_en (Accessed November 19, 2024).
European Union (2024). Regulation (EU) 2024/1991 of the European parliament and of the Council of 24 june 2024 on nature restoration and amending regulation (EU) 2022/869. Available online at: http://data.europa.eu/eli/reg/2024/1991/oj (Accessed November 19, 2024).
Fagan, W. F., Cantrell, R. S., and Cosner, C. (1999). How habitat edges change species interactions. Am. Nat. 153, 165–182. doi:10.1086/303162
Fonji, S. F., and Taff, G. N. (2014). Using satellite data to monitor land-use land-cover change in North-eastern Latvia. SpringerPlus 3, 61. doi:10.1186/2193-1801-3-61
Geldmann, J., Barnes, M., Coad, L., Craigie, I. D., Hockings, M., and Burgess, N. D. (2013). Effectiveness of terrestrial protected areas in reducing habitat loss and population declines. Biol. Conserv. 161, 230–238. doi:10.1016/j.biocon.2013.02.018
Gomes, E., Inácio, M., Bogdzevič, K., Kalinauskas, M., Karnauskaitė, D., and Pereira, P. (2021). Future land-use changes and its impacts on terrestrial ecosystem services: a review. Sci. Total Environ. 781, 146716. doi:10.1016/j.scitotenv.2021.146716
Guerra, C. A., Rosa, I. M. D., and Pereira, H. M. (2019). Change versus stability: are protected areas particularly pressured by global land cover change? Landsc. Ecol. 34, 2779–2790. doi:10.1007/s10980-019-00918-4
Hamad, R., Balzter, H., and Kolo, K. (2018). Predicting land use/land cover changes using a CA-markov model under two different scenarios. Sustainability 10, 3421. doi:10.3390/su10103421
Haseeb, M., Tahir, Z., Mehmood, S. A., Gill, S. A., Farooq, N., Butt, H., et al. (2024). Enhancing carbon sequestration through afforestation: evaluating the impact of land use and cover changes on carbon storage dynamics. Earth Syst. Environ. 8, 1563–1582. doi:10.1007/s41748-024-00414-z
Holl, K. D., and Aide, T. M. (2011). When and where to actively restore ecosystems? For. Ecol. Manag. 261, 1558–1563. doi:10.1016/j.foreco.2010.07.004
Jiang, L., and Yu, L. (2019). Analyzing land use intensity changes within and outside protected areas using ESA CCI-LC datasets. Glob. Ecol. Conserv. 20, e00789. doi:10.1016/j.gecco.2019.e00789
Jones, K. R., Venter, O., Fuller, R. A., Allan, J. R., Maxwell, S. L., Negret, P. J., et al. (2018). One-third of global protected land is under intense human pressure. Science 360, 788–791. doi:10.1126/science.aap9565
Kruse, R., Mostaghim, S., Borgelt, C., Braune, C., and Steinbrecher, M. (2022). Computational intelligence: a methodological introduction, texts in computer science. Cham: Springer International Publishing.
Kuemmerle, T., Levers, C., Erb, K., Estel, S., Jepsen, M., Müller, D., et al. (2016). Hotspots of land use change in Europe. Environ. Res. Lett. 11, 064020. doi:10.1088/1748-9326/11/6/064020
Kumar, V., and Agrawal, S. (2023). A multi-layer perceptron–Markov chain based LULC change analysis and prediction using remote sensing data in Prayagraj district, India. Environ. Monit. Assess. 195, 619. doi:10.1007/s10661-023-11205-w
Lasanta, T., Nadal-Romero, E., and Arnáez, J. (2015). Managing abandoned farmland to control the impact of re-vegetation on the environment. The state of the art in Europe. Environ. Sci. Policy 52, 99–109. doi:10.1016/j.envsci.2015.05.012
Latvian Environment, Geology, and Meteorology Centre (2024). Past and future climate change tool. Available online at: https://klimats.meteo.lv/klimats_latvija/klimata_riks/(Accessed November 19, 2024).
Latvia’s State Forests (2024). Latvia’s state forests. Available online at: https://data.gov.lv/dati/eng/organization/lvm (Accessed November 19, 2024).
Leverington, F., Costa, K. L., Pavese, H., Lisle, A., and Hockings, M. (2010). A global analysis of protected area management effectiveness. Environ. Manage. 46, 685–698. doi:10.1007/s00267-010-9564-5
Lindenmayer, D., and Franklin, J. F. (2010). Conserving forest biodiversity: a comprehensive multiscaled approach. Washington: Island Press.
Mallampalli, V. R., Mavrommati, G., Thompson, J., Duveneck, M., Meyer, S., Ligmann-Zielinska, A., et al. (2016). Methods for translating narrative scenarios into quantitative assessments of land use change. Environ. Model. Softw. 82, 7–20. doi:10.1016/j.envsoft.2016.04.011
Martín-Arias, V., Evans, C., Griffin, R., Cherrington, E. A., Lee, C. M., Mishra, D. R., et al. (2022). Modeled impacts of LULC and climate change predictions on the hydrologic regime in Belize. Front. Environ. Sci. 10, 848085. doi:10.3389/fenvs.2022.848085
Martínez-Vega, J., Díaz, A., Nava, J. M., Gallardo, M., and Echavarría, P. (2017). Assessing land use-cover changes and modelling change scenarios in two mountain Spanish national parks. Environments 4, 79. doi:10.3390/environments4040079
McDonald, R. I., and Urban, D. L. (2006). Edge effects on species composition and exotic species abundance in the North Carolina piedmont. Biol. Invasions 8, 1049–1060. doi:10.1007/s10530-005-5227-5
Ministry of Environmental Protection and Regional Development (1998). “Implementation of the ramsar convention in general, and of the ramsar strategic plan 1997-2002 in particular, during the period since the national report prepared,” in 1995 for ramsar COP6 and 30 june 1998 (Riga, Latvia: Ministry of Environmental Protection and Regional Development).
Mondal, Md.S., Sharma, N., Garg, P. K., and Kappas, M. (2016). Statistical independence test and validation of CA Markov land use land cover (LULC) prediction results. J. Remote Sens. Space Sci. 19, 259–272. doi:10.1016/j.ejrs.2016.08.001
Munteanu, C., Kuemmerle, T., Boltiziar, M., Butsic, V., Gimmi, U., Lúboš Halada, , et al. (2014). Forest and agricultural land change in the Carpathian region—a meta-analysis of long-term patterns and drivers of change. Land Use Policy 38, 685–697. doi:10.1016/j.landusepol.2014.01.012
Nature Conservation Agency of the Republic of Latvia (2020). Nature data management system ozols. Available online at: https://ozols.gov.lv/pub/(Accessed November 19, 2024).
Nature Conservation Agency of the Republic of Latvia (2024). North Vidzeme biosphere reserve. Available online at: https://www.daba.gov.lv/en/north-vidzeme-biosphere-reserve (Accessed November 19, 2024).
Naughton-Treves, L., Holland, M. B., and Brandon, K. (2005). The role of protected areas in conserving biodiversity and sustaining local livelihoods. Annu. Rev. Environ. Resour. 30, 219–252. doi:10.1146/annurev.energy.30.050504.164507
Navarro, L. M., and Pereira, H. M. (2012). Rewilding abandoned landscapes in Europe. Ecosystems 15, 900–912. doi:10.1007/s10021-012-9558-7
Newbold, T. (2018). Future effects of climate and land-use change on terrestrial vertebrate community diversity under different scenarios. Proc. R. Soc. B Biol. Sci. 285, 20180792. doi:10.1098/rspb.2018.0792
Nguyen, H. T. T., Pham, T. A., Doan, M. T., and Tran, P. T. X. (2020). Land use/land cover change prediction using multi-temporal satellite imagery and multi-layer perceptron Markov model. Int. Arch. Photogramm. Remote Sens. Spat. Inf. Sci., 99–105. doi:10.5194/isprs-archives-XLIV-3-W1-2020-99-2020
Olesen, J. E., and Bindi, M. (2002). Consequences of climate change for European agricultural productivity, land use and policy. Eur. J. Agron. 16, 239–262. doi:10.1016/S1161-0301(02)00004-7
Plieninger, T., and Bieling, C. (2013). Resilience-based perspectives to guiding high-nature-value farmland through socioeconomic change. Ecol. Soc. 18, art20. doi:10.5751/ES-05877-180420
Poyatos, R., Latron, J., and Llorens, P. (2003). Land use and land cover change after agricultural abandonment: the case of a mediterranean mountain area (Catalan pre-pyrenees). Mt. Res. Dev. 23, 362–368. doi:10.1659/0276-4741(2003)023[0362:LUALCC]2.0.CO;2
Ren, Y., Lü, Y., Comber, A., Fu, B., Harris, P., and Wu, L. (2019). Spatially explicit simulation of land use/land cover changes: current coverage and future prospects. Earth-Sci. Rev. 190, 398–415. doi:10.1016/j.earscirev.2019.01.001
Rounsevell, M. D. A., and Reay, D. S. (2009). Land use and climate change in the UK. Land Use Policy 26, S160–S169. doi:10.1016/j.landusepol.2009.09.007
Roy, P. S., Ramachandran, R. M., Paul, O., Thakur, P. K., Ravan, S., Behera, M. D., et al. (2022). Anthropogenic land use and land cover changes—a review on its environmental consequences and climate change. J. Indian Soc. Remote Sens. 50, 1615–1640. doi:10.1007/s12524-022-01569-w
Saeima (1997). Law on North Vidzeme biosphere reserve. Available online at: https://likumi.lv/ta/en/en/id/52952 (Accessed November 19, 2024).
Saeima (2000). Law on forests. Available online at: https://likumi.lv/ta/en/en/id/2825-law-on-forests (Accessed November 19, 2024).
Saeima (2003). Hunting law. Available online at: https://likumi.lv/ta/en/en/id/77455-hunting-law (Accessed November 15, 2024).
Saeima (2006). Environmental protection law. Available online at: https://likumi.lv/ta/en/en/id/147917-environmental-protection-law [Accessed November 19, 2024].
Santos, M. J., Smith, A. B., Dekker, S. C., Eppinga, M. B., Leitão, P. J., Moreno-Mateos, D., et al. (2021). The role of land use and land cover change in climate change vulnerability assessments of biodiversity: a systematic review. Landsc. Ecol. 36, 3367–3382. doi:10.1007/s10980-021-01276-w
Schmitz, M. H., Do Couto, E. V., Xavier, E. C., Tomadon, L. D. S., Leal, R. P., and Agostinho, A. A. (2023). Assessing the role of protected areas in the land-use change dynamics of a biodiversity hotspot. Ambio 52, 1603–1617. doi:10.1007/s13280-023-01886-5
Seto, K. C., Güneralp, B., and Hutyra, L. R. (2012). Global forecasts of urban expansion to 2030 and direct impacts on biodiversity and carbon pools. Proc. Natl. Acad. Sci. 109, 16083–16088. doi:10.1073/pnas.1211658109
Shi, X., Matsui, T., Haga, C., Machimura, T., Hashimoto, S., and Saito, O. (2021). A scenario- and spatial-downscaling-based land-use modeling framework to improve the projections of plausible futures: a case study of the Guangdong–Hong Kong–Macao Greater Bay Area, China. Sustain. Sci. 16, 1977–1998. doi:10.1007/s11625-021-01011-z
Smith, R., Cannizzo, Z. J., Belle, E., and Wenzel, L. (2020). “Role of protected areas in climate change mitigation, adaptation, and disaster risk reduction,” in Climate action, encyclopedia of the UN sustainable development goals. Editors W. Leal Filho, A. M. Azul, L. Brandli, P. G. Özuyar, and T. Wall (Cham: Springer International Publishing), 1–16.
Staccione, A., Brown, C., Arneth, A., Rounsevell, M., Hrast Essenfelder, A., Seo, B., et al. (2023). Exploring the effects of protected area networks on the European land system. J. Environ. Manage. 337, 117741. doi:10.1016/j.jenvman.2023.117741
Supreme Council of the Republic of Latvia (1993). Law on specially protected nature Territories. Available online at: https://likumi.lv/ta/en/en/id/59994 (Accessed January 16, 2025).
Tariq, A., and Mumtaz, F. (2023). A series of spatio-temporal analyses and predicting modeling of land use and land cover changes using an integrated Markov chain and cellular automata models. Environ. Sci. Pollut. Res. 30, 47470–47484. doi:10.1007/s11356-023-25722-1
Tērauds, A., Nikodemus, O., Rasa, I., and Bells, S. (2008). Landscape ecological structure in the eastern part of the North Vidzeme biosphere reserve, Latvia. Latv. Proc. Latv. Acad. Sci. Sect. B Nat. Exact. Appl. Sci. 62, 63–70. doi:10.2478/v10046-008-0012-3
Tesfaw, A. T., Pfaff, A., Golden Kroner, R. E., Qin, S., Medeiros, R., and Mascia, M. B. (2018). Land-use and land-cover change shape the sustainability and impacts of protected areas. Proc. Natl. Acad. Sci. 115, 2084–2089. doi:10.1073/pnas.1716462115
The Latvian Geospatial Information Agency (2024). Digital height models. Available online at: https://www.lgia.gov.lv/en/digital-height-models (Accessed December 15, 2024).
University of Latvia (2025). The red data Book. Available online at: https://sarkanagramata.lu.lv/en/(Accessed March 1, 2025).
Keywords: biosphere reserve, land-use and land-cover change, Markov chain, multi-layer perceptron, scenario modeling, sustainable development
Citation: Krumins J and Klavins M (2025) Scenario-based modeling of land-use and land-cover changes to promote sustainability in biosphere reserves: a case study from North Vidzeme, Latvia. Front. Remote Sens. 6:1567002. doi: 10.3389/frsen.2025.1567002
Received: 26 January 2025; Accepted: 07 March 2025;
Published: 01 April 2025.
Edited by:
Gaia Vaglio Laurin, National Research Council (CNR), ItalyReviewed by:
Alessandro Sebastiani, Italian National Agency for New Technologies, Energy and Sustainable Economic Development (ENEA), ItalyCopyright © 2025 Krumins and Klavins. This is an open-access article distributed under the terms of the Creative Commons Attribution License (CC BY). The use, distribution or reproduction in other forums is permitted, provided the original author(s) and the copyright owner(s) are credited and that the original publication in this journal is cited, in accordance with accepted academic practice. No use, distribution or reproduction is permitted which does not comply with these terms.
*Correspondence: Janis Krumins, a3J1bWlucy5qYW5pc0BsdS5sdg==
Disclaimer: All claims expressed in this article are solely those of the authors and do not necessarily represent those of their affiliated organizations, or those of the publisher, the editors and the reviewers. Any product that may be evaluated in this article or claim that may be made by its manufacturer is not guaranteed or endorsed by the publisher.
Research integrity at Frontiers
Learn more about the work of our research integrity team to safeguard the quality of each article we publish.