 D. A. Samitha Daranagama
 Wataru Takeuchi
94% of researchers rate our articles as excellent or good
Learn more about the work of our research integrity team to safeguard the quality of each article we publish.
Find out more
ORIGINAL RESEARCH article
Front. Remote Sens., 27 February 2025
Sec. Image Analysis and Classification
Volume 6 - 2025 | https://doi.org/10.3389/frsen.2025.1553844
Introduction: As one of the world’s most important oil crops, oil palm plays a crucial role in meeting global food and industrial demands. However, Basal Stem Rot (BSR) disease poses a severe threat to oil palm plantations, significantly reducing yields and shortening plantation lifespans particularly in Southeast Asia. Effective early detection and monitoring are crucial for mitigating its impact.
Methods: This study presents an integrated approach to BSR disease stage detection and visualization through a combination of smartphone applications, deep learning-based classification, and a Web GIS-based dashboard. A dataset comprising images of oil palm trees in healthy, early infected, and severely infected stages was collected using a dedicated smartphone app. Five state-of-the-art convolutional neural network (CNN) architectures: DenseNet201, InceptionV3, MobileNetV2, NASNetMobile, and ResNet50 were evaluated for classification performance.
Results: MobileNetV2 emerged as the best-performing architecture, achieving an overall accuracy of 77% while balancing accuracy with computational efficiency. This model was subsequently integrated into the smartphone application “Gano Stage” for real-time disease stage prediction. The app enables plantation managers and relevant stakeholders to monitor disease progression, with predictions automatically updated on a Web GIS-based dashboard for spatial analysis and decision-making.
Discussion: The proposed system demonstrates practical utility, scalability, and adaptability, particularly in resource-constrained environments. By offering an accessible and efficient early detection solution, it contributes to the sustainability of oil palm plantations.
Oil palm (Elaeis guineensis) is one of the most important global oil crops, predominantly cultivated in Asia, Africa, and Latin America. Malaysia and Indonesia lead global production, contributing more than 85% of the total palm oil output, with other significant producers including Thailand, Colombia, and Nigeria (Jazuli et al., 2022; Bentivoglio et al., 2018; Murphy et al., 2021). Globally, approximately 74% of palm oil is utilized in food products, while 24% is allocated for industrial applications (Haw et al., 2023a). Oil palm plantations have experienced significant expansion over the years, driven by increasing global demand for both food and industrial products. This expansion stems from the crop’s exceptional efficiency, as it produces higher yields compared to other agricultural commodities, making it a preferred choice for meeting diverse demands. Furthermore, palm oil plays a vital economic role, contributing substantially to the gross domestic product (GDP) of producing countries, particularly Malaysia and Indonesia (Jazuli et al., 2022). To ensure consistent production and support its economic importance, the sustainability of the oil palm industry is critical (Siddiqui et al., 2021).
Oil palm plantations face significant threats from various plant diseases and pests, with basal stem rot disease (BSR) caused by the fungus Ganoderma boninense being the most critical challenge, particularly in Malaysia and Indonesia (Baharim et al., 2024; Liaghat et al., 2014). BSR significantly reduces yields, often by 50%–80%, and can cause mortality rates of up to 80% in mature oil palm stands by the midpoint of their 25-year lifespan (Murphy et al., 2021). Young palms typically succumb within 6–24 months of showing symptoms, while mature palms may survive an additional 2–3 years (Siddiqui et al., 2021). The pathogen infects the trunk’s xylem, disrupting water and nutrient distribution. This results in symptoms such as yellowing and necrotic leaves, unopened spears, reduced canopy size, and a characteristic skirt-like crown shape (Baharim et al., 2024). However, these foliar symptoms often appear in advanced stages of infection, making early detection difficult (Baharim et al., 2024). Minimizing the effects of BSR remains a major challenge for oil palm-producing countries, especially Malaysia and Indonesia (Baharim et al., 2024). Early detection of BSR infection enables timely treatment of infected oil palms, preventing further damage to the tree (Husin et al., 2020).
BSR detection can be broadly categorized into three approaches: manual, laboratory-based, and remote techniques (Husin et al., 2020). The traditional manual approach involves labour-intensive visual inspections, which are often inefficient for large-scale plantations (Husin et al., 2020). In contrast, laboratory procedures such as Ganoderma selection medium (GSM), polymerase chain reaction (PCR), and enzyme-linked immunosorbent assay with polyclonal antibodies (ELISA-PABS) are time-consuming, costly, and lack precision. Additionally, these methods often produce results only when the disease is already significantly advanced (Bharudin et al., 2022; Tee et al., 2021). Remote sensing techniques include ground-based methods such as terrestrial laser scanning (Husin et al., 2020) and electronic nose systems (Abdullah et al., 2012), as well as aerial approaches like UAV-based imaging (Ahmadi et al., 2023; Baharim et al., 2023) and satellite platforms (Hashim et al., 2021). However, these methods often face challenges such as high operational costs, limited spatial resolution, and difficulty in widespread adoption. This underscores the critical need for faster and more cost-effective methods for early detection of BSR (Bharudin et al., 2022).
Advancements in deep learning have achieved remarkable success in various computer vision tasks, particularly in image classification (Barman et al., 2024). Convolutional Neural Networks (CNNs) have emerged as a leading architecture for visual recognition (Barman et al., 2024). For example, Maeda-Gutiérrez et al. (2020) evaluated five CNN models, including AlexNet (Krizhevsky et al., 2012), GoogleNet (Szegedy et al., 2015), Inception V3 (Szegedy et al., 2016), ResNet 18, and ResNet 50 (He et al., 2016), for classifying nine types of tomato diseases, with GoogleNet achieving an AUC score of 99.72%. Similarly, Ahad et al. (2023) demonstrated the potential of CNNs for rice disease classification, where an ensemble framework (DEX) combining DenseNet121 (Huang et al., 2017), EfficientNetB7 (Tan and Le, 2019), and Xception (Chollet, 2017) achieved 98% accuracy, outperforming individual models.
In the context of BSR detection, Lee et al. (2022) explored a 1-dimensional CNN for early BSR detection, achieving an accuracy of 73.33%. Yong et al. (2022) utilized NIR-hyperspectral imaging and three different deep learning models, 16-layer CNN, Mask RCNN (He et al., 2017), and VGG16 (Simonyan and Zisserman, 2014) to detect BSR in oil palm seedlings during early infection stages, with VGG16 achieving the highest F1 score of 91.72%. Similarly, Haw et al. (2023b) tested five CNN architectures, MobileNet (Howard et al., 2017), EfficientNetB0, VGG16, ResNet50, and DenseNet121 on TLS images to differentiate between healthy and non-healthy plants, with DenseNet121 providing the best accuracy of 83.3%.
Although deep learning has demonstrated significant potential in plant disease detection, its application to BSR identification remains limited, underscoring the need for further research in this area. This study aims to utilize CNNs to detect BSR disease stages and leverage smartphone photos and smartphone-based technology to develop a cost-effective and scalable solution for field applications. Smartphones are widely available, easy to use, and capable of capturing high-resolution images, making them an ideal tool for practical applications in resource-constrained environments. Specifically, five state-of-the-art CNN architectures, DenseNet201, InceptionV3, MobileNetV2 (Sandler et al., 2018), NASNetMobile (Zoph et al., 2018), and ResNet50, were evaluated to classify BSR disease stages in oil palm plantations using smartphone-acquired images. The best-performing model was integrated into a smartphone application, “Gano Stage,” enabling real-time disease detection directly in plantation fields. Additionally, a Web GIS-based dashboard was developed to visualize predictions and monitor disease trends, providing an effective tool for plantation management.
This study introduces a novel framework integrating a smartphone application, state-of-the-art deep learning-based CNN architectures, and a Web GIS-based dashboard for BSR disease stage detection. By combining these technologies, the proposed solution enables real-time monitoring and management of BSR disease in large-scale oil palm plantations. Furthermore, this approach addresses the challenges of resource limitations and scalability, providing a practical and cost-effective tool for plantation management.
The objectives of this study are,
1. Evaluate five state-of-the-art CNN architectures (DenseNet201, InceptionV3, MobileNetV2, NASNetMobile, and ResNet50) for BSR disease stage detection and compare their performance to identify the best model.
2. Develop a smartphone application for real-time disease prediction in oil palm plantations using the best performing model.
3. Design a Web GIS-based dashboard for monitoring and analyzing disease trends effectively, incorporating real-time updates from the predictions generated by the smartphone application.
This section describes the development and implementation of smartphone-based applications and convolutional neural networks (CNNs) for the classification of BSR disease stages in oil palm plantations. The primary objective of this study was to create an integrated solution combining smartphone applications with deep learning-based classification for detecting infection stages of BSR disease. The proposed methodology incorporates two key smartphone applications and a web-based dashboard.
Firstly, a dataset comprising images of three different BSR disease infection stages was compiled using a smartphone application specifically designed for field data collection, named “Gano Stage – Data Collection.” After basic preprocessing, the collected images were used to train five state-of-the-art CNN-based models: MobileNetV2, DenseNet201, NASNetMobile, InceptionV3, and ResNet50. The best-performing model was then deployed in a smartphone-based application for real-time automatic detection of disease stages, named “Gano Stage.” Furthermore, predictions from the application were updated in real time on a web-based GIS dashboard, facilitating enhanced visualization.
Figure 1 illustrates the overall process flow, which is divided into four main steps: data acquisition, training and classification, integration of the deep learning model into the “Gano Stage” application for real-time predictions, and web GIS-based visualization.
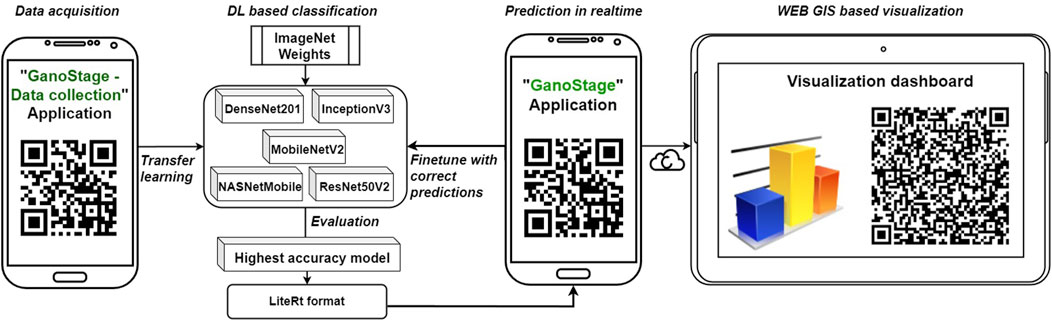
Figure 1. The overall workflow of the study (QR codes provide access to each application).
The “Gano Stage – Data Collection” Application was developed to facilitate the collection of field data. This application was used to capture images of oil palm trees at various stages of BSR disease, including healthy, early infected, severely infected, and dead. The collected images served as training data for deep learning model development. During field testing, it was observed that images captured using modern smartphones provided sufficient detail to capture the visual symptoms of the infection stages. For data collection, Apple iPhone 8, iPhone SE and iPhone 15 were used, with camera resolutions of 12 MP or higher. These devices adequately represented the distinct features of each disease stage for classification. The details of the “Gano Stage–Data Collection” Application are outlined as follows:
• Platform: Developed using ArcGIS Survey123 to ensure cross-platform compatibility (iOS and Android).
• Functionality: Collect photos of oil palm trees, tagging images with relevant metadata, including location, visual symptoms, and tree health status. The data collected is sent to an ArcGIS Online cloud storage system and serves as input for deep learning model training.
• System requirements: Smartphone with camera and GNSS functionality, Installation of the Survey123 application.
The interface of the smartphone application was shown in Figure 2.
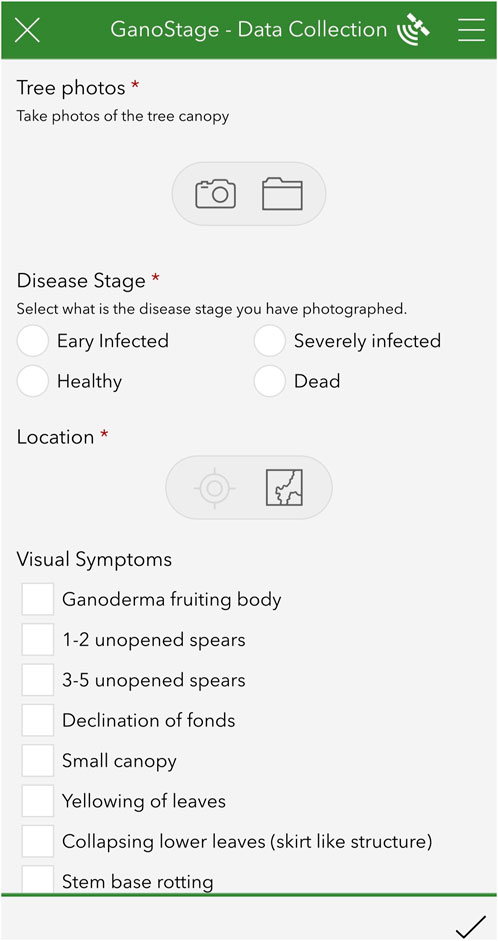
Figure 2. Interface of the “GanoStage – Data collection” app.
The data collection process was conducted in oil palm plantations in Malaysia and Thailand. To label the different stages of the disease, the visual symptoms listed in prior studies were used as a basis for classification (Liaghat et al., 2014). Additionally, domain experts in plant pathology were consulted during data collection to ensure accurate identification of the disease stages in the field. Table 1 provides detailed information about the field data, including the number of photos collected and the corresponding visual symptoms for each disease stage. To ensure consistency across locations, the same classification criteria were applied during data collection in Malaysia and Thailand. Collecting data from plantations in both Malaysia and Thailand was provided an opportunity to capture the diversity of environmental conditions, tree physiology, and disease presentation that exists in real-world scenarios. Figure 3 shows healthy, early infected and severely infected oil palm plants from the field data.
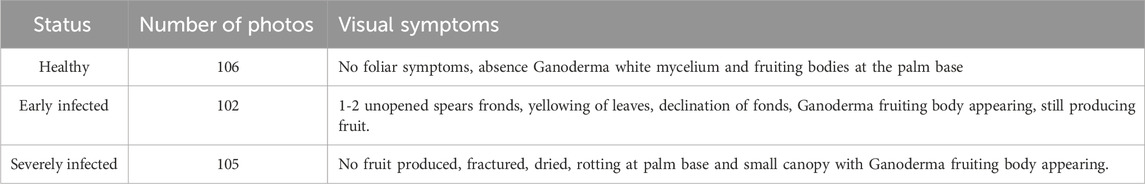
Table 1. Details of the field survey data.
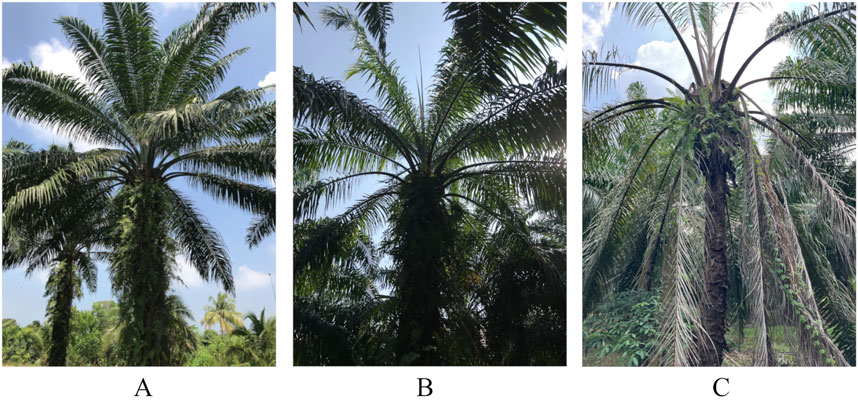
Figure 3. (A) Healthy plant, (B) BSR early infected plant, (C) BSR severely infected plant.
CNNs have demonstrated significant potential in plant disease detection, offering improved accuracy and efficiency compared to conventional methods. Despite limited studies applying CNN models to BSR detection, their success in detecting other plant diseases highlights their applicability to this context (Maeda-Gutiérrez et al., 2020; Ahad et al., 2023).
To evaluate the performance of CNNs in classifying BSR stages, this study employed five state-of-the-art architectures, DenseNet201, MobileNetV2, InceptionV3, NASNetMobile, and ResNet50. These models were selected due to their established effectiveness in plant disease classification and broader image recognition tasks (Maeda-Gutiérrez et al., 2020; Ahad et al., 2023). The models provide a range of complexity and computational efficiency, allowing for a comprehensive assessment of their suitability in distinguishing between healthy, early infected, and severely infected oil palm trees and integration with smartphone-based application.
The model development and evaluation were performed using the Google Colab Pro, leveraging its GPU support for efficient processing. The models were configured, trained, and evaluated using the TensorFlow framework and Keras API. The development of CNN models followed four key stages: data preprocessing, model initialization, training and performance evaluation. The flow of CNN based classification is shown in Figure 4.

Figure 4. CNN based classification workflow.
The collected dataset was divided into training and validation subsets using an 80/20 split to ensure a balanced evaluation. All images were resized to 224 × 224 pixels to align with the input dimensions required by the CNN models. Data augmentation techniques were applied to increase the variance of the training dataset and enhance the robustness and generalization of the models. The augmentation parameters included random rotations (up to 15°), zoom (up to 20%), and horizontal flip.
All five CNN architectures (DenseNet201, MobileNetV2, InceptionV3, NASNetMobile, and ResNet50) were initialized with ImageNet (Deng et al., 2009) pretrained weights, utilizing the transfer learning approach to expedite training and improving accuracy on the limited dataset. The top classification layers of these architectures were excluded, and custom layers were added. The hyperparameters used in this study were selected based on recommendations from prior work which demonstrated their effectiveness in CNN-based plant disease classification tasks and additional considerations for the current dataset’s characteristics (Hassan et al., 2021; Elfatimi et al., 2022).
A global average pooling (GAP) layer was included, followed by a dropout layer with a rate of 0.2 (Hassan et al., 2021), to address overfitting. A fully connected dense layer with softmax activation was added to produce probabilities for the three classes: healthy, early infected, and severely infected. All models were trained for 50 epochs with early stopping callback (patience = 8) to prevent overfitting. The sparse categorical cross-entropy was used as the loss function due to its suitability for multi-class classification tasks with integer-encoded labels. The Adam optimizer was used with an initial learning rate of 0.001, and the batch size was set to 32 (Elfatimi et al., 2022). The training process was monitored using validation accuracy and loss metrics, which were evaluated at the end of each epoch to assess model performance and prevent overfitting.
The performance of the CNN models was assessed using metrics including accuracy, precision, recall, F1-score, and a confusion matrix. Based on the evaluation results, the best-performing model was selected for integration with the “Gano Stage” smartphone application.
The highest accuracy model was converted into LiteRT format which offers high-performance runtime for on-device AI. The “Gano Stage” app is designed for real-time detection of BSR disease infection stages in oil palm trees. When a user captures a photo, the app predicts and displays the disease stage, providing immediate feedback (Esri, 2024). The details of the Gano Stage app are outlined as follows,
• Platform: Developed using ArcGIS Survey123 Connect to ensure cross-platform compatibility (iOS and Android).
• Functionality:
◦ When a user captures a photo of a tree, the app automatically detects and displays the stage of Ganoderma infection (healthy, early infected, severely infected) using the integrated LiteRT model which runs on device.
◦ The predictions of the application will be automatically updated in a web GIS based dashboard.
◦ Data collected from the Gano Stage app, including labelled images and metadata, will be used to further fine-tune the deep learning model through transfer learning. This process updates the model’s weights, improving accuracy and adapting it to real-world conditions.
• System Requirements: Smartphone with camera and GNSS functionality, along with the installation of the Survey123 application.
When users interact with the app to predict disease stages, all photos captured will be automatically uploaded and stored on the ArcGIS Online server, along with their associated metadata. These images, expected to be collected under diverse field conditions and from various geographical locations, will provide valuable data for improving the model.
The stored photos can periodically serve as additional training data for fine-tuning the deep learning model. Fine-tuning will involve retraining the model using this newly captured data to enable it to adapt to variations in lighting conditions, image angles, tree characteristics, and disease presentations. Once retrained, the improved model will be integrated into the “Gano Stage” application using Arc GIS Survey123 Connect, seamlessly replacing the previous version. Notifications will be sent to users, prompting them to update the app to access the enhanced model for more accurate real-time predictions.
The web GIS based dashboard is a novel feature of this study, offering a platform for real-time monitoring and spatial visualization of disease predictions from the “Gano Stage” app. This interactive tool enables plantation managers and researchers to track the spread of BSR disease spatially and analyse data directly from the field, enhancing decision-making and disease management efforts. The details of the dashboard are as follows.
• Platform: Built using ArcGIS Online platform, accessible from both desktop and mobile environments.
• Functionality:
◦ Provides real-time visualization of disease predictions from the “Gano Stage” app.
◦ The statistics in the dashboard automatically update when the map extent is adjusted.
◦ Clicking on a data point displays the associated images taken in a popup menu.
◦ High-resolution satellite imagery is set as the default basemap, which can be changed via the Basemap Gallery button.
◦ The Measure tool allows users to measure distances, areas, and obtain the coordinates of any location on the map.
◦ The Print button can be used to generate map layouts at any extent, including essential map elements.
The results of the study are presented in three sections: CNN-based classification results, model deployment in the “Gano Stage” application, and web GIS-based dashboard visualization.
In this study, an evaluation of state-of-the-art pretrained CNN models was conducted for the classification of BSR disease infection stages using smartphone photos. The performance of the CNN models was compared based on metrics of precision, recall, F1-score, accuracy, and the confusion matrix. The results are summarized in Table 2.
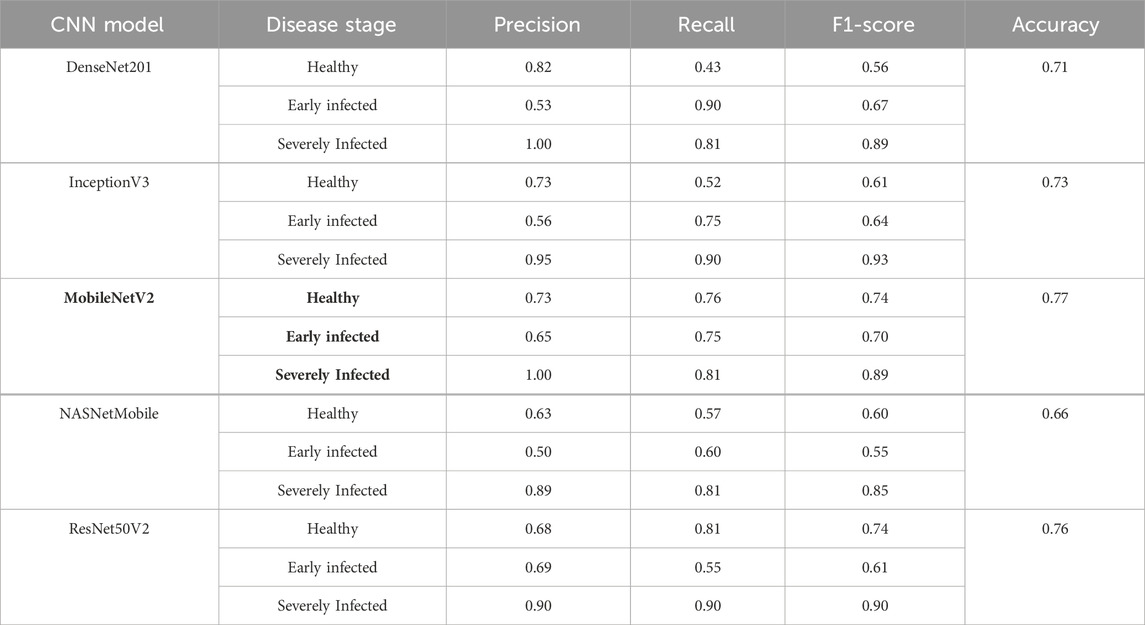
Table 2. Performance metrics of the CNN models for classification of BSR infection stage.
Among the models tested, MobileNetV2 demonstrated the best overall performance, achieving an accuracy of 77%, with balanced precision, recall, and F1-score across all classes. In particular, MobileNetV2 outperformed other models in detecting the early infected stage, a critical category for early intervention, achieving a recall of 75% and an F1-score of 70%. To better understand the model’s performance, a confusion matrix for MobileNetV2 is presented in Figure 5. Some correctly classified images and misclassification from the MobileNetV2 are shown in Figure 6. Additionally, the training and validation accuracy and loss curves for MobileNetV2 are shown in Figure 7.
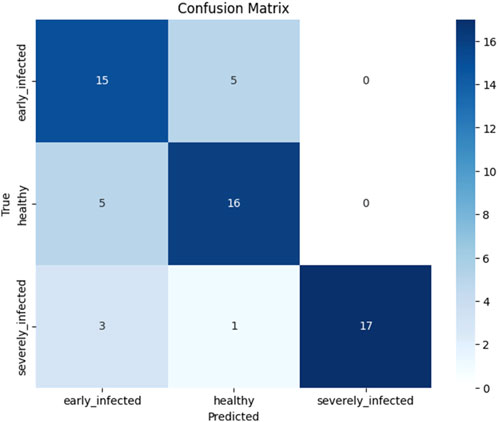
Figure 5. Confusion matrix of MobileNetV2 for BSR infection stage classification.
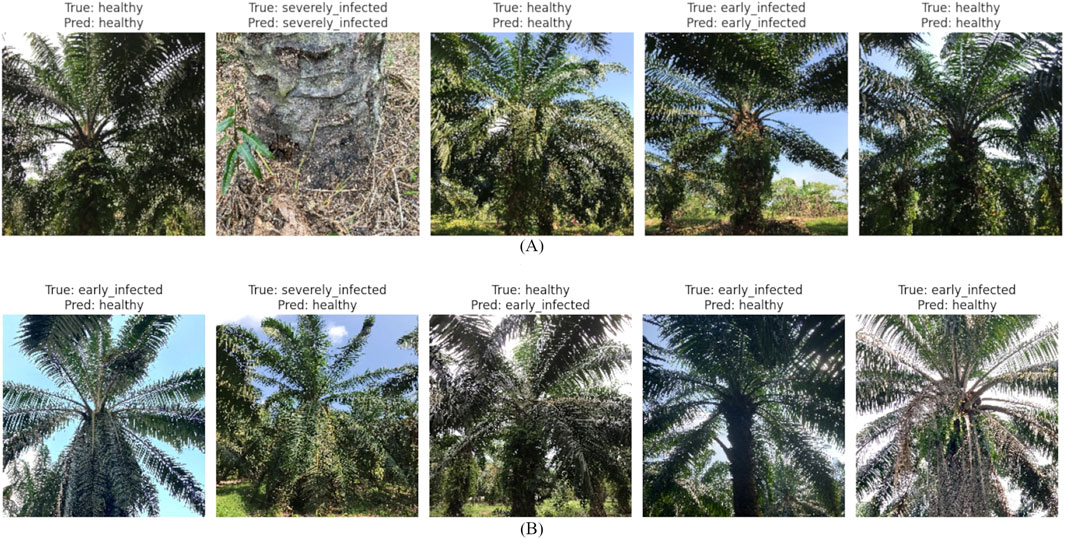
Figure 6. (A) Correctly classified images from MobileNetV2 model, (B) Incorrectly classified images from MobileNetV2 model.
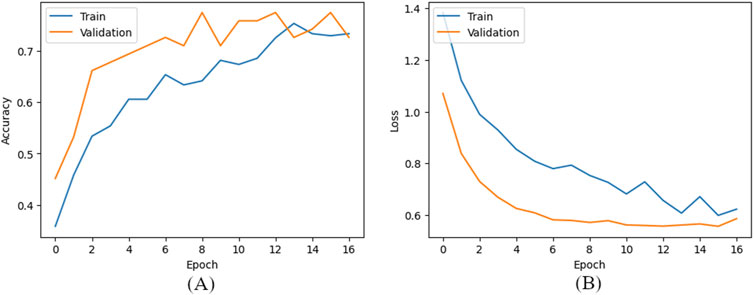
Figure 7. (A) Training and validation accuracy curves (B) Training and validation loss curves.
Since the MobileNetV2 model demonstrated the best overall performance, it was converted into LiteRT format for deployment in the “Gano Stage” application. LiteRT (formerly TensorFlow Lite) is Google’s high-performance runtime designed specifically for on-device machine learning for mobile devices. It optimizes models for constraints such as latency, privacy, connectivity, size, and power consumption, making it an ideal solution for mobile AI applications.
Figure 8 shows the “Gano Stage” app functionality for detecting the BSR infection stage. The app allows users to capture or upload a photo of an oil palm tree canopy. After processing the image, the predicted disease stage (healthy, early infected, or severely infected) is displayed. This real-time feedback enables plantation managers to make informed decisions quickly.
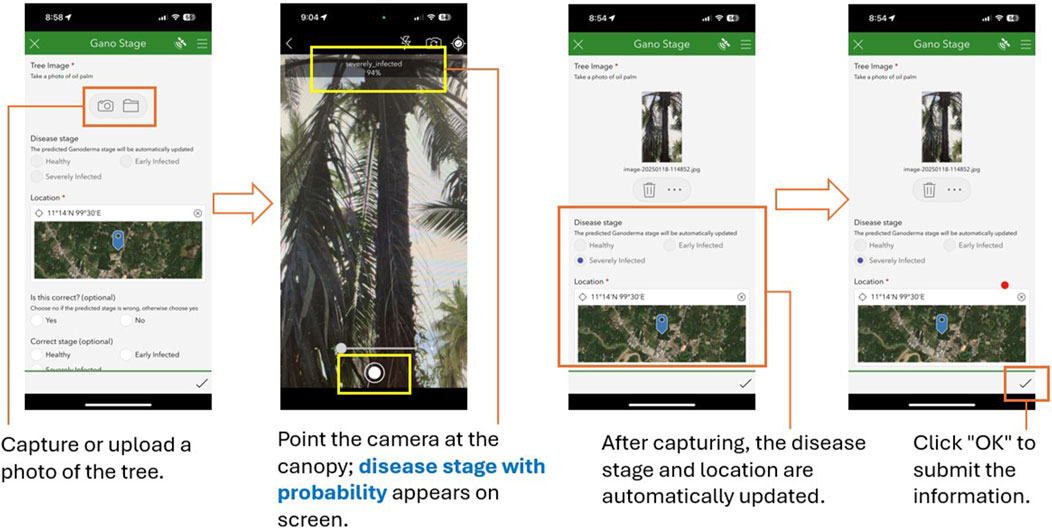
Figure 8. “Gano Stage” app functionality for detecting the BSR infection stage.
Additionally, the app includes features for correcting misclassifications, as illustrated in Figure 9. Users can manually select the correct disease stage and upload supplementary images to refine the model’s training data, improving its long-term accuracy. For data submission, the app supports both immediate uploads and offline storage, making it adaptable to areas with limited connectivity.
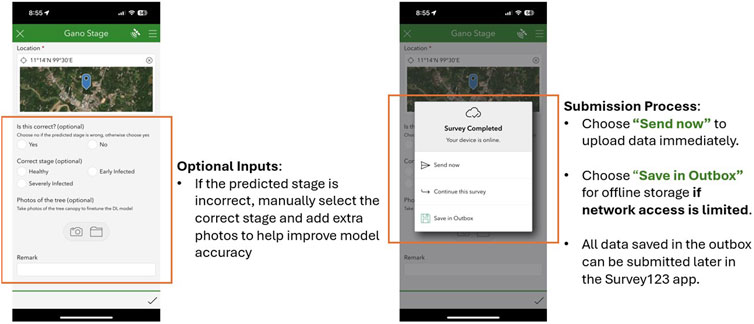
Figure 9. Data submission of the “Gano Stage” app.
To ensure compatibility and efficiency, the app was tested on a range of devices, including Apple iPhone 8, iPhone SE, iPhone 11, iPhone 15, and Samsung Galaxy Tab A9. Testing confirmed that the app performed efficiently on modern smartphones and tablets without noticeable latency issues, even during real-time predictions. However, performance on older or low-end devices may vary.
The Web GIS-based dashboard successfully integrates prediction data from the “Gano Stage” application. As shown in Figure 10, the dashboard displays predictions categorized by disease stage (healthy, early infected, and severely infected) along with their spatial locations. Users can analyze trends through auto-updated statistics based on map extent and interact with specific data points to view associated field images.
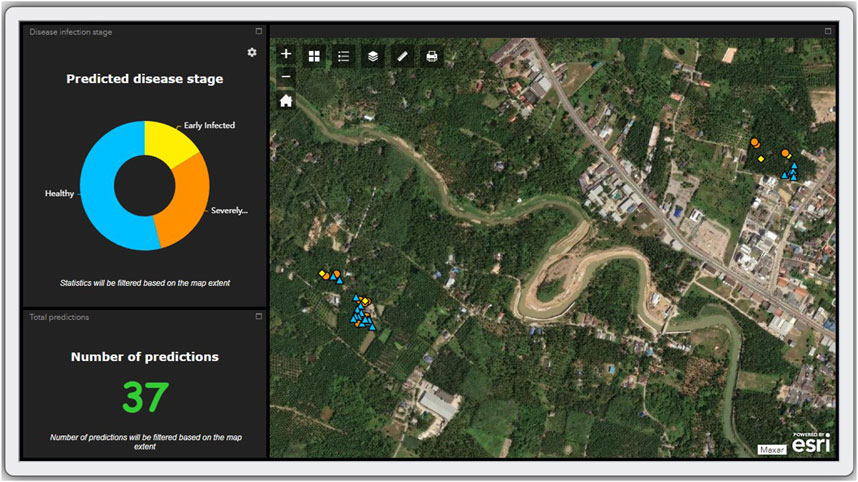
Figure 10. Web GIS based dashboard to visualize the prediction data of “Gano Stage” app.
This study addresses the critical need for cost-effective and scalable solutions to detect and monitor BSR disease stages in oil palm plantations. By leveraging deep learning techniques and smartphone technology, the study overcomes limitations of traditional detection methods, such as high costs and accessibility issues. The objectives included evaluating state-of-the-art CNN architectures for BSR detection, developing a real-time prediction app (“Gano Stage”), and integrating a Web GIS-based dashboard for spatial visualization. These methods aimed to bridge the gap between advanced techniques and practical field applications.
The “Gano Stage - Data Collection” application facilitated the efficient and systematic acquisition of smartphone photos as training data for the deep learning models. By allowing users to capture images of oil palm trees at different stages of Ganoderma disease (healthy, early infected, and severely infected), the application significantly reduced the time and effort required for data gathering. The integration of metadata, such as location and disease stage, further enhanced the dataset’s utility for training and validation.
The app’s cross-platform compatibility, developed using ArcGIS Survey123, ensured accessibility on both iOS and Android devices, while its user-friendly design enabled seamless use by field staff and plantation managers with minimal technical expertise. However, one challenge encountered during the data collection process was the difficulty in capturing isolated canopy images in densely planted areas. Overlapping tree fonds often made it challenging to isolate individual trees for clear image acquisition. Despite this, the app’s functionalities contributed to the creation of a comprehensive dataset, which was critical to the DL based classification.
The classification of Ganoderma disease stages using state-of-the-art CNN models demonstrated promising results, with MobileNetV2 emerging as the best-performing model. Its lightweight architecture balances computational efficiency with higher accuracy, making it an optimal choice for real-time deployment in the “Gano Stage” application.
The confusion matrix for MobileNetV2, as shown in Figure 5, revealed strong performance in detecting severely infected and healthy stages. However, most misclassifications occurred between the early-infected and healthy stages due to overlapping visual symptoms. The misclassified images shown in Figure 6B confirm that the visual similarities between healthy and early-infected stages pose a significant challenge for the model, as symptoms in the early stages, such as such as slight discoloration or minimal canopy changes, can closely resemble healthy foliage.
The MobileNetV2 architecture achieved maximum overall accuracy of 0.77 which is lower than the accuracy reported by the prior studies using CNN based classification for plant disease detection (Maeda-Gutiérrez et al., 2020; Ahad et al., 2023; Hassan et al., 2021; Elfatimi et al., 2022). This discrepancy can be attributed to several key factors.
First, the dataset used for model training in this study is relatively small compared to datasets in prior work (Maeda-Gutiérrez et al., 2020; Ahad et al., 2023; Hassan et al., 2021; Elfatimi et al., 2022), which often contain thousands of images specifically prepared for machine learning and deep learning experiments. To date, no such large-scale publicly available datasets exist for BSR disease, making it challenging to achieve comparable accuracy. Instead, this study utilized a dataset of images captured in diverse field conditions using the designed smartphone application, reflecting real-world variability.
Second, unlike many studies that focus solely on detecting the presence of a disease, this study aimed to classify disease stages (healthy, early-infected, and severely infected) for BSR disease. BSR symptoms can be subtle and challenging to distinguish, particularly in the early stages of infection. Distinguishing subtle symptoms of early-stage BSR disease is inherently challenging, particularly when compared to plant diseases with more visually distinct features, such as spots or lesions.
The “Gano Stage” application serves as an efficient and accessible tool for detecting BSR disease stages in oil palm plantations. Designed for ease of use, it allows anyone, including field workers with minimal technical expertise, to effectively participate in disease monitoring. The app leverages AI to deliver real-time predictions directly on smartphones, providing a scalable solution for large-scale plantations by reducing the need for skilled personnel in disease identification.
Field workers can seamlessly integrate the app into their daily routines, capturing photos of oil palm trees during regular activities. Ground-level photos captured through the app provide the advantage of detecting symptoms such as declining fonds, skirt-like crown shapes, and trunk-base necrosis, features that may be challenging to capture using UAV-based platforms. This approach ensures that subtle and early-stage symptoms visible at ground level are included in the disease monitoring process, complementing other technologies such as UAVs that primarily capture canopy-level symptoms.
This continuous data collection process not only supports immediate decision-making but also contributes to ongoing model improvement. As more data is gathered, the application progressively enhances its training set, creating a larger and more diverse dataset of BSR disease instances. An added advantage of this iterative mapping and recording is its potential to support future deep learning-based approaches, facilitating the development of more accurate and robust disease detection models.
By combining efficiency, user-friendliness, and accessibility, the “Gano Stage” application bridges the gap between advanced DL based techniques and practical fieldwork. It empowers plantation managers and workers to take proactive measures against BSR disease, improving disease control and plantation management practices.
The Web GIS-based dashboard serves as a valuable extension to the “Gano Stage” application, enabling plantation managers, researchers, and other relevant stakeholders to visualize and analyze the spatial distribution of BSR disease stages in real time. By integrating prediction data from the “Gano Stage” app, the dashboard provides a centralized platform for monitoring disease patterns across plantations. This functionality is particularly beneficial for large-scale plantations, where quick and informed decision-making is critical to preventing the spread of infection. Moreover, the dashboard’s tools, such as dynamically adjusting statistics based on the selected map extent, measurement tools, and printable map layouts, make it a versatile resource for operational planning. By providing spatial insights and trend analyses, the dashboard aids in long-term planning, such as identifying high-risk areas for focused intervention.
While the proposed system demonstrates practical utility and scalability for detecting and visualizing BSR disease stages, several limitations must be addressed. The system’s ability to accurately classify BSR stages may be compromised when plants exhibit symptoms caused by other stress factors, such as nutritional deficiencies, water stress, or infections from other diseases. These conditions can visually resemble BSR symptoms, leading to potential misclassifications.
The confusion matrix results further reveal challenges in distinguishing between healthy and early infected classes, likely due to overlapping visual symptoms in the early stages of infection. This limitation highlights the need for additional high-quality data, particularly images that capture subtle symptoms of early infection. Expanding the training dataset with images from diverse plantation environments would enhance the model’s ability to differentiate between these closely related classes.
Another limitation pertains to real-time processing performance on resource-constrained mobile devices. Although MobileNetV2 is computationally efficient, low-end devices may still face latency issues when processing images due to limited hardware capabilities. Additionally, the application relies on the smartphone’s GNSS functionality to plot infected trees on the Web GIS-based dashboard. However, the accuracy of GNSS data depends on the smartphone model, hardware capabilities and external factors such as signal obstructions caused by oil palm tree canopies. Consequently, the recorded location of the photo may not always correspond precisely to the actual position of the infected tree. To address this issue, the application includes a remark field, allowing users to input specific information about the tree, such as a tree number or other identifiable characteristics. This additional metadata provides a supplementary mechanism for reducing the risk of misidentification and improving field operations’ accuracy. While this study does not quantitatively evaluate the GNSS spatial accuracy, future work should focus on testing the average positional error of smartphone GNSS data in real-world plantation settings with higher accuracy positioning devices.
Additionally, successful adoption of the application in large-scale plantations relies on user training and proper image acquisition. Field workers may require guidance to ensure consistent image capturing specially covering the tree canopy with less obstacles, which is essential for improving prediction reliability.
To address these limitations, future work should focus on model enhancement, and extensive field testing under diverse conditions. Incorporating advanced techniques such as ensemble learning, attention mechanisms, or hybrid models could further improve accuracy and generalization. Furthermore, integrating additional data sources to the visualization dashboard, such as UAV-based imagery, satellite data, or sensor-based measurements, would enhance the system’s scalability and robustness for large-scale plantation monitoring. Additionally, the data captured through the “Gano Stage” app can serve as ground truth information for future studies, such as UAV and satellite-based approaches. By addressing these challenges, the proposed system can be further refined to provide a more reliable, scalable, and effective solution for managing BSR disease in oil palm plantations.
This study demonstrated an integrated approach to detecting and visualizing BSR disease stages in oil palm plantations using smartphone applications, deep learning-based classification, and a Web GIS-based dashboard. Five state-of-the-art CNN architectures were evaluated for classifying BSR disease stages. Among these, MobileNetV2 emerged as the best-performing model, achieving a balance between high accuracy and computational efficiency, making it particularly suitable for real-time deployment through smartphone applications in resource-constrained environments.
This study uniquely integrates deep learning-based disease detection with user-friendly mobile applications and GIS visualization, offering a scalable and practical solution for plantation management. An added advantage of this system is its ability to continuously expand the training dataset through field use, contributing to future improvements in model accuracy and the development of more advanced detection methods. The dynamic and interactive features of the dashboard underscore the importance of combining AI and GIS technologies to deliver actionable insights for agricultural decision-making.
Despite its utility, the system faces limitations, including potential misclassifications caused by visual overlap with other stress factors, challenges in distinguishing between healthy and early infected stages, and spatial inaccuracies arising from smartphone GNSS limitations. Addressing these challenges through expanded datasets, enhanced deep learning model architectures, and improved user training will further strengthen the system’s accuracy and robustness.
In conclusion, the proposed system provides a practical and accessible solution for sustainable oil palm plantation management, contributing to BSR disease mitigation efforts in Southeast Asia and beyond.
The raw data supporting the conclusions of this article will be made available by the authors, without undue reservation.
DD: Conceptualization, Data curation, Formal Analysis, Investigation, Methodology, Software, Validation, Visualization, Writing–original draft, Writing–review and editing. WT: Conceptualization, Funding acquisition, Project administration, Resources, Supervision, Validation, Writing–review and editing.
The author(s) declare that no financial support was received for the research, authorship, and/or publication of this article.
The authors declare that the research was conducted in the absence of any commercial or financial relationships that could be construed as a potential conflict of interest.
The author(s) declare that no Generative AI was used in the creation of this manuscript.
All claims expressed in this article are solely those of the authors and do not necessarily represent those of their affiliated organizations, or those of the publisher, the editors and the reviewers. Any product that may be evaluated in this article, or claim that may be made by its manufacturer, is not guaranteed or endorsed by the publisher.
Abdullah, A. H., Adom, A. H., Shakaff, A. M., Ahmad, M. N., Zakaria, A., Saad, F. S. A., et al. (2012). “Hand-held electronic nose sensor selection system for basal stem rot (BSR) disease detection,” in 2012 third international conference on intelligent systems modelling and simulation, Kota Kinabalu, Malaysia, 08–10 February 2012 (IEEE), 737–742.
Ahad, M. T., Li, Y., Song, B., and Bhuiyan, T. (2023). Comparison of CNN-based deep learning architectures for rice diseases classification. Artif. Intell. Agric. 9, 22–35. doi:10.1016/j.aiia.2023.07.001
Ahmadi, P., Mansor, S. B., Ahmadzadeh Araji, H., and Lu, B. (2023). Convolutional SVM networks for detection of Ganoderma boninense at early stage in oil palm using UAV and multispectral Pleiades images. ISPRS Ann. Photogrammetry, Remote Sens. Spatial Inf. Sci. 10, 25–30. doi:10.5194/isprs-annals-x-4-w1-2022-25-2023
Baharim, M. S. A., Adnan, N. A., Izzuddin, M. A., Laurence, A. L., Karsimen, M. K., and Arof, H. (2024). Modelling water use efficiency (WUE) for estimating the severity of Ganoderma boninense-derived basal stem rot disease in oil palm. J. Plant Pathology. doi:10.1007/s42161-024-01770-5
Baharim, M. S. A., Adnan, N. A., Mohd, F. A., Seman, I. A., Anuar, M. I., Latif, Z. A., et al. (2023). Optimization of machine learning classifier using multispectral data in assessment of Ganoderma basal stem rot (BSR) disease in oil palm plantation. Int. J. Inf. Technol. 15 (8), 4259–4273. doi:10.1007/s41870-023-01483-5
Barman, U., Sarma, P., Rahman, M., Deka, V., Lahkar, S., Sharma, V., et al. (2024). Vit-SmartAgri: vision transformer and smartphone-based plant disease detection for smart agriculture. Agronomy 14 (2), 327. doi:10.3390/agronomy14020327
Bentivoglio, D., Finco, A., and Bucci, G. (2018). Factors affecting the Indonesian palm oil market in food and fuel industry: evidence from a time series analysis. Int. J. Energy Econ. Policy 8 (5), 49–57.
Bharudin, I., Ab Wahab, A. F. F., Abd Samad, M. A., Xin Yie, N., Zairun, M. A., Abu Bakar, F. D., et al. (2022). Review update on the life cycle, plant–microbe interaction, genomics, detection and control strategies of the oil palm pathogen Ganoderma boninense. Biology 11 (2), 251. doi:10.3390/biology11020251
Chollet, F. (2017). “Xception: deep learning with depthwise separable convolutions,” in Proceedings of the IEEE conference on computer vision and pattern recognition, Honolulu, HI, 21–26 July 2017, 1251–1258.
Deng, J., Dong, W., Socher, R., Li, L. J., Li, K., and Fei-Fei, L. (2009). “Imagenet: a large-scale hierarchical image database,” in 2009 IEEE conference on computer vision and pattern recognition, Miami, FL, 20–25 June 2009 (IEEE), 248–255.
Elfatimi, E., Eryigit, R., and Elfatimi, L. (2022). Beans leaf diseases classification using mobilenet models. IEEE Access 10, 9471–9482. doi:10.1109/access.2022.3142817
Esri (2024). Train a model to identify street signs. ArcGIS Learn. Redlands, CA: Esri Inc. Available at: https://learn.arcgis.com/en/projects/train-a-model-to-identify-street-signs/(Accessed September 11, 2024).
Hashim, I. C., Shariff, A. R. M., Bejo, S. K., Muharam, F. M., and Ahmad, K. (2021). Machine-learning approach using SAR data for the classification of oil palm trees that are non-infected and infected with the basal stem rot disease. Agronomy 11 (3), 532. doi:10.3390/agronomy11030532
Hassan, S. M., Maji, A. K., Jasiński, M., Leonowicz, Z., and Jasińska, E. (2021). Identification of plant-leaf diseases using CNN and transfer-learning approach. Electronics 10 (12), 1388. doi:10.3390/electronics10121388
Haw, Y. H., Hum, Y. C., Chuah, J. H., Voon, W., Khairunniza-Bejo, S., Husin, N. A., et al. (2023b). Detection of basal stem rot disease using deep learning. IEEE Access 11, 49846–49862. doi:10.1109/access.2023.3276763
Haw, Y. H., Lai, K. W., Chuah, J. H., Bejo, S. K., Husin, N. A., Hum, Y. C., et al. (2023a). Classification of basal stem rot using deep learning: a review of digital data collection and palm disease classification methods. PeerJ Comput. Sci. 9, e1325. doi:10.7717/peerj-cs.1325
He, K., Gkioxari, G., Dollár, P., and Girshick, R. (2017). “Mask r-cnn,” in Proceedings of the IEEE international conference on computer vision, Honolulu, HI, 27–29 October 2017, 2961–2969.
He, K., Zhang, X., Ren, S., and Sun, J. (2016). “Deep residual learning for image recognition,” in Proceedings of the IEEE conference on computer vision and pattern recognition, Las Vegas, NV, 27–30 June 2016, 770–778.
Howard, A. G., Zhu, M., Chen, B., Kalenichenko, D., Wang, W., Weyand, T., et al. (2017). MobileNets: efficient convolutional neural networks for mobile vision applications (2017). arXiv, 126. doi:10.48550/arXiv.1704.04861
Huang, G., Liu, Z., Van Der Maaten, L., and Weinberger, K. Q. (2017). “Densely connected convolutional networks,” in Proceedings of the IEEE conference on computer vision and pattern recognition, Las Vegas, NV, 27–30 June 2016, 4700–4708.
Husin, N. A., Khairunniza-Bejo, S., Abdullah, A. F., Kassim, M. S., Ahmad, D., and Azmi, A. N. (2020). Application of ground-based LiDAR for analysing oil palm canopy properties on the occurrence of basal stem rot (BSR) disease. Sci. Rep. 10 (1), 6464. doi:10.1038/s41598-020-62275-6
Jazuli, N. A., Kamu, A., Chong, K. P., Gabda, D., Hassan, A., Abu Seman, I., et al. (2022). A review of factors affecting Ganoderma basal stem rot disease progress in oil palm. Plants 11 (2462), 2462. doi:10.3390/plants11192462
Krizhevsky, A., Sutskever, I., and Hinton, G. E. (2012). Imagenet classification with deep convolutional neural networks. Adv. neural Inf. Process. Syst. 25, 1097–1105.
Lee, C. C., Koo, V. C., Lim, T. S., Lee, Y. P., and Abidin, H. (2022). A multi-layer perceptron-based approach for early detection of BSR disease in oil palm trees using hyperspectral images. Heliyon 8 (4), e09252. doi:10.1016/j.heliyon.2022.e09252
Liaghat, S., Ehsani, R., Mansor, S., Shafri, H. Z., Meon, S., Sankaran, S., et al. (2014). Early detection of basal stem rot disease (Ganoderma) in oil palms based on hyperspectral reflectance data using pattern recognition algorithms. Int. J. Remote Sens. 35 (10), 3427–3439. doi:10.1080/01431161.2014.903353
Maeda-Gutiérrez, V., Galvan-Tejada, C. E., Zanella-Calzada, L. A., Celaya-Padilla, J. M., Galván-Tejada, J. I., Gamboa-Rosales, H., et al. (2020). Comparison of convolutional neural network architectures for classification of tomato plant diseases. Appl. Sci. 10 (4), 1245. doi:10.3390/app10041245
Murphy, D. J., Goggin, K., and Paterson, R. R. M. (2021). Oil palm in the 2020s and beyond: challenges and solutions. CABI Agric. Biosci. 2, 39–22. doi:10.1186/s43170-021-00058-3
Sandler, M., Howard, A., Zhu, M., Zhmoginov, A., and Chen, L. C. (2018). “Mobilenetv2: inverted residuals and linear bottlenecks,” in Proceedings of the IEEE conference on computer vision and pattern recognition, Salt Lake City, UT, 18–22 June 2018, 4510–4520.
Siddiqui, Y., Surendran, A., Paterson, R. R. M., Ali, A., and Ahmad, K. (2021). Current strategies and perspectives in detection and control of basal stem rot of oil palm. Saudi J. Biol. Sci. 28 (5), 2840–2849. doi:10.1016/j.sjbs.2021.02.016
Simonyan, K., and Zisserman, A. (2014). Very deep convolutional networks for large-scale image recognition. arXiv. doi:10.48550/arXiv.1409.1556
Szegedy, C., Liu, W., Jia, Y., Sermanet, P., Reed, S., Anguelov, D., et al. (2015). “Going deeper with convolutions,” in Proceedings of the IEEE conference on computer vision and pattern recognition, Boston, MA, 7–12 June 2018, 1–9.
Szegedy, C., Vanhoucke, V., Ioffe, S., Shlens, J., and Wojna, Z. (2016). “Rethinking the inception architecture for computer vision,” in Proceedings of the IEEE conference on computer vision and pattern recognition, Las Vegas, NV, June 26–July 1 2016, 2818–2826.
Tan, M., and Le, Q. (2019). “Efficientnet: rethinking model scaling for convolutional neural networks,” in International conference on machine learning, Long Beach, CA, 10–15 June 2016 (Cambridge, MA: JMLR), 6105–6114.
Tee, C. A. T., Teoh, Y. X., Yee, L., Tan, B. C., and Lai, K. W. (2021). Discovering the Ganoderma boninense detection methods using machine learning: a review of manual, laboratory, and remote approaches. IEEE Access 9, 105776–105787. doi:10.1109/access.2021.3098307
Yong, L. Z., Khairunniza-Bejo, S., Jahari, M., and Muharam, F. M. (2022). Automatic disease detection of basal stem rot using deep learning and hyperspectral imaging. Agriculture 13 (1), 69. doi:10.3390/agriculture13010069
Keywords: oil palm, basal stem rot, early detection, deep learning, smartphone app
Citation: Daranagama DAS and Takeuchi W (2025) Smartphone application for detecting and visualizing basal stem rot disease stages in oil palm. Front. Remote Sens. 6:1553844. doi: 10.3389/frsen.2025.1553844
Received: 31 December 2024; Accepted: 10 February 2025;
Published: 27 February 2025.
Edited by:
Cláudia Maria Almeida, National Institute of Space Research (INPE), BrazilReviewed by:
Weng Kin Lai, Tunku Abdul Rahman University of Management and Technology, MalaysiaCopyright © 2025 Daranagama and Takeuchi. This is an open-access article distributed under the terms of the Creative Commons Attribution License (CC BY). The use, distribution or reproduction in other forums is permitted, provided the original author(s) and the copyright owner(s) are credited and that the original publication in this journal is cited, in accordance with accepted academic practice. No use, distribution or reproduction is permitted which does not comply with these terms.
*Correspondence: D. A. Samitha Daranagama, c2FtaXRoYUBnLmVjYy51LXRva3lvLmFjLmpw
Disclaimer: All claims expressed in this article are solely those of the authors and do not necessarily represent those of their affiliated organizations, or those of the publisher, the editors and the reviewers. Any product that may be evaluated in this article or claim that may be made by its manufacturer is not guaranteed or endorsed by the publisher.
Research integrity at Frontiers
Learn more about the work of our research integrity team to safeguard the quality of each article we publish.