 Yongyan Su
 Di Wang4
 Bo Zhao
94% of researchers rate our articles as excellent or good
Learn more about the work of our research integrity team to safeguard the quality of each article we publish.
Find out more
ORIGINAL RESEARCH article
Front. Remote Sens., 05 March 2025
Sec. Atmospheric Remote Sensing
Volume 6 - 2025 | https://doi.org/10.3389/frsen.2025.1546565
This study investigates the performance of the Global Precipitation Measurement (GPM) satellite in comparison to the X-band Phased Array Weather Radar (XPAR) regarding precipitation measurement accuracy, focusing on radar echoes. A comparative analysis was conducted on two significant precipitation events that occurred in 2023 in Xiong’ an New Area, Hebei Province, China, utilizing data from XPAR, GPM, and ground-based observations. The results reveal that XPAR outperforms the GPM satellite in quantitative precipitation estimation, with a correlation coefficient of approximately 0.88 between XPAR data and ground observations, compared to 0.66 for GPM. Furthermore, the root mean square error (RMSE) and mean absolute error (MAE) for XPAR against ground observations were 1.2g mm and 0.64 mm, respectively, while for GPM, these values were significantly higher at 6.98 mm and 1.91 mm. findings highlight the superior capability of XPAR in accurately estimating precipitation, which is crucial for enhancing the detection and early warning of heavy rainfall events.
Weather radar is a primary tool for detecting precipitation systems; it is also one of the powerful tools for monitoring and warning of severe convective weather, including rainstorms, squall lines, hail, and tornadoes. The existing operational weather radars all adopt a mechanical scanning mode, which can perform three-dimensional scanning of weather processes by changing the azimuth and elevation angles of the radar antenna. However, the volumetric scanning mode for operations has a poor resolution in the vertical direction, and the scanning cycle is long (5–6 min). Therefore, the capabilities for monitoring, identifying, and researching the rapidly changing small-scale weather phenomena such as tornadoes and mesoscale vortexes need to be improved. On the other hand, the phased-array radar employs phased-controlled scanning and can complete an individual scan within 1 min through flexible and rapid beam switching.
As early as 2002, the phased-array radar technology was recommended by the U.S. National Radar Technology Committee as the future replacement for the U.S. WSR-88D system. In 2006, the work report of the U.S. Federal Meteorology Office also recommended phased-array weather radar technology for weather process monitoring, air traffic control, and aircraft tracking (Weber et al., 2007). In order to analyze the advantages and evaluate the benefits of phased-array weather radar technology as a potential replacement technology for WSR-88D, the U.S. established the National Weather Radar Testbed. The retired phased-array radar (SPY-1) was converted into a phased-array weather radar system with a two-dimensional scanning mode. This system was installed in Norman, Oklahoma, where observational experiments were carried out (Weadon et al., 2009). In 2016, the research scholars from the National Severe Storms Laboratory (NSSL) used WSR-88D radar data to study a tornado. They found that radar could accurately identify the vortex characteristics in tornadoes. However, when the mesocyclone was located far from the radar, the accuracy of WSR-88D detection results decreased significantly, to the point where the characteristics of vortices could not be recognized (Steve Vasiloff and NSSL/NWSWRH, 2016), and the vertical structure features were also not obvious. In the same year, Japanese researchers used the single-polarization phased-array radar to detect a precipitation event in Chiba city; the obvious vertical wind shear was observed, along with the significant vertical development echoes (Taro et al., 2016). Compared with the detection results of WSR-88D, phased-array radar can detect the rapidly changing weather system better and more accurately, and it was useful for the analysis and warning of severe convection processes. In addition, the United States also explored incorporating dual-polarization technology into phased-array antennas. This formulated the feasibility and performance index of phased-array radar to realize the multi-mission functions such as meteorological monitoring and navigation (MPAR). Meanwhile, the small phased-array radar was also used in the observation plan of Collaborative Adaptive Sensing of the Atmosphere (CASA) in the United States. This aimed to improve low-altitude detection capability. Moreover, the United States planned to complete the replacement of current mechanical scanning Doppler weather radar in 2025.
The integration of phased-array radar with dual-polarization technology is an inevitable trend in radar development as it combines the rapid scanning capabilities of phased-array radar with the detailed weather system analysis provided by dual polarization. This synergy enhances the radar’s ability to accurately monitor and predict severe convective weather events, making it a crucial advancement in meteorological technology.
In the research of dual-polarization technology, Seliga and Bringi (1976) measured rainfall intensity by alternately transmitting orthogonal horizontal and vertical polarized waves. They pointed out that the accuracy of rainfall measurement is higher than that of conventional weather radar. In 2011, the United States upgraded the Doppler weather radar WSR-88D to incorporate polarization capability. In 2013, the National Severe Storm Laboratory (NSSL) and other organizations collaborated to develop operational precipitation estimation algorithms for dual-polarization radar. They found that the dual-polarization radar can improve precipitation estimation results, but the degree of improvement was related to the radar’s distance and the influence of ice-phase particles (Luciana et al., 2013). In the late 1980s, China began applying dual-polarization technology to weather radar. The Institute of Plateau Atmospheric Physics at the Chinese Academy of Sciences in Lanzhou utilized a modified dual-linear polarization radar to conduct research on various topics, such as the scattering of different precipitation particles, attenuation correction, comparison of rainfall measurement effectiveness, and the spatial distribution of cloud particle phase states. These efforts resulted in some significant achievements (Xu et al., 1991; Liu et al., 1996; Chu et al., 1997). After 30 years of exploratory research, the detection capabilities of China’s dual-linear polarization radar have been preliminarily validated and have gradually developed into operational applications.
Based on phased-array technology, implementing dual-polarization functionality will further enhance the detection capabilities of phased-array radars. Polarization phased-array weather radars combine the rapid scanning advantages of phased-array radars with the ability of dual-polarization radars to obtain rich detection information about weather systems. As a result, dual-polarization phased-array weather radars can detect the complete and detailed internal structure of weather systems and analyze micro-physical information such as the shape, phase state, and size distribution of precipitation particles. Consequently, this can improve the monitoring capability of small- to medium-scale severe convective weather systems and improve forecasting and early warning times.
However, due to the inherent characteristics of ground-based dual-polarization radar detection, its observation of precipitation is considered an indirect observation, especially in the mountainous regions with complex terrain, where it can be impacted and limited by environmental factors, often leading to larger errors (Zhuang, 2013). Conducting joint comparative observations using other methods in the same spatial and temporal context allows for an in-depth analysis of the detection characteristics of dual-polarization radar for summer clouds and precipitation. This can help identify potential issues with the dual-polarization radar, verify the accuracy and reliability of its data, and play a significant role in improving its performance. At the same time, the radar stations participating in the radar network often experience inconsistencies in observational data due to various influencing factors. By combining observations and conducting comparative quantitative analysis, it is possible to effectively optimize and correct the radar products, thereby improving the overall precipitation observation capability.
Therefore, this study introduces emerging space-borne radar technology from the international community to improve the precipitation observation capabilities of ground-based X-band phased-array dual-polarization radars. Among the satellites equipped with precipitation radars, the most representative in recent years are the Tropical Rainfall Measuring Mission (TRMM) and the Global Precipitation Measurement (GPM), both of which are jointly developed and designed by NASA and JAXA (Japan Aerospace Exploration Agency).
The TRMM primarily monitors and studies precipitation in tropical regions. The satellite was launched by Japan on 28 November 1997, and it is a low-Earth orbit satellite, covering the range from 35°N to 35°S. It is the first meteorological satellite dedicated to observing tropical and subtropical precipitation. The satellite is equipped with sensors such as the microwave imager (TMI), precipitation radar (PR), visible and infrared radiometer (VIRS), lightning imaging sensor (LIS), and Clouds and the Earth’s Radiant Energy System (CERES) (Kummerow et al., 1998). In particular, the PR on board features a ground-breaking design that can provide the three-dimensional structure of heavy rainstorms and significantly improve the accuracy of precipitation estimates. Due to fuel depletion, the satellite ceased operational services in April 2015.
The GPM mission is the successor to the TRMM satellite precipitation program, the core-satellite launched in February 2014. It operated at an orbital altitude of 407 km with a period of 93 min. GPM utilizes more advanced instruments, including the GPM microwave imager (GMI) and the dual-frequency precipitation radar (DPR), which provide a more precise calibration reference for multi-satellite precipitation retrievals. The coverage extends from 65°N to 65°S, fully encompassing the entire territory of China. GPM expands upon TRMM’s sensor payload, and the DPR is the world’s first space-borne precipitation radar equipped with both Ka- and Ku-band frequencies (Hou et al., 2014). Due to the lower detectable minimum echo intensity in the Ku-band and high-sensitivity interleaved sampling in the Ka-band, GPM improves the capability to observe precipitation particle size, shape, and distribution. This enhances the observation of the microstructure of precipitation and helps distinguish between rain and snow regions. Additionally, it can provide important precipitation characteristics, such as intensity, water flux, and total precipitation; this, in turn, improves the accuracy of precipitation estimations.
For this study, the primary advantage of the GPM satellite lies in its ability to provide three-dimensional precipitation observations, enhancing the detection capabilities, especially in mid-high latitude regions. The GPM satellite’s DPR includes both Ku- and Ka-band radars, which significantly improve the sensitivity and precision of precipitation measurements compared to its predecessor, the TRMM satellite. Furthermore, the GPM satellite’s data products have demonstrated high observational accuracy compared with precipitation sensor observations from ground meteorological stations, particularly in the eastern region of China (NASA, 2025).
When integrating GPM satellite data with X-band radar data, it is noted that the GPM satellite provides data with a large spatial coverage but at a lower resolution, whereas the X-band radar offers higher-resolution local precipitation information. Therefore, in the process of data fusion, this study employed detailed and appropriate interpolation and calibration methods to ensure the effective integration of the two types of data, thereby enhancing the accuracy of precipitation estimation. Additionally, the applicability of GPM satellite data varies across different regions and precipitation intensities (Lijuan et al., 2022), and this study has also addressed and explained these issues.
In order to further analyze the quantitative precipitation estimation capabilities of XPAR and GPM, this paper compares their quantitative precipitation estimation results at low-altitude levels. This initiative aims to enhance the monitoring and early warning capabilities for heavy precipitation events.
The observation equipment used in this paper is as follows: 1) three X-band phased-array weather radars ([38.7733°N, 115.9461°E], [39.0424°N, 116.2838°E], and [39.0876°N, 115.7656°E]) were set up in the Xiong’an New Area in Hebei Province in China. Due to the potential impact of complex terrain on the detection accuracy of XPAR, this paper chose the relatively flat Xiong’an New Area to reduce this influence. The radars adopt an azimuthal spacing of 1.3° and an elevation angle spacing of 1.6°, with an elevation range from 0 to 72°. It can complete one volumetric scan in 30 s. It has a radial resolution of 30 m and a detection range of 46.5 km. 2) The GPM precipitation satellite has a spatial resolution of 5 km and a vertical resolution of 125 m, and it can completely cover the entire territory of China. The GPM is equipped with a DPR, which consists of two parts: the Ku-band precipitation radar (Ku-PR) and the Ka-band precipitation radar (Ka-PR). Ku-PR operates at 13.6 GHz, while Ka-PR operates at 35.5 GHz. These two radars can provide three-dimensional structural and characteristic measurement data on precipitation. XPAR is a three-networked phased-array radar in the Xiong’an New Area, which has been calibrated and put into operation, and the radar itself uses an adaptive constraint attenuation correlation method. Hence, there is no need to carry out repetitive attenuation correction, and the data are reliable. Precipitation detection mainly refers to precipitation reflectance; the radars can achieve good detection accuracy if they can be properly calibrated, and the stability of the radar frequency can be ensured. Figure 1 shows the relative position of the three radars, and this paper uses observations from surface rain gauges equipped in the Xiong’an New Area as essential ground verification references. The information on the ground meteorological observation station rain gauge data used in this paper is shown in Table 1. The latitude and longitude range of the ground meteorological stations with rain gauges selected in this study is consistent with the range shown in the mapping presented later in the text.
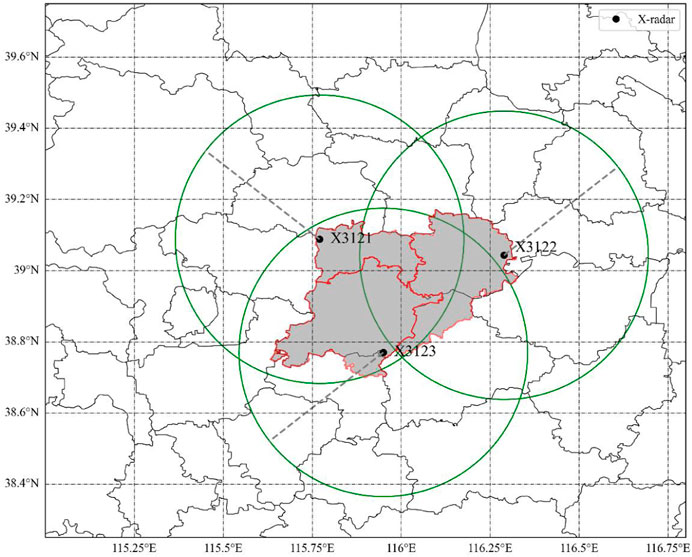
Figure 1. XPAR distribution and coverage in the Xiong’an New Area (the shaded area).
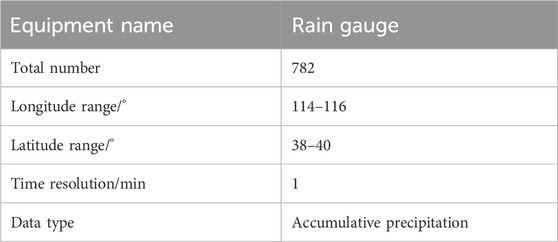
Table 1. Rain gauge data information.
The three XPAR radars are deployed in a network configuration. However, due to the need for temporal and spatial matching with GPM, this study did not mosaic the data from the three radars. Furthermore, these three radars are operational radars. They are equipped with built-in quality control algorithms that process the raw radar echo data. After undergoing clutter filtering, ground clutter removal, sea clutter removal, clear-air echo removal, velocity de-aliasing, neighboring radar echo verification, and attenuation correction, reliable data are obtained. Therefore, researchers do not need to perform additional work related to these processes.
The main performance index of XPAR is shown in Table 2. During this field experiment period, XPAR completes a volumetric scan in 1 minute. Then, uniformly distributed data from 48-layer elevation scanning can be obtained, which allows for the most balanced spatiotemporal resolution.
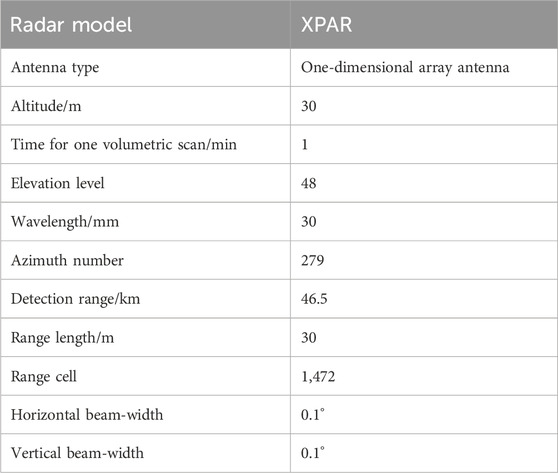
Table 2. Main technical parameters of XPAR.
Table 3 shows the main performance of GPM. It has 0.125 km vertical resolution and 5 × 5 km horizontal resolution, and it can effectively detect the precipitation conditions in the study area.
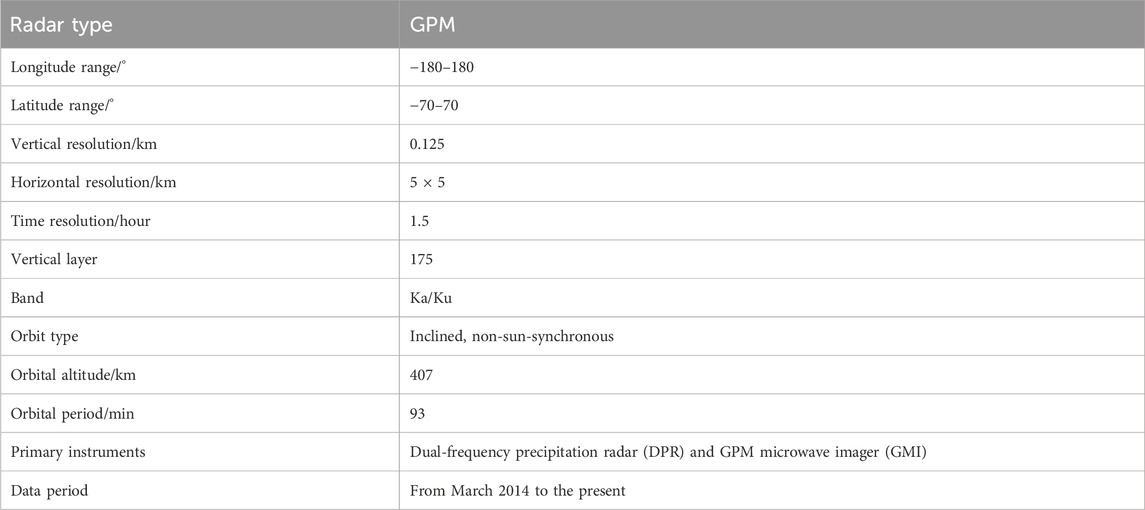
Table 3. Main technical parameters of GPM.
According to the technical manual provided by the manufacturer, the rain intensity attenuation of XPAR is shown in Table 4. It can be observed that the attenuation of X-band radar is extremely serious when the reflectivity factor exceeds 55 dBz. The minimum detectable echo intensity is 10 dBz at a distance of 10 km from the radar. If the measurable signal is lower than this value, the radar will not be able to detect useful signals.
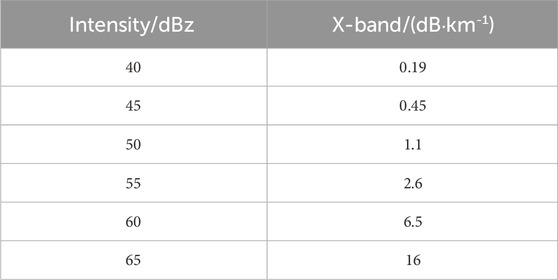
Table 4. Attenuation of X-band radar under different rain intensity conditions.
The space–time matching for GPM and XPAR, according to the starting and ending times of satellite transit in the Xiong’an New Area, allows the determination of the XPAR data. Since the space-borne radar aims at the observation target from a top–down perspective, while ground-based radar scans the weather target using plan position indicator (PPI) or range height indicator (RHI) modes, there is a noticeable difference in the range coverage of the two radars at the intersection of their beams. The difference in resolution and viewing angle will lead to inconsistencies in the observation space, which can introduce errors when directly comparing space-borne radar with ground-based radar point-by-point. Therefore, it is necessary to perform spatial matching of observations from the two types of radars. In this paper, bi-linear interpolation is used to grid the reflectivity data from the DPR radar into the same three-dimensional Cartesian coordinate system as XPAR, which ultimately achieves more accurate spatiotemporal matching results.
In the aspect of precipitation intensity estimation, this paper utilizes the relationship between radar reflectivity factor (Z) and precipitation rate (R) to invert precipitation. The Z–R relationship is usually expressed as a simple mathematical Formula 1, which is as follows:
where R represents the precipitation rate, Z represents the radar reflectivity factor, and a and b are constants. In this paper, the value of a is 300 and the value of b is 1.4. Using this method, we are able to estimate the precipitation amount in specific areas.
In order to analyze the echo intensity of the two radars at different altitude layers, first, spatiotemporal matching of the two types of radar data is performed to ensure consistency in time and space. Second, based on the XPAR (X3122) radar’s scanning range, the GPM satellite data within the radar’s coverage data are selected. Finally, the filtered GPM satellite data are extracted and compared with the XPAR (X3122) radar data for analysis. The evaluation metrics include five indicators, namely, correlation coefficient (CC), mean absolute error (MAE), root mean square error (RMSE), relative mean bias error (RMBE), and relative root mean square error (RRMSE), which objectively reflect the differences in the echo intensity between the two radars at different altitude levels. The definitions of the three evaluation metrics are as follows:
The correlation coefficient (CC), also known as the coefficient of determination, is used to measure the degree of correlation between two variables. Its value ranges from 0 to 1, with values closer to 1 indicating a stronger linear correlation and greater consistency between the two variables. The Formula 2 for CC is typically given as follows:
RMSE is the square root of the sum of squared differences between two variables; it is mainly used to measure the degree of deviation between the two variables. The smaller RMSE indicates a smaller deviation between the two variables, indicating higher accuracy between them. It is calculated as follows (Formula 3):
MAE is a commonly used regression evaluation metric. It can measure the average absolute error between two variables. The smaller MAE indicates that the two variables are closer to each other. The formula 4 for calculating MAE is as follows:
RMBE is a metric used to measure the average bias in predictions relative to the actual values. It provides insights into the systematic overestimation or underestimation of a model’s predictions. The RMBE is calculated as the ratio of the MBE to the mean of the actual values. The Formula 5 for calculating RMBE is as follows:
RRMSE is a measure of the average magnitude of the errors in a set of predictions, normalized by the mean of the actual values. It provides a relative measure of the accuracy of the predictions, making it useful for comparing models across different scales. The RRMSE is calculated by dividing the RMSE by the mean of the actual values. The Formula 6 for calculating RRMSE is as follows:
Here,
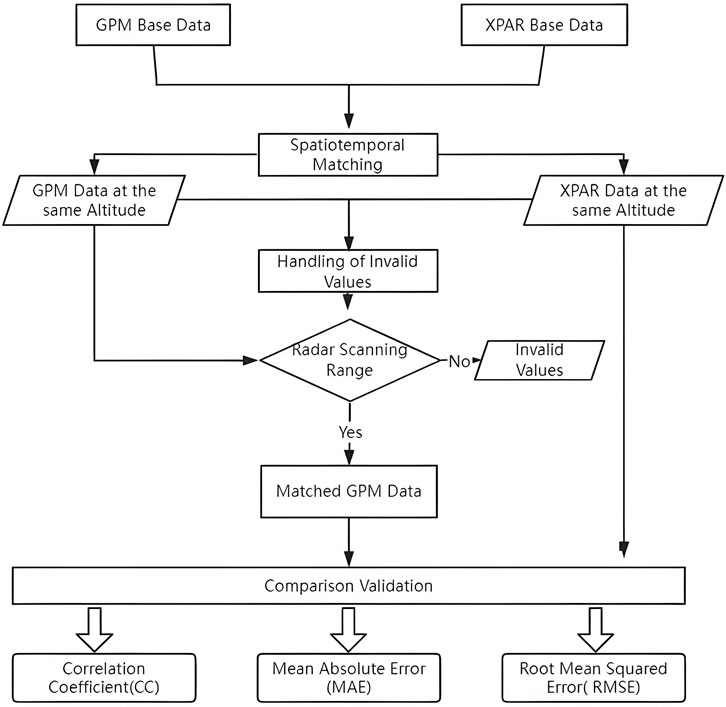
Figure 2. Comparison flowchart of radar intensity at different heights from GPM and X3122 XPAR radars.
The precipitation from the ground meteorological stations in Hebei Province is taken as the true value of precipitation, which is used to evaluate the effectiveness of radars’ quantitative precipitation estimation. The comparison analysis process is shown in Figure 3.
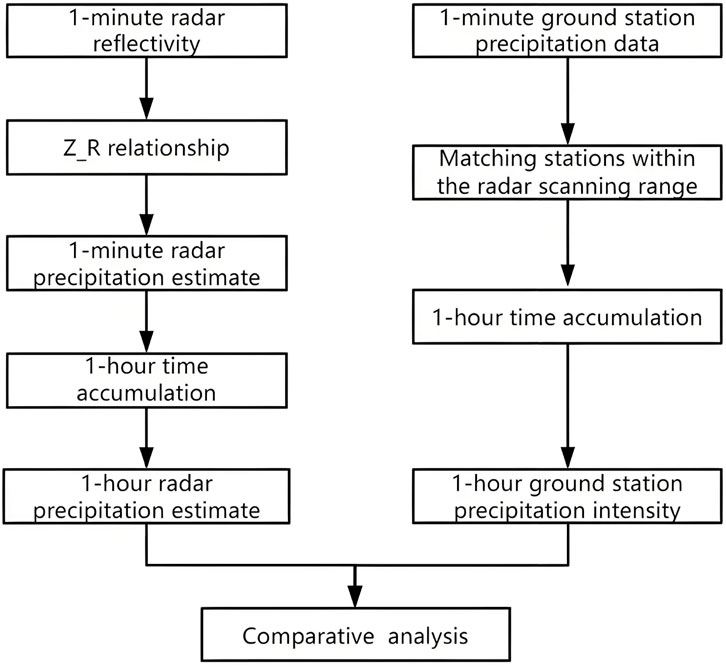
Figure 3. Comparison analysis process of radar and ground station precipitation data.
The Ku/Ka radars of the DPR on the GPM satellite provide both single- and dual-frequency precipitation estimates; they include three main types of precipitation products, which are derived from the wideband (245 km) Ku-band frequency, the narrowband (125 km) Ka-band frequency, and the narrowband dual-frequency. The results from the Ka-band are further divided into standard and high-sensitivity estimates.
In this paper, the Level 2 (L2) product from the GPM satellite is utilized, taking a single precipitation event at 00:59:00 on 21 July 2023, in the Xiong’an New Area, Hebei Province, as an example. Some schematic diagrams of the products in the study area are shown in Figure 4. Figure 4A displays the satellite scan area (gray area) and the vertical cross sections (black lines) indicated by the horizontal coordinates in the subsequent figures. Due to the relatively coarse resolution, interpolation is necessary when conducting spatiotemporal matching with XPAR (Figure 4A). The 0°C layer and the bright band of this precipitation process are located between 4 and 5 km (Figures 4B, E). The distribution characteristics of the droplet size and droplet number are shown in Figures 4C, D. The maximum near-surface precipitation rate exceeds 15 mm per hour, and the vertically accumulated precipitation amount is greater than 55 kg per square meter (Figure 4F).
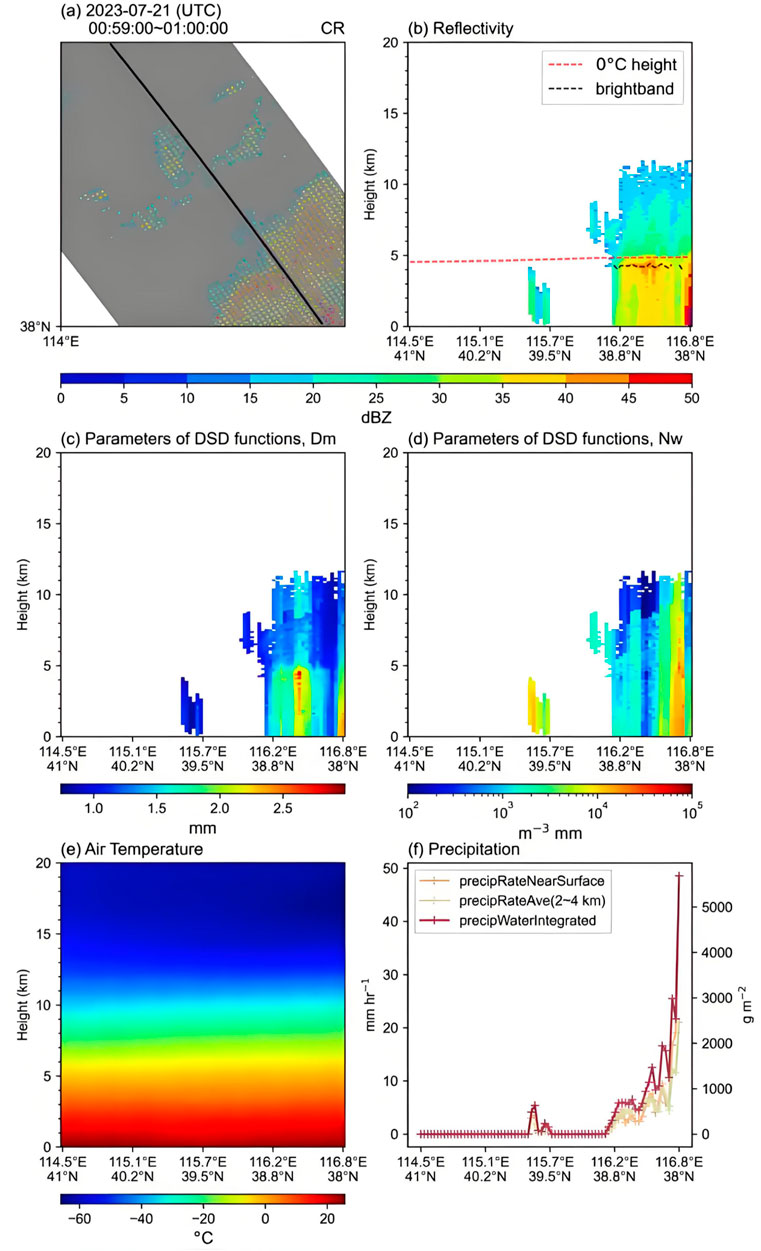
Figure 4. Composite reflectivity(A), vertical structure of reflectivity; 0°C height and bright band (B), DSD parameter (C, D), air temperature (E), and precipitation intensity (F) from GPM at 00:59:00 on 21 July 2023.
After spatiotemporal matching, GPM and XPAR detect the radar reflectivity echo of the precipitation process at 2 km height (Figure 5). According to the reflectivity echo structure from two radars, the echo structure at most coordinate points is very similar. Therefore, the spatiotemporal matching method is feasible. However, because the resolution of GPM is relatively lower than that of XPAR, it is likely to generate errors during spatiotemporal matching. In order to ensure the authenticity of data, no interpolation is applied to the GPM data. The figure explains that although the echo structures at some coordinate points of the two radars are similar, there is a slight positional deviation. GPM has difficulty detecting weak echoes below 15 dBz, whereas the XPAR radar provides more detailed detection.
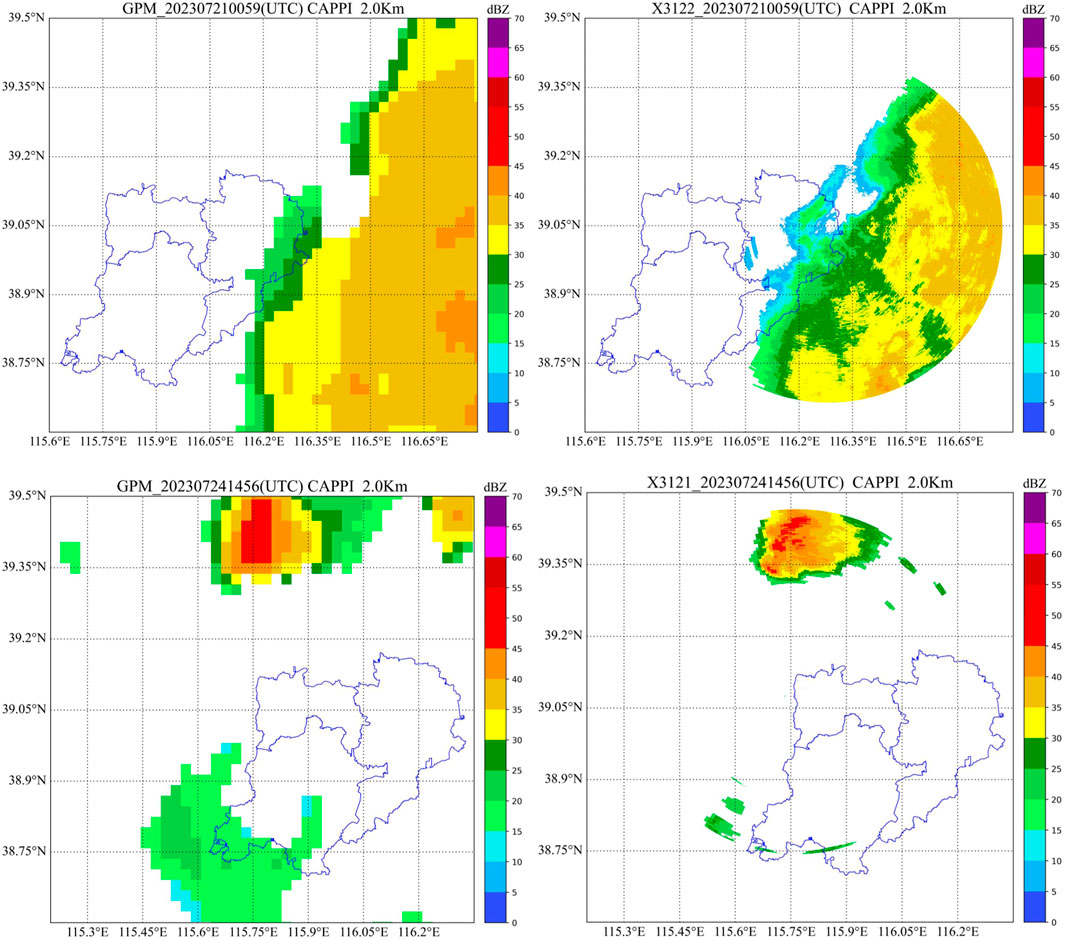
Figure 5. Echo at 2-km altitude from GPM (left) and XPAR (right) at 00:59:00 on 21 July (top) and 14:56:00 on 24 July (below) 2013.
In order to further verify the spatiotemporal matching results between GPM satellite and XPAR radar, this study continues to analyze the vertical profile structure of the radar echoes. Considering that the scanning range of the satellite is larger than that of the ground radar, the two points selected for vertical profile analysis of both radars are within the ground radar’s scanning range. Additionally, the line connecting the two points can capture radar echoes of different intensities. Therefore, the reflectivity data along the line connecting the two positions at the center of radar scanning (116.29°E, 39.04°N and 116.65°E, 38.90°N) are used for vertical profile analysis.
Figure 6 displays the vertical profile between the above two points of the two radars at 00:59:00 on 21 July 2023. It can be observed that the echo structures of the two radars are similar, the core height of the echoes roughly ranges from 4 km to 5 km, and the echo intensities are relatively consistent. Comparing the vertical profiles of GPM and XPAR, it is found that the height of the strong echo center of GPM is mainly concentrated at approximately 4 km; most of the strong echoes are concentrated at the low layer (0–1 km); and XPAR can detect the weak echo below 15 dBz.
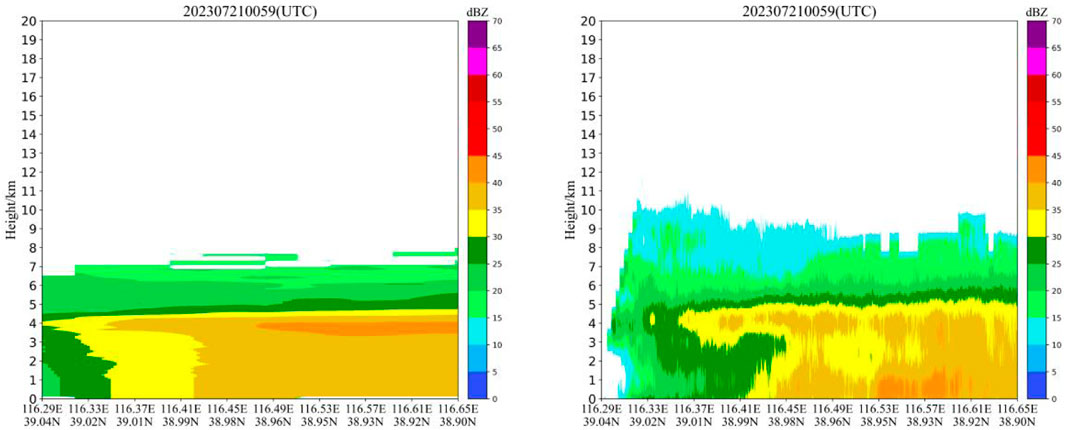
Figure 6. Echo from GPM (left) and XPAR (right) at 00:59:00 on 21 July 2023.
The vertical profile echo between two points from two radars at 14:56:00 on 24 July 2023 is shown in Figure 7. From the figure, it can be observed that the echo structure of the two radars is similar, with the core echo height roughly between 6 and 7 km, and the echo intensity is relatively consistent. Comparing the vertical profiles of the GPM and XPAR radars, it displays that the strong echo center of the GPM is mainly concentrated at 0–3 km, while that of the XPAR radar is primarily concentrated at 0–5 km.
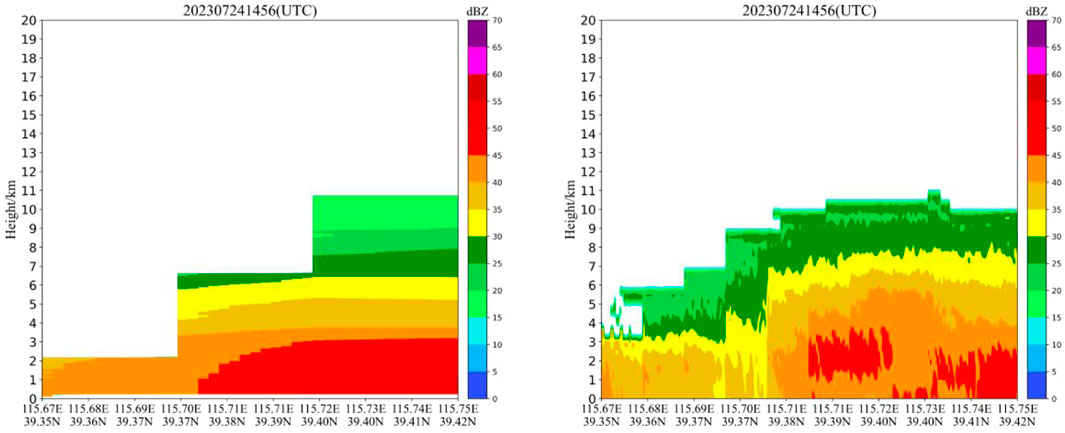
Figure 7. Echo from GPM (left) and XPAR (right) at 14:56:00 on 24 July 2023.
After qualitative analysis of radar echoes at different altitude layers of 500 m, 1 km, 2 km, 3 km, 4 km, and 5 km for the two types of radars, Figure 8 illustrates that the radar echoes are all concentrated in the east part of the Xiong’an New Area in Hebei Province. At 00:59:00 on 21 July, the radar echoes with an intensity above 25 dBz occurred in the southeastern part of the Xiong’an New Area. At this time, a small amount of precipitation was observed in the area around Xiong’an. In general, the structure of radar echoes from GPM and XPAR is similar, but XPAR can detect weak echoes below 15 dBz, while GPM has difficulty in observing weaker echoes due to its coarse resolution. Meanwhile, it can be observed that there are some differences in radar echo performance between GPM and XPAR radar at 4 km altitude. This means that GPM observes strong echoes in the eastern and southeastern parts of the Xiong’an New Area, and the echo intensity can reach above 40 dBz, while the echo intensity observed by XPAR is above 35 dBZ.
Figure 8. Echo intensity at different heights from GPM and XPAR (X3122) radar at 00:59:00 on 21 July 2024.
Figure 9 shows that both the echoes of GPM and XPAR are concentrated in the northern and southwestern regions of the Xiong’an New Area at 14:56:00 on 24 July; the radar echoes with a maximum intensity exceeding 50 dBZ occur in the northern region of the Xiong’an New Area; and the intensity of radar echoes exceed 20 dBZ in the southwestern part. At this time, precipitation can be observed around the Xiong’an New Area. Generally, the radar echoes of GPM and XPAR have the same structure in the study area; however, the XPAR radar does not detect echoes from the southwestern part. It is speculated that it is because the precipitation area is relatively far from the radar. Therefore, this leads to the radar’s weaker ability to receive weak echo signals at greater distances.

Figure 9. Echo intensity at different heights from GPM and XPAR(X3122) radar at 14:56:00 on 24 July 2024.
By filtering the GPM radar data, the filtered GPM satellite data are compared and analyzed with the XPAR (X3122) radar data. Figures 10, 11 show the comparison consistency chart for the echo intensity from the two radars on 21 and 24 July 2024. It can be observed from Figure 10 that the correlation coefficients (CCs) between them show an increasing trend at the heights of 500 m, 1 km, 2 km, and 3 km, and the RMSE and MAE decrease with increasing height. As the height increases, the consistency of the data from both radars also improves, and the deviations decrease. However, the correlation can reach 0.83 at a height of 4 km, and RMSE and MAE values are 9.71 and 6.18, respectively. It means the correlation increases and the error becomes larger. These characteristics can be confirmed in the echo image from GPM and XPAR at the 4-km height. Figure 11 also displays the same characteristics as Figure 10.
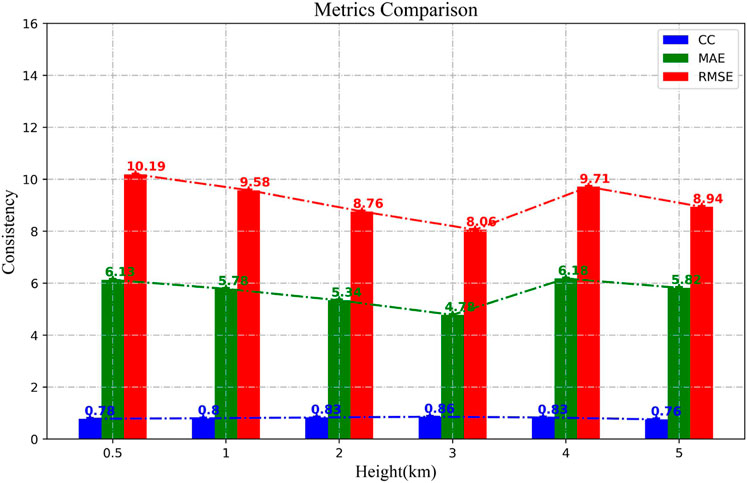
Figure 10. Echo intensity consistency comparison at different heights from two radars at 00:59:00 on 24 July 2024.
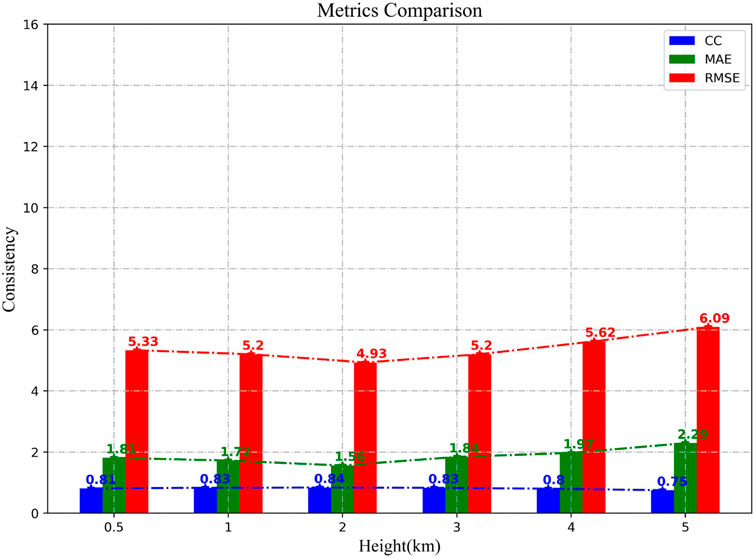
Figure 11. Echo intensity consistency comparison at different heights from two radars at 14:56:00 on 21 July 2024.
The results indicate that when conducting a comparative analysis of precipitation data from the two radars with that of the ground observation stations, it is important to consider not only the reflectivity data from the ground radar but also the reflectivity data from the two radars that exhibit better consistency and smaller errors. Therefore, using data at an altitude of 1 km for comparing precipitation data from the two radars with ground observation stations will yield better results than using reflectivity data at an altitude of 500 m.
Figure 12 shows the precipitation from radar XPAR (the above figure) and ground observation station (the middle figure) on 21 July 2023. It can be observed that the precipitation estimated by the radar data and observed at the ground observation stations displays a generally consistent trend. The areas of peak precipitation are mostly similar and mainly located in the southeastern region. From the scatter plot of 1-h accumulated precipitation data from the radar and the ground observation stations during this precipitation event, it can be observed that the correlation coefficient between the radar’s 1-h precipitation estimation and the ground observation stations’ hourly precipitation was approximately 0.879. This illustrates a strong correlation between the two types of precipitation data, suggesting that the radar data have higher accuracy. RMSE, MAE, RRMSE, and RMBE are used to analyze the accuracy of radar precipitation estimation. The values of RMSE, MAE, RMBE, and RRMSE are 1.201, 0.644, −0.002, and 0.55, respectively. During the precipitation event, the XPAR radar slightly underestimated the 1-h accumulated precipitation, but it can still provide a good estimation of precipitation for observation stations and serve as a valuable supplement for precipitation monitoring in areas without ground observation stations.
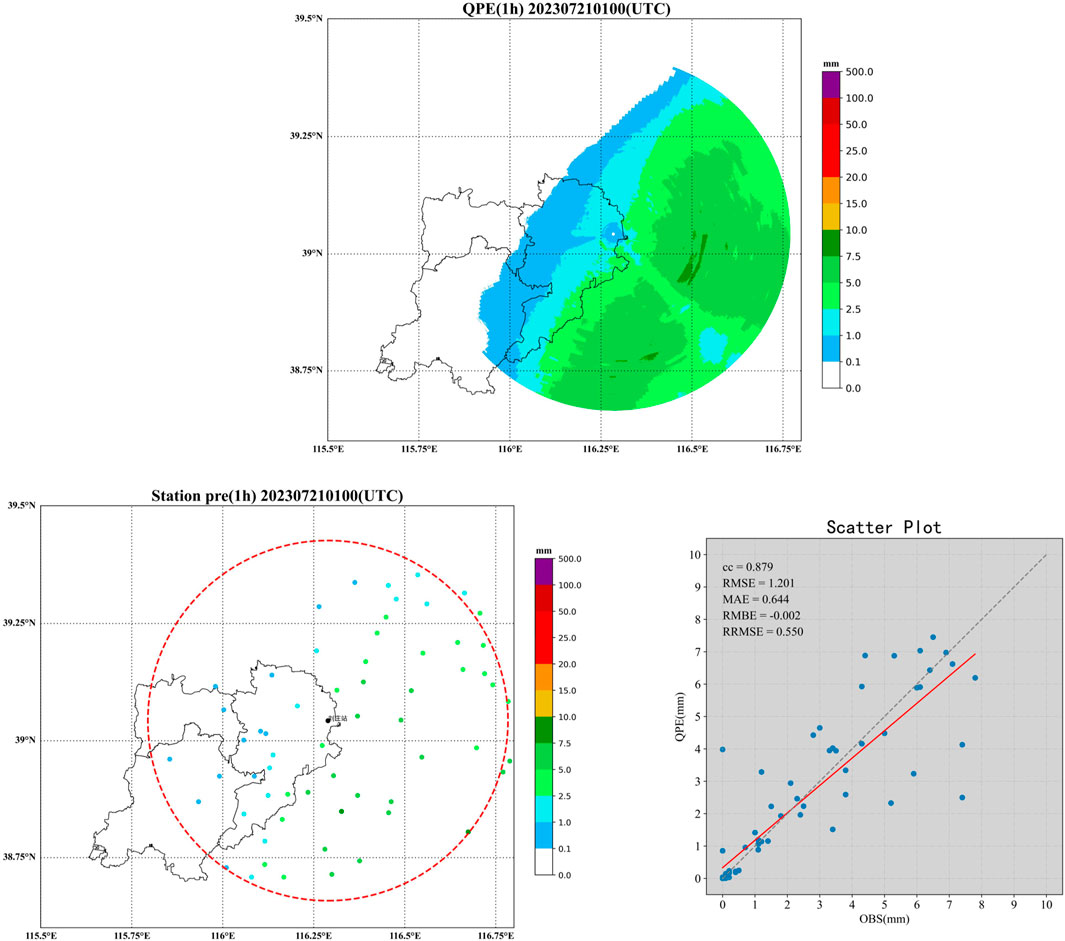
Figure 12. 1-h accumulated precipitation from XP3122 (above) and ground observation stations (middle) and the scatterplot of XP3122 and ground observation stations at 00:59:00 on 21 July 2023.
Figure 13 shows the observation results of XPAR radar (the top figure), precipitations on 24 July from ground observation stations (the middle figure), and the 1-h accumulated precipitation from radar XPAR estimation and ground observation stations (the below figure). The correlation can reach approximately 0.665. The values of RMSE, MAE, RMBE, and RRMSE are approximately 6.964, 1.920, −0.456, and 3.186, respectively. Compared with the precipitation case on 21 July, the results are similar, but radar detection is slightly lower. This may be related to the precipitation points being far from the radar. Compared to Figure 12, the precipitation event in Figure 13 is farther from the radar, and the distribution of ground meteorological observation stations around the radar is also relatively sparse. In general, as the distance increases, the radar’s detection accuracy decreases because factors such as signal attenuation and changes in atmospheric conditions can affect the radar’s reflectivity measurements.
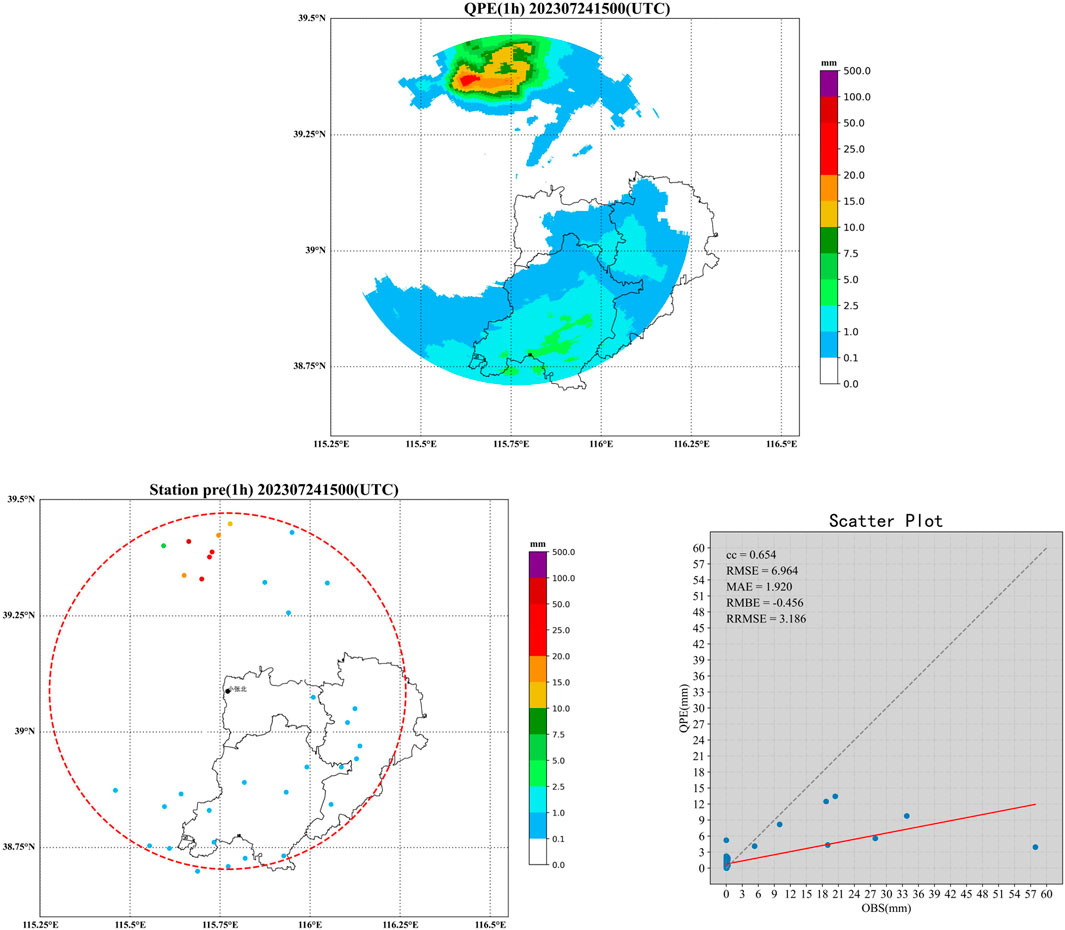
Figure 13. 1-h accumulated precipitation from X3122 (above) and ground observation stations (middle) and the scatterplot of X3122 and ground observation stations at 14:56:00 on 24 July 2023.
In order to assess the effectiveness of GPM for precipitation estimation, the minute-by-minute precipitation data from the ground observation station of Hebei Province are used as the true value of precipitation.
As shown in Figure 14, from the precipitation event on 21 July 2023, it can be observed that the precipitation estimated by the GPM satellite data shows a variation trend essentially the same as that of the ground observation stations’ precipitation data, and the results are basically consistent with those of radar observations. The correlation between the precipitation estimates from GPM satellite observations and one-hourly precipitation data from ground observation stations is 0.635, which indicates a strong positive correlation. This means that the precipitation estimation of the GPM satellite can reflect the actual precipitation conditions observed at ground stations and provide a reliable reference for precipitation monitoring and forecasting. To more comprehensively evaluate the accuracy of the precipitation estimation from the GPM satellite, RMSE, MAE, RMBE and RRMSE are further calculated. The values of RMSE, MAE, RMBE, and RRMSE are 5.042, 1.528, −0.342, and 2.169, respectively; the relatively low values of these indicators further confirm the accuracy of the GPM satellite in estimating precipitation amounts.
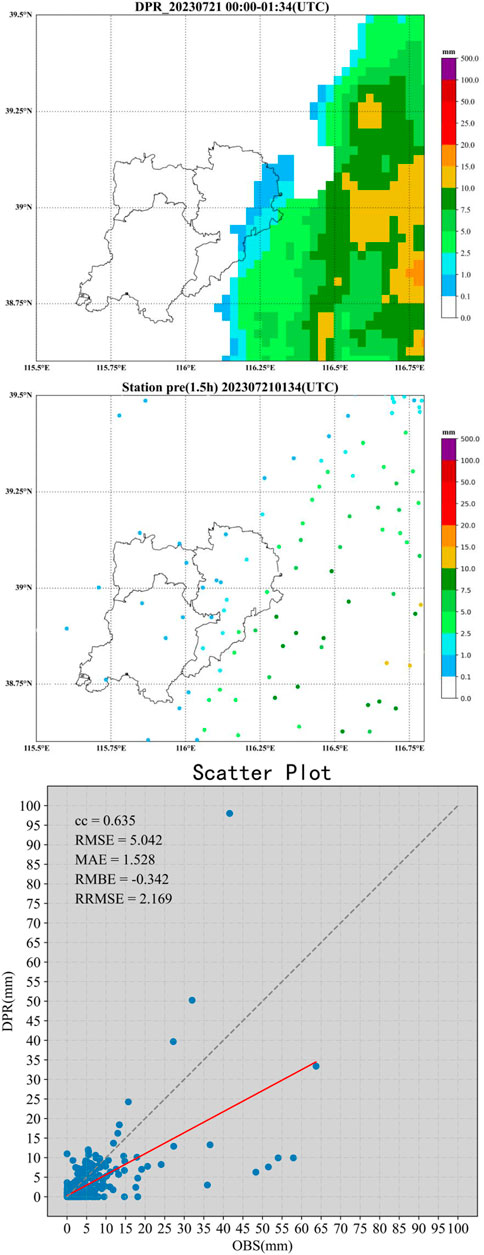
Figure 14. Scatterplot of cumulative precipitation in 1.5 h at GPM 1-km altitude on 21 July 2023 at 01:30:00 (above), cumulative precipitation in 1.5 h at ground observation stations (middle), and GPM and ground observation station observation results (below).
Figure 15 shows the precipitation estimated by GPM and observed by ground stations on 24 July, along with the scatterplot distribution of the two types of data. From the figure, it can be observed that the correlation is approximately 0.572. The values of RMSE, MAE, RMBE, and RRMSE can reach approximately 9.079, 4.055, 0.015, and 2.159, respectively. The GPM detection is slightly lower. This result is similar to the precipitation case on 21 July. The deviation may be caused by multiple factors, including the effects of wind speed, wind direction, radar sensitivity, the observation method, attenuation, and surface conditions on precipitation observations. When using GPM satellite data for precipitation monitoring and forecasting, it is necessary to consider these potential errors and apply corresponding corrections to improve the reliability of the estimation results.
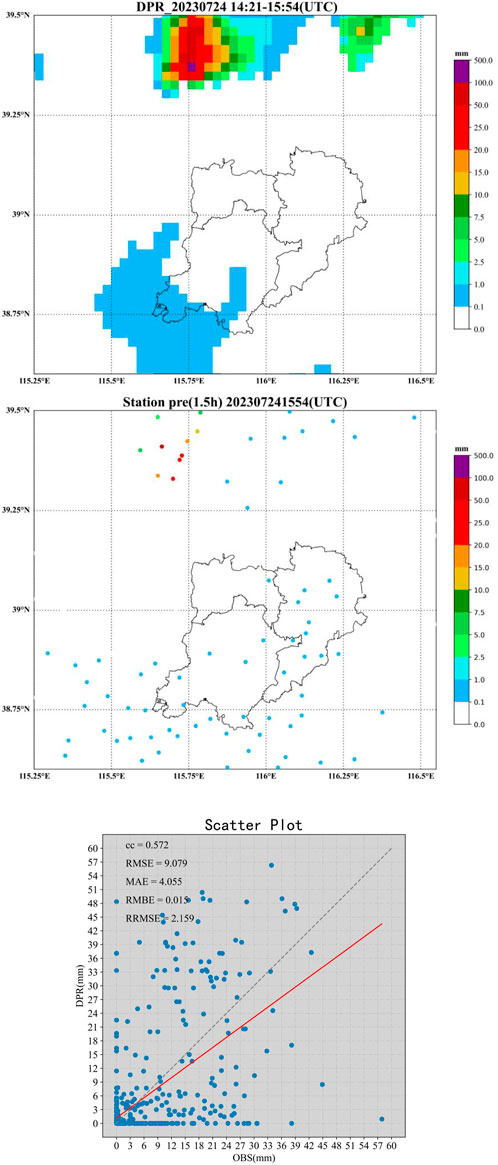
Figure 15. Scatterplot of cumulative precipitation over 1.5 h at GPM 1-km altitude on 24 July 2023 at 15:54:00 (above), cumulative precipitation over 1.5 h at ground observation stations (middle), and GPM and ground observation station observation results (below).
Table 5 provides the list of the evaluation metrics for GPM and XPAR for two precipitation events. In general, both XPAR and GPM can estimate the sites’ precipitation conditions to a certain extent. They play a supplementary role in precipitation monitoring areas without ground observation stations. However, it can be clearly observed from the scatterplot that all three evaluation indicators of XPAR are superior to those of GPM. Therefore, XPAR’s detection performance for precipitation is superior to that of the GPM satellite. From the XPAR radar echoes, more detailed vertical structures and more precise variations can be observed.
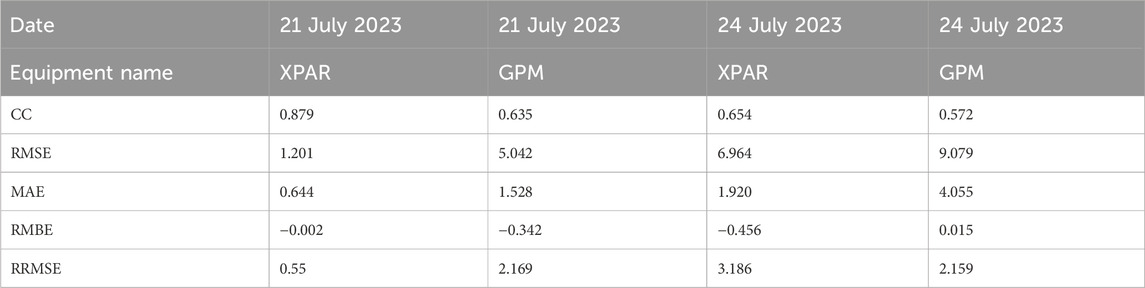
Table 5. Evaluation metrics.
This study integrates data from XPAR radar, GPM satellite, and ground observation stations to comparatively analyze two precipitation events that occurred in the Xiong’an New Area, China, in 2023. The findings reveal that both XPAR radar and GPM satellite can effectively identify precipitation events, although GPM encounters difficulties in observing weak echoes below 15 dBz. Both systems are capable of observing the vertical structures of precipitation echoes with relative clarity. However, within the lower altitude layers, the radar provides more detailed vertical echo structures, enabling better discrimination of temporal changes in the precipitation process.
In regions with a vertical height below 4 km, the correlation between GPM and XPAR echo intensities is strong. Nevertheless, above the 4-km height layer, as height increases, the correlation between the echo intensity of the two systems weakens, and the error increases. When comparing radar and satellite data with ground station precipitation data, the precipitation observed by the radar is slightly lower than that observed by the ground stations, attributed to the impact of radar attenuation. Despite the radar’s use of an adaptive constraint attenuation correction algorithm to account for attenuation, the results remain underestimated. Upon comparing the correlation coefficient, root mean square error, and mean absolute error between the two systems and the ground station precipitation data, XPAR radar outperforms the GPM satellite in all three indicators. When comparing the RMBE and RRMSE of the two radars, it was found that for the precipitation event on 21 July, the two evaluation indicators of XPAR were significantly lower than those of GPM, which was consistent with expectations. However, for the precipitation event on 24 July, the two evaluation indicators of XPAR were slightly higher than those of GPM. It is speculated that this may be related to the distance of the precipitation points from the radar. GPM provides precipitation estimates that are more representative of regional averages; hence, the accuracy gap between different precipitation events is relatively small. In contrast, XPAR tends to produce larger errors when estimating precipitation for events that are farther away from the radar. Therefore, collecting more precipitation events that are evenly distributed around the radar will be a top priority in future work.
Therefore, XPAR has demonstrated significant potential in precipitation monitoring and early warning due to its high spatiotemporal resolution and rapid scanning technology. Its high spatiotemporal resolution allows XPAR to observe the evolution of precipitation events more precisely, capturing small-scale weather systems that are difficult for traditional radars to detect.
Due to the requirement for spatiotemporal matching of GPM satellite data during specific rainy weather conditions over the study area, only two well-matched precipitation events identified in the paper were found during the 2022 and 2023 rainfall periods in the region. Continued monitoring of precipitation processes in this area is planned, with the aim to incorporate more cases in future research within this field.
This paper has researched and explored the capabilities of two advanced radar technologies in quantitative precipitation estimation. The results indicate that XPAR radar surpasses the GPM satellite in terms of correlation coefficient, root mean square error, and mean absolute error compared to ground station precipitation data, demonstrating its potential in precipitation monitoring and early warning.
Overall, X-band phased-array radar and the GPM precipitation satellite each have unique advantages in quantitative precipitation estimation. The X-band phased-array radar features high spatiotemporal resolution and dual-polarization technology, enabling precise monitoring of local heavy precipitation events and capturing the rapid changes and complex structures of precipitation. Its fast scanning capability allows it to detect the initial development of heavy precipitation in a timely manner, providing ample time for early warnings. On the other hand, the GPM precipitation satellite, through the fusion of multiple sensors, offers global precipitation data, effectively supplementing precipitation information in areas with sparse ground observation stations. Its long-term data series are useful for analyzing the long-term trends of precipitation events, providing an important basis for the establishment of early warning models.
By combining the high-precision local monitoring of X-band phased-array radar with the global coverage capability of the GPM precipitation satellite, the monitoring and early warning capabilities for heavy precipitation events can be significantly enhanced. The high-resolution data from the radar can be used for detailed monitoring of the evolution of local heavy precipitation, while the global data from GPM can help understand the background and evolution trends of precipitation events on a larger scale. Additionally, GPM data can be used to calibrate and verify the precipitation estimation results from the radar, improving the accuracy and stability of precipitation estimation. This data fusion not only enhances the timeliness and accuracy of early warnings but also provides more comprehensive and reliable information support for disaster prevention and mitigation.
The data analyzed in this study are subject to the following licenses/restrictions: the dataset used in this article is from the Xiong’an Key Laboratory of Atmospheric Boundary Layer, China Meteorological Administration. Due to confidentiality regulations, the original data cannot be made publicly available. Requests to access these datasets should be directed to Yongyan Su, MTUwMjI2MTUxNzRAMTYzLmNvbQ==.
YS: conceptualization, data curation, formal analysis, methodology, project administration, supervision, validation, visualization, writing–original draft, and writing–review and editing. DW: software and writing–original draft. WK: software and writing–original draft. BZ: writing–original draft and writing–review and editing. YL: software, writing–original draft, and writing–review and editing. XC: data curation, writing–original draft, and writing–review and editing. DS: funding acquisition, writing–original draft, and writing–review and editing.
The author(s) declare that financial support was received for the research, authorship, and/or publication of this article. This research was funded by China Meteorological Administration Xiong’an Atmospheric Boundary Layer Key Laboratory, grant number No. 2023LABL-BXX; the National Natural Science Foundation of China (General Program), grant number No. 42075001; and the Hebei Natural Science Foundation, grant number D2024112003. The APC was funded by the National Natural Science Foundation of China (General Program).
The authors declare that the research was conducted in the absence of any commercial or financial relationships that could be construed as a potential conflict of interest.
The author(s) declare that no Generative AI was used in the creation of this manuscript.
All claims expressed in this article are solely those of the authors and do not necessarily represent those of their affiliated organizations, or those of the publisher, the editors and the reviewers. Any product that may be evaluated in this article, or claim that may be made by its manufacturer, is not guaranteed or endorsed by the publisher.
The statements, opinions, and data contained in all publications are solely those of the individual author(s) and contributor(s) and not of MDPI and/or the editor(s). MDPI and/or the editor(s) disclaim responsibility for any injury to people or property resulting from any ideas, methods, instructions, or products referred to in the content.
Chu, R. Z., Wang, Z. J., Liu, L. P., Jia, W., and Li, X. (1997). Preliminary analysis of rainfall estimate utilizing dual linear polarization radar. Acta Meteorol. Sin. (1), 103–109. doi:10.11676/qxxb1997.011
Hou, A. Y., Kakar, R. K., Neeck, S., Azarbarzin, A. A., Kummerow, C. D., Kojima, M., et al. (2014). The global precipitation measurement mission. Bull. Am. Meteorological Soc. 95 (5), 701–722. doi:10.1175/bams-d-13-00164.1
Kummerow, C., Barnes, W., Kozu, T., Shiue, J., and Simpson, J. (1998). The tropical rainfall measuring mission (TRMM) sensor package. J. Atmos. Ocean. Technol. 15 (3), 809–817. doi:10.1175/1520-0426(1998)015<0809:ttrmmt>2.0.co;2
Lijuan, S. H. I., Wanyue, FENG, Yong, L. E. I., Zhimin, WANG, and Qing, ZHENG (2022). Accuracy evaluation of daily GPM precipitation product over mainland China. Meteorol. Mon. 48 (11), 1428–1438. doi:10.7519/j.issn.1000-0526.2022.091601
Liu, L. P., Qian, Y. F., and Wang, Z. J. (1996). The study of spacial distribution of phase and size of hydrometeors in cloud by dual linear polarization radar (5), 590–599. doi:10.11676/qxxb1996.061
Luciana, K. C., Smith, J. A., Baeck, M. L., and Krajewski, W. F. (2013). An early performance evaluation of the NEXRAD dual-polarization radar rainfall estimates for urban flood applications. Weather Forecast. 28, 1478–1497. doi:10.1175/waf-d-13-00046.1
NASA (2025). Dual-frequency precipitation radar (DPR) | NASA global precipitation measurement mission. Available at: https://gpm.nasa.gov/missions/GPM/DPR (Accessed December 2023).
Seliga, T. A., and Bringi, V. N. (1976). Potential use of radar differential reflectivity measurements at orthogonal polarizations for measuring precipitation. J. Appl. Meteor 15 (1), 69–76. doi:10.1175/1520-0450(1976)015<0069:puordr>2.0.co;2
Steve Vasiloff (2016). WSR88D TVS Parameter Study[R]. NSSL/NWS-WRH. Available at: https://www.weather.gov/media/wrh/online_publications/talite/talite9611.pdf
Taro, K., Kazuomi, M., Osamu, S., and Hiroki, S. (2016). Rapid 3D scanning high resolution X-band weather radar with active phased array antenna. IEEE.
Weadon, M., Heinselman, P., Forsyth, D., Kimpel, J., Benner, W. E., and Torok, G. S. (2009). Multifunction phased array radar. Bull. Am. Meteorological Soc. 90 (3), 385–389. doi:10.1175/2008bams2666.1
Weber, M. E., Cho, J. Y. N., Herd, J. S., Flavin, J. M., Benner, W. E., and Torok, G. S. (2007). The next-generation multimission U.S. surveillance radar network. Bull. Amer Meteor Soc. 88, 1739–1752. doi:10.1175/bams-88-11-1739
Xu, B. X., Wang, Z. J., Cat, Q. M., Liu, L., Zhang, H., and Chu, R. (1991). Study on applications of C-band dual linear polarization radar in meteorology. Acta Meteo Sin. 5, 285–292.
Keywords: X-band phased-array weather radar, GPM satellite, precipitation, quantitative, estimation
Citation: Su Y, Wang D, Kong W, Zhao B, Liu Y, Chen X and Su D (2025) A comparative study on quantitative precipitation estimation based on GPM satellite and X-band phased-array weather radar. Front. Remote Sens. 6:1546565. doi: 10.3389/frsen.2025.1546565
Received: 17 December 2024; Accepted: 06 February 2025;
Published: 05 March 2025.
Edited by:
Xiangao Xia, Chinese Academy of Sciences (CAS), ChinaReviewed by:
Hongrong Shi, Chinese Academy of Sciences (CAS), ChinaCopyright © 2025 Su, Wang, Kong, Zhao, Liu, Chen and Su. This is an open-access article distributed under the terms of the Creative Commons Attribution License (CC BY). The use, distribution or reproduction in other forums is permitted, provided the original author(s) and the copyright owner(s) are credited and that the original publication in this journal is cited, in accordance with accepted academic practice. No use, distribution or reproduction is permitted which does not comply with these terms.
*Correspondence: Bo Zhao, Ym96aGFvLmNhQGdtYWlsLmNvbQ==
Disclaimer: All claims expressed in this article are solely those of the authors and do not necessarily represent those of their affiliated organizations, or those of the publisher, the editors and the reviewers. Any product that may be evaluated in this article or claim that may be made by its manufacturer is not guaranteed or endorsed by the publisher.
Research integrity at Frontiers
Learn more about the work of our research integrity team to safeguard the quality of each article we publish.