 Charlotte Poussin
 Pablo Timoner1,2†
 Gregory Giuliani
95% of researchers rate our articles as excellent or good
Learn more about the work of our research integrity team to safeguard the quality of each article we publish.
Find out more
ORIGINAL RESEARCH article
Front. Remote Sens. , 13 February 2025
Sec. Remote Sensing Time Series Analysis
Volume 6 - 2025 | https://doi.org/10.3389/frsen.2025.1542181
Despite the large availability of satellite and in-situ data on snow cover in the Northern Hemisphere, long-term assessments at an adequate resolution to capture the complexities of mountainous terrains remain limited, particularly for countries like Switzerland. This study addresses this gap by employing two products—the monthly NDSI (Normalized Difference Snow Index) and snow cover products—derived from the Snow Observation from Space (SOfS) algorithm to monitor snow cover dynamics across Switzerland over the past 37 years. The pixel-wise analysis reveals significant negative trends in the monthly NDSI across all seasons, with the most pronounced decreases at low to mid-elevations, particularly in winter and spring (e.g., a 50% reduction in NDSI for pixels showing positive significative trends in winter below 1,000 m, and a 43% reduction in spring between 1,000 and 2,000 m). Similarly, snow cover area has declined significantly, with reductions of −13% to −15% in spring for the transitional zones between 1,000–1,500 m and 1,500–2,000 m. Furthermore, the monthly NDSI values are more strongly influenced by temperature than precipitation, especially at lower altitudes. To estimate trends in snow cover for the 21st century, we modelled the relationship between snow presence and two climatic variables (temperature and precipitation) using a binomial generalized linear mixed model (GLMM). In the context of climate change, projections under various greenhouse gas emission scenarios suggest further declines in snow cover by the end of the century. Even with moderate climate action (RCP 2.6), snow-free areas could expand by 22% at lower elevations by 2100. Under the more extreme scenario (RCP 8.5), snow-free regions could increase by over 43%, with significant impacts during the transitional months of April and May. The SOfS algorithm, developed within the Swiss Data Cube, provides valuable insights into snow cover dynamics across Switzerland. Complementing in-situ observations, this innovative approach is essential for assessing snow cover changes and guiding adaptation strategies in a country where snow is not only an environmental indicator but also a cultural and economic asset.
In Switzerland, snow is integral to both natural ecosystems and human society, playing a vital role in water resource management, biodiversity, the economy, and various social aspects (Adler et al., 2023; Beniston, 2012; Beniston et al., 2018; Hock et al., 2019; Steiger and Stötter, 2013). Snow acts as a critical seasonal water reserve for downstream regions and supports numerous ecological processes, with mountain flora and fauna depending on the timing and abundance of snow cover (Keller et al., 2005; Lencioni, 2018). Additionally, snow plays a crucial role in the Alpine climate system by modulating surface-atmosphere exchange processes, with changes in snow cover further contributing to warming through the snow-albedo feedback mechanism (Armstrong and Brun, 2008; Wunderle et al., 2002). Snow is also a significant resource for winter tourism, where the income from the ski sector often surpasses other tourist activities in many mountain resorts (Beniston, 2012).
The impact of global climate change on the cryosphere has been widely studied in recent decades (IPCC, 2019). Since snow cover is highly sensitive to temperature and precipitation, the ongoing climate change, marked by rising temperatures and shifting precipitation patterns, significantly affects snow availability (Beniston and Stoffel, 2014; Gobiet et al., 2014; Steger et al., 2013). Trends of different snow cover parameters in the last decades over different mountain ranges appear to be quite variable (Kunkel et al., 2016; Notarnicola, 2022; Pulliainen et al., 2020; Smith and Bookhagen, 2020), but there is a clear decline in snow cover extent across the Europeans Alps (Notarnicola, 2022). Long-term in-situ measurements in the Swiss Alps follow the same decreasing trend, showing a significant decrease in both mean snow depth and duration of the snow season (Durand et al., 2009; Laternser and Schneebeli, 2003; Marty, 2008; Marty et al., 2017; Scherrer et al., 2004). Notably, these changes are elevation-dependent, with more pronounced decreases at lower elevations compared to higher ones (Durand et al., 2009; Marty, 2008; Terzago et al., 2013) Continuous and long-term monitoring of snow cover—an Essential Climate Variable—is therefore crucial for understanding these ongoing changes and for supporting informed decision-making and adaptation strategies.
However, monitoring snow covered environments through in-situ station networks is challenging, particularly in high-altitude regions, making satellite Earth observation (EO) data a valuable complement to traditional ground measurement (Salzano et al., 2019). The spatial distribution of ground-based stations is generally confined to low elevation regions and such analyses are often limited in time and space (e.g., missing measurement and/or observations and insufficient density of the weather stations) (Foppa and Seiz, 2011). Optical remote sensing is especially well-suited for mapping snow cover due to the strong contrast between snow and most other natural surfaces, apart from specific clouds (Hall et al., 2001a; Nolin, 2010; Tong et al., 2020). The global coverage and regular overpass of satellite imagery allow experts to monitor the vast temporal and spatial variability of snow cover, especially in areas where ground measurements are insufficient, costly, or even dangerous (Chokmani et al., 2013; Nolin, 2010; Zhang et al., 2019). Since the 1980s, snow has been successfully mapped from space using a variety of sensors, from regional to continental scales (Barnes and Smallwood, 1975; Dozier and Painter, 2004; Hall et al., 1995; Ranzi et al., 1999; Wunderle et al., 2002). Global dataset such as the Moderate Resolution Imaging Spectrometers (MODIS) and the Advanced Very High-Resolution Radiometer (AVHRR) (Matson, 1991) provide valuable insights into snow cover dynamics in the Northern Hemisphere, benefiting from their extensive temporal coverage and near-global availability (Desinayak et al., 2022; Dietz et al., 2012; Foppa and Seiz, 2012; Wang et al., 2018). However, these datasets often lack the spatial resolution required to capture the fine-scale variability characteristic of mountainous regions such as Switzerland (Gascoin et al., 2024). In Switzerland, where typical length scales are on the order of 10–100 m, a coarse spatial resolution cannot adequately capture the variability of snow cover (Blöschl, 1999; Gascoin et al., 2019). Beyond spatial resolution, long-term snow cover observations are essential for understanding the impacts of climate change on land-atmosphere feedback, water resources, and ecosystems, particularly in mountain areas where warming trends often exceed the global average (Pepin et al., 2019). Existing long-term (>30 years) remote sensing datasets are an invaluable source to study global or regional snow cover changes in the context of climate change (Hüsler, 2014). However, long-term satellite snow cover datasets using high to medium spatial resolution sensors are largely lacking. Landsat sensors, with the longest continuous dataset comprising nearly 50 years and a spatial resolution of 30 m, have been frequently used to study cryosphere dynamics (Paul, 2002; Selkowitz and Forster, 2016). The recent advent of the European Space Agency’s (ESA) Sentinel constellation further complements the Landsat data record, enabling much denser multi-sensor time series analyses that facilitate long-term change monitoring (Claverie et al., 2018; Yin et al., 2013; Zhu and Woodcock, 2014).
Building on these developments, Poussin et al. (2024) have proposed a novel methodology for detecting snow cover across Switzerland, the Snow Observation from Space (SOfS) algorithm. This method leverages the strengths of mid-to high-resolution datasets (Landsat and Sentinel-2), while minimizing cloud cover obstructions and addressing the limited temporal resolution of Landsat. The SOfS algorithm benefits from the Swiss Data Cube (SDC) environment (Chatenoux et al., 2021; Giuliani et al., 2017), providing access to vast amounts of analysis-ready data (ARD) and enabling the creation of denser multi-sensor time-series. Earth observation data cubes (EODC) have recently emerged as powerful tools, allowing scientists, researchers, and other users to harness large EO data, facilitating access to and use of analysis-ready data (Baumann et al., 2016; Baumann et al., 2024; Killough et al., 2018; Lewis et al., 2017; Strobl et al., 2017).
In this paper, we present the final version of the SOfS algorithm applied across Switzerland over the past 4 decades, using monthly NDSI and snow cover time series. Our objectives are threefold: 1) to assess the distribution and evolution of snow cover in Switzerland since 1984, 2) to explore the relationships between meteorological variables (such as temperature and precipitation) and snow cover parameters, identifying elevation and seasonal dependencies, and 3) to use the snow time series generated by the SOfS algorithm to model and project snow cover distribution under different emission scenarios (RCP 2.6, RCP 4.5, and RCP 8.5) throughout the 21st century. This study contributes as a complementary method for monitoring the Swiss natural environment using satellite EO imagery.
This study focuses on Switzerland, located at the intersection of Western, Central, and Southern Europe. Covering 41,285 km2, Switzerland features a highly complex orography characterized by significant elevation gradients. The country is composed of Alpine terrain in the south and east, which covers 61% of the territory, the Jura Mountains in the northwest, and the lower-elevation Swiss Plateau in the center (Figure 1). Elevation ranges from 195 m to 4,634 m above sea level (a.s.l.) with the Dufourspitze of the Monte Rosa Mountain range situated in the Southeastern Alps. Switzerland experiences a predominantly continental climate, heavily influenced by both the Atlantic Ocean and the Alps. The Alps serve as a major climatic barrier, affecting precipitation patterns between the northern and southern regions of the country. The interannual snow volume is highly variable, primarily due to the combined effects of temperature fluctuations and varying precipitation amounts (Bartolini et al., 2009).
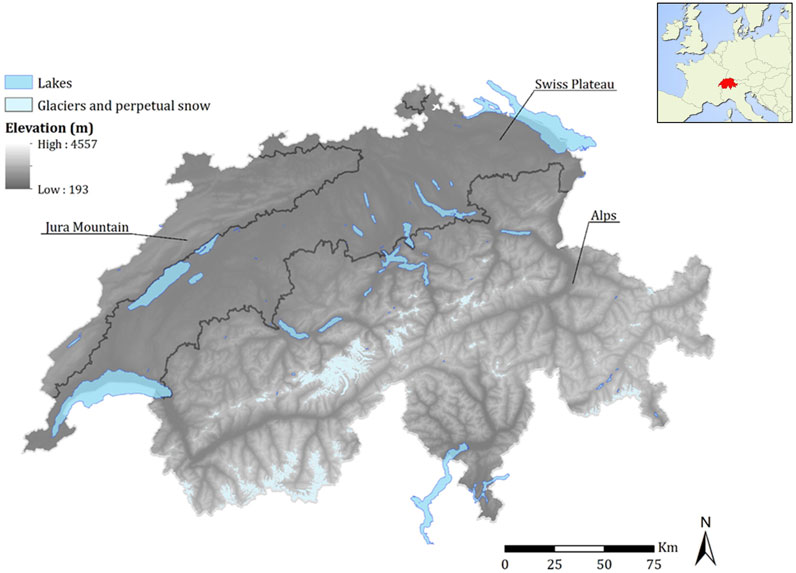
Figure 1. Location and topographical regions of Switzerland.
We used two complementary products, the monthly NDSI and snow cover products, derived from the SOfS algorithm (Poussin et al., 2024; Frau et al., 2018), both at a spatial resolution of 30 m, covering the period from December 1984 to December 2021. These products provide complementary insights into snow cover dynamics. The SOfS algorithm was implemented within the Swiss Data Cube (SDC - https://www.swissdatacube.org/), which leverages satellite data from Landsat-5, -7, -8 and Sentinel-2. The SDC is a tera-scale analytical cloud-computing platform that allows users to access, analyse, and visualize ARD satellite observation archives over the entire Swiss territory from 1984 to the present (Chatenoux et al., 2021). Monthly NDSI and snow cover products were generated through consecutive spatial and temporal techniques aimed at optimizing snow cover detection (Poussin et al., 2023; Poussin et al., 2024).
Both products are based on the Normalized Difference Snow Index (NDSI) and have undergone similar processing steps, including temporal combination (maximum monthly composite) and multi-sensors compositing (Poussin et al., 2019; Poussin et al., 2024). For the monthly NDSI products, no additional processing is applied beyond the initial steps. The raw NDSI data are retained, providing continuous snow cover intensity values without converting them into binary snow presence maps (Poussin et al., 2023).
In contrast, the monthly snow cover products involve further processing to create binary maps indicating snow presence or absence while minimizing cloud cover contamination. Specifically, the raw NDSI datasets are integrated into a binomial generalized linear mixed model (GLMM) developed by Poussin et al. (2023) to establish the relationship between snow cover and NDSI values under different conditions. Following this, five additional spatial and temporal methods are applied to reduce the impact of cloud cover. The final output is a monthly snow cover product with the following classifications:
• 0 for snow-free pixels (i.e., land),
• 1 for snow-covered pixels,
• 2 for cloud-covered pixels (including cloud shadow),
• NA for water pixels or areas outside Switzerland.
The complete methodology of the SOfS algorithm, which leads to the generation of monthly NDSI and snow cover products, is presented in Supplementary Material S1. The paper by Poussin et al. (2024) describes and evaluates the final version of the SOfS algorithm across Switzerland and discusses its various limitations.
Supplementary Material S2 summarizes the mean percentages of cloud, snow, and land observed in the monthly snow cover products over the 37-year period. The snow cover area (SCA) and land cover area are a relative percentage defined as the number of snow pixels or land pixels, respectively, divided by the number of clear pixels (i.e., the sum of snow and land pixels). The snow cover datasets are available at: https://geonetwork.swissdatacube.org/geonetwork/srv/eng/catalog.search#/metadata/d98b8938-22fb-450e-ae1d-af078b6307c8, and the complete version of the SOfS algorithm is accessible as Jupyter notebooks at: https://github.com/poussinc/SOfS-algorithm.
It is important to note that due to the timing of satellite missions, there is no available data for the year 2012. The Landsat-5 mission ceased image acquisition in November 2011 due to an electronic component failure, and Landsat-8 did not begin operations until March 2013. Additionally, Landsat-7 experienced data gaps starting in June 2003 following the failure of its Scan Line Corrector (SLC), and thus, it was not used in the algorithm after that point. Throughout the period from 1984 to 2021, we processed over 4,030 Landsat and Sentinel-2 scenes to generate the SOfS products covering Switzerland. This amounts to 429 monthly images (12 images per year) over the 37-year period, encompassing the entire Swiss territory. For our analysis, results are examined by season, with the seasons defined as follows: DJF (December, January, February), MAM (March, April, May), JJA (June, July, August), and SON (September, October, November).
The Digital Elevation Model (DEM) of Switzerland, with a 30 m spatial resolution, was derived from the Shuttle Radar Topography Mission (SRTM) and obtained through the USGS open-access database (SRTM, 2015). This globally available DEM was selected to ensure compatibility with Landsat data, which operates at the same resolution, facilitating a seamless integration for regional analysis. Additionally, its worldwide availability supports replication of this research in other regions with similar topographical features, making it a versatile and practical choice.
Optical satellite images are known to be strongly affected by clouds (Ibrahim et al., 2021; Nazarova et al., 2020). To further mitigate the impact of cloud cover on final SOfS products, the SOfS algorithm (Poussin et al., submitted) employs successive temporal and spatial filtering techniques. These filtering methods have successfully reduced the fraction of cloud cover from 58% to 36% in the monthly NDSI products, and from 58% to less than 30% in the monthly snow cover products for the period 1984–2021 over Switzerland. The percentage of clear observations per pixel over the entire time-series for both the monthly NDSI products and the monthly snow cover products can be determined using the following Equation 1:
Where x,y are the latitude, longitude respectively of the pixel P and Nx,y is the total number of scenes covering the pixel x,y in the period 1984–2021. As shown in Supplementary Material S3A, the percentage of clear observations per pixel ranges from 0% to 90% for the monthly NDSI products (at the top), while for the monthly snow cover products, the percentage ranges from 0% to 100% (at the bottom). Pixels that are almost always cloud-free are highlighted in light gray areas in Supplementary Material S3A, and the average percentages are approximately 64% for the monthly NDSI products and 70% for the monthly snow cover products. As depicted in Supplementary Material S3B, the number of clear observations per pixel decreases with altitude, with mountainous regions (above 2,000 m a.s.l.) being particularly susceptible to cloud cover. The relationship with elevation is less pronounced for the monthly snow cover products (bottom) compared to the monthly NDSI products, which underwent additional filtering ranges, to remove high-elevation clouds.
In this study, based on the clear observations per pixel over the period 1984–2021, only pixels with more than 40% of clear observation will be considered for the monthly NDSI products, and pixels with more than 50% of clear observation will be considered for the monthly snow cover products. These thresholds were chosen because using higher thresholds would have resulted in a significant loss of data, exceeding 5%. This excludes 2.1% and 3.4% of all pixels, respectively (i.e., red areas in Supplementary Material S3A). The removed pixels tend to be localized at elevation higher than 2,000 m a.s.l. with a mean value of 2,641 m and 4,567 m respectively (Supplementary Material S3C). Supplementary Material S4 summarizes the cloud cover fraction representing the average of the monthly products over the entire period 1984–2021 for Switzerland for the overall months and by season after removed constant cloudy pixels (red pixels).
Snow detection techniques are particularly sensitive to water bodies. To reduce erroneous snow detection over these surfaces, a mask was created to remove known and permanent water bodies from the analysis.
To assess monotonic trends in time series, we applied the non-parametric Mann–Kendall trend test (Mann, 1945) to seasonal averages. This method is widely used in remote sensing due to its robustness against non-uniform sampling and outliers (Hirsch and Slack, 1984; Militino et al., 2020). As highlighted by Neeti et al. (2012), a key challenge in time series analysis is distinguishing between true changes in a remotely sensed variable (e.g., NDSI) and the effects of scene noise (e.g., cloud contamination). Significant trends were identified at a 95% confidence interval (p-value <0.05). The strength of these trends was quantified using the Kendall tau coefficient, where positive values indicate an increasing trend, and negative values indicate a decreasing trend. To quantify the rate of change, we employed the Theil-Sen slope estimator (Sen, 1968), which calculates the median change per unit of time. This approach offers a more robust slope estimate compared to the least-squares method, as it minimizes the influence of outliers or extreme values in the time series (Sen, 1968). The resulting slope was then converted into a percentage of total change over the study period (1984–2021) by multiplying it by the number of years in the time series (Chen et al., 2018). The analysis focused on pixel-level monthly NDSI values, averaged by season to assess seasonal trends. We also analysed trends in seasonal snow cover area (SCA) across Switzerland. To further explore spatial variability, we examined trends across different altitude bands, identifying regions with the most significant changes in snow cover.
Snow cover depends on variations in precipitation and temperature, which are not only the primary drivers of snowfall events but also play a crucial role in controlling snowmelt dynamics (Pulliainen et al., 2020). To evaluate the influence of climate on NDSI changes over 37 years, we computed correlations between monthly NDSI products and climatic variables. Climatic data were sourced from MeteoSwiss, which provides a monthly gridded dataset at 1 km resolution (Supplementary Material S5). This dataset is derived from measurements taken at approximately 80 stations across Switzerland, covering the period from 1961 to the present. Monthly mean temperatures (MeteoSwiss, 2016a), measured 2 m above ground level, are provided in degrees Celsius and averaged from daily mean values for 1984–2021. Precipitation data (MeteoSwiss, 2016b), recorded in millimeters, include the total water equivalent of both rainfall and snowfall for the same period. These climatic datasets were aligned with the NDSI products, which were resampled to the same 1 km resolution using bilinear interpolation. To ensure data reliability, areas with less than 40% clear observations were excluded from the analysis. We then performed a pixel-wise Spearman correlation analysis to assess the monotonic relationship between temperature, precipitation, and NDSI for seasonal means from 1984 to 2021 (Zhao et al., 2022).
For the model examining the relationship between snow presence and the two climatic parameters, we used data on monthly snow cover, temperature, and precipitation. The climatic data from MeteoSwiss at a 1 km resolution, used in the correlation analysis, was also utilized for model training. Snow cover data were taken from the monthly binary snow cover products generated by the SOfS algorithm. To match the 1 km resolution of the climatic data, the snow cover products were resampled using bilinear interpolation. To convert the continuous snow cover data to binary format, a thresholding approach was applied. Values between [0–0.5] were classified as 0 (land), values between [0.5–1.5] as 1 (snow), and values above 1.5 as 2 (cloud). Pixels classified as cloud-covered, pixels with less than 50% clear observation between 1984–2021, or identified as water bodies, were excluded from the analysis. This process resulted in a dataset of 15,945,930 valid pixels for model calibration, with a uniform distribution across months, with over 30% of pixels located in low-altitude regions (500–1,000 m) (Supplementary Material S6).
For predictions, we used monthly precipitation and temperature data from the CH2018 dataset, which covers Switzerland with a 2 km resolution for the period 1981–2099 (CH2018 Project Team, 2018). Since the data is daily, we computed monthly averages for the near-surface air temperature in degree Celsius and monthly cumulative precipitation in milimeters. The CH2018 scenarios are based on the EURO-CORDEX climate projections, which use different global and regional climate models combinations (GCMs and RCMs; see www.euro-cordex.net). Three Representative Concentration Pathway (RCP) scenarios are considered (RCP 2.6, RCP 4.5 and RCP 8.5), ranging from rapid and substantial reductions (RCP 2.6) (Van Vuuren et al., 2011) to continued emission growth (RCP 8.5) (IPCC, 2013). For this study, we used a subset of three GCM-RCM model chains for each emission scenario (2020–2049, 2045–2074, 2070–2099), based on the study of Sikorska-Senoner et al. (2024) (Supplementary Material S7). All the variables used in the model for estimating the probability of snow cover presence are summarized in Supplementary Material S8.
The focus of this work is related to the mean estimate of the three different models by emissions scenario. To reveal the long-term climate change signal and filter out short-term variability, the simulated climate variable is averaged over periods of 30 years for the three future timeframes (early-century: 2020–2049, mid-century: 2045–2074, and late-century: 2070–2099). The period from 1984 to 2021 was selected as the reference period to maintain optimal data availability.
To estimate trends in snow cover for the twenty-first century, we modelled the relationship between the snow presence and the two climatic variables using a binomial generalized linear mixed model (GLMM) with a logic link function. The fixed effects in the model include temperature, precipitation, and their interaction. This interaction term allows the model to capture the possibility that the effect of temperature on snow presence may vary with precipitation, and vice versa, accounting for their combined influence on snow presence or absence. The random effect is modelled using a unique identifier for each pixel (ID), allowing for spatial variability and unobserved heterogeneity among pixels, such as environmental factors or other unmeasured influences that vary by location. Linear Mixed Models (LMM) are an extension of linear model that allow for correlated and non-constant variability among groups, while GLMMs are further extended to accommodate binary responses such as snow presence/absence. To assess the model’s predictive performance, a cross-validation approach was employed, using metrics such as the True Skill Statistic (TSS), sensitivity, and specificity using a repeated split-sample method (N = 30; 70%–30%). The model’s performance was evaluated for each month and altitude range to ensure robustness across the dataset. Future snow cover changes were predicted based on snow presence probability for the three 30-year periods (2020–2049, 2045–2074, and 2070–2099), under three emission scenarios (RCP 2.6, 4.5, and 8.5). Snow cover change across Switzerland was calculated as absolute differences from the reference period (1984–2021). The period 1984–2021 was defined as the “current snow cover” reference for future changes.
All calculations and analyses were conducted using R version 4.3 (R Core Team, 2023) with the “biomod2” package (Thuiller et al., 2019) and the “lme4” package for model implementation (Bates et al., 2015). It is important to note that the model developed in this study is not a mechanistic model aimed at explaining the meteorological or climatological physics underlying the snow-climate relationship. Rather, it is a statistical model that illustrates the association between snow presence, temperature, and precipitation in a specific context.
To assess the spatial and temporal distribution of the NDSI in Switzerland, we calculated mean monthly NDSI values grouped by season over the past 37 years (Figure 2). The results reveal substantial variability across seasons and elevation bands, with a general increase in NDSI values at higher altitudes (Supplementary Material S9). In winter, the mean NDSI across Switzerland was 0.42, with 86% of pixels showing values above 0.0, indicating probable snow cover. As noted by Riggs et al. (2015), NDSI values between 0.0 and 1.0 correspond to the theoretical range for snow presence. While pure snow under optimal sunlight and high solar elevation yields high NDSI values, these values decrease when other features are present in a pixel (Hall et al., 2001b), or when snow is shaded or beneath forest canopy (Da Ronco et al., 2020). Mean NDSI values above 0.2 were consistently observed at elevations starting at 500 m. In spring, the mean NDSI decreased to 0.14, with 46% of the territory showing values above 0.0, and positive mean NDSI value appearing from 1,000 m. In summer and autumn, mean NDSI values were negative, at −0.28 and −0.1, respectively. During these seasons, only 8.4% of pixels in summer and 26% in autumn had NDSI values above 0.0, primarily at higher elevations, with positive values generally observed from 2,000 m.
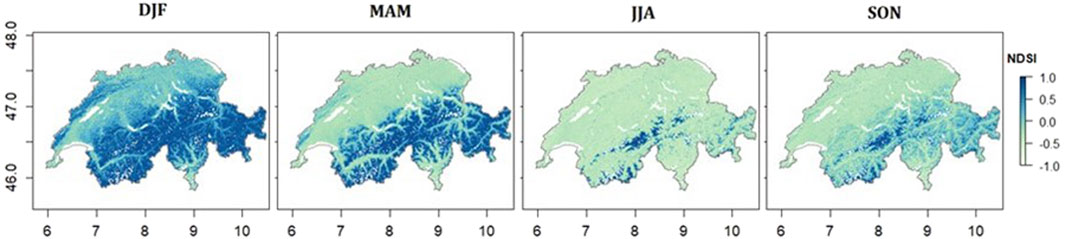
Figure 2. Spatial distribution of mean monthly NDSI grouped by season (DJF, MAM, JJA, SON) over the period 1984–2021 across Switzerland.
Figure 3 presents the pixel-wise spatial distribution of statistically significant trends (Mann-Kendall Tau) and the rate of change (Teil-Sen slope) in NDSI monthly products from 1984 to 2021, averaged by season. Only pixels significant at the 95% confidence level are displayed. Across all seasons, more than 25% of the pixels exhibit statistically significant trends, with the average slopes - considering both positive and negative slopes - indicating a significant downward trend, ranging from −0.004 y⁻1 to −0.007 y⁻1, depending on the season. In winter, 54% of Switzerland showed a significant increase in NDSI, with an average rate of 0.004 y⁻1, particularly concentrated in the Alps above 2,000 m (average altitude 2,160 m) (Figure 4). Conversely, 46% of the territory experienced a significant decrease in NDSI, with a steeper average rate of −0.014 y⁻1, predominantly in low-elevation areas such as valleys and plateau (average altitude 796 m). While there was a balance between positive and negative trends overall, the steeper slopes for negative trends indicate a more pronounced decline in snow cover, especially below 1,000 m (Figure 4). In spring, the contrast between increasing and decreasing trend was more evident, with 87% of pixels indicating a significant decrease at an average rate of −0.008 y⁻1, particularly in low-altitude regions (average altitude 834 m). The steepest negative slopes were observed between 1,000 and 2,000 m, with an average rate of −0.012 y⁻1 (Figure 4). Overall, the NDSI decreased significantly at a rate of −0.007 y⁻1, corresponding to a total change of −25% across Switzerland, a decline more pronounced than in winter, summer, or autumn (each registering a −14% change). During summer and autumn, 82% and 77% of the study area, respectively, displayed decreasing trends, mainly in mid-to low-altitudes zones (average altitude 1,231 m for summer and 936 m for autumn). The most intense negative slopes during summer were found between 2,500 and 3,000 m (average slope −0.009 y⁻1), and between 1,000 and 1,500 m in autumn (average slope −0.01 y⁻1). Although the overall changes mirrored those observed in winter, the intensity of negative slopes was less pronounced in summer and autumn, with average rates of −0.005 y⁻1 for summer and −0.008 y⁻1 for autumn, considering only pixels with negative slopes.
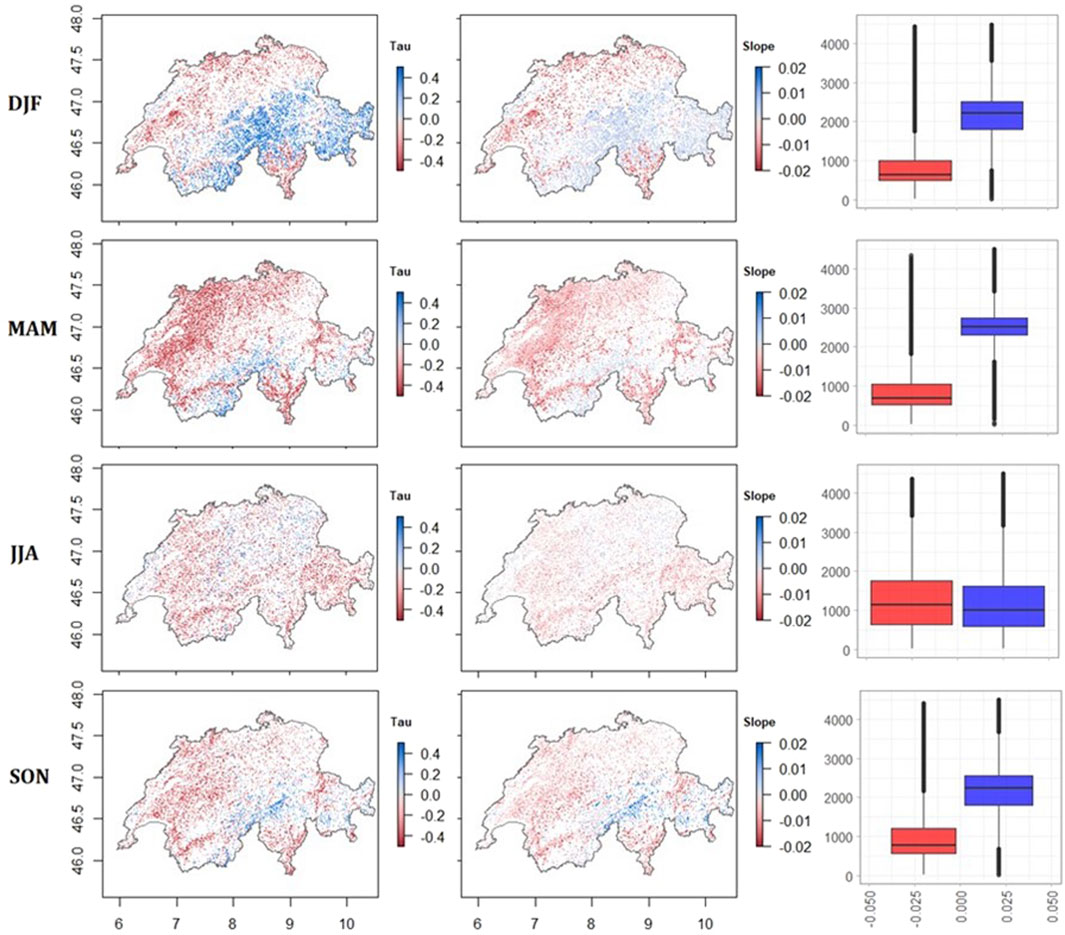
Figure 3. Spatial distribution of significant Mann-Kendall test results (Tau) and the rate of change derived from Theil-Sen slope estimates for monthly NDSI values, averaged by season (DJF, MAM, JJA, SON) for the period 1984–2021. Only pixels significant at the 95% confidence are displayed across Switzerland. Red shading represents negative values, while blue shading represents positive values. Boxplots illustrate the relationship between Theil-Sen slope values (separated by positive and negative trends) and elevation across Switzerland.
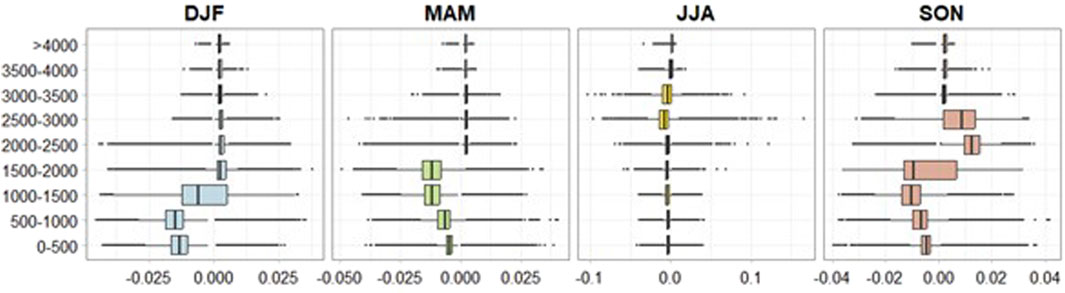
Figure 4. Distribution of the Theil-Sen slope values by altitude range, categorized by season, for the period 1984–2021 across Switzerland.
To assess the probability of snow cover over time, individual monthly snow cover products grouped by season were analysed for the period 1984–2021 across Switzerland (Figure 5). These products allowed for the evaluation of snow cover probability relative to clear observations on a pixel-by-pixel basis over the 37-year period. Approximately 50% of the Swiss territory is usually snow-covered during winter, with a high probability of observing snow (>80%), while only 16% of the country remains predominantly snow-free during this season (probability to observe snow <20%). Transitional zones, where ephemeral snow cover occurs (probability to observe snow between 20% and 80%), account for about 35% of Switzerland. In spring, nearly 50% of the territory is snow-free, while 29% remains typically snow-covered. During summer, the pattern shifts, with only 2% of the country covered by snow and 93% being snow-free. In autumn, the snow-free area moderates slightly to 64%. The probability of observing snow by season was further evaluated across 500 m elevation bands, as illustrated in Figure 6. For each elevation band, the distribution of the five different probability classes (0%–20%, 20%–40%, 40%–60%, 60%–80%, and 80%–100%) was calculated as a percentage of the total area within a band. In winter, areas above 1,500 m–comprising approximately 36% of Switzerland–are predominantly characterized by a high probability (80%–100%) of snow cover. Conversely, regions where snow cover is rarely observed are confined to very low elevations. In spring, high snow cover probability shifts upwards to areas above 2,000 m, with regions below 1,000 m almost never experiencing snow. This threshold rises further in summer, with the 0%–20% snow cover class becoming predominant below 2,500 m. Above 3,500 m, 83% of the terrain maintains a high probability of snow cover. Autumn presents a more nuanced scenario, with a high snow cover probability at elevations above 3,000 m.
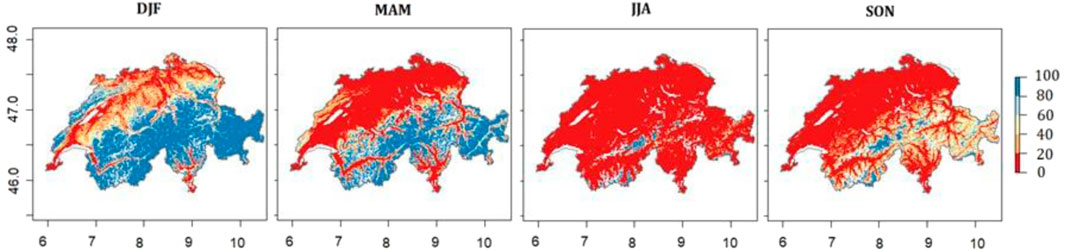
Figure 5. Seasonal snow cover probability maps (DJF, MAM, JJA, SON) generated from monthly snow cover products for the period 1984–2021 in Switzerland. Dark blue areas indicate high probability of snow presence (80%–100%) in cloud-free monthly snow cover products, whereas red areas indicate low probability of snow presence (0%–20%) in cloud-free monthly snow cover products over the studied period.
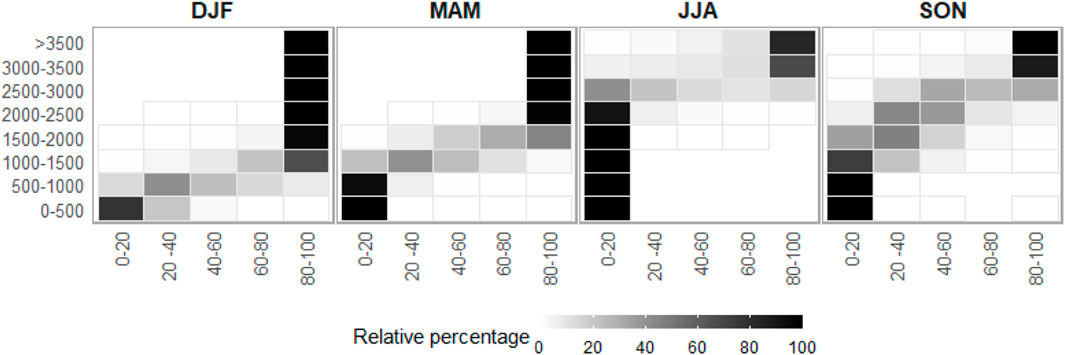
Figure 6. Seasonal relative percentage distribution of the different probability classes (0%–20%, 20%–40%, 40%–60%, 60%–80%, and 80%–100%) across 500 m elevation bands, expressed in term of percentage of total area within each elevation band.
The seasonal mean SCA time series reveal annual fluctuations with no significant trends over the 37-year period, except during the winter season (Table 1). The Mann-Kendall correlation coefficient (MK tau = −0.28, p-value = 0.02) suggests a slight negative trend in winter SCA, indicating a reduction of −14% (slope of −0.004 y−1) over the studied period. Winter, spring, and autumn exhibit substantial year-to-year variability, whereas summer shows much lower variability in SCA, ranging from 1.3% in 2011 to 6.9% in 2019. To observe spatial patterns of snow cover, Figure 7 presents the mean SCA from 1984 to 2021 across 500 m elevation bands for each season. A clear relationship between elevation and SCA is observed. As expected, SCA increases with elevation, nearing 100% at higher altitudes, while lower altitudes display reduced SCA values. This pattern holds true for all seasons. Additionally, higher altitudes show less interannual and year-to year variability in SCA, as do lower altitudes during the spring, summer, and autumn seasons. In winter, a significant trend is observed above 3,000 m. However, the slope is negligible at these altitudes, indicating a total change of 0% and a mean SCA of 100% (Table 2). Spring exhibits a significant negative trend starting at 1,000 m elevation, with negative changes of −13% and −15% in the transitional zones of 1,000–1,500 m and 1,500–2000 m, respectively. Above 2,500 m, the mean SCA reaches 100%, and no further trend is detected (slope of 0 y⁻1). During summer, the Theil-Sen slope indicates a significant negative trend between 2,500 and 3,500 m, with a total change reaching up to −27% in the 2,500–3,000 m range, representing the highest magnitude of change observed. Notably, Figure 7 illustrates a sharp decline in SCA after 2015, coinciding with the arrival of Sentinel-2 and a near-cloudless monthly snow cover dataset in summer. The autumn season, in contrast, reveals no significant trend in the SCA time series.
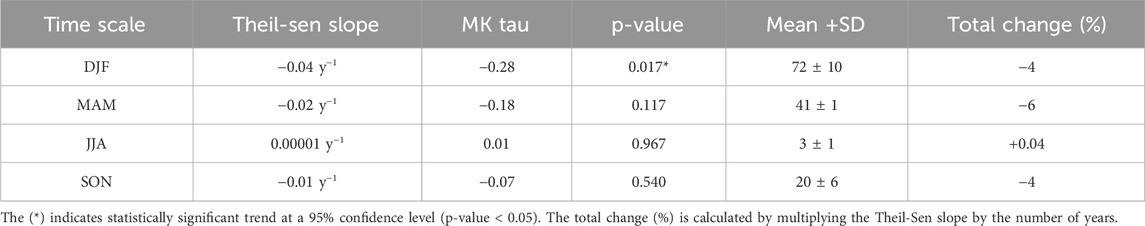
Table 1. Statistics for the mean seasonal SCA time series for Switzerland.
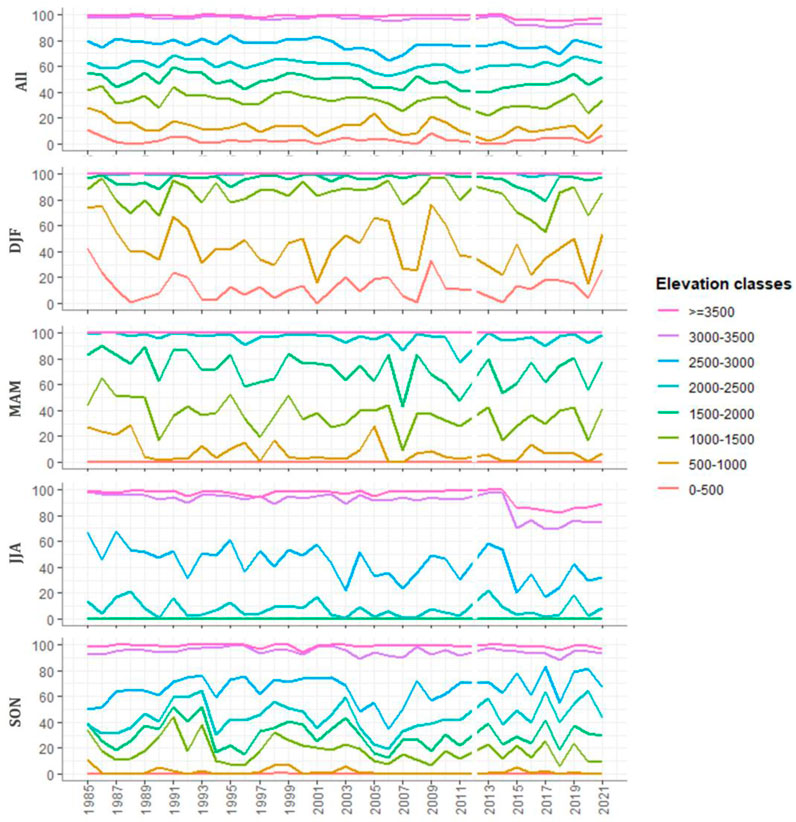
Figure 7. Mean seasonal SCA trend across 500 m elevation band for the period 1984–2021.
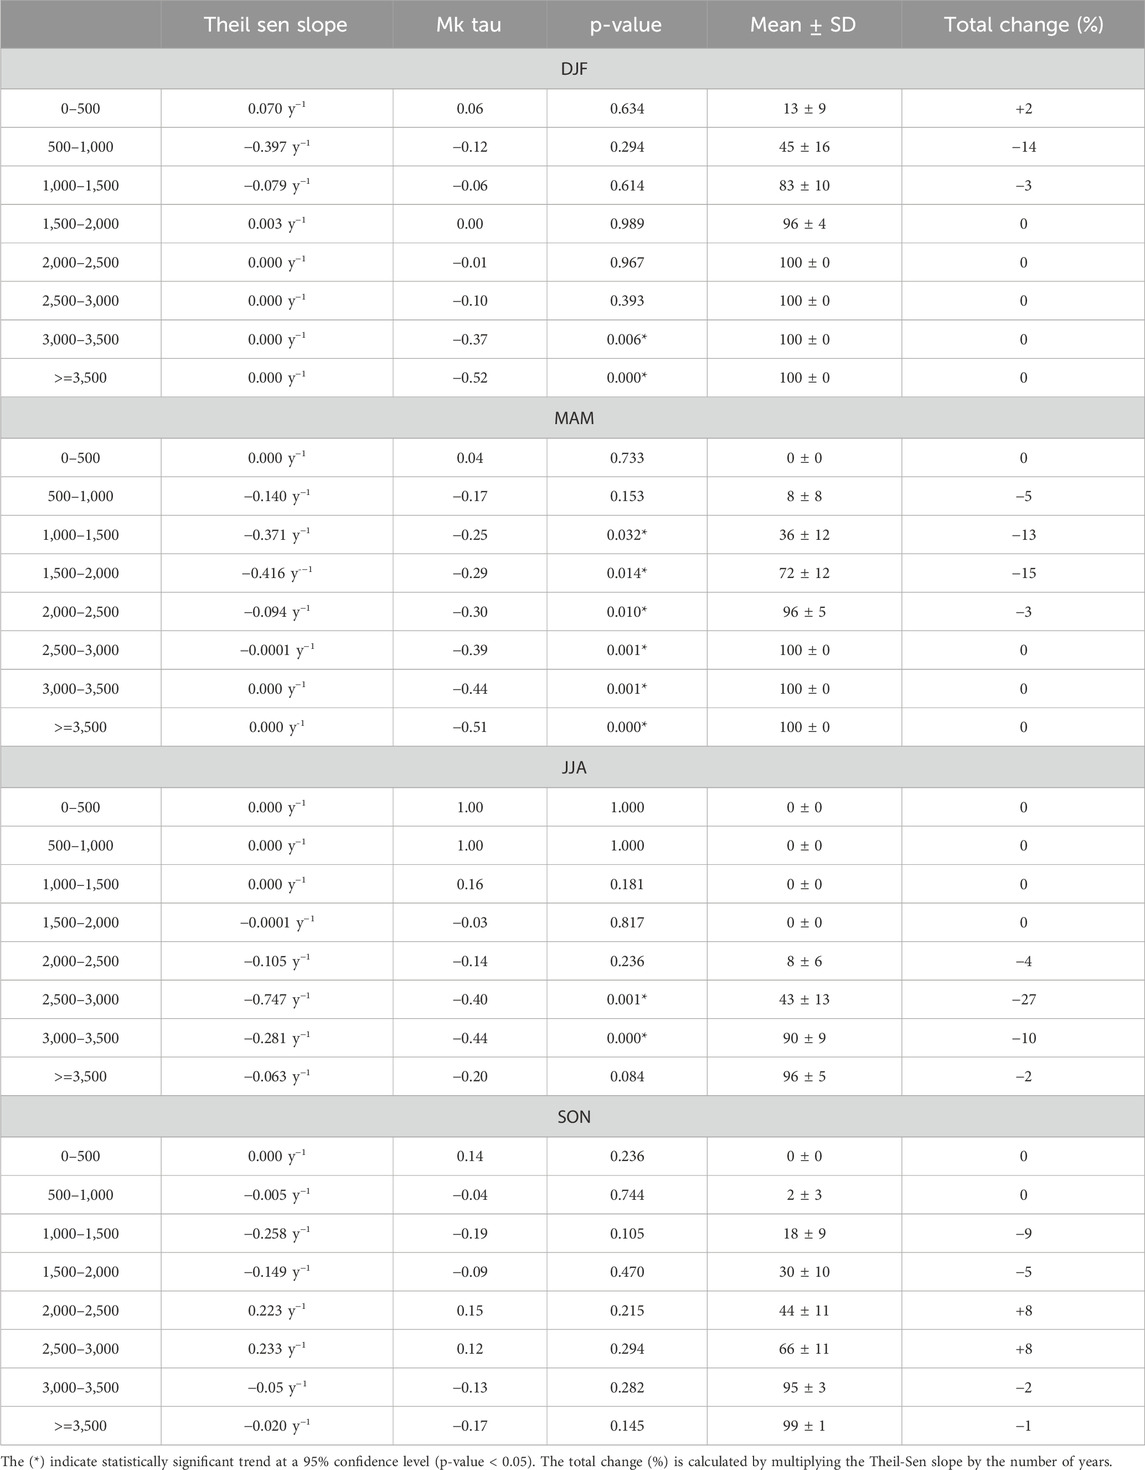
Table 2. Statistics for the mean seasonal SCA time series for Switzerland across 500 m elevation bands.
Seasonal NDSI estimates at pixel level were correlated with temperature and precipitation datasets using Spearman’s correlation. Figure 8 shows that temperature-NDSI correlations are predominantly negative and strong across all seasons (mean r values around −0.4 to −0.5), with altitude influencing the strength of correlations. In winter, 60% of pixels exhibit significant correlations, 94% of which are negative, with stronger correlations at lower elevations (mean = 820 m) indicating a stronger temperature-NDSI relationship in the plains and the valleys. As altitude increases, correlations weaken and become more positive. Spring follows a similar pattern, with 40% of pixels showing significant correlations, of which 99% are negative, concentrated at low elevations (mean = 982 m). In summer, significant correlations (14% of pixels) are mostly negative (91%) and occur in the mid-altitude Alps (mean = 1763 m). Autumn shows 28% of significant pixels, with 99% negative, mainly in the Alps at 1,316 m. Correlations between NDSI and precipitation (Figure 8) are mostly positive, suggesting that precipitation relates to an increase in the snow index, particularly in the mid-altitude Alps. However, the influence of precipitation is weaker, with fewer significant pixels and lower r values (0.1–0.4) across all seasons.
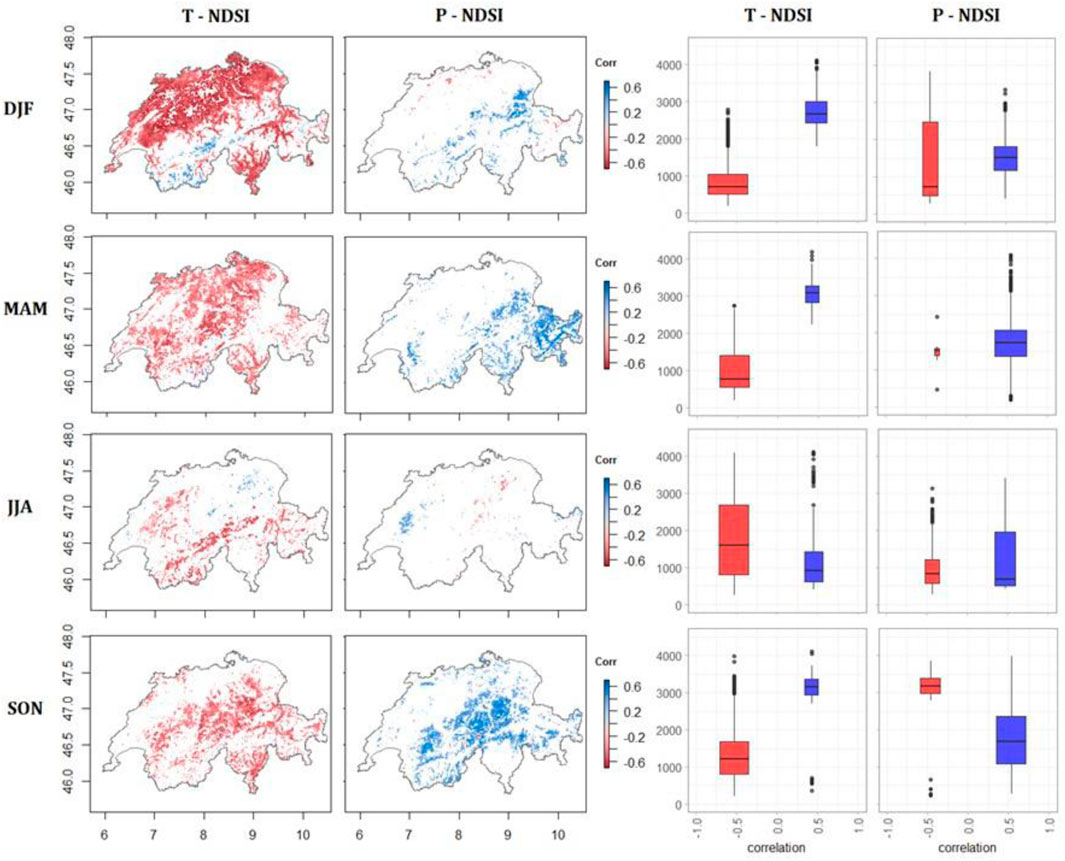
Figure 8. Pixel-wise Spearman correlation between seasonal mean NDSI, temperature and precipitation. Only significant pixels (correlation at 95% confidence level (p-value < 0.05) are shown in the image. The boxplots illustrate the relation between correlations of seasonal NDSI, temperature and precipitation and elevation across Switzerland over the period 1984–2021. Boxplots show the median (horizontal line) and the interquartile range (IQR; box outline). The whiskers extend from the hinge to the highest and lowest value that are within 1.5*IQR of the hinge.
The binomial GLMM model, considering temperature, precipitation, and their interaction, explains 77% of the variance in snow probability (marginal R-squared), increasing to 87% when accounting for random effects (conditional R-squared). The fixed intercept of the binomial GLMM is 0.673, with the slopes for the fixed effects showing distinct patterns. Specifically, the negative slope (Table 3) for the temperature indicates that an increase in temperature is associated with a decreased probability of observing snow. In contrast, the positive slope for precipitation (Table 3) suggests that increased precipitation is linked to a higher probability of observing snow. The interaction term reveals that the effect of temperature on snow cover is moderated by precipitation levels. As detailed in Table 3, the model demonstrates strong performance metrics, with a mean TSS of 83%, a mean sensitivity of 92% and a mean specificity of 91%. These results indicate that the combination of temperature, precipitation and their interaction effectively capture the factors influencing snow presence or absence. The model’s performance remains stable across months, with average TSS, sensitivity, and specificity of 83%, 91%, and 91%, respectively (top half of Figure 9). However, we observe slightly more variability across altitude classes, ranging from 72.5% TSS at very low altitudes (0–500 m) to 84.6% at very high-altitude (>3,000 m), with both specificity and sensitivity exceeding 85.7% across all altitudes (bottom half of Figure 9).
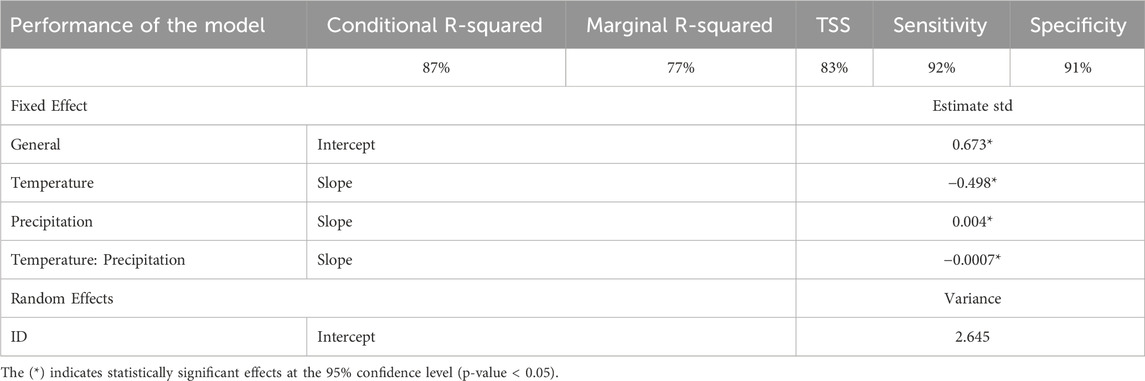
Table 3. Results of General Linear Mixed Model (GLMM) evaluating the effects of temperature, precipitation, and their interaction on snow presence/absence for Switzerland.
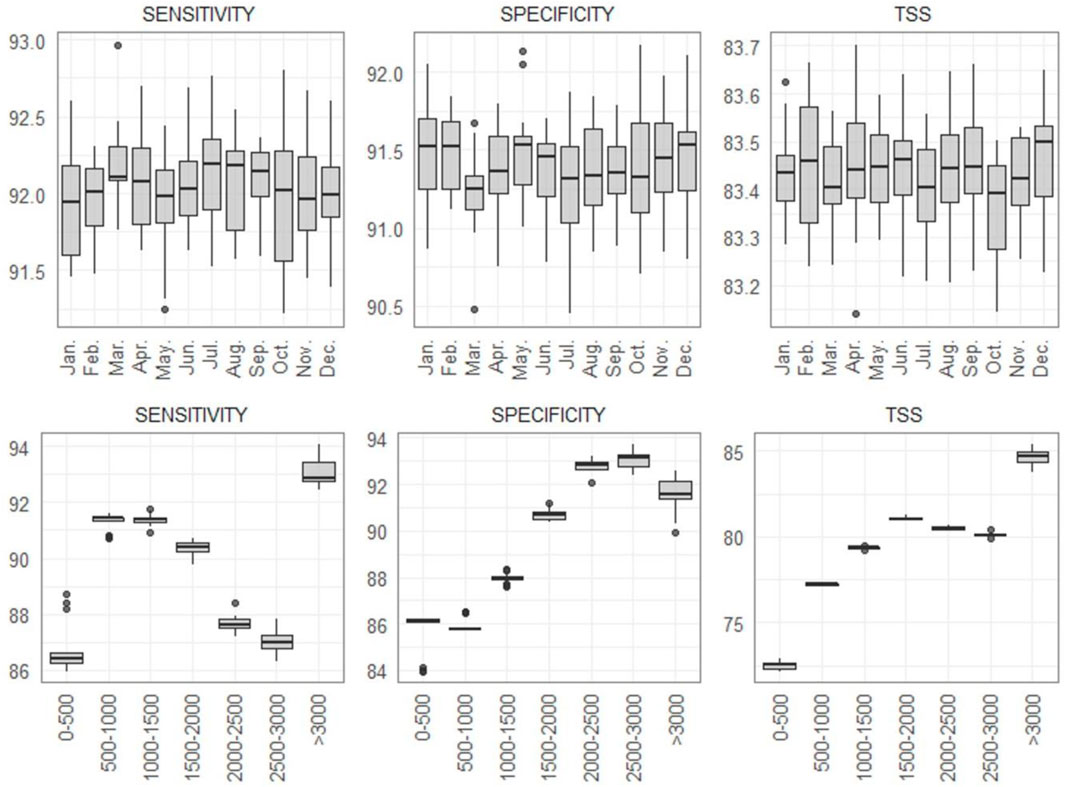
Figure 9. Boxplots showing the sensitivity, specificity, and TSS statistics for the binomial generalized mixed model, categorized by month and altitude classes. For more details regarding boxplots, see Figure 8.
The probability of observing snow cover is projected to decrease throughout the twenty-first century compared to the reference period (1984–2021). Changes in snow probability will depend on the emission scenarios and time periods analyzed. Supplementary Material S10 presents an example of the map showing the probability of observing snow per pixel across Switzerland for a specific period and scenario. Figure 10 highlights significant spatial variability across Switzerland, likely due to Switzerland’s topography, and considerable month-to-month variability. During the summer months, much of Switzerland experiences minimal snow cover, with median and mean probabilities close to zero. The absolute difference in probabilities between the reference period and the three emission scenarios remains small, remaining below −0.07 for all emission scenarios and future time period. As we approach the late century, projections diverge more significantly among scenarios, with larger absolute change in snow cover probabilities (Supplementary Material S11). For example, in January, the values range from −0.05 to −0.08 for RCP 2.6, −0.08 to −0.14 for RCP 4.5, and −0.08 to −0.24 for RCP 8.5.
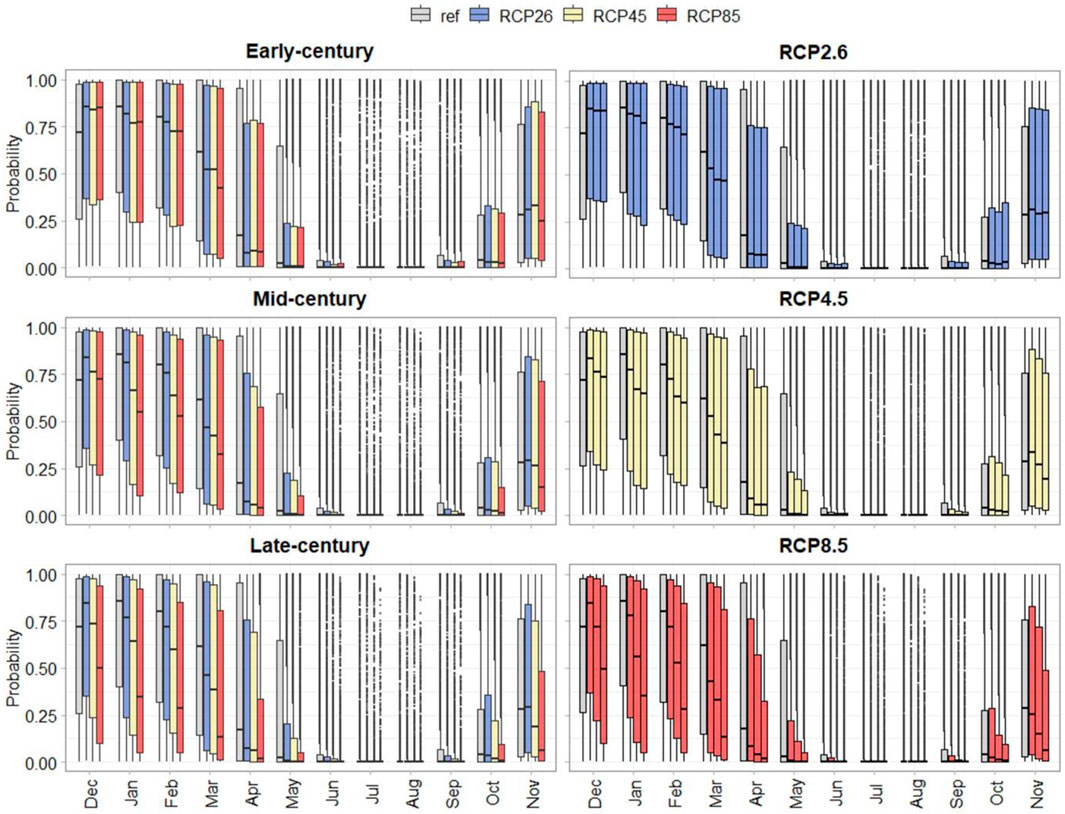
Figure 10. Probability to observing snow across Switzerland for three emission scenarios (RCP 2.6, RCP 4.5, and RCP 8.5) over three future periods: 2020–2049 (early century), 2045–2074 (mid-century), and 2070–2099 (late century). The reference period (1984–2021) is depicted in grey. For more details regarding boxplots, see Figure 8.
Under RCP 2.6, snow probability remains relatively stable throughout the century. In contrast, RCP 8.5 predicts a significant decrease in snow probability, particularly noticeable by 2,100, with values not exceeding 0.51 even in winter months. The most significant average differences in snow probability across Switzerland are observed in May, April, and January, with differences exceeding −0.2 by the end of the century under RCP 8.5.
Supplementary Material S12 and Figure 11 reveal that during winter, altitudes between 0 and 2,000 m show considerable variability in snow cover change, with significant differences at low to mid-altitudes. For instance, in January under RCP 8.5, differences of −0.13 (for the early century), −0.29 (for the mid-century) and −0.38 (for the late century) between 500 and 1,000 m are observed for the three periods respectively. Above 2,000 m, variability decreases with average and median differences closer to zero, reflecting more stable snow cover patterns. This trend persists across all emission scenarios and periods. In spring, significant changes shift to altitudes 1,500 and 3,000 m, with the largest differences observed between 1,500–2,000 m in April 2000–2,500 m in May, and 2,500–3,000 m in June. For instance, in May, differences range from −0.4 for RCP 2.6 for the near future to −0.7 for RCP 8.5 approaching the end of the century. In summer, variability extends to 2,000–4,000 m with differences reaching −0.5 at 3,500–4,000 m under RCP 8.5 at the end of the century. Autumn months mirror the spring pattern, though with less dramatic changes.
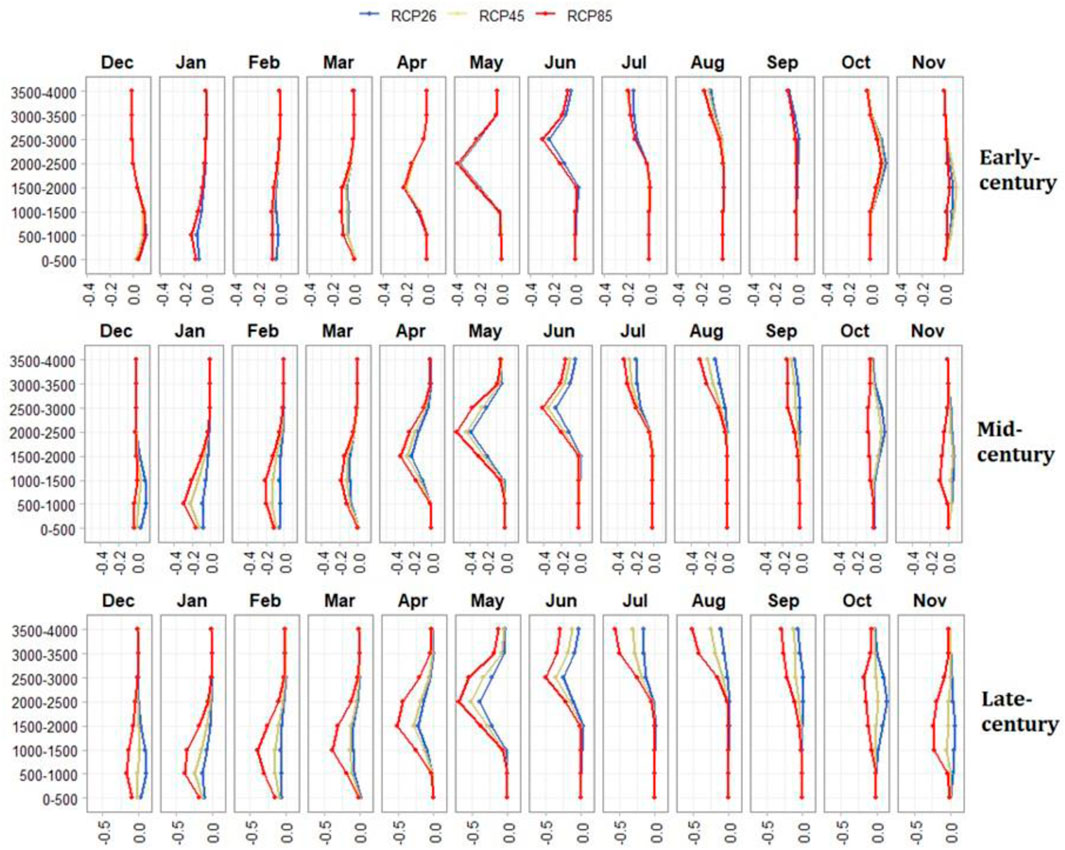
Figure 11. Mean absolute difference in the probability of snow observation between various scenarios (RCP 2.6, RCP 4.5, and RCP 8.5) and the reference period (1984–2021), stratified by altitude for each month and for future periods: 2020–2049 (early century), 2045–2074 (mid-century), and 2070–2099 (late century).
The heat map (Figure 12) highlights significant changes in snow probability across different altitudes. During the winter months, we observe an increase in areas with minimal snow cover at the lowest altitudes, coupled with a decrease in snow probability at low to mid-altitudes. This trend intensifies as the century progresses, with a notable rise in low-snow-probability areas at lower elevations and a marked decline in high-snow-probability regions (0.8–1) between 1,500 and 2,500 m. In summer, the trend shifts to altitudes between 2,500 and 3,000 m, where there is a considerable loss of snow-covered areas and an increase in snow-free zones. Similar patterns are seen at mid-altitudes in autumn, although the changes are less pronounced. For the late century, comparing the extreme scenarios RCP 2.6 (best-case scenario) and RCP 8.5 (worst-case scenario), and focusing on low and high snow probability classes, reveals that even with mitigation under RCP 2.6, there is a 22% increase in snow-free areas at 0–1,000 m during January and February and a 7% decrease in consistently snow-covered areas between 500 and 2,500 m (Supplementary Material S13). In transitional months (April and May), RCP 2.6 shows a 40% increase in snow-free areas at 1,000–2,500 m and a 14% decrease in areas almost always covered by snow at 1,500–3,000 m. Under RCP 8.5, changes are even more severe, with a 46% increase in snow-free areas and a 56% decrease in consistent snow cover. In summer, RCP 2.6 results in 8% reduction persistent snow areas above 2,500 m and a 13% increase in snow-free zones, while RCP 8.5 shows a 37% reduction in snow-covered areas and a 31% increase in snow-free zones.

Figure 12. The heat map illustrates the relative percentage change in pixels across three emission scenarios (RCP 2.6, RCP 4.5, and RCP 8.5) and future periods in respect to the reference period (1984–2021), categorized by the probability of snow observation and altitude class. Each cell represents a change in the distribution of snow cover probability for a given month, scenario, and future period. Colours indicate the magnitude and direction of change. Shades of red represent a decrease, while shades of blue indicate an increase in the surface area for each probability class of snow observation at a certain altitude.
Analyses on the monthly NDSI products reveal that snow presence in Switzerland is highly dependent on both seasons and elevation, which is expected since air temperature and precipitation are the two major determinants of snow precipitation and snowmelt (Beniston et al., 2003; Jennings et al., 2018; Schöner et al., 2009). During winter and early spring, snow covers a significant portion of the country, with 86% of the Switzerland displaying NDSI values above 0.0, indicating some snow presence. Over the 37-year period, only 16% of the country experienced snow-free conditions (probability of observing snow 0%–20%). This persistent snowpack is important for maintaining water supply through snowmelt runoff, which supports hydropower and irrigation during the dry summer months (Beniston et al., 2003; Marty et al., 2017). In summer, snow cover decreases significantly but remains present at high altitudes, with about 2% of the country consistently snow covered (probability of observing snow 80%–100%). This persistent snow and glaciers are crucial for Switzerland, providing consistent water supply through snowmelt, supporting hydropower, agriculture, and ecosystems (Huss et al., 2017). These findings highlight the critical role snow plays in shaping Switzerland’s landscape, economy, and identity, particularly in winter and spring, when snow provides vital resources for winter tourism, water management, and ecosystem support.
Pixel-wise trend analysis across Switzerland revealed a significant decline in NDSI values across all seasons over the past 4 decades, with varying rates of change depending on season and elevation. This trend aligns with the observed warming in the European Alps, where mountain surface air temperatures have risen by 0.2°C ± 0.2°C per decade (Hock et al., 2019). During winter, nearly half of the significant pixels showed a substantial decrease in NDSI, particularly in valleys and lowlands (below 1,000 m), resulting in a total change of 50% over the study period. The higher sensitivity of these regions is primarily due to small temperature increases pushing conditions above freezing, causing precipitation to fall as rain rather than snow (Jennings et al., 2018). In Switzerland, the average freezing level, recorded at approximately 860 m, corresponds to the elevation of maximum snow sensitivity to temperature fluctuations (Frei, 2018; Wielke et al., 2004). In contrast, at higher elevations (above 2,000 m), 54% of significant pixels exhibited a slight increase in NDSI, with a less pronounced total change of 14%. This can be attributed to the persistence of sub-freezing temperatures, which maintain snowpack stability despite warming trends (Marty, 2008; Pepin et al., 2019). Additionally, increased precipitation at these altitudes often falls as snow, potentially offsetting the impact of rising temperatures (Schöner et al., 2009). Similar patterns were observed in spring, with the most substantial NDSI decreases occurring between 1,000 and 2,000 m (total change of 43%), consistent with findings by Marty et al. (2017) and Matiu et al. (2021) that reported significant snow depth reductions at low to mid-elevations across the European Alps, especially in spring.
Complementing the NDSI trend analysis, the SCA time series analyses reveal significant year-to-year variability in snow cover extent, particularly during winter, spring, and autumn, and at transitional elevations. In contrast, high-altitude regions exhibit more stable snow cover. For instance, above 3,000 m in winter, there is little to no significant change in SCA, as snow is almost always present. In line with the NDSI trend, snow cover area has significantly decreased at lower elevations over the past 4 decades, particularly in spring, with reductions of −13% to −15% between 1,000 and 2,000 m. These elevations mark the critical transition from snow-covered to snow-free areas (Matiu et al., 2021). As noted earlier, there is a strong height dependency of snow cover sensitivity to air temperature, which follow from the deviation of mean air temperature from the melting point across different altitudes (Schöner et al., 2009). Both NDSI and SCA trends reflect this sensitivity, with snow at lower elevations being more affected by small temperature increases, while higher elevations, where temperatures generally remain below freezing, exhibit greater stability or even increased snow cover with higher precipitation (Marty, 2008; Mote, 2006; Mote et al., 2005; Scherrer et al., 2004). Summer months also exhibit a significant decline in SCA at higher altitudes (2,500 and 3,000 m). However, a marked decrease in SCA has been observed since 2015, coinciding with the introduction of Sentinel-2, which provides near-cloudless monthly snow cover observations. Given that summer SCA is already minimal (averaging 3% of the country), even a slight increase in clear observations at high altitudes can significantly impact the SCA. As mentioned by Matiu et al. (2021), long-term monitoring at elevations above 3,000 m is extremely challenging, both when using in-situ and Earth observation data. Numerous studies have highlighted a widespread decrease in snow extent across the Northern Hemisphere (Lemke et al., 2007) and in the Alps (Notarnicola, 2024), particularly in spring and summer (Notarnicola, 2022) driven by increasing seasonal mean temperatures (Ceppi et al., 2012; Scherrer et al., 2004).
The NDSI time series analyses revealed a strong relationship with meteorological variables, particularly temperature, with the strength of this correlation varying by elevation. As discussed earlier, snow cover is more sensitive to temperature changes at lower elevations, where even small temperature increase can cause shift from snow to rain, reducing NDSI. In winter, at lower elevations, and during spring at low to mid-elevations, NDSI is predominantly influenced by temperature. However, at higher altitudes, precipitation plays a more critical role in snow accumulation. As altitude increases, the correlation between NDSI and temperature weakens and may even turn positive, indicating that temperature has a diminished impact on snow presence (Marty, 2008; Schöner et al., 2009). These patterns align with findings in the European Alps (Matiu et al., 2021; Schöner et al., 2019), where snow cover at lower altitudes is highly sensitive to fluctuating temperatures, while higher altitudes remain less affected due to persistent sub-freezing conditions. Similarly, studies in the French Alps have shown that snow cover is particularly sensitive to temperature at elevations below 2,000 m, where it tends to fluctuate with cold and warm cycles associated with winter frontal systems (Beniston, 2003).
Our binomial GLMM model results further confirm the clear relationship between snow presence/absence and the climate variables of temperature, precipitation, and their interaction. The model effectively captures the key factors influencing snow probability, with findings indicating that temperature exerts a stronger influence on snow presence than changes in precipitation. This observation aligns with the correlations observed between NDSI, temperature, and precipitation, reinforcing the significant role of temperature in snow dynamics. In the context of climate change, the results demonstrate that the probability of observing snow across Switzerland is expected to decrease significantly by the end of the century, regardless of the emission scenario considered. This finding is consistent with the study done by Marty et al. (2017), which found a marked reduction in snow duration and mass in the Alps throughout the century, across all emission scenarios and climate models. These changes are closely linked to a significant increase in temperature in the Alps for all time periods and emission scenarios, with a strongest warming for the high-end RCP 8.5 emission scenario (Kotlarski et al., 2023). As noted by Räisänen (2008), an increase in temperature is expected to reduce the fraction of precipitation that falls as snow and to accelerate snowmelt, further contributing to the decline in snow probability. The magnitude of the decrease in snow probability can be significantly mitigated under an intervention emission scenario like RCP 2.6, though substantial changes are still projected. In general, and for all indicators, the magnitude of the change signals increases with the assumed greenhouse gas forcing, i.e., is smallest for RCP 2.6 and largest for RCP 8.5 with RCP 4.5 being located in between. By the end of the century, under RCP 2.6, snow-free areas (0%–20% probability of observing snow) are expected to increase by 22% at low to mid-elevations during January and February, along with a 7% reduction in consistently snow-covered areas (80%–100% probability of observing snow) between 500 and 2,500 m. If no action is taken to reduce greenhouse gas emissions, snow-free regions between 0 and 1,500 m could expand by more than 43%, while areas consistently covered in snow between 1,000 and 2000 m could shrink by over 50%.
This would have a profound impact on Switzerland’s Alpine tourism economy, which heavily relies on the ski industry. As Marty et al. (2017) demonstrated, the snow cover of a snow-scarce winter below 1,500 m today could become the average by the end of the century. The projected changes are even more pronounced during the transitional months of April and May, with a projected 40% increase in snow-free areas at mid-elevations (1,000–2,500 m) and a 14% decrease in areas almost always covered by snow at 1,500–3,000 m under RCP 2.6. Under the more extreme RCP 8.5 scenario, the changes are even more severe, with a 46% increase in snow-free areas and a 56% decrease in consistent snow cover. These findings underscore the acute sensitivity of snow cover to climate change, especially in transitional altitude zones where even minor variations in temperature and precipitation can lead to significant changes in snow presence. As observed by Beniston et al. (2003), at higher altitudes, warmer conditions may not raise temperatures beyond the freezing point, making precipitation rather than temperature the key factor in determining snow presence. Consequently, strong warming at low elevations will lead to the removal of almost all the snowpack. In contrast, at very high elevations, the impact on snow will be modest, as temperatures will remain cold enough to sustain snow for much of the year.
It is important to note that these simulations represent possible future scenarios for snow cover based on projected climate models, rather than a definitive future reality. While the model results provide a plausible framework for impact analyses, limitations remain. The 2 km resolution used in the models, though detailed, may not fully capture the intricate dynamics of snow in the Alps, where fine-scale variations in terrain significantly affect snow accumulation and (Bonavita, 2023). Additionally, the use of satellite EO data as inputs can introduce uncertainties due to cloud cover and inconsistent temporal coverage, especially in regions with complex topography (Alizadeh et al., 2022). These factors necessitate careful interpretation of the model outputs. These uncertainties make it essential to interpret the results carefully and consider a range of potential outcomes when planning adaptation strategies.
This study applies the SOfS algorithm to the Swiss territory for the first time, offering a comprehensive analysis of the snow cover dynamics (NDSI and SCA) over the past 4 decades. The results highlight a clear reduction in snow extent and timing over the past 37 years, with further declines expected by the end of the century, varying by emission scenarios. These changes will significantly impact key sectors such as agriculture, water supply, tourism, and electricity production. In particular, the tourism sector, especially in Alpine valleys, will face challenges with snow availability, requiring adaptive management strategies for ski resorts. Additionally, altered snowmelt timing may affect alpine ecosystems, with potential impacts on plant and animal species.
This study underscores the importance of long-term, evenly distributed EO data at mid-to high spatial resolutions. It also highlights the advantages of working within an EO data cube environment. This approach allowed us to integrate data from different sensors within a single time series and access a vast amount of analysis-ready data. As a result, we developed an innovative methodology using medium-resolution data (Landsat and Sentinel-2), which enabled us to map snow cover over a long time series while optimizing the number of clear observations per pixel to better represent the complexities of mountain areas. Data cube technology facilitates comprehensive analyses of snow cover evolution, compared to more traditional scene-based approaches, which may limit our ability to detect change. As highlighted by Guo et al. (2021), multi-temporal Earth observation data can uncover large-scale processes and patterns that may not be detectable through traditional methods. However, despite the multi-sensor approach and different spatial and temporal strategies to increase the number of clear observations, challenges remain, particularly with cloud cover issues, which were more prevalent before 2015 (prior to the arrival of Sentinel-2) and at high altitudes, where snow cover is critically important for hydrology, mountain ecosystems, glacier dynamics, and mountain (ski) tourism (Matiu et al., 2021).
In the future, the continued development and refinement of Earth observation technologies, alongside the integration of additional data sources, offer promising avenues for improving our understanding of snow cover dynamics and addressing the challenges posed by a changing climate.
The original contributions presented in the study are included in the article/Supplementary Material, further inquiries can be directed to the corresponding author.
CP: Conceptualization, Data curation, Formal Analysis, Investigation, Methodology, Validation, Visualization, Writing–original draft, Writing–review and editing. PT: Methodology, Writing–review and editing. PP: Conceptualization, Project administration, Supervision, Writing–review and editing. GG: Conceptualization, Funding acquisition, Investigation, Project administration, Resources, Software, Supervision, Writing–review and editing.
The author(s) declare financial support was received for the research, authorship, and/or publication of this article. The authors would like to thank the Swiss Federal Office for the Environment (FOEN) for their financial support to the Swiss Data Cube. Results of this publication partly rely on the Swiss Data Cube (http://www.swissdatacube.org), operated and maintained by UN Environment/GRID-Geneva, the University of Geneva, the University of Zurich and the Swiss Federal Institute for Forest, Snow and Landscape Research WSL.
The authors declare that the research was conducted in the absence of any commercial or financial relationships that could be construed as a potential conflict of interest.
The author(s) declare that no Generative AI was used in the creation of this manuscript.
All claims expressed in this article are solely those of the authors and do not necessarily represent those of their affiliated organizations, or those of the publisher, the editors and the reviewers. Any product that may be evaluated in this article, or claim that may be made by its manufacturer, is not guaranteed or endorsed by the publisher.
The views expressed in the paper are those of the authors and do not necessarily reflect the views of the institutions they belong to.
The Supplementary Material for this article can be found online at: https://www.frontiersin.org/articles/10.3389/frsen.2025.1542181/full#supplementary-material
Adler, B., Wilczak, J. M., Bianco, L., Bariteau, L., Cox, C. J., de Boer, G., et al. (2023). Impact of seasonal snow-cover change on the observed and simulated state of the atmospheric boundary layer in a high-altitude mountain valley. J. Geophys. Res. Atmos. 128 (12), e2023JD038497. doi:10.1029/2023jd038497
Alizadeh, M., Zabihi, H., Wolf, I. D., Langat, P. K., Pour, A. B., and Ahmad, A. (2022). Remote sensing technique and ICONA based-GIS mapping for assessing the risk of soil erosion: a case of the Rudbar Basin, Iran. Environ. Earth Sci. 81 (21), 512. doi:10.1007/s12665-022-10634-z
Armstrong, R. L., and Brun, E. (2008). Snow and climate: physical processes, surface energy exchange and modeling. Cambridge University Press.
Barnes, J. C., and Smallwood, M. D. (1975). Synopsis of current satellite snow mapping techniques, with emphasis on the application of near-infrared data.
Bartolini, E., Claps, P., and D'odorico, P. (2009). Interannual variability of winter precipitation in the European alps: relations with the north atlantic oscillation. Hydrology Earth Syst. Sci. 13 (1), 17–25. doi:10.5194/hess-13-17-2009
Bates, D., Maechler, M., Bolker, B., Walker, S., Christensen, R. H. B., Singmann, H., et al. (2015). Package ‘lme4. convergence 12 (1), 2.
Baumann, P., Mazzetti, P., Ungar, J., Barbera, R., Barboni, D., Beccati, A., et al. (2016). Big data analytics for earth sciences: the EarthServer approach. Int. J. digital earth 9 (1), 3–29. doi:10.1080/17538947.2014.1003106
Baumann, P., Merticariu, V., Misev, D., Pham Huu, B., and Langella, G. (2024). Datacubes as enabler for advanced decision support systems in land management. Land Degrad. and Dev. 35, 3579–3592. doi:10.1002/ldr.5153
Beniston, M. (2003). Climatic change in mountain regions: a review of possible impacts. Clim. Change 59 (1), 5–31. doi:10.1007/978-94-015-1252-7_2
Beniston, M. (2012). Is snow in the Alps receding or disappearing? Wiley Interdiscip. Rev. Clim. Change 3 (4), 349–358. doi:10.1002/wcc.179
Beniston, M., Farinotti, D., Stoffel, M., Andreassen, L. M., Coppola, E., Eckert, N., et al. (2018). The European mountain cryosphere: a review of its current state, trends, and future challenges. Cryosphere 12 (2), 759–794. doi:10.5194/tc-12-759-2018
Beniston, M., Keller, F., Koffi, B., and Goyette, S. (2003). Estimates of snow accumulation and volume in the Swiss Alps under changing climatic conditions. Theor. Appl. Climatol. 76, 125–140. doi:10.1007/s00704-003-0016-5
Beniston, M., and Stoffel, M. (2014). Assessing the impacts of climatic change on mountain water resources. Sci. Total Environ. 493, 1129–1137. doi:10.1016/j.scitotenv.2013.11.122
Bonavita, M. (2023). On the limitations of data-driven weather forecasting models. arXiv Prepr. arXiv:2309.08473. doi:10.48550/arXiv.2309.08473
Ceppi, P., Scherrer, S. C., Fischer, A. M., and Appenzeller, C. (2012). Revisiting Swiss temperature trends 1959–2008. Int. J. Climatol. 32 (2), 203–213. doi:10.1002/joc.2260
Chatenoux, B., Richard, J.-P., Small, D., Roeoesli, C., Wingate, V., Poussin, C., et al. (2021). The Swiss data cube, analysis ready data archive using earth observations of Switzerland. Sci. data 8 (1), 295. doi:10.1038/s41597-021-01076-6
Chen, Y., Lu, D., Moran, E., Batistella, M., Dutra, L. V., Sanches, I. D. A., et al. (2018). Mapping croplands, cropping patterns, and crop types using MODIS time-series data. Int. J. Appl. earth observation geoinformation 69, 133–147. doi:10.1016/j.jag.2018.03.005
Chokmani, K., Bernier, M., and Royer, A. (2013). A merging algorithm for regional snow mapping over eastern Canada from AVHRR and SSM/I data. Remote Sens. 5 (11), 5463–5487. doi:10.3390/rs5115463
Claverie, M., Ju, J., Masek, J. G., Dungan, J. L., Vermote, E. F., Roger, J.-C., et al. (2018). The Harmonized Landsat and Sentinel-2 surface reflectance data set. Remote Sens. Environ. 219, 145–161. doi:10.1016/j.rse.2018.09.002
Da Ronco, P., Avanzi, F., De Michele, C., Notarnicola, C., and Schaefli, B. (2020). Comparing MODIS snow products collection 5 with collection 6 over Italian central apennines. Int. J. remote Sens. 41 (11), 4174–4205. doi:10.1080/01431161.2020.1714778
Desinayak, N., Prasad, A. K., El-Askary, H., Kafatos, M., and Asrar, G. R. (2022). Snow cover variability and trend over the Hindu Kush Himalayan region using MODIS and SRTM data. Annales Geophysicae,
Dietz, A. J., Kuenzer, C., Gessner, U., and Dech, S. (2012). Remote sensing of snow–a review of available methods. Int. J. remote Sens. 33 (13), 4094–4134. doi:10.1080/01431161.2011.640964
Dozier, J., and Painter, T. H. (2004). Multispectral and hyperspectral remote sensing of alpine snow properties. Annu. Rev. Earth Planet. Sci. 32 (1), 465–494. doi:10.1146/annurev.earth.32.101802.120404
Durand, Y., Giraud, G., Laternser, M., Etchevers, P., Mérindol, L., and Lesaffre, B. (2009). Reanalysis of 47 years of climate in the French Alps (1958–2005): climatology and trends for snow cover. J. Appl. meteorology Climatol. 48 (12), 2487–2512. doi:10.1175/2009jamc1810.1
Foppa, N., and Seiz, G. (2011). Inter-annual variations of snow days over Switzerland from 2000–2010 derived from MODIS satellite data. Cryosphere Discuss. 5 (5), 2409–2435. doi:10.5194/tc-6-331-2012
Foppa, N., and Seiz, G. (2012). Inter-annual variations of snow days over Switzerland from 2000–2010 derived from MODIS satellite data. Cryosphere 6 (2), 331–342. doi:10.5194/tc-6-331-2012
Frau, L., Rizvi, S. R., Chatenoux, B., Poussin, C., Richard, J.-P., and Giuliani, G. (2018). Snow observations from space: an approach to map snow cover from three decades of landsat imagery across Switzerland. IGARSS 2018-2018 IEEE Int. Geoscience Remote Sens. Symposium, 8663–8666. doi:10.1109/igarss.2018.8518394
Frei, C. (2018). Interpolation of temperature in a mountainous region using nonlinear profiles and non-Euclidean distances. Int. J. Climatol. 34 (5), 1585–1605. doi:10.1002/joc.3786
Gascoin, S., Grizonnet, M., Bouchet, M., Salgues, G., and Hagolle, O. (2019). Theia snow collection: High-resolution operational snow cover maps from Sentinel-2 and landsat-8 data. Earth. System. Sci. Data. 11 (2), 493–514.
Gascoin, S., Luojus, K., Nagler, T., Lievens, H., Masiokas, M., Jonas, T., et al. (2024). Remote sensing of mountain snow from space: status and recommendations. Front. Earth. Sci. 12, 1381323.
Giuliani, G., Chatenoux, B., De Bono, A., Rodila, D., Richard, J.-P., Allenbach, K., et al. (2017). Building an earth observations data cube: lessons learned from the swiss data cube (sdc) on generating analysis ready data (ard). Big Earth Data 1 (1-2), 100–117. doi:10.1080/20964471.2017.1398903
Gobiet, A., Kotlarski, S., Beniston, M., Heinrich, G., Rajczak, J., and Stoffel, M. (2014). 21st century climate change in the European Alps—a review. Sci. Total Environ. 493, 1138–1151. doi:10.1016/j.scitotenv.2013.07.050
Guo, H., Cai, Y., Yang, Z., Zhu, Z., and Ouyang, Y. (2021). Dynamic simulation of coastal wetlands for Guangdong-Hong Kong-Macao Greater Bay area based on multi-temporal Landsat images and FLUS model. Ecol. Indic. 125, 107559. doi:10.1016/j.ecolind.2021.107559
Hall, D. K., Foster, J. L., Salomonson, V. V., Klein, A. G., and Chien, J. (2001a). Development of a technique to assess snow-cover mapping errors from space. IEEE Trans. Geoscience remote Sens. 39 (2), 432–438. doi:10.1109/36.905251
Hall, D. K., Riggs, G. A., and Salomonson, V. V. (1995). Development of methods for mapping global snow cover using moderate resolution imaging spectroradiometer data. Remote Sens. Environ. 54 (2), 127–140. doi:10.1016/0034-4257(95)00137-p
Hall, D. K., Riggs, G. A., Salomonson, V. V., Barton, J., Casey, K., Chien, J., et al. (2001b). Algorithm theoretical basis document (ATBD) for the MODIS snow and sea ice-mapping algorithms. Nasa Gsfc 45, 14–28.
Hirsch, R. M., and Slack, J. R. (1984). A nonparametric trend test for seasonal data with serial dependence. Water Resour. Res. 20 (6), 727–732. doi:10.1029/wr020i006p00727
Hock, R., Bliss, A., Marzeion, B., Giesen, R. H., Hirabayashi, Y., Huss, M., et al. (2019). GlacierMIP–A model intercomparison of global-scale glacier mass-balance models and projections. J. Glaciol. 65 (251), 453–467. doi:10.1017/jog.2019.22
Hüsler, F. (2014). A satellite-based snow cover climatology (19852011) for the European Alps derived from AVHRR data. The Cryosphere. 8 (1), 73–90.
Huss, M., Bookhagen, B., Huggel, C., Jacobsen, D., Bradley, R. S., Clague, J. J., et al. (2017). Toward mountains without permanent snow and ice. Earth's Future 5 (5), 418–435. doi:10.1002/2016ef000514
Ibrahim, E., Jiang, J., Lema, L., Barnabé, P., Giuliani, G., Lacroix, P., et al. (2021). Cloud and cloud-shadow detection for applications in mapping small-scale mining in Colombia using sentinel-2 imagery. Remote Sens. 13 (4), 736. doi:10.3390/rs13040736
IPCC (2013). Climate change 2013: The physical science basis: Working group I contribution to the fifth assessment report of the intergovernmental panel on climate change. Cambridge University Press.
IPCC (2019). Special report on the impacts of global warming of 1.5°C above pre-industrial levels and related global greenhouse gas emission pathways, in the context of strengthening the global response to the threat of climate change, sustainable development, and efforts to eradicate poverty. Cambridge University Press.
Jennings, K. S., Winchell, T. S., Livneh, B., and Molotch, N. P. (2018). Spatial variation of the rain–snow temperature threshold across the Northern Hemisphere. Nat. Commun. 9 (1), 1148. doi:10.1038/s41467-018-03629-7
Keller, F., Goyette, S., and Beniston, M. (2005). Sensitivity analysis of snow cover to climate change scenarios and their impact on plant habitats in alpine terrain. Clim. Change 72 (3), 299–319. doi:10.1007/s10584-005-5360-2
Killough, B. (2018). “Overview of the open data cube initiative. IGARSS 2018-2018,” in IEEE international geoscience and remote sensing symposium.
Kotlarski, S., Gobiet, A., Morin, S., Olefs, M., Rajczak, J., and Samacoïts, R. (2023). 21st Century alpine climate change. Clim. Dyn. 60 (1), 65–86. doi:10.1007/s00382-022-06303-3
Kunkel, K. E., Robinson, D. A., Champion, S., Yin, X., Estilow, T., and Frankson, R. M. (2016). Trends and extremes in Northern Hemisphere snow characteristics. Curr. Clim. Change Rep. 2, 65–73. doi:10.1007/s40641-016-0036-8
Laternser, M., and Schneebeli, M. (2003). Long-term snow climate trends of the Swiss Alps (1931–99). Int. J. Climatol. A J. R. Meteorological Soc. 23 (7), 733–750. doi:10.1002/joc.912
Lemke, P., Ren, J., Alley, R. B., Allison, I., Carrasco, J., Flato, G., et al. (2007) “Observations,” in Changes in snow, ice and frozen ground. Chapter 4.
Lencioni, V. (2018). Glacial influence and stream macroinvertebrate biodiversity under climate change: lessons from the Southern Alps. Sci. Total Environ. 622, 563–575. doi:10.1016/j.scitotenv.2017.11.266
Lewis, A., Oliver, S., Lymburner, L., Evans, B., Wyborn, L., Mueller, N., et al. (2017). The Australian geoscience data cube—foundations and lessons learned. Remote Sens. Environ. 202, 276–292. doi:10.1016/j.rse.2017.03.015
Mann, H. B. (1945). Nonparametric tests against trend. Econ. J. Econ. Soc. 13, 245–259. doi:10.2307/1907187
Marty, C. (2008). Regime shift of snow days in Switzerland. Geophys. Res. Lett. 35 (12). doi:10.1029/2008gl033998
Marty, C., Schlögl, S., Bavay, M., and Lehning, M. (2017). How much can we save? Impact of different emission scenarios on future snow cover in the Alps. Cryosphere 11 (1), 517–529. doi:10.5194/tc-11-517-2017
Matiu, M., Crespi, A., Bertoldi, G., Carmagnola, C. M., Marty, C., Morin, S., et al. (2021). Observed snow depth trends in the European Alps: 1971 to 2019. Cryosphere 15 (3), 1343–1382. doi:10.5194/tc-15-1343-2021
Matson, M. (1991). NOAA satellite snow cover data. Glob. Planet. Change 4 (1-3), 213–218. doi:10.1016/0921-8181(91)90095-e
MeteoSwiss (2016a). Monthly and yearly mean temperature: TabsM and TabsY [Data]. Swiss federal office of meteorology and climatology. Available at: https://www.meteoswiss.admin.ch.
MeteoSwiss (2016b). Monthly and yearly precipitation: RhiresM and RhiresY [Data]. Swiss federal office of meteorology and climatology. Available at: https://www.meteoswiss.admin.ch.
Militino, A. F., Moradi, M., and Ugarte, M. D. (2020). On the performances of trend and change-point detection methods for remote sensing data. Remote Sens. 12 (6), 1008. doi:10.3390/rs12061008
Mote, P. W. (2006). Climate-driven variability and trends in mountain snowpack in western North America. J. Clim. 19 (23), 6209–6220. doi:10.1175/jcli3971.1
Mote, P. W., Hamlet, A. F., Clark, M. P., and Lettenmaier, D. P. (2005). Declining mountain snowpack in western North America. Bull. Am. Meteorological Soc. 86 (1), 39–50. doi:10.1175/bams-86-1-39
Nazarova, T., Martin, P., and Giuliani, G. (2020). Monitoring vegetation change in the presence of high cloud cover with Sentinel-2 in a lowland tropical forest region in Brazil. Remote Sens. 12 (11), 1829. doi:10.3390/rs12111829
Neeti, N., Rogan, J., Christman, Z., Eastman, J. R., Millones, M., Schneider, L., et al. (2012). Mapping seasonal trends in vegetation using AVHRR-NDVI time series in the Yucatán Peninsula, Mexico. Remote Sens. Lett. 3 (5), 433–442. doi:10.1080/01431161.2011.616238
Nolin, A. W. (2010). Recent advances in remote sensing of seasonal snow. J. Glaciol. 56 (200), 1141–1150. doi:10.3189/002214311796406077
Notarnicola, C. (2022). Overall negative trends for snow cover extent and duration in global mountain regions over 1982–2020. Sci. Rep. 12 (1), 13731. doi:10.1038/s41598-022-16743-w
Notarnicola, C. (2024). Snow cover phenology dataset over global mountain regions from 2000 to 2023. Data Brief 56, 110860. doi:10.1016/j.dib.2024.110860
Paul, F. (2002). Changes in glacier area in tyrol, Austria, between 1969 and 1992 derived from landsat 5 thematic mapper and Austrian glacier inventory data. Int. J. remote Sens. 23 (4), 787–799. doi:10.1080/01431160110070708
Pepin, N., Deng, H., Zhang, H., Zhang, F., Kang, S., and Yao, T. (2019). An examination of temperature trends at high elevations across the Tibetan Plateau: the use of MODIS LST to understand patterns of elevation-dependent warming. J. Geophys. Res. Atmos. 124 (11), 5738–5756. doi:10.1029/2018jd029798
Poussin, C., Guigoz, Y., Palazzi, E., Terzago, S., Chatenoux, B., and Giuliani, G. (2019). Snow cover evolution in the gran paradiso national Park, Italian alps, using the earth observation data cube. Data 4 (4), 138. doi:10.3390/data4040138
Poussin, C., Peduzzi, P. and G., and Giuliani, G. (2024). Snow observation from space: an approach to improving snow cover detection using four decades of Landsat and Sentinel-2 imageries across Switzerland. Sci. Remote Sens. 11, 100182. doi:10.1016/j.srs.2024.100182
Poussin, C., Timoner, P., Chatenoux, B., Giuliani, G., and Peduzzi, P. (2023). Improved Landsat-based snow cover mapping accuracy using a spatiotemporal NDSI and generalized linear mixed model. Sci. Remote Sens. 7, 100078. doi:10.1016/j.srs.2023.100078
Pulliainen, J., Luojus, K., Derksen, C., Mudryk, L., Lemmetyinen, J., Salminen, M., et al. (2020). Patterns and trends of Northern Hemisphere snow mass from 1980 to 2018. Nature 581 (7808), 294–298. doi:10.1038/s41586-020-2258-0
Räisänen, J. (2008). Warmer climate: less or more snow? Clim. Dyn. 30, 307–319. doi:10.1007/s00382-007-0289-y
Ranzi, R., Grossi, G., and Bacchi, B. (1999). Ten years of monitoring areal snowpack in the Southern Alps using NOAA-AVHRR imagery, ground measurements and hydrological data. Hydrol. Process. 13 (12-13), 2079–2095. doi:10.1002/(sici)1099-1085(199909)13:12/13<2079::aid-hyp875>3.0.co;2-u
Riggs, G. A., Hall, D. K., and Román, M. O. (2015). MODIS snow products collection 6 user guide. Boulder, CO, USA: National Snow and Ice Data Center, 66.
Salzano, R., Salvatori, R., Valt, M., Giuliani, G., Chatenoux, B., and Ioppi, L. (2019). Automated classification of terrestrial images: the contribution to the remote sensing of snow cover. Geosciences 9 (2), 97. doi:10.3390/geosciences9020097
Scherrer, S. C., Appenzeller, C., and Laternser, M. (2004). Trends in Swiss Alpine snow days: the role of local-and large-scale climate variability. Geophys. Res. Lett. 31 (13). doi:10.1029/2004gl020255
Schöner, W., Auer, I., and Böhm, R. (2009). Long term trend of snow depth at Sonnblick (Austrian Alps) and its relation to climate change. Hydrological Process. Int. J. 23 (7), 1052–1063. doi:10.1002/hyp.7209
Schöner, W., Koch, R., Matulla, C., Marty, C., and Tilg, A.-M. (2019). Spatiotemporal patterns of snow depth within the Swiss-Austrian Alps for the past half century (1961 to 2012) and linkages to climate change. Int. J. Climatol. 39 (3), 1589–1603. doi:10.1002/joc.5902
Selkowitz, D. J., and Forster, R. R. (2016). Automated mapping of persistent ice and snow cover across the western US with Landsat. ISPRS J. Photogrammetry Remote Sens. 117, 126–140. doi:10.1016/j.isprsjprs.2016.04.001
Sen, P. K. (1968). Estimates of the regression coefficient based on Kendall's tau. J. Am. Stat. Assoc. 63 (324), 1379–1389. doi:10.2307/2285891
Sikorska-Senoner, A. E., Rajczak, J., Zappa, M., and Kotlarski, S. (2024). User-tailored sub-selection of climate model ensemble members for impact studies. Sci. Total Environ. 952, 175769. doi:10.1016/j.scitotenv.2024.175769
Smith, T., and Bookhagen, B. (2020). Assessing multi-temporal snow-volume trends in high mountain Asia from 1987 to 2016 using high-resolution passive microwave data. Front. Earth Sci. 8, 559175. doi:10.3389/feart.2020.559175
SRTM (2015). SRTM 1 Arc-Second Global Data. U.S. Geological Survey (USGS). Available at: https://www.usgs.gov/land-resources/nli/landsat.
Steger, C., Kotlarski, S., Jonas, T., and Schär, C. (2013). Alpine snow cover in a changing climate: a regional climate model perspective. Clim. Dyn. 41, 735–754. doi:10.1007/s00382-012-1545-3
Steiger, R., and Stötter, J. (2013). Climate change impact assessment of ski tourism in Tyrol. Tour. Geogr. 15 (4), 577–600. doi:10.1080/14616688.2012.762539
Strobl, P., Baumann, P., Lewis, A., Szantoi, Z., Killough, B., Purss, M., et al. (2017). “The six faces of the data cube,” in Proceedings of the 2017 conference on big data from space, Toulouse (France).
Terzago, S., Fratianni, S., and Cremonini, R. (2013). Winter precipitation in western Italian alps (1926–2010) trends and connections with the north atlantic/arctic oscillation. Meteorology Atmos. Phys. 119, 125–136. doi:10.1007/s00703-012-0231-7
Thuiller, W., Guéguen, M., Renaud, J., Karger, D. N., and Zimmermann, N. E. (2019). Uncertainty in ensembles of global biodiversity scenarios. Nat. Commun. 10 (1), 1446. doi:10.1038/s41467-019-09519-w
Tong, R., Parajka, J., Komma, J., and Blöschl, G. (2020). Mapping snow cover from daily Collection 6 MODIS products over Austria. J. Hydrology 590, 125548. doi:10.1016/j.jhydrol.2020.125548
Van Vuuren, D. P., Stehfest, E., den Elzen, M. G., Kram, T., van Vliet, J., Deetman, S., et al. (2011). RCP2.6: exploring the possibility to keep global mean temperature increase below 2°C. Clim. Change 109, 95–116. doi:10.1007/s10584-011-0152-3
Wang, X., Wang, J., Che, T., Huang, X., Hao, X., and Li, H. (2018). Snow cover mapping for complex mountainous forested environments based on a multi-index technique. IEEE J. Sel. Top. Appl. Earth Observations Remote Sens. 11 (5), 1433–1441. doi:10.1109/jstars.2018.2810094
Wielke, L.-M., Haimberger, L., and Hantel, M. (2004). Snow cover duration in Switzerland compared to Austria. Meteorol. Z. 13 (1), 13–17. doi:10.1127/0941-2948/2004/0013-0013
Wunderle, S., Droz, M., and Kleindienst, H. (2002). Spatial and temporal analysis of the snow line in the alps: based on NOAA-AVHRR data. Geogr. Helvetica 57 (3), 170–183. doi:10.5194/gh-57-170-2002
Yin, D., Cao, X., Chen, X., Shao, Y., and Chen, J. (2013). Comparison of automatic thresholding methods for snow-cover mapping using Landsat TM imagery. Int. J. remote Sens. 34 (19), 6529–6538. doi:10.1080/01431161.2013.803631
Zhang, H., Zhang, F., Zhang, G., Che, T., Yan, W., Ye, M., et al. (2019). Ground-based evaluation of MODIS snow cover product V6 across China: implications for the selection of NDSI threshold. Sci. Total Environ. 651, 2712–2726. doi:10.1016/j.scitotenv.2018.10.128
Zhao, G., Ding, W., Tian, J., Liu, J., Gu, Y., Shi, S., et al. (2022). Spearman rank correlations analysis of the elemental, mineral concentrations, and mechanical parameters of the Lower Cambrian Niutitang shale: a case study in the Fenggang block, Northeast Guizhou Province, South China. J. Petroleum Sci. Eng. 208, 109550. doi:10.1016/j.petrol.2021.109550
Keywords: Earth observations, Earth observation data cube, Landsat and Sentinel-2 multi-sensor time series, snow cover changes, climate change, representative concentration pathway scenarios
Citation: Poussin C, Timoner P, Peduzzi P and Giuliani G (2025) Past and future trends in swiss snow cover: multi-decades analysis using the snow observation from space algorithm. Front. Remote Sens. 6:1542181. doi: 10.3389/frsen.2025.1542181
Received: 09 December 2024; Accepted: 20 January 2025;
Published: 13 February 2025.
Edited by:
Peter Potapov, University of Maryland, United StatesReviewed by:
Hongjie Xie, University of Texas at San Antonio, United StatesCopyright © 2025 Poussin, Timoner, Peduzzi and Giuliani. This is an open-access article distributed under the terms of the Creative Commons Attribution License (CC BY). The use, distribution or reproduction in other forums is permitted, provided the original author(s) and the copyright owner(s) are credited and that the original publication in this journal is cited, in accordance with accepted academic practice. No use, distribution or reproduction is permitted which does not comply with these terms.
*Correspondence: Charlotte Poussin, Y2hhcmxvdHRlLnBvdXNzaW5AdW5pZ2UuY2g=
†ORCID: Pablo Timoner, orcid.org/0000-0003-4757-4928
Disclaimer: All claims expressed in this article are solely those of the authors and do not necessarily represent those of their affiliated organizations, or those of the publisher, the editors and the reviewers. Any product that may be evaluated in this article or claim that may be made by its manufacturer is not guaranteed or endorsed by the publisher.
Research integrity at Frontiers
Learn more about the work of our research integrity team to safeguard the quality of each article we publish.