 An Vo Quang
 Nicolas Delbart
 Gabriel Jaffrain
 Camille Pinet
94% of researchers rate our articles as excellent or good
Learn more about the work of our research integrity team to safeguard the quality of each article we publish.
Find out more
ORIGINAL RESEARCH article
Front. Remote Sens., 05 March 2025
Sec. Land Cover and Land Use Change
Volume 6 - 2025 | https://doi.org/10.3389/frsen.2025.1538808
This article is part of the Research TopicOne Forest Vision Initiative (OFVi) for Monitoring Tropical Forests: The Remote Sensing PilarView all 4 articles
Forest degradation is the alteration of forest biomass, structure or services without the conversion to another land cover. Unlike deforestation, forest degradation is subtle and less visible, but it often leads to deforestation eventually. In this study we conducted a comprehensive analysis of degraded forest detection in the Guinea forest region using remote sensing techniques. Our aim was to explore the use of Sentinel-2 satellite imagery in detecting and monitoring forest degradation in Guinea, West Africa, where selective logging is the primary degradation process observed. Consequently, degraded forests exhibit fewer large trees than intact forests, resulting in discontinuities in the canopy structure. This study consists in a comparative analysis between the contextual Random Forest (RF) algorithm previously introduced, three convolutional neural network (CNN) models (U-Net, SegNet, ResNet-UNet), and the photo-interpreted (PI) method, with all model results undergoing independent validation by external Guinean photo-interpreters. The CNN and RF models were trained using subsets of the maps obtained by the PI method. The results show that the CNN U-Net model is the most adequate method, with an 94% agreement with the photo-interpreted map in the Ziama massif for the year 2021 unused for the training. All models were also tested over the Mount Nimba area, which was not included in the training dataset. Again, the U-Net model surpassed all other models with an overall agreement above 91%, and an accuracy of 91.5% as established during a second validation exercise carried out by independent photo-interpreters following the widely used Verified Carbon Standard validation methodology. These results underscore the robustness and efficiency of the U-Net model in accurately identifying degraded forests across diverse areas with similar typology of degraded forests. Altogether, the results show that the method is transferable and applicable across different years and among the different Guinean forest regions, such as the Ziama, Diécké, and Nimba massifs. Based on the superior performance and robustness demonstrated by the U-Net model, we selected it to replace the previous photo-interpretation-based method for forest class updates in the land cover map produced for the Guinean ministry of agriculture.
Deforestation refers to the conversion of forests into non-forest areas, such as croplands, urban areas and plantations, while forest degradation signifies a gradual change in forest structure without a modification in land use (FAO, 2020). Besides, forest degradation encompasses a range of changes that do not necessarily involve a decrease in forest cover but rather manifest as reductions in biomass, biodiversity, alterations in species composition, and soil degradation (Chazdon, 2008; Chazdon et al., 2016). As a result, degraded forests no longer provide the same ecosystem services as intact primary forests. The impacts of degradation can vary, leading to subtle modifications in the canopy structure and height at small scales, or substantial loss of biomass at larger scales (Chazdon et al., 2016; Ghazoul et al., 2015; Putz and Redford, 2010; Thompson et al., 2013). Vásquez-Grandón et al. (2018) emphasize that the absence of consensus on the definition of degraded forests is due to these circumstances and highlight the significance of establishing local criteria and thresholds to identify the transition from ongoing degradation processes to the state of degraded forests. However, assessing and quantifying forest degradation and degraded forest extents pose significant challenges due to the maintenance of the forested environment and the complexity of its characterization.
The causes of forest degradation are diverse and include agricultural expansion, selective logging targeting commercially valuable or rare wood species, recurrent fires of anthropogenic origin, road construction, or pollution from mining projects (IPCC, 2019). This is exacerbated by climate change and especially by the increasing severity of droughts or the frequency of wildfires (IPCC, 2021).
Forest degradation is context-dependent, driven by specific factors that vary across regions. For example, in West Africa, shifting agricultural practices can result in the regeneration of secondary forests, while slash-and-burn techniques affect soil fertility and hinder tree regeneration. Infrastructural developments, such as roads associated with mining and oil industries, disrupt the natural dispersal of plants and animal movements within forest remnants, leading to shifts in species composition, reduced species diversity, and alterations in microclimatic conditions along newly created edges. These changes may contribute to the desiccation of trees at the forest edges and to the increased vulnerability of remaining forest areas (Vásquez-Grandón et al., 2018; Chazdon et al., 2016; Ghazoul et al., 2015; Briant et al., 2010; Ernst et al., 2010; Wasseige and Defourny, 2004; Wasseige et al., 2014). Additionally, forest degradation carries significant implications for the forest carbon budget with increased carbon emissions (Chaplin-Kramer et al., 2015; Maxwell et al., 2019; Qin et al., 2021; Bullock and Woodcock, 2021) and higher risks of zoonotic diseases (Rulli et al., 2017; Olivero et al., 2017; Dehaudt et al., 2022). Furthermore, the significant role of degradation as a precursor to deforestation is evident, with approximately 45% of pantropical cases showing that forest degradation is followed by deforestation (Vancutsem et al., 2021).
Unlike deforestation, which is more easily identifiable, forest degradation poses unique challenges for quantification. Moreover, its occurrence is intricately linked to location, local human activities, climate, and forest types, resulting in varying extents and temporal scales of degradation. The limited availability of global-scale detection methodologies further compounds the challenge. Nonetheless, remote sensing emerges as a crucial solution for addressing the complexities associated with estimating degraded forest surfaces. It enables the detection and quantification of forest degradation across expansive areas, facilitating an enhanced understanding of its spatial and temporal patterns.
Various remote sensing approaches have been employed to detect forest degradation, using data acquired from spaceborne and airborne LiDAR, radar, or optical radiometers (Dupuis et al., 2020).
For instance, changes in the optical spectral fractions (Souza, 2003; Bullock et al., 2020; Matricardi et al., 2020; Souza et al., 2013) and/or indices in forest cover (Zhang et al., 2021) are good indicators of forest degradation, as they capture variations in vegetation health, density, and composition. Synthetic Aperture Radar (SAR) data, such as those from Sentinel-1A or COSMO-SkyMed, are particularly effective in detecting structural changes in forested areas, even under cloud cover, as demonstrated by Kuck et al. (2021), who achieved 88% accuracy in detecting selective logging in the Brazilian Amazon. Similarly, Singh et al. (2021) highlighted the complementarity of optical and SAR data, achieving 86% classification accuracy for forest degradation in India.
LiDAR, with its ability to provide high-resolution three-dimensional structural information, has been used to derive metrics such as canopy height and density, which are directly correlated with forest condition. For instance, Shapiro et al. (2021) introduced a Forest Condition (FC) metric using LiDAR and Landsat data to estimate forest degradation in the Congo Basin, finding FC positively correlated with canopy cover and burn ratio changes. Landsat time series data, characterized by their long-term availability and wide coverage, provides a comprehensive perspective on forest degradation dynamics. Chen et al. (2021) utilized Continuous Change Detection and Classification - Spectral Mixture Analysis (CCDC-SMA) on Google Earth Engine to monitor both abrupt and gradual forest degradation in temperate forests, achieving an overall map accuracy of 91% in Georgia. Similarly, Vogelmann et al. (2017) exploited Landsat time series data to characterize forest degradation in Lam Dong Province, Vietnam, providing detailed insights into land cover changes and the persistence of highly protected national reserves over the period from 1973 to 2014.
The complementarity of these technologies lies in their ability to provide unique yet overlapping insights. While optical data excel in capturing vegetation health and spectral changes, SAR provides structural insights unaffected by weather conditions, and LiDAR delivers precise canopy and terrain elevation measurements. Together, these technologies offer a robust framework for detecting and monitoring forest degradation, even in complex and heterogeneous landscapes. Additionally, the detection of secondary signs of disturbances affecting the forest canopy becomes crucial when degraded forests undergo fragmentation due to various factors like road construction, trails, logistics platforms, and farming activities (Mitchell et al., 2017; Wasseige and Defourny, 2004).
This study integrates into a larger scale project, the Agro-Ecological Zoning of Guinea (ZAEG) project that aimed to fulfill the request from the Guinea Ministry of Agriculture for a land use/land cover (LULC) map. The previous 2015 Guinea LULC map developed as part of the ZAEG project, highlighted threats such as agriculture, fire, and wood extraction in Guinea, highlighting the need to monitor the forests. However, among the 47 classes, the “degraded forest” class was underestimating the degraded forest areas. In Guinea most of the degradation results from selective logging. As a result, degraded forests are marked by a reduced presence of mature trees compared to undisturbed forests, resulting in disruptions in the canopy structure (Vo Quang et al., 2022) (Figure 1), which requires specific mapping procedure. The primary motivation for the previous study (Vo Quang et al., 2022) and the current study is to improve the mapping of degraded forests. Besides, in the ZAEG project, the overarching goal is to strengthen knowledge and skills in Global South countries, which conducts to prioritize the use of free imagery data and open-source tools. Finally, we aim to develop an automated method that reduces the manual photo-interpretation workload for national cartographic operators (Vo Quang et al., 2022), except for map validation.

Figure 1. Structural differences observed between dense forests and degraded forests in the Guinean forest region. Selective logging leads to changes in forest composition: the abundance of commercial species decreases, while secondary species within logging gaps increase.
With a focus on long-term sustainability and cost-effectiveness, our research utilizes the freely available and regularly acquired Sentinel-2 optical imagery. The use of SAR Sentinel-1 data has also been investigated, as it was shown to be suitable to monitor forest degradation in other contexts (e.g., Ballère et al., 2021). However, we found that because the C-band SAR signal saturates due to the canopy’s density, it was not adequate for the Guinean context. Therefore, we prioritized Sentinel-2’s optical imagery, which proved to differ between the non-degraded and the degraded forests in Guinea as shown in our previous study (Vo Quang et al., 2022).
In Vo Quang et al. (2022), it was shown that incorporating the spatial context of each pixel, taken as the set of values of the neighbouring pixels, in a Random Forest classification can enhance the detection of degraded forests. Despite this improvement, the method still requires retraining for each new site, posing a significant limitation for national-scale land cover projects. Our goal being to create an automated detection method that does not need to be retrained at each new study site or study year, we here explore the possibility to use convolutional neural networks (CNNs) as they rely on the detection of spatial feature and by definition involve the pixel context for pixel classification. CNNs have shown remarkable success in various domains, including remote sensing (Garcia-Garcia et al., 2017; Qayyum et al., 2017; Han et al., 2012; Zhang et al., 2016). One of the key advantages of deep learning in remote sensing is its ability to automatically learn hierarchical representations of features directly from raw data. CNNs, with their specialized architecture for spatial data, have been extensively applied for tasks such as image classification, object detection, land cover mapping, change detection, and scene understanding in remote sensing applications (Lambers et al., 2019; Cao and Zhang, 2020; Duporge et al., 2021; Zhang et al., 2018; Park and Lee, 2019; Wagner et al., 2020; Wagner et al., 2019).
In image classification, CNNs have demonstrated superior performance in distinguishing different land cover classes by learning discriminative features from multispectral or hyperspectral imagery (Knopp et al., 2020; Yan et al., 2019; Stoian et al., 2019; Emek and Demir, 2020; Irvin et al., 2020; de Bem et al., 2020; Ortega Adarme et al., 2020; Maretto et al., 2021). These models can effectively handle the high-dimensional and complex nature of remote sensing data, capturing spectral, spatial, and contextual information for accurate classification results. Additionally, CNN-based object detection algorithms have proven effective in detecting and delineating specific objects or features of interest, such as buildings, roads, and vegetation, enabling detailed mapping and analysis (Yang et al., 2018; Li et al., 2019; Safonova et al., 2019; Neupane et al., 2021; Osio et al., 2022; Gallwey et al., 2020; Yi et al., 2019).
Deep learning techniques have also been widely applied in the analysis of aerial and satellite imagery for environmental monitoring, including forest degradation detection. For instance, Convolutional Neural Networks (CNNs) have been employed to analyze high-resolution optical and radar imagery for identifying deforestation patterns, mapping fire forests, and monitoring selective logging activities (Kuck et al., 2021; Chen et al., 2021; Ballère et al., 2021; Reiche et al., 2023). CNN-based models have also proven effective in detecting land cover and land use changes, enabling more precise mapping of forested areas and degraded zones (Zhu et al., 2017; Liu et al., 2019).
Overall, deep learning has become a powerful tool for extracting insights from remote sensing data, enabling the learning of complex patterns from raw imagery. With advancements in computing power and large datasets, it is crucial for environmental monitoring and land management. However, challenges remain, particularly the need for large, labeled training datasets for effective CNN implementation. The precise identification and annotation of objects within training images remain a bottleneck for many satellite data applications (Zhu et al., 2017; Hua et al., 2022). Annotating images requires specialized training, in-depth subject knowledge, and technical skills. Digitization is a challenging task as pixel misclassification can lead to confusion between classes for classification models. The investment required for skilled personnel and the time-consuming process of interpreting and annotating elements can be considerable and unfeasible for deep learning applications with satellite images. Consequently, fully automated and expert-free deep learning approaches are not currently viable for most remote sensing applications (Zhu et al., 2017; Irvin et al., 2020). Lastly, limited availability of labeled data can hinder the performance and generalization ability of deep learning models. Models trained on specific datasets or study areas may not generalize well to new and unseen data from different locations.
Therefore, in this study, our objective is to identify the optimal method based on two criteria: transferability across different years and generalizability to new regions, in order to reduce the reliance on manual photo-interpretation. We will compare two context-sensitive machine learning approaches for detecting and mapping degraded forests in Guinea, to replicate the way a photo-interpretation operator considers the pixel neighborhood while mapping degraded forests. Building upon the dataset developed in Vo Quang et al. (2022), we will evaluate the performance of the contextual Random Forest (RF) algorithm, which considers the pixel neighborhood, and the convolutional neural network (CNN) approach known for capturing intricate patterns in image data. The classification maps generated by the selected model will undergo external validation and integration into the ZAEG project.
Specifically, we aim to adapt the U-Net model (Ronneberger et al., 2015) to analyze Sentinel-2 images in the study areas and compare the results with two other models: SegNet (Badrinarayanan et al., 2017) and ResNet-UNet, a variant of the CNN models ResNet (He et al., 2015) and U-Net, developed by the computer vision research community as a fusion and adaptation of the two architectures. Our evaluation will address research questions related to dataset size, overall agreement with photo-interpreted maps, data normalization, generalization capabilities, and performance in different settings. Through this comparison, and together with an independent validation, we seek valuable insights into the effectiveness and performance of each model, shedding light on the factors influencing its performance.
Our objective is to evaluate the ability of CNN algorithms to provide a three-class map (intact forest, degraded forest and other) in the context of the study area in Guinea that consists of three massifs. We also compare the results to those obtained with the random forest based algorithm previously developed (Vo Quang et al., 2022). In summary, the contextual RF and the CNN are trained using the photo-interpreted maps, on years 2015–2020, and on two sites. Their results are validated against additional maps obtained in 2021, and/or on a third site. Finally, the maps are further validated on sites interpreted by independent photo-interpreters.
Firstly, by photo-interpretation, we create a training dataset based on Sentinel-2 data on two of the forest massifs (Ziama, Diécké) and on years 2015–2020. We use this dataset to train four algorithms: one relying on the contextual RF algorithm previously described (Vo Quang et al., 2022), and the other three relying on three convolutional neural networks.
Secondly, the evaluation of the algorithms is made in two steps. In the first evaluation step, the maps from the contextual RF and from the CNN algorithms are compared to the photo-interpretation maps that were not used for the training, i.e., additional maps created in 2021 in the Ziama and Diécké massifs and in the third massif (Nimba), inferring the “Agreement” between the automated detection method (RF and CNN) with the photo-interpretation map. In the second evaluation step, we assess the result with an independently derived photo-interpreted validation dataset consisting in 900 sites, and from this comparison we infer the “Accuracy”. Figure 2 illustrates the global flowchart of our methodology, providing an overview of the steps involved in the validation process.
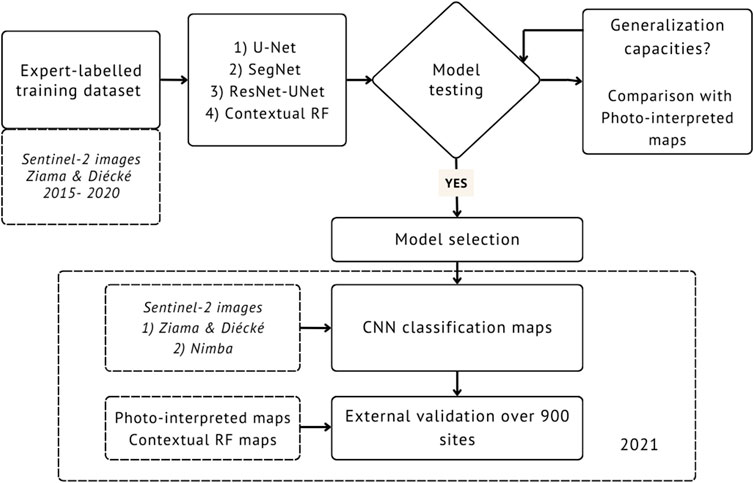
Figure 2. Overall flowchart.
The first study site is the UNESCO World Heritage forests of Ziama (Figure 3), located in the Republic of Guinea, West Africa, and classified as a Biosphere Reserve in 1981. The study area encompasses Guinean montane forests, characterized by tropical broadleaf rainforests situated at elevations above 600 m. These forests receive an annual rainfall ranging from 1,600 to 2,400 mm, with distinct dry and monsoon seasons. Managed by the Nzérékoré Forest Centre for 15 years, the focus has been on preserving the central areas where human activities are strictly prohibited. The total area of Ziama Forest spans 116,700 ha, with 42,547 ha (36.5%) designated as protected central mountainous areas. The climate exhibits a humid tropical pattern, including a short dry season (December to February) and an average annual temperature of 24°C. The study area features dense humid forest vegetation, characterized by evergreen to semi-deciduous foliage.
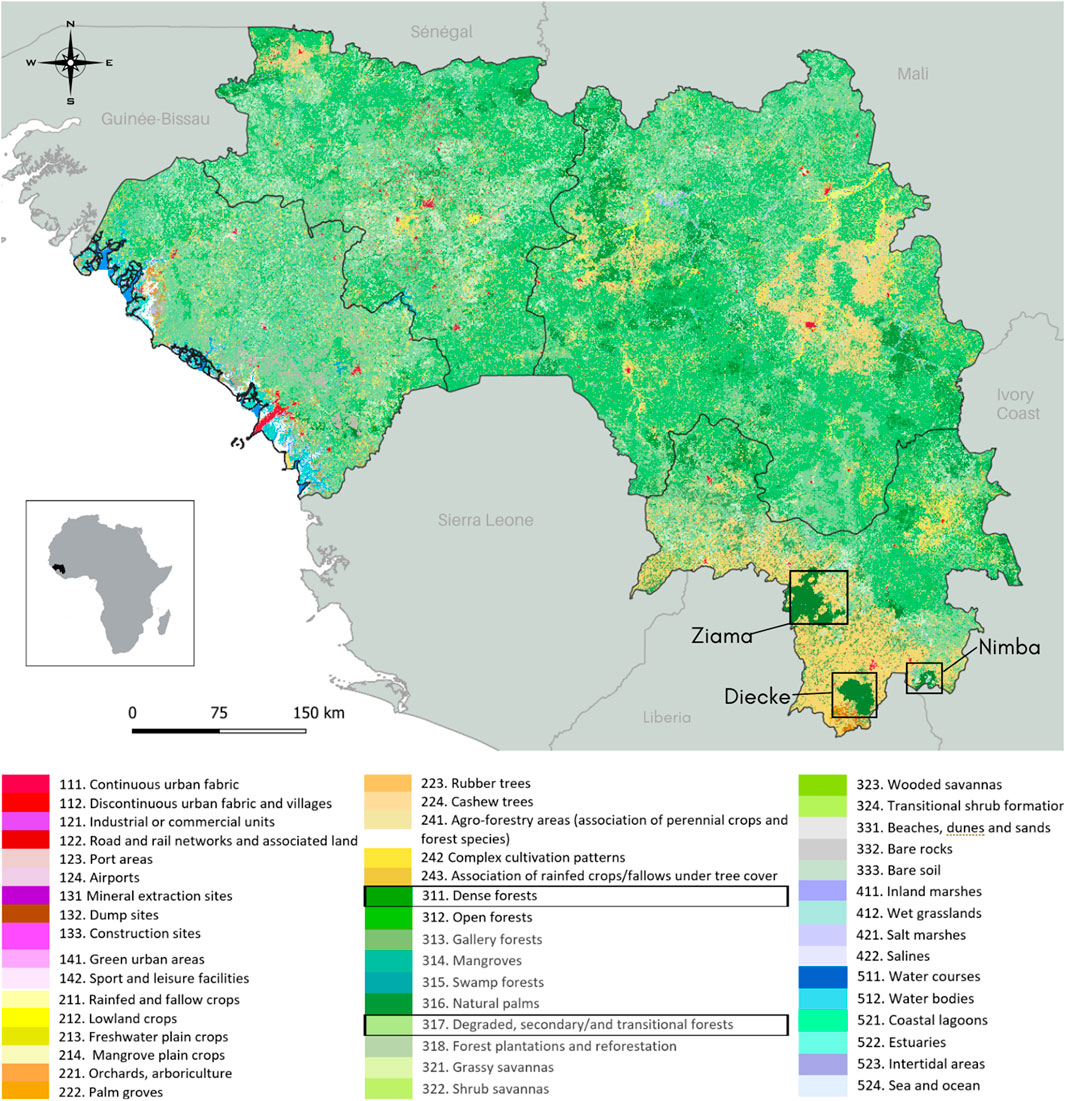
Figure 3. 2015 Land use and land cover map (LULC) of Guinea with the study site locations in Ziama, Diécké, and the Nimba massif. The LULC 2015 map was created as part of the Agro-ecological Zoning of Guinea (ZAEG) project using photo-interpretation and includes 47 classes based on the European Corine Land Cover classification system.
To assess the effectiveness and applicability of our models, we include two additional study sites: Diécké Forest Reserve, and Mount Nimba (Figure 3), a prominent geographical feature situated in the southern region of Guinea, near the borders with Côte d'Ivoire and Liberia. Mount Nimba holds significant scientific and conservation value, being designated as a UNESCO World Heritage Site and recognized as a conservation hotspot. Incorporating Mount Nimba into our study allows for an evaluation of the robustness of our models in a diverse and ecologically significant area, contributing to the scientific understanding of degraded forests in Guinea.
Fourteen Sentinel-2 images acquired between late 2015 and 2020, including 10 of the Ziama massif and 4 of Diécké, were subjected to photo-interpretation (Table 1). The photo-interpretation process involved labeling 2.7 million hectares classifying pixels into three categories: (1) dense forest, (2) degraded forest, or (3) non-forest, which encompassed various land cover types such as crops, villages, bare soils, rivers, shrub and herbaceous areas, palm plantations, and tree plantations. In addition, for the classification testing and model evaluation phase, three cloud-free Sentinel-2 images from 2021 were selected, one for each of the three forest massifs in Guinea: Ziama, Diécké, and Mount Nimba. Notably, no Sentinel-2 image from Mount Nimba was included in the model training to evaluate its generalization capability. The acquisition dates of the images are provided in Table 1. Hence, the classification models were evaluated using independent data from the calibration phase, ensuring temporal and spatial independence.
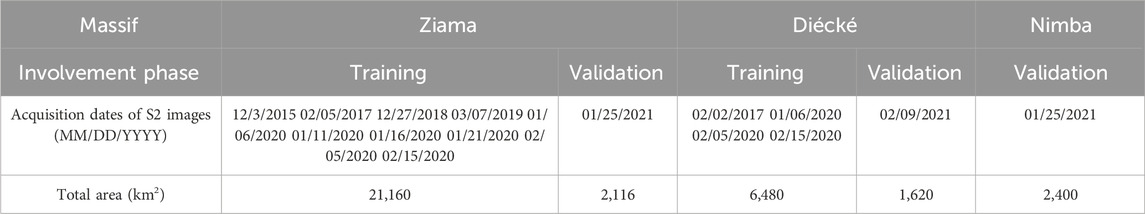
Table 1. Sentinel-2 data photo-interpreted and used for CNN model training or evaluation.
Photo-interpretation (PI), conducted by the authors, is used to provide maps serving as a training dataset and as a first validation dataset. To delineate the boundaries of dense and degraded forests, manual delineation was performed using QGIS software, resulting in a pixel mask with a resolution of 10 m by 10 m, consistent with the resolution of Sentinel-2 imagery. The identification of degraded forests followed the method described in Vo Quang et al. (2022), which was supported field observations. The PI method uses Sentinel-2 imagery with color compositions from the near-infrared, mid-infrared, and red bands. The separability of the “degraded forest” and “dense forest” classes is highest during the dry season but decreases in the wet season (Vo Quang et al., 2022). Interpretation is based on texture (more pronounced in dense forests), color (degraded forests have “greenish” orange and red tones), and context (human activity around forest patches). If the differences in texture between intact forests and degraded forests are not significant, the interpretation relies more heavily on other factors such as color and context, and the use of high-resolution imagery can also help to differentiate these areas more clearly. To complement these criteria and to achieve accurate photo-interpretation of the Sentinel-2 images, we also utilized imagery with a pixel resolution of less than 1 m for detailed analyses from Google Earth Pro and Bing Aerial imagery. Additionally, temporal tiles from the same scenes were photo-interpreted to provide the CNN model with representations of degraded and dense forests under different radiometric and atmospheric conditions, enhancing its generalization capability so that the model can be applied on a variety of images.
The multi-year photo-interpretation strategy ensured that the training dataset (2015–2020) captured dynamic land cover changes. Integrating data from multiple years minimized the impact of land cover changes on classification accuracy, enhancing the model’s robustness and generalizability.
Classifications (contextual RF and CNN) were performed on a dataset derived from the Sentinel-2 spectral bands. For each Sentinel-2 (S2) image, 10 spectral bands (bands 2–8A, 11, and 12) were resampled to a 10-meter resolution using the Sentinel-2 Toolbox software developed by ESA. Two water stress indices, namely, the Moisture Stress Index (MSI) and the Canopy Water Content (CWC), were used, together with the Leaf Area Index (LAI). LAI and CWC were extracted from S2 images (Weiss and Baret, 2016). CWC, LAI, and MSI were calculated for all 14 images used in the study. The georeferencing of the data was performed using the WGS84 geodetic system with UTM zone 29 projection.
Finally, the data were normalized to ensure consistency and improve the models’ performance during the training process, as data normalization is a crucial step in training neural networks. It involves scaling the input data to a standard range or distribution, preventing certain features from dominating the learning process due to their larger magnitudes. Since we selected cloud-free Sentinel-2 images, cropping high pixel values caused by clouds was unnecessary. In our case, normalization was achieved by dividing each pixel value in the Sentinel-2 images by the maximum pixel value in that specific image, ensuring uniformity across the dataset.
Additionally, the dataset was divided into 128 × 128 pixel image patches, resulting in a total of 64,180 patches. These were randomly allocated into a training dataset (70%) and a test dataset (30%) for model training purposes. Note that the validation relies on the comparison of the model outputs with PI maps for year 2021 unused for the training, and on external validation points (see below).
The contextual RF algorithm (Vo Quang et al., 2022) extends the classical RF by incorporating neighboring pixel values within a 13*13 pixel window to contextualize each pixel’s classification. With Sentinel-2 (S2) bands and additional variables, and within the 13*13 pixel window, the process yielded over 2,000 features per pixel in the RF model.
Training data were randomly sampled as patches from the image, while the remaining pixels were allocated for validation and inference. Our methodology, building on previous research (Vo Quang et al., 2022), explored varying patch sizes to assess their impact on model accuracy. Total patch sizes ranged from 1.6% to 25.8% of the total image surface, providing insights into the relationship between training data volume and model efficiency. The selection of patches in our study, constituting 1.6% of the total image surface, represents the minimal photo-interpretation effort required for image analysis, ensuring satisfactory overall accuracy (89.6%, Vo Quang et al., 2022). Moreover a 10-pixel buffer was applied around each patch to mitigate spatial autocorrelation, to ensure robust validation by maintaining spatial independence between training and validation pixels.
CNNs, are powerful deep learning models designed for analyzing images, making them relevant in the field of remote sensing. Unlike traditional machine learning algorithms, CNNs automatically learn hierarchical representations of data through multiple interconnected layers, allowing them to capture spatial dependencies and extract relevant features from images for effective analysis and interpretation.
The core components of a CNN include convolutional layers, which detect spatial patterns at various scales, and pooling layers, which reduce the spatial dimensions of feature maps to improve computational efficiency and translation invariance. These features are then integrated by fully connected layers or specialized output layers to produce predictions, such as pixel-wise classifications in semantic segmentation tasks. In remote sensing, semantic segmentation is crucial, labeling each pixel with its corresponding class for a more detailed understanding.
In our study, we selected the U-Net model for semantic segmentation (Ronneberger et al., 2015) due to its effectiveness and popularity in biomedical imaging. Its unique U-shaped architecture and skip connections enable it to capture both local and global contextual information while preserving spatial details, making it well-suited for accurately segmenting complex structures in remote sensing imagery.
The U-Net model consists of 5 encoding steps, including a bottleneck layer, and 4 decoding steps. Each encoding step includes two convolutional layers with ReLU activation, followed by 2 × 2 max pooling for downsampling. The number of filters doubles at each level, ranging from 32 to 512. To prevent overfitting, a dropout layer (rate = 0.5) is applied after the last encoding block and at two levels of the decoder. The decoder uses transpose convolutions for upsampling, concatenating features from the encoder through skip connections, and applying convolutional layers with ReLU activation to refine the outputs. Unlike the original U-Net, which typically uses a softmax activation for mutually exclusive classes, our version employs a sigmoid activation in the output layer to handle multilabel segmentation.
This dropout rate determines the likelihood of randomly excluding a neuron during training. Dropout reduces interdependencies among neurons, preventing the model from overfitting to the training data — a common challenge in deep learning. Overfitting occurs when a model becomes too specialized to the training data and fails to generalize effectively to new data, undermining its intended purpose.
In addition to the U-Net model, two other segmentation models, namely, SegNet and ResNet-UNet, were evaluated in this study. SegNet (Badrinarayanan et al., 2017) utilizes an encoder-decoder structure with skip connections to achieve accurate segmentation. Similar to U-Net, SegNet captures both local and global contextual information through its encoding and decoding paths. However, instead of directly passing the indices of maximum activation from the encoder to the decoder, SegNet saves pooling indices during the max pooling operation. These indices are then used in the decoding path to upsample the feature maps and reconstruct the segmented image. This approach helps to recover finer details and improve segmentation accuracy.
ResNet-UNet (He et al., 2015) is a combination of two common architectures: ResNet and U-Net. ResNet is known for its residual blocks, which enable the training of very deep neural networks. In ResNet-UNet, the encoder path of U-Net is replaced with the ResNet architecture. This integration brings together the benefits of both architectures: the ability of ResNet to handle deeper networks and the spatial context capturing capability of U-Net.
In satellite imagery semantic segmentation, where datasets are extensive and spatially complex, optimization methods like RMSprop and Adam are commonly used. These adaptive algorithms manage learning rates effectively and facilitate rapid convergence, essential for training on large datasets. However, empirical investigations comparing various optimization techniques may help identify the best choice for a specific dataset and network architecture.
For all three architectures, model training utilized the Adam optimization algorithm (Kingma and Ba, 2014), which adjusts the learning rate for each parameter based on the gradients and their historical values, allowing for more efficient updates. The Dice loss function, introduced by Milletari et al. (2016), measuring overlap between predicted and ground truth segmentations, was employed as the primary loss function to ensure model predictions align closely with actual segmentations. Training was conducted over 100 epochs maximum, with performance monitored to select the best model based on the highest validation accuracy, but the training can stop earlier:early stopping is employed with a patience of 5 epochs, meaning that the training halts if the performance does not improve after 5 consecutive epochs. This approach prevents overfitting and ensures that the model’s performance generalizes well to unseen data.
The three CNNs were implemented using the Python environment provided by Google Colab Pro, utilizing Python 3.7, TensorFlow 2.4, and Keras 2.4.3 for the deep learning analysis. GPU acceleration was leveraged to optimize computation performance, and the analysis was conducted on a Google Colab Pro instance with 25 GB of RAM and a high-performance NVIDIA Tesla T4 GPU.
The three CNNs were compared to identify the most suitable approach for segmenting degraded forests in S2 imagery. Various training dataset size were also tested. The performances are measured as the agreement with the photo-interpretated maps over different acquisition years and over new forest areas unseen in the training phase.
The degraded forest maps generated for the year 2021 by photo-interpretation, by the contextual RF, and by the three CNN were further validated across the three massifs. This procedure follows the widely used Verified Carbon Standard (VCS) methodologies, which provide a framework for independent validation and verification of greenhouse gas emissions reduction projects. VCS projects undergo rigorous evaluation and must meet minimum accuracy requirements, including a minimum overall accuracy of 85% and a minimum accuracy of 80% for each class (Verified Carbon Standard, 2019). The validation protocol adhered to a stratified random sampling design, stratified based on the three defined classes (Stehman, 2009). A total of 900 validation sites (300 for each forest massif) were distributed evenly among the regions, with each site representing a 1-hectare square.
The validation is based on photo-interpretation by independent experts at each of the 900 sites, based on the Sentinel-2 data, the high-resolution online images (such as Google Earth Pro and Bing Aerial) and the high spatial resolution SPOT 6/7 satellite imagery.
The validation process consisted of two phases: “blind” photo-interpretation and “plausibility” analysis, hereafter called “plausibility” validation, conducted by two teams of independent experts. During the “blind” interpretation phase, class codes were assigned to pixels without considering the model’s map to be validated. In cases where the results of blind interpretation disagreed with the model’s map, “plausibility” validation was performed by a second team of independent Guinean photo-interpreters for all sampling units (Szantoi et al., 2020; Olofsson et al., 2012). Plausibility validation serves several key purposes in our study. Firstly, it provides an independent assessment of the model’s performance, especially in complex scenarios where the algorithm’s predictions diverge from initial blind interpretations. Such instances are crucial for understanding the model’s limitations and for identifying specific conditions under which the model might either excel or require further improvement. It is also necessary as the photo-interpretation of the degraded forests is not exempt of errors. This method allows for the incorporation of expert knowledge in the validation process. Combining blind and plausibility analysis is the up-to-date validation strategy and is used for the validation of several Copernicus products (D’Amico and Corsini, 2015; Szantoi et al., 2021). However, because the plausibility validation is not adopted by the whole remote sensing community, we will report the results of both blind and plausibility validation.
An assessment of the impact of the training dataset size on the U-Net model performance is conducted in Section 3.1. Subsequently, the performances of the three CNN models are evaluated by comparison in Section 3.2 for the year 2021, using our photo-interpretation maps. Additionally, the results of PI, contextual RF, and the maps from the best CNN are compared to external validation points in Sections 3.3 and 3.4.
Hereafter, the word “agreement” will refer to the similarity of the model output with our photo-interpreted maps unused for the model training. “Accuracy” will be restricted to the external validation.
First, we explore the impact of training dataset size on classification performance without data normalization. By varying the training dataset size, we assess model agreement, focusing on the U-Net model’s performance on the 2021 test dataset, which was not included in the training (Table 2). The training duration (in epochs) is highly variable among tests, but is always lower than the maximum number of epochs (100) in all cases except test e. Agreement between model output and the photo-interpreted map increases with more training images, exceeding 89% for the Ziama and Diécké regions. However, test (g), which used all available training images, shows a slight decrease in agreement.
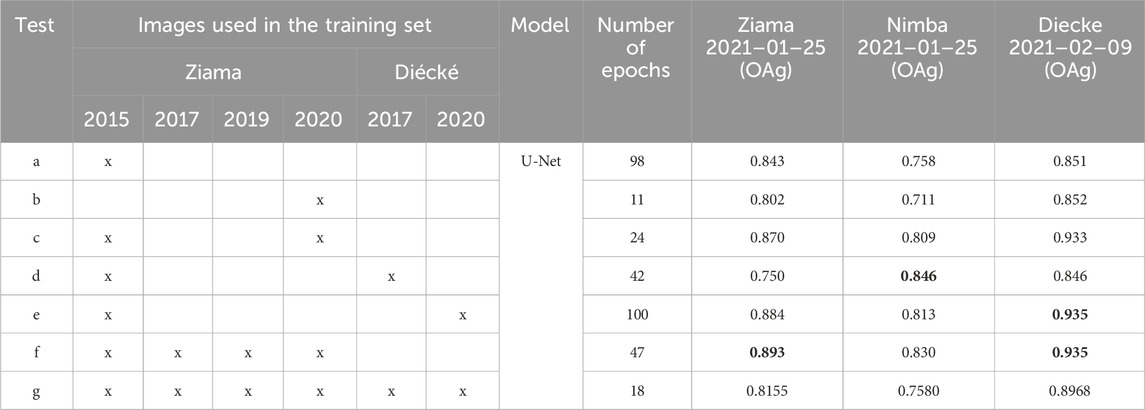
Table 2. Overall agreement (OAg)of the U-Net network applied to the 3 massifs in 2021, in 3 classes, with the photo-interpretation maps. The number of epochs at which the model is stopped is also indicated. Highest OAg is shown in bold.
Model performance becomes unstable with small training datasets: models trained on only 2 images show overall agreement (OAg) from 75.0% to 88.4% for Ziama (tests c, d, e), sometimes lower than those trained on a single image (tests a, b). Additionally, including the 2017 Diécké image in the training lowers agreement for classifying Diécké 2021 (test d, 84.6%) compared to tests using only Ziama images (tests a, b, c; 85.1%–93.3%).
An interesting outcome is observed with test ‘f,’ which excludes Diécké images from the training dataset but achieves the highest overall agreement for Diécké 2021 validation data (93.5%). Additionally, including one 2017 Diécké image in the training lowers agreement for classifying Diécké 2021 (test d, 84.6%). This result highlights the robustness of the model trained exclusively on Ziama images, suggesting that the diversity within the Ziama training data may compensate for the absence of Diécké-specific representations. However when the four 2020 Diécké images are used for training, overall agreement reaches 93.5% for Diécké 2021 (test e), as in test f.
This shows the importance of training the CNN models over multiple images over each year in order to provide some representation of the same surface at different phenological stages. Figure 4 shows the Sentinel-2 color composite, with near infrared displayed in red, with black circles around some rubber plantations in Diécké. These specific rubber trees being deciduous (personal communication with a guinean forester) they can be distinguished by using Sentinel-2 time series, for example, by identifying its NDVI seasonal signature (e.g., Li et al., 2022). However this means that it would be difficult to identify them using a single image. In our case including one image in January and another one in February 2020 which totally differ from each other in terms of near-infrared reflectance over the rubber plantation because they show the plantation before and after the foliation, has permitted to catch this specific surface signature and to detect the rubber plantation in 2021.
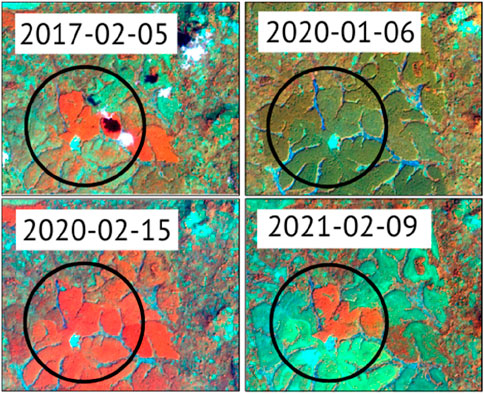
Figure 4. Rubber tree plantations (deciduous species) in the Diécké area between 2017 and 2021 (black circles) on Sentinel-2 color composites from the near-infrared, mid-infrared, and red bands.
In 2021, Mount Nimba classifications show lower overall agreement than Ziama and Diécké, mainly due to the lack of specific training for the area. In test g, 10 Ziama and 4 Diécké images were used for model training. Test g results show agreements of 0.8155 for Ziama, 0.7580 for Nimba, and 0.8968 for Diécké (Table 2). These outcomes, slightly lower than those with a selective image subset, reflect the greater variability and complexity of the larger dataset. Using all available images without normalization increased spectral and land cover variations, complicating the model’s ability to generalize. This highlights the need for a balance between dataset size and training strategy, as more data without adequate preprocessing may not always improve classification due to increased complexity. Lastly, in an effort to optimize the dataset, various combinations of input bands were tested during the training process. Specifically, when the LAI, MSI and CWC were not used, the agreement reached 66.48% only, indicating the significant contribution of these additional parameters to the overall performance of the model.
The second section of our results focuses on: i) a performance comparison of the U-Net, SegNet, and ResNet-UNet models against the PI maps; ii) the impact of data normalization on classification performance; iii) the models’ adaptability to temporal variations in forest conditions; and iv) their generalization capability to new forest areas, particularly in the Nimba region.
The three CNN models were trained using 14 images from the Ziama and Diécké massifs, incorporating 10 spectral bands, as well as LAI, CWC, and MSI. All tests were conducted on Sentinel-2 images acquired in 2021 (2021/01/25 for Ziama and Diécké; 2021/02/09 for Nimba). Classification results were compared to the 2021 photo-interpreted maps, which were not included in the training.
Table 3 summarizes the results, showing overall agreement for the three classes and each model, both with and without data normalization. Without normalization, none of the models achieved an overall agreement above 85% across all three massifs. However, with normalization, all CNN models surpassed the 85% threshold, with U-Net and ResNet-Unet achieving agreements above 90%. This indicates that normalization, which adjusts values measured at different scales, aids in simplifying deep learning models by ensuring all input features have a similar range and distribution.
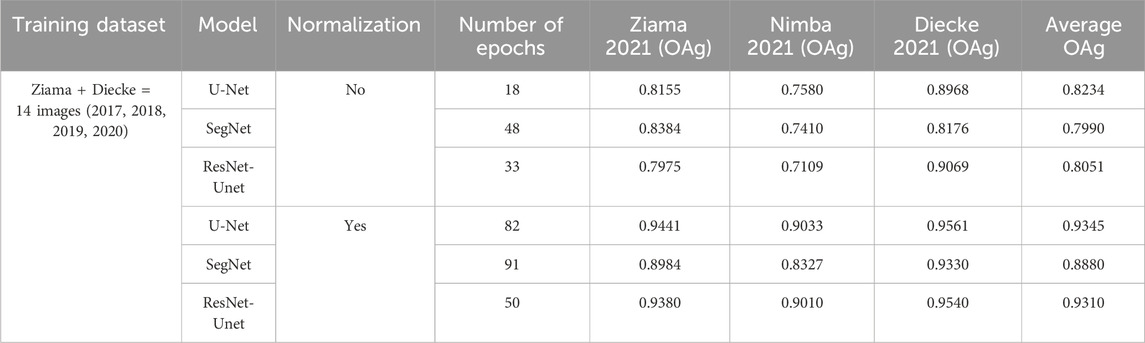
Table 3. Overall agreement (OAg) of the 3 CNN models with the photo-interpreted maps on the 3 regions in 2021, with and without data normalization.
The classification maps generated by the U-Net model for the Diécké and Nimba massifs are presented in Figure 5, depicting both the normalized and the non-normalized data scenarios. These maps illustrate the improved effectiveness of CNN models when satellite image normalization techniques are applied.
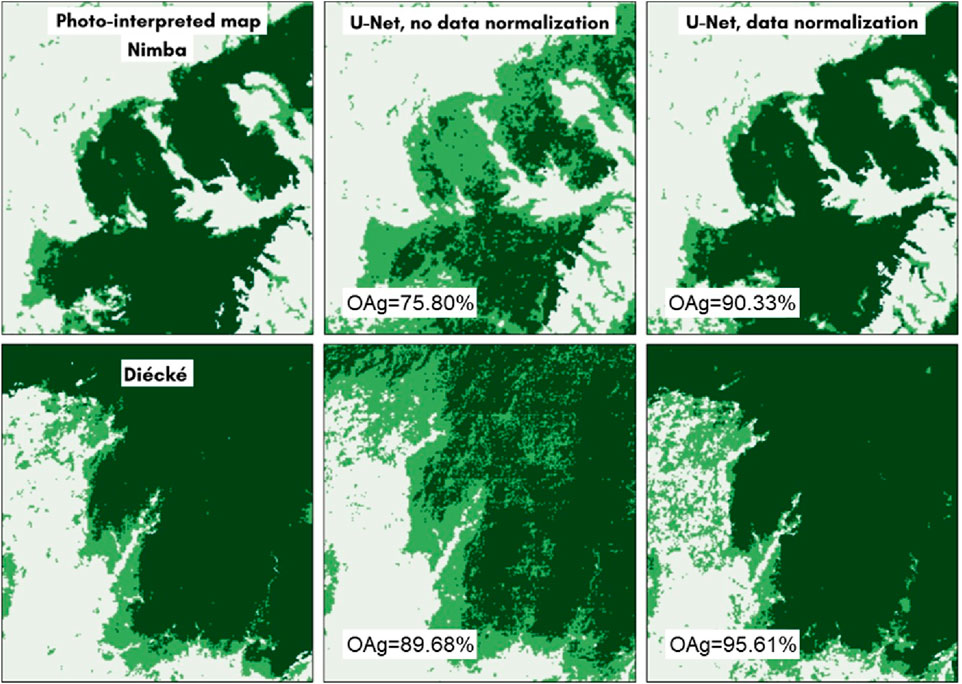
Figure 5. U-Net Classification Maps. Comparison of the 2021 classification maps and the photo-interpreted maps for Mount Nimba (top) and the Diécké massif (bottom) with and without data normalization. Overall agreement (OAg) is calculated as the ratio of correctly classified pixels to the total number of pixels in the photo-interpretation validation dataset.
Based on the evaluation results, the U-Net model emerges as the top-performing model, surpassing both SegNet and ResNet-Unet in terms of overall agreement with the photo-interpreted map. Furthermore, U-Net consistently achieves the highest overall agreement across all three massifs. It accurately classifies 94.41% of pixels in Ziama, 95.61% in Diécké, and achieves a commendable 90.33% agreement for Mount Nimba, despite not being specifically trained on that area.
Table 4 provides comprehensive statistics for the U-Net model, covering all three massifs. Notably, the classification performance of the “degraded forest” class is relatively good for all three massifs, although it remains the most challenging class to classify accurately. On Mount Nimba, the U-Net model shows some confusion between the “degraded forest” and “dense forest” classes, resulting in slightly lower producer and user accuracies for the “dense forest” class (88.4% and 93.6%, respectively) compared to the other two massifs (both exceeding 95%).
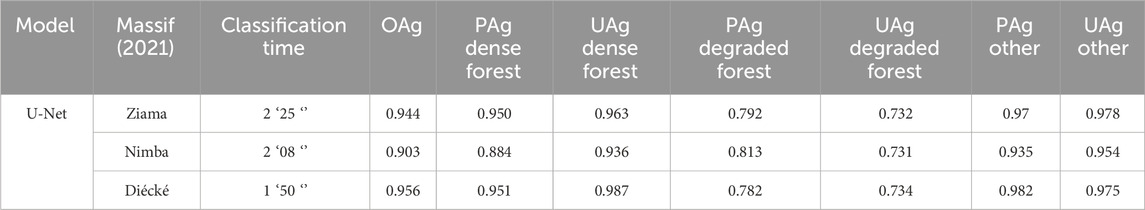
Table 4. Statistics and Processing Time for the U-Net Model trained in Ziama and Diécké in years 2017–2020 and applied to the three massifs in 2021, with normalized data. PAg = Producer’s Agreement; UAg = User’s Agreement; OAg = Overall Agreement.
Of significant importance, the U-Net model demonstrates notable improvements in the agreement of the “degraded forest” class, achieving producer and user agreements ranging from 73% to 81.3% across all three massifs. The contextual RF approach (Vo Quang et al. (2022) required photo-interpretation of 1.6% of the latest year’s imagery to achieve an overall agreement of 0.897. Notably, our prior approach, faced limitations in detecting the “degraded forest” class with a producer agreement of 0.581 and a user agreement of 0.658, partly due to the necessity of initial photo-interpretation and constraints related to RAM capacity affecting the volume of input data. The current methodology builds upon this foundation by eliminating the need for preliminary photo-interpretation and optimizing data handling to incorporate a more extensive training dataset. It accurately segments degraded forests in unseen areas, showcasing its robustness beyond the training dataset, and reproduces the results from a photo-interpretation method.
The agreement discussed in the previous sections was determined by comparing the classification results to subsets of our photo-interpreted maps, which were not included in the training. The classification maps generated by the U-Net model, trained on all images from Ziama and Diécké (2015–2020) with normalized data, underwent independent validation by external Guinean photo-interpreters to mitigate potential operator bias.
Table 5 presents the accuracies derived from the blind and plausibility validation results for the three massifs: Ziama (91.3%), Diécké (86.0%), and Nimba (89.0%), with a combined accuracy of 88.8%. Normalized error matrices by class surface area are shown in Tables 5, 6, yielding normalized overall accuracies of 96.9%, 93.9%, and 91.5% for Ziama, Diécké, and Nimba, respectively. The combined normalized accuracy for all massifs was 94.1%. The “degraded forest” class showed user and producer accuracies of 72.3% and 83.9%.
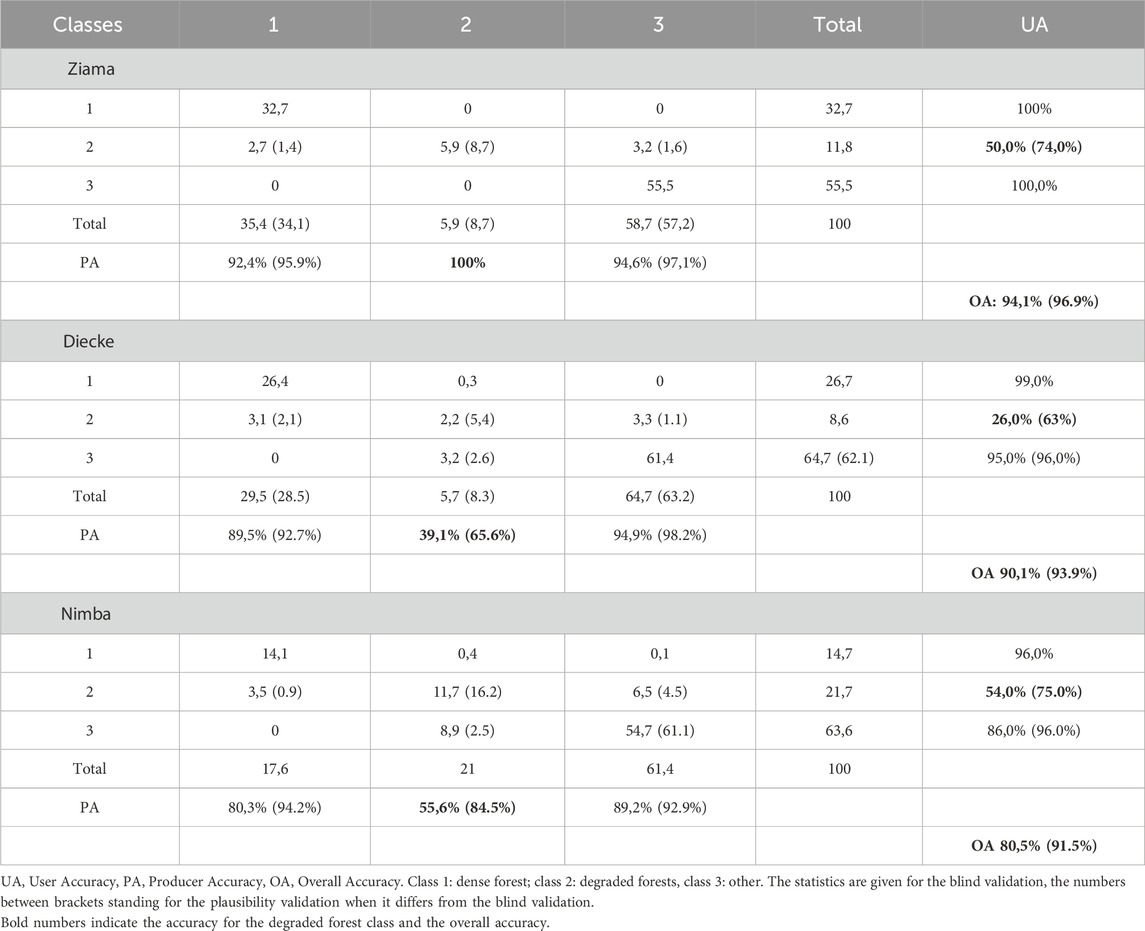
Table 5. Normalized error matrices for each massif using the U-Net algorithm.
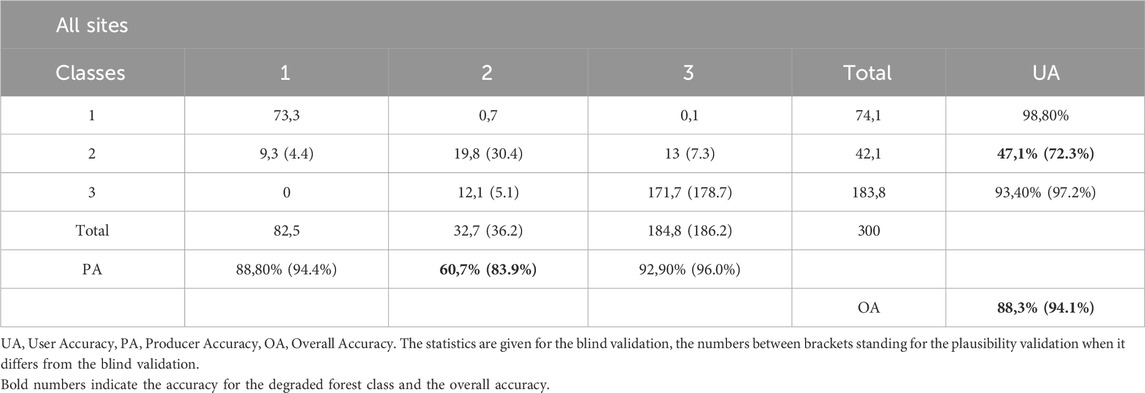
Table 6. Overall normalized error matrix using the U-Net algorithm.
The CNN method identified a larger area of degraded forests than the validation process. This discrepancy may arise from the CNN’s incorporation of additional biophysical parameters, such as leaf area, canopy water content, and water stress, which are not considered in visual interpretation. Thus, the CNN model may produce maps depicting more extensive forest degradation than what is detected through validation.
We performed a comparative analysis between the contextual RF algorithm, the photo-interpreted (PI) method, and the U-Net model. All these methods were validated by the external Guinean photo-interpreters. Table 7 and Figure 6 summarize the results in the Ziama massif. For all cartographic products, the class area weights and overall accuracies from external validation were calculated. The overall accuracy is better with the U-Net model than with PI and the contextual RF algorithm, the main difference being that the producer accuracy for the degraded forest class is much higher with the U-Net (100%) than with the other two maps with both the blind and the plausibility validation.
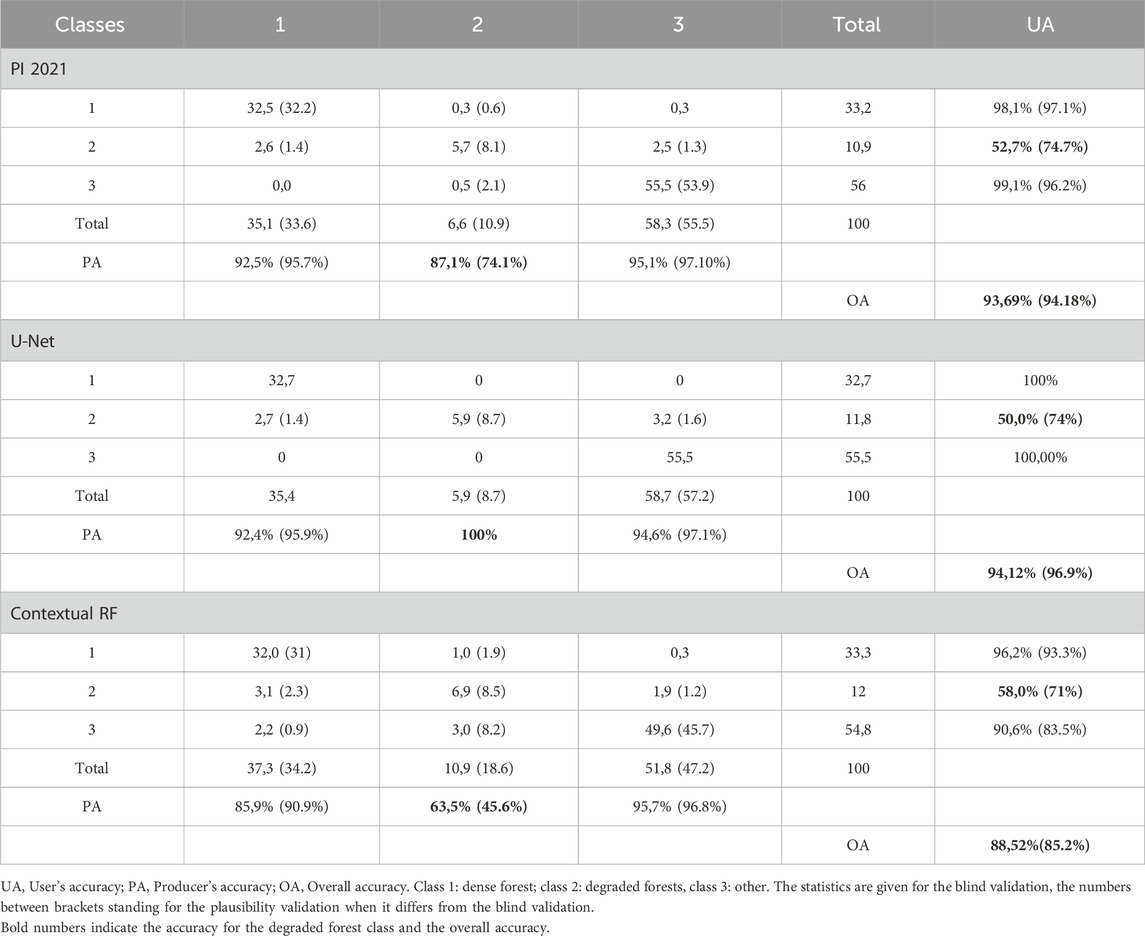
Table 7. Normalized error matrices for the photo-interpreted map of Ziama 2021, the U-Net model, and the contextual Random Forest model.
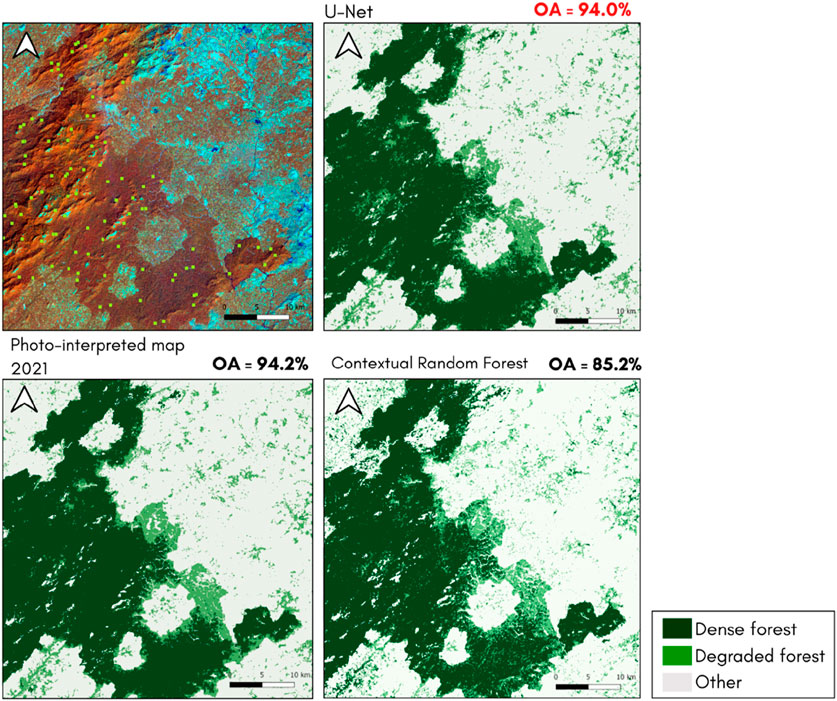
Figure 6. Comparison of the photo-interpreted map of Ziama 2021 (bottom left), the maps generated by the contextual Random Forest Vo Quang et al. (2022) applied to 2021 (bottom right), and the map produced by the CNN model U-Net (top right). The “plausibility” overall accuracies (OA) obtained by external and independent validation are provided. On the left, the Sentinel-2 2021 image in infrared color composition (top left), showing the points used for the external validation.
In addition, a comparative analysis is conducted on the Nimba massif in 2021 to evaluate each model’s ability over a new scene. The evaluation includes: i) The Nimba 2021 map, generated using the photo-interpretation method; ii) The classification results of the contextual RF method, applied to the Sentinel-2 2021 image with training limited to Ziama; iii) The classification results of the contextual RF method, trained on both Ziama and a 1.6% area of Nimba. iv) the results obtained from the U-Net approach.
Most importantly, the analysis reveals significant improvements in performance when incorporating a small proportion of Nimba in the training data for the contextual RF methodology, which is therefore not directly transferable to a new scene (Table 8). On the contrary, the OA obtained by U-Net without specific training on this new site is above 91%. Among all models, U-Net exhibits the best performance, achieving the highest overall accuracy and the best user and producer accuracies for the ‘degraded forest’ class on Nimba as previously for Ziama. These results demonstrate the robustness and efficiency of U-Net in accurately identifying degraded forests across different areas without specific training on the Nimba massif (Figure 7).

Table 8. Normalized error matrices for the photo-interpreted map of Nimba 2021, the U-Net model, and the contextual Random Forest model, with and without Nimba in the training.
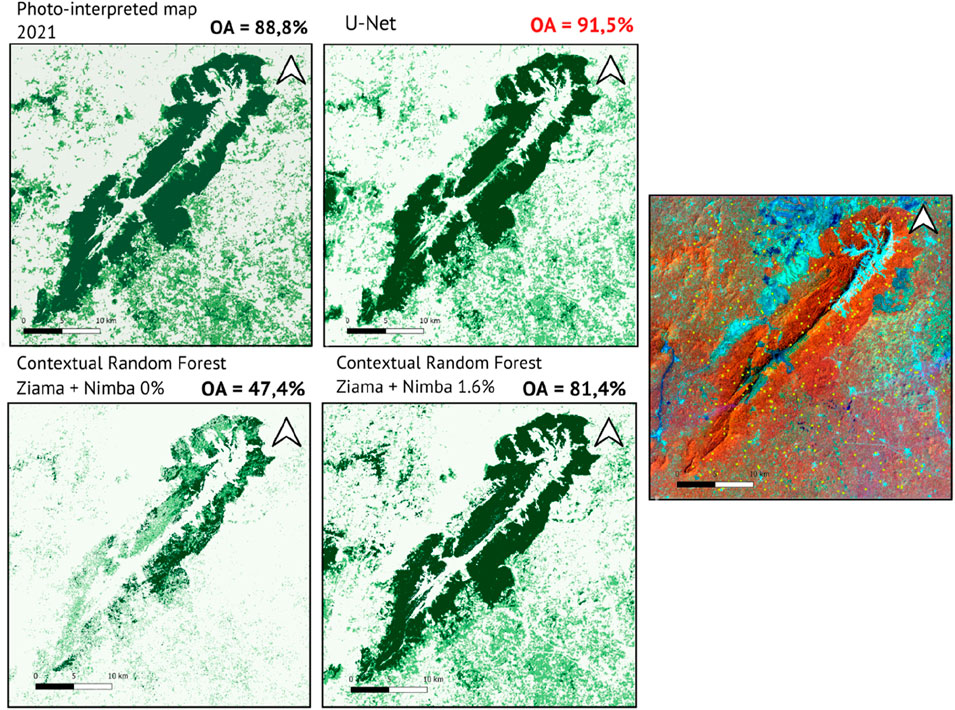
Figure 7. Comparison of the photo-interpreted map of Nimba 2021 (top left), the maps generated by the contextual RF applied to the Sentinel-2 2021 image (bottom), and the map produced by the U-Net model (top right). The “plausibility” overall accuracies (OA) from the external validation are reported. On the right, the Sentinel-2 2021 image in infrared color composition, showing the points used for the external validation.
Based on the superior performance and robustness, the U-Net model is selected for the forest class update in the ZAEG project, replacing the previous photo-interpretation-based method. This decision aligns with the goal of developing a reliable, robust, and reproducible methodology for degraded forest detection, providing valuable insights for stakeholders, and contributing to a better understanding of the current state of tropical forests.
In 2015, the ZAEG project produced land use and land cover (LULC) mapping, with an update in 2020 covering forty-two classes for Guinea. However, mapping the evolution of degraded forests was challenging due to the labor-intensive manual delineation of degraded areas and reliance on single-date satellite imagery. Balancing production schedules and ensuring quality is crucial for project success, as highlighted by the Intergovernmental Panel on Climate Change (IPCC). We followed Verified Carbon Standard (VCS) methodologies, which require a minimum average correct classification rate of 85%, with lower rates precluding further analysis.
The contextual Random Forest classification method showed promise by considering neighboring pixel attributes (Vo Quang et al., 2022). With only 1.6% of a new image in the Ziama forest region photo-interpreted, the model inferred satisfactorily across the remaining image. Similar improvements were observed in the Nimba mountain site. However, limitations arose due to the computer’s memory capacity, which became saturated with large training datasets, as each pixel classification used over 2000 features. The need for new photo interpretation at each site also restricted its generalization capacity.
On the other hand, the CNN approach exhibited robustness and operational efficiency. A key challenge was the limited availability of labeled data for training CNN models. To overcome this, we photo-interpreted 14 images (2015–2020), covering 2.7 million hectares in Ziama and Diécké, expanding the training data and incorporating temporal variability to enhance model generalization. This approach mitigated data scarcity, enriched the dataset with diverse spectral signatures and land cover states, and significantly improved CNN accuracy for classifying degraded forests. Comparing three CNN models offered valuable insights for researchers and stakeholders in tropical forest monitoring, helping them select the most suitable model for their needs.
Despite the CNN approach requiring a substantial amount of training data and longer training time, it achieved commendable precision scores when inferring on new data. Trained on various forest regions and at different time periods, the U-Net model minimized the need for extensive photo-interpretation when inferring on images on the Nimba forest site, where no further training samples were required. By ensuring adequate training of the model in advance, it can be readily deployed to end-users with confidence.
In the context of forest degradation mapping, DL-DEGRAD (Dalagnol et al., 2023) demonstrated the effectiveness of CNNs, specifically using the U-Net model, to detect degradation caused by logging, fire, and road construction. They applied this approach to very high-resolution (4.77 m) Planet NICFI imagery, utilizing multi-temporal and multi-regional datasets. The model achieved significant precision in mapping degradation across the Brazilian Amazon, with F1-scores of 68.9 for logging and 75.6 for fire. This study emphasizes the importance of incorporating diverse training datasets to improve model robustness, particularly in regions affected by complex disturbances such as logging and fire.
Similarly, our study also leveraged the U-Net model with multi-temporal and multi-regional training data, focusing on forest degradation across different regions in Guinea, including the Nimba massif. However, unlike DL-DEGRAD, which utilized very high-resolution imagery, our study relied on Sentinel-2 data at a 10 m resolution. Despite the lower resolution compared to Planet NICFI imagery, our findings align with DL-DEGRAD in recognizing the value of diverse training datasets for improving generalization, particularly in cross-site inference. While DL-DEGRAD applied high-resolution imagery at a national scale to map degradation in the Brazilian Amazon, our study highlights the challenges of applying similar methodologies with Sentinel-2 data, especially in regions where the resolution of 10 m can limit the detection of fine-scale disturbances. It is important to acknowledge that our study focused on detecting a specific aspect of forest degradation in the Guinea forest region, which is characterized by a seasonal climate. This is probably the reason why the inclusion of water stress related indicators (CWC and MSI) improves the classification scores, as during the dry season the degraded forest, i.e., less dense forest, seem to indicate a higher stress. Thus, the identified degraded forest modalities are specific to this particular forest type and climatic conditions, relying on the expertise of photo-interpretation as the foundational cornerstone. Indeed, it is crucial to emphasize that the study retained the expertise of photo-interpretation as its fundamental basis, upon which the entire investigation relies. It also incorporates field ecological expertise about the understanding of what is forest degradation in the Guinean context, which was built upon direct field observations. Regarding the inclusion of ancillary data, such as water stress indicators, we acknowledge their potential to enhance classification accuracy by capturing environmental factors that may not be fully represented in spectral data alone. However, in regions like Guinea, the availability of such local data is very limited. This presents challenges in fully contextualizing degradation processes within local forest dynamics. Future research endeavors may expand the scope to encompass other types of forest degradation and environmental contexts, thereby providing a more comprehensive understanding of forest dynamics and degradation processes.
One of the main limitations of this study is the relatively small size of the training dataset, which may have constrained the model’s ability to generalize to unseen data. Increasing the size and diversity of the training dataset could potentially lead to more robust and accurate predictions. Regarding model performance, although architectures like ResNet-Unet and SegNet, which were developed after U-Net and built upon its principles, were tested, U-Net still outperformed these models in this specific context. This may be due to the fact that more complex architectures, such as ResNet-Unet and SegNet, require larger datasets to fully realize their potential. Future studies could explore the use of hybrid models or advanced architectures that combine the strengths of these models to further enhance performance. Additionally, the potential benefits of using pre-trained models on larger, more generalized datasets should be investigated. Fine-tuning a pre-trained model could allow the model to better adapt to the unique characteristics of the study area and improve segmentation accuracy. However, further research is needed to evaluate the effectiveness of this approach in this specific context.
The effectiveness of the U-Net model in our study stems from its training on a dataset that captures a specific pattern of forest degradation influenced by the region’s unique climatic characteristics. For successful application in different areas, it is essential that these regions share similar climatic conditions and degradation patterns with those in Guinea. Regions experiencing comparable seasonal climates and degradation processes, such as selective logging or agricultural expansion, are likely to benefit most from our approach. Vo Quang et al. (2022) showed that the Guinea degraded forests differ from the non-degraded ones during the dry season, as the more open canopy of the degraded forest favors some additional desiccation that is visible in the short-wave infrared spectral band radiometry. This is not the only sign of degraded forest that is considered by the contextual RF and the U-Net to identify them, but it is still an important feature for the algorithms. It is not certain how our algorithms would perform over equatorial forests where there is no dry season and thus probably no desiccation. We expect that processing areas with vastly different climates or unique degradation modalities will require adjustments and validations, including tailoring training datasets to reflect relevant spectral signatures and degradation indicators.
Thus, our study emphasizes the importance of context when deploying deep learning CNN methods for forest monitoring. It highlights the need for a nuanced understanding of local environmental conditions and degradation dynamics. This careful consideration opens avenues for global forest monitoring initiatives to effectively leverage deep learning CNN techniques while accounting for regional specificities.
The outcome of our study is the development of an automatic detection system for degraded forests in Guinea. The results are promising, both qualitatively and quantitatively: external validation of the classification maps demonstrated an overall accuracy exceeding 94%. The U-Net architecture, utilized for semantic segmentation, exhibited the ability to classify the image while considering contextual information. This enabled the automatic detection of patterns of forest degradation in satellite images, providing results in few minutes for the Forest Guinea area of about 47,000 square kilometers.
Our study highlights the effectiveness of the U-Net model in automatically detecting degraded forests in Guinea. The comparison of different methodologies, including Random Forest and deep learning, emphasized the superiority of deep learning techniques in terms of accuracy and generalization capabilities. The integration of expanded training data and the use of CNN models provided valuable insights for improving tropical forest monitoring. Our findings contribute to the advancement of automated forest degradation detection and demonstrate the potential of deep learning approaches in supporting ecological research and decision-making processes.
While our study has advanced the detection of degraded forests, several avenues for future research remain. Expanding the training dataset to include a wider range of forest types and environmental conditions will enhance model generalization, enabling better detection and classification of various forest degradation modalities. Future research should also explore other types of forest degradation and broaden the geographical scope to deepen our understanding of forest dynamics. Integrating additional data sources, such as LiDAR or hyperspectral imagery, could provide complementary information for more accurate forest degradation assessments, facilitating the identification of specific drivers and impacts.
In conclusion, our study offers new possibilities for detecting degraded forests with deep learning techniques. Continued research and innovation will enhance forest monitoring, support evidence-based decision-making, and promote the sustainable management of global forest resources.
The original contributions presented in the study are included in the article/supplementary material, further inquiries can be directed to the corresponding author.
AV: Conceptualization, Data curation, Formal Analysis, Investigation, Methodology, Software, Validation, Writing–original draft. ND: Conceptualization, Methodology, Resources, Supervision, Writing–original draft, Writing–review and editing. GJ: Formal Analysis, Investigation, Methodology, Supervision, Validation, Writing–review and editing. CP: Funding acquisition, Investigation, Project administration, Resources, Supervision, Writing–review and editing.
The author(s) declare that financial support was received for the research, authorship, and/or publication of this article. The research was funded by the french ANRT (Association Nationale Recherche Technologie) CIFRE thesis (number 2018/0129).
We would like to acknowledge the following organizations for their support and contributions to this research. This research was carried out as part of the Agro-Ecological Zoning project in Guinea, coordinated by IGN FI and funded by the French Development Agency for the Guinean Ministry of Agriculture (grant number 2018/031/1/6/1/2/1/011). IGN FI, a geographic engineering company and export partner of the French National Geographic Institute, provided invaluable expertise and resources for the project. We would also like to acknowledge the Paris Interdisciplinary Energy Research Institute (LIED) and IGN FI for their partnership in the framework of a CIFRE thesis (number 2018/0129), which supported the research. Additionally, we would like to thank the Research Pole for the Organization and Dissemination of Geographic Information (PRODIG) for their contribution in the initial stages of the thesis. The authors acknowledge the data scientists from Data For Good France (https://dataforgood.fr) for their contributions to the initial development of our U-Net model. Since 2015, Data For Good France has organized annual six-week acceleration seasons, enabling volunteers with specialized skills, including machine learning, to assist researchers, NGOs, and associations on public interest projects. This collaboration resulted in a U-Net neural network that meets the data analyst community’s requirements, enhancing our proficiency in neural networks and facilitating the optimization of the U-Net model in this study.
The authors declare that the research was conducted in the absence of any commercial or financial relationships that could be construed as a potential conflict of interest.
The author(s) declare that no Generative AI was used in the creation of this manuscript.
All claims expressed in this article are solely those of the authors and do not necessarily represent those of their affiliated organizations, or those of the publisher, the editors and the reviewers. Any product that may be evaluated in this article, or claim that may be made by its manufacturer, is not guaranteed or endorsed by the publisher.
Badrinarayanan, V., Kendall, A., and Cipolla, R. (2017). SegNet: a deep convolutional encoder-decoder architecture for image segmentation. IEEE Trans. Pattern Anal. Mach. Intell. 39, 2481–2495. doi:10.1109/tpami.2016.2644615
Ball, J. G. C., Petrova, K., Coomes, D. A., and Flaxman, S. (2022). Using deep convolutional neural networks to forecast spatial patterns of Amazonian deforestation. Methods Ecol. Evol. 13, 2622–2634. doi:10.1111/2041-210X.13953
Ballère, M., Bouvet, A., Mermoz, S., Le Toan, T., Koleck, T., Bedeau, C., et al. (2021). SAR data for tropical forest disturbance alerts in French Guiana: benefit over optical imagery. Remote Sens. Environ. 252, 112159. doi:10.1016/j.rse.2020.112159
Briant, G., Gond, V., and Laurance, S. G. W. (2010). Habitat fragmentation and the desiccation of forest canopies: a case study from eastern Amazonia. Biol. Conserv. 143, 2763–2769. doi:10.1016/j.biocon.2010.07.024
Bullock, E. L., and Woodcock, C. E. (2021). Carbon loss and removal due to forest disturbance and regeneration in the Amazon. Sci. Total Environ. 764, 142839. doi:10.1016/j.scitotenv.2020.142839
Bullock, E. L., Woodcock, C. E., Souza, C., and Olofsson, P. (2020). Satellite-based estimates reveal widespread forest degradation in the Amazon. Glob. Change Biol. 26, 2956–2969. doi:10.1111/gcb.15029
Cao, K., and Zhang, X. (2020). An improved res-UNet model for tree species classification using airborne high-resolution images. Remote Sens. 12, 1128. doi:10.3390/rs12071128
Chaplin-Kramer, R., Ramler, I., Sharp, R., Haddad, N. M., Gerber, J. S., West, P. C., et al. (2015). Degradation in carbon stocks near tropical forest edges. Nat. Commun. 6, 10158. doi:10.1038/ncomms10158
Chazdon, R. L. (2008). Beyond deforestation: restoring forests and ecosystem services on degraded lands. Science 320, 1458–1460. doi:10.1126/science.1155365
Chazdon, R. L., Brancalion, P. H. S., Laestadius, L., Bennett-Curry, A., Buckingham, K., Kumar, C., et al. (2016). When is a forest a forest? Forest concepts and definitions in the era of forest and landscape restoration. Ambio 45, 538–550. doi:10.1007/s13280-016-0772-y
Chen, S., Woodcock, C. E., Bullock, E. L., Arévalo, P., Torchinava, P., Peng, S., et al. (2021). Monitoring temperate forest degradation on Google Earth Engine using Landsat time series analysis. Remote Sens. Environ. 265, 112648. doi:10.1016/j.rse.2021.112648
Dalagnol, R., Wagner, F. H., Galvão, L. S., Braga, D., Osborn, F., and Sagang, L. B. (2023). Mapping tropical forest degradation with deep learning and Planet NICFI data. Remote. Sen. Enviro. 298, 113798. doi:10.1016/j.rse.2023.113798
D’Amico, Q., and Corsini, N. (2015). GMES initial operations/copernicus land monitoring services—validation of products. HRL Water Wetness 2015. Available at: https://land.copernicus.eu/en/technical-library/hrl-water-and-wetness-2015-validation-report/@@download/file.
de Bem, P., de Carvalho Junior, O., Fontes Guimarães, R., and Trancoso Gomes, R. (2020). Change detection of deforestation in the Brazilian Amazon using Landsat data and convolutional neural networks. Remote Sens. 12, 901. doi:10.3390/rs12060901
Dehaudt, B., Amir, Z., Decoeur, H., Gibson, L., Mendes, C., Moore, J. H., et al. (2022). Common palm civets Paradoxurus hermaphroditus are positively associated with humans and forest degradation with implications for seed dispersal and zoonotic diseases. J. Animal Ecol. 91, 794–804. doi:10.1111/1365-2656.13663
Duporge, I., Isupova, O., Reece, S., Macdonald, D. W., and Wang, T. (2021). Using very-high-resolution satellite imagery and deep learning to detect and count African elephants in heterogeneous landscapes. Remote Sens. Ecol. Conserv. 7, 369–381. doi:10.1002/rse2.195
Dupuis, C., Lejeune, P., Michez, A., and Fayolle, A. (2020). How can remote sensing help monitor tropical moist forest degradation? a systematic review. Remote Sens. 12, 1087. doi:10.3390/rs12071087
Emek, R. A., and Demir, N. (2020). Building detection from SAR images using UNet deep learning method. Int. Arch. Photogramm. Remote Sens. Spat. Inf. Sci. XLIV-4/W3-2020, 215–218. doi:10.5194/isprs-archives-XLIV-4-W3-2020-215-2020
Ernst, C., Verhegghen, A., Mayaux, P., Hansen, M., and Defourny, P. (2010). Cartographie du couvert forestier et des changements du couvert forestier en Afrique centrale. Les. forêts Du. Bassin Du. Congo. état Des. forêts, 23–42.
FAO (Food and Agriculture Organization of the United Nations) (2020). Global forest resources assessment 2020: terms and definitions. Rome: FAO Forestry Paper No. 188.
Gallwey, J., Robiati, C., Coggan, J., Vogt, D., and Eyre, M. (2020). A Sentinel-2 based multispectral convolutional neural network for detecting artisanal small-scale mining in Ghana: applying deep learning to shallow mining. Remote Sens. Environ. 248, 111970. doi:10.1016/j.rse.2020.111970
Garcia-Garcia, A., Orts-Escolano, S., Oprea, S., Villena-Martinez, V., and Garcia-Rodriguez, J. (2017). A review on deep learning techniques applied to semantic segmentation. arXiv:1704.06857. doi:10.48550/ARXIV.1704.06857
Ghazoul, J., Burivalova, Z., Garcia-Ulloa, J., and King, L. A. (2015). Conceptualizing forest degradation. Trends Ecol. and Evol. 30, 622–632. doi:10.1016/j.tree.2015.08.001
Han, M., Zhu, X., and Yao, W. (2012). Remote sensing image classification based on neural network ensemble algorithm. Neurocomputing 78, 133–138. doi:10.1016/j.neucom.2011.04.044
He, K., Zhang, X., Ren, S., and Sun, J. (2015). Deep residual learning for image recognition. doi:10.48550/ARXIV.1512.03385
Hua, Y., Marcos, D., Mou, L., Zhu, X. X., and Tuia, D. (2022). Semantic segmentation of remote sensing images with sparse annotations. IEEE Geosci. Remote Sens. Lett. 19, 1–5. doi:10.1109/LGRS.2021.3051053
IPCC (2019). Climate Change and Land: an IPCC special report on climate change, desertification, land degradation, sustainable land management, urbanization, and greenhouse gas fluxes in terrestrial ecosystems.
IPCC (2021). Climate change 2021: the physical science basis. Contribution of working group I to the sixth assessment report of the intergovernmental Panel on climate change. Editors V. Masson-Delmotte, P. Zhai, A. Pirani, S. L. Connors, C. Péan, S. Bergeret al. (Cambridge University Press). doi:10.1017/9781009157896
Irvin, J., Sheng, H., Ramachandran, N., Johnson-Yu, S., Zhou, S., Story, K., et al. (2020). ForestNet: classifying drivers of deforestation in Indonesia using deep learning on satellite imagery. arXiv:2011.05479 [cs, eess].
Kingma, D. P., and Ba, J. (2014). Adam: a method for stochastic optimization. doi:10.48550/ARXIV.1412.6980
Knopp, L., Wieland, M., Rättich, M., and Martinis, S. (2020). A deep learning approach for burned area segmentation with sentinel-2 data. Remote Sens. 12, 2422. doi:10.3390/rs12152422
Kuck, T. N., Sano, E. E., Bispo, P. D. C., Shiguemori, E. H., Silva Filho, P. F. F., and Matricardi, E. A. T. (2021). A comparative assessment of machine-learning techniques for forest degradation caused by selective logging in an Amazon region using multitemporal X-band SAR images. Remote Sens. 13, 3341. doi:10.3390/rs13173341
Lambers, K., Verschoof-van der Vaart, W., and Bourgeois, Q. (2019). Integrating remote sensing, machine learning, and citizen science in Dutch archaeological prospection. Remote Sens. 11, 794. doi:10.3390/rs11070794
Li, H., Zhao, L., Sun, L., Li, X., Wang, J., Han, Y., et al. (2022). Capability of phenology-based sentinel-2 composites for rubber plantation mapping in a large area with complex vegetation landscapes. Remote Sens. 14 (21), 5338. doi:10.3390/rs14215338
Li, T., Comer, M., and Zerubia, J. (2019). “Feature extraction and tracking of CNN segmentations for improved road detection from satellite imagery,” in 2019 IEEE International Conference on Image Processing (ICIP). Presented at the 2019 IEEE International Conference on Image Processing (ICIP), Taipei, Taiwan (IEEE), 2641–2645. doi:10.1109/ICIP.2019.8803355
Liu, R., Kuffer, M., and Persello, C. (2019). The temporal dynamics of slums employing a CNN-based change detection approach. Remote Sens. 11, 2844. doi:10.3390/rs11232844
Maretto, R. V., Fonseca, L. M. G., Jacobs, N., Korting, T. S., Bendini, H. N., and Parente, L. L. (2021). Spatio-temporal deep learning approach to map deforestation in Amazon rainforest. IEEE Geosci. Remote Sens. Lett. 18, 771–775. doi:10.1109/LGRS.2020.2986407
Matricardi, E. A. T., Skole, D. L., Costa, O. B., Pedlowski, M. A., Samek, J. H., and Miguel, E. P. (2020). Long-term forest degradation surpasses deforestation in the Brazilian Amazon. Science 369, 1378–1382. doi:10.1126/science.abb3021
Maxwell, S. L., Evans, T., Watson, J. E. M., Morel, A., Grantham, H., Duncan, A., et al. (2019). Degradation and forgone removals increase the carbon impact of intact forest loss by 626. Sci. Adv. 5, eaax2546. doi:10.1126/sciadv.aax2546
Milletari, F., Navab, N., and Ahmadi, S.-A. (2016). “V-net: fully convolutional neural networks for volumetric medical image segmentation,” in 2016 fourth international conference on 3D vision (3DV), 565–571. Stanf. CA, U. S. A. doi:10.1109/3DV.2016.79
Mitchell, A. L., Rosenqvist, A., and Mora, B. (2017). Current remote sensing approaches to monitoring forest degradation in support of countries measurement, reporting and verification (MRV) systems for REDD+. Carbon Balance Manage 12, 9. doi:10.1186/s13021-017-0078-9
Neupane, B., Horanont, T., and Aryal, J. (2021). Deep learning-based semantic segmentation of urban features in satellite images: a review and meta-analysis. Remote Sens. 13, 808. doi:10.3390/rs13040808
Olivero, J., Fa, J. E., Real, R., Márquez, A. L., Farfán, M. A., Vargas, J. M., et al. (2017). Recent loss of closed forests is associated with Ebola virus disease outbreaks. Sci. Rep. 7, 14291. doi:10.1038/s41598-017-14727-9
Olofsson, P., Stehman, S. V., Woodcock, C. E., Sulla-Menashe, D., Sibley, A. M., Newell, J. D., et al. (2012). A global land-cover validation data set, part I: fundamental design principles. Int. J. Remote Sens. 33, 5768–5788. doi:10.1080/01431161.2012.674230
Ortega Adarme, M., Queiroz Feitosa, R., Nigri Happ, P., Aparecido De Almeida, C., and Rodrigues Gomes, A. (2020). Evaluation of deep learning techniques for deforestation detection in the Brazilian Amazon and cerrado biomes from remote sensing imagery. Remote Sens. 12, 910. doi:10.3390/rs12060910
Osio, A. A., Lê, H.-Â., Ayugi, S., Onyango, F., Odwe, P., and Lefèvre, S. (2022). Detection of Degraded Acacia tree species using deep neural networks on uav drone imagery. ISPRS Ann. Photogramm. Remote Sens. Spat. Inf. Sci. V-3-2022, 455–462. doi:10.5194/isprs-annals-v-3-2022-455-2022
Park, S. W., and Lee, Y. W. (2019). “Detection of forest disaster using high-resolution satellite images with semantic segmentation,” in Image and signal processing for remote sensing XXV. Presented at the image and signal processing for remote sensing XXV. Editors L. Bruzzone, F. Bovolo, and J. A. Benediktsson (Strasbourg, France: SPIE), 59. doi:10.1117/12.2532990
Putz, F. E., and Redford, K. H. (2010). The importance of defining ‘forest’: tropical forest degradation, deforestation, long-term phase shifts, and further transitions. ’ Biotropica 42, 10–20. doi:10.1111/j.1744-7429.2009.00567.x
Qayyum, A., Anwar, S. M., Awais, M., and Majid, M. (2017). Medical image retrieval using deep convolutional neural network. Neurocomputing 266, 8–20. doi:10.1016/j.neucom.2017.05.025
Qin, Y., Xiao, X., Wigneron, J.-P., Ciais, P., Brandt, M., Fan, L., et al. (2021). Carbon loss from forest degradation exceeds that from deforestation in the Brazilian Amazon. Nat. Clim. Chang. 11, 442–448. doi:10.1038/s41558-021-01026-5
Reiche, J., Marcos, D., Mullissa, A., Lossou, E., Peña-Claros, M., Herold, M., et al. (2023). Monitoring direct drivers of small-scale tropical forest disturbance in near real-time with Sentinel-1 and -2 data. Remote Sens. Environ. 295, 113655. doi:10.1016/j.rse.2023.113655
Ronneberger, O., Fischer, P., and Brox, T. (2015). “U-net: convolutional networks for biomedical image segmentation,” in Medical image computing and computer-assisted intervention – miccai 2015. Editors N. Navab, J. Hornegger, W. M. Wells, and A. F. Frangi (Cham: Springer International Publishing), 234–241. doi:10.1007/978-3-319-24574-4_28
Rulli, M. C., Santini, M., Hayman, D. T. S., and D’Odorico, P. (2017). The nexus between forest fragmentation in Africa and Ebola virus disease outbreaks. Sci. Rep. 7, 41613. doi:10.1038/srep41613
Safonova, A., Tabik, S., Alcaraz-Segura, D., Rubtsov, A., Maglinets, Y., and Herrera, F. (2019). Detection of fir trees (abies sibirica) damaged by the bark beetle in unmanned aerial vehicle images with deep learning. Remote Sens. 11, 643. doi:10.3390/rs11060643
Shapiro, A. C., Grantham, H. S., Aguilar-Amuchastegui, N., Murray, N. J., Gond, V., Bonfils, D., et al. (2021). Forest condition in the Congo Basin for the assessment of ecosystem conservation status. Ecol. Indic. 122, 107268. doi:10.1016/j.ecolind.2020.107268
Singh, A., and Kushwaha, S. K. P. (2021). Forest degradation assessment using UAV optical photogrammetry and SAR data. J. Indian Soc. Remote Sens. 49, 559–567. doi:10.1007/s12524-020-01232-2
Souza, C. (2003). Mapping forest degradation in the Eastern Amazon from SPOT 4 through spectral mixture models. Remote Sens. Environ. 87, 494–506. doi:10.1016/j.rse.2002.08.002
Souza, C., Siqueira, J., Sales, M., Fonseca, A., Ribeiro, J., Numata, I., et al. (2013). Ten-year Landsat classification of deforestation and forest degradation in the Brazilian Amazon. Remote Sens. 5, 5493–5513. doi:10.3390/rs5115493
Stehman, S. V. (2009). Sampling designs for accuracy assessment of land cover. Int. J. Remote Sens. 30, 5243–5272. doi:10.1080/01431160903131000
Stoian, A., Poulain, V., Inglada, J., Poughon, V., and Derksen, D. (2019). Land cover maps production with high resolution satellite image time series and convolutional neural networks: adaptations and limits for operational systems. Remote Sens. 11, 1986. doi:10.3390/rs11171986
Szantoi, Z., Brink, A., Lupi, A., Mammone, C., and Jaffrain, G. (2020). Key landscapes for conservation land cover and change monitoring, thematic and validation datasets for sub-Saharan Africa. Earth Syst. Sci. Data 12, 3001–3019. doi:10.5194/essd-12-3001-2020
Szantoi, Z., Jaffrain, G., Gallaun, H., Bielski, C., Ruf, K., Lupi, A., et al. (2021). Quality assurance and assessment framework for land cover maps validation in the Copernicus Hot Spot Monitoring activity. Eur. J. Remote Sens. 54, 538–557. doi:10.1080/22797254.2021.1978001
Thompson, I. D., Guariguata, M. R., Okabe, K., Bahamondez, C., Nasi, R., Heymell, V., et al. (2013). An operational framework for defining and monitoring forest degradation. Ecol. Soc. 18, art20. doi:10.5751/es-05443-180220
Vancutsem, C., Achard, F., Pekel, J.-F., Vieilledent, G., Carboni, S., Simonetti, D., et al. (2021). Long-term (1990–2019) monitoring of forest cover changes in the humid tropics. Sci. Adv. 7, eabe1603. doi:10.1126/sciadv.abe1603
Vásquez-Grandón, A., Donoso, P., and Gerding, V. (2018). Forest degradation: when is a forest degraded? Forests 9, 726. doi:10.3390/f9110726
Vogelmann, J., Khoa, P., Lan, D., Shermeyer, J., Shi, H., Wimberly, M., et al. (2017). Assessment of forest degradation in Vietnam using Landsat time series data. Forests 8, 238. doi:10.3390/f8070238
Vo Quang, A., Delbart, N., Jaffrain, G., Pinet, C., and Moiret, A. (2022). Detection of degraded forests in Guinea, West Africa, based on Sentinel-2 time series by inclusion of moisture-related spectral indices and neighbourhood effect. Remote Sens. Environ. 281, 113230. doi:10.1016/j.rse.2022.113230
Wagner, F. H., Sanchez, A., Aidar, M. P. M., Rochelle, A. L. C., Tarabalka, Y., Fonseca, M. G., et al. (2020). Mapping Atlantic rainforest degradation and regeneration history with indicator species using convolutional network. PLoS ONE 15, e0229448. doi:10.1371/journal.pone.0229448
Wagner, F. H., Sanchez, A., Tarabalka, Y., Lotte, R. G., Ferreira, M. P., Aidar, M. P. M., et al. (2019). Using the U-net convolutional network to map forest types and disturbance in the Atlantic rainforest with very high resolution images. Remote Sens. Ecol. Conserv. 5, 360–375. doi:10.1002/rse2.111
Wasseige, C., and Defourny, P. (2004). Remote sensing of selective logging impact for tropical forest management. For. Ecol. Manag. 188, 161–173. doi:10.1016/j.foreco.2003.07.035
Wasseige, C., Flynn, J., and Louppe, D. (2014). Les forêts du bassin du Congo: état des forêts 2013. Weyrich, Neufchâteau.
Weiss, M., and Baret, F. (2016). S2toolbox level 2 products: LAI, fapar, fcover. Avignon: Institut National de la Recherche Agronomique INRA.
Yan, S., Xu, L., and Wu, R. (2019). “Automatic classification of glaciers from sentinel-2 imagery using A novel deep learning model,” in Proceedings of the 2019 3rd international conference on advances in image processing. Presented at the ICAIP 2019: 2019 3rd international conference on advances in image processing (Chengdu China: ACM), 155–159. doi:10.1145/3373419.3373460
Yang, H. L., Yuan, J., Lunga, D., Laverdiere, M., Rose, A., and Bhaduri, B. (2018). Building extraction at scale using convolutional neural network: mapping of the United States. IEEE J. Sel. Top. Appl. Earth Obs. Remote Sens. 11, 2600–2614. doi:10.1109/JSTARS.2018.2835377
Yi, Y., Zhang, Z., Zhang, W., Zhang, C., Li, W., and Zhao, T. (2019). Semantic segmentation of urban buildings from VHR remote sensing imagery using a deep convolutional neural network. Remote Sens. 11, 1774. doi:10.3390/rs11151774
Zhang, L., Zhang, L., and Du, B. (2016). Deep learning for remote sensing data: a technical tutorial on the state of the art. IEEE Geosci. Remote Sens. Mag. 4, 22–40. doi:10.1109/MGRS.2016.2540798
Zhang, P., Ke, Y., Zhang, Z., Wang, M., Li, P., and Zhang, S. (2018). Urban land use and land cover classification using novel deep learning models based on high spatial resolution satellite imagery. Sensors 18, 3717. doi:10.3390/s18113717
Zhang, Y., Ling, F., Wang, X., Foody, G. M., Boyd, D. S., Li, X., et al. (2021). Tracking small-scale tropical forest disturbances: fusing the Landsat and Sentinel-2 data record. Remote Sens. Environ. 261, 112470. doi:10.1016/j.rse.2021.112470
Keywords: remote sensing, tropical forest, forest degradation, land use/land cover mapping, random forest, convolutional neural networks
Citation: Vo Quang A, Delbart N, Jaffrain G and Pinet C (2025) Detection of degraded forests in Guinea, West Africa, using convolutional neural networks and Sentinel-2 time series. Front. Remote Sens. 6:1538808. doi: 10.3389/frsen.2025.1538808
Received: 03 December 2024; Accepted: 04 February 2025;
Published: 05 March 2025.
Edited by:
Jean-Pierre Wigneron, Institut National de recherche pour l’agriculture, l’alimentation et l’environnement (INRAE), FranceReviewed by:
Huan Wang, Peking University, ChinaCopyright © 2025 Vo Quang, Delbart, Jaffrain and Pinet. This is an open-access article distributed under the terms of the Creative Commons Attribution License (CC BY). The use, distribution or reproduction in other forums is permitted, provided the original author(s) and the copyright owner(s) are credited and that the original publication in this journal is cited, in accordance with accepted academic practice. No use, distribution or reproduction is permitted which does not comply with these terms.
*Correspondence: An Vo Quang, YXZvcXVhbmdAaWduZmkuZnI=; Nicolas Delbart, bmljb2xhcy5kZWxiYXJ0QHUtcGFyaXMuZnI=
Disclaimer: All claims expressed in this article are solely those of the authors and do not necessarily represent those of their affiliated organizations, or those of the publisher, the editors and the reviewers. Any product that may be evaluated in this article or claim that may be made by its manufacturer is not guaranteed or endorsed by the publisher.
Research integrity at Frontiers
Learn more about the work of our research integrity team to safeguard the quality of each article we publish.