 Michael Dille
 Massimo Vespignani
 Jonathan Bruce
 Uland Wong
- 1KBRwyle, Houston, TX, United States
- 2Intelligent Robotics Group, Ames Research Center, National Aeronautics and Space Administration, Moffett Field, CA, United States
Current streamgaging processes for river flow rate estimation are typically slow and often hazardous, leading to inadequate coverage across national waterways. This paper presents a semi-autonomous aerial monitoring system that is designed for rapid river flow gaging, building upon a recently developed sensor package that is mounted beneath a small uncrewed aerial vehicle. This package consists of, among other instruments, a mid-wave infrared camera that can be used to detect minute thermal variations in the water surface, from which a particle image velocimetry algorithm is used to extract flow estimation. The design and testing of this sensor package and velocimetry algorithm for field evaluation are discussed, and a simulation environment facilitating the development of algorithms for automatic a priori and live-adaptive vehicle trajectory planning is presented. The simulation environment captures a physically based approximation of vehicle flight characteristics, contains digital terrain models of field test sites, and incorporates water surface flow maps generated from numerical flow simulation data and real-world measurements. Field and simulation results are presented validating the design of the sensor package and the use of simulation as a digital twin for aerial streamgaging development. This framework and the lessons learned to date lay the foundation for accelerated improvements in waterway measurement for both routine and disaster response purposes requiring rapid deployment in novel locations.
1 Introduction
Remote aerial surveys at roughly kilometer scale are a growing area of Earth science interest between relatively low-resolution, semi-static orbital imagery and live but sparse in situ ground-based data collection. These are particularly valuable in scenarios such as either disaster response requiring rapid deployment or observation of dynamic phenomena which may benefit from reactive changes in observation plans mid-mission.
Frequently, aerial platforms at this scale consist of quadrotor, hexrotor, or small fixed-wing uncrewed aerial vehicles (UAVs) carrying payloads between 4–10 kg. These are typically launched and controlled by a nearby operator who can preview and provide preliminary validation of collected data before choosing the next launch site or further laboratory post-processing. Given the relatively short 10–30 min flight times of such vehicles and the labor-intensive nature of both piloting and reviewing data returns, varying levels of assistive autonomy such as automated reactive trajectory refinement or waypoint selection are highly desirable to make the best use of limited time and personnel.
One type of data collection with the potential to strongly benefit from small UAV surveys is that of river stream flow monitoring, an important effort conducted across the United States by the US Geological Survey (USGS) that is tasked with nationwide flow observation in support of ensuring continued adequate water supplies, mitigating flood risks, monitoring active floods, and preserving aquatic ecosystems. This process currently relies on a network of approximately 8,500 streamgaging sites (visualized in Figure 1) that are costly to maintain and often involve potentially hazardous, labor-intensive tasks such as wading and frequent small boat operations. Furthermore, despite this apparent breadth, there remain immense gaps in coverage of waterways with a recent study by Andrews and Grantham (2024) reporting that barely 8% of rivers in California are monitored. Aerial streamgaging from small UAVs would enable faster flow measurements over wider areas with fewer hazards.
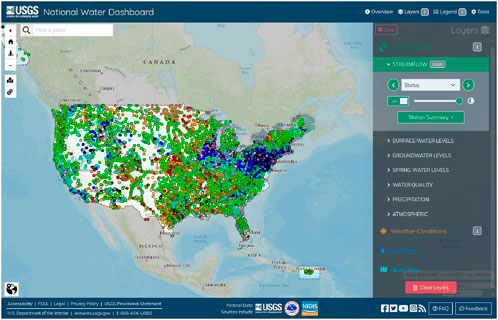
Figure 1. Screenshot of USGS streamflow stations across the continental United States. Interactively available at https://dashboard.waterdata.usgs.gov.
This paper describes the development and early field trials across two design iterations of the River Observation System (RiOS), a small UAV payload for non-contact aerial stream flow measurement. The measurement technique applied is an image-based optical flow process that uses an onboard thermal camera to track the motion of minute thermal variations on the water’s surface. This surface flow rate is used as a critical component of (or proxy for) total waterway discharge or volumetric flow rate, the target measurement in the streamgaging process. The field trials verify the payload design and further validate this flow estimation technique that was previously demonstrated in stationary and larger aircraft use cases. Benefits and limitations of the current system are discussed, along with the path towards a lower-cost rapidly deployable system usable by field scientists and technicians without specific expertise in either optical flow sensing or uncrewed aircraft operations.
This paper also describes RiOS-Sim, an accompanying software simulation system that was developed based on the Robot Operating System (ROS) framework to aid in predicting performance under varying field conditions and optimizing field operations plans. Due to the many costs of real-world UAV field trials, simulation is a valuable tool for both developing autonomy algorithms as well as evaluating the expected performance of a system in yet-unseen environments. This is of great use when such environments are inconveniently located or infrequently present (e.g., for disaster response). The architecture of this simulation environment is detailed, along with ongoing work on autonomous decision-making for route finding.
1.1 Related work
1.1.1 Small uncrewed aircraft in earth science
Since the proliferation of UAVs for civilian use in the late 2000s (Nex and Remondino, 2014), the Earth science community has quickly recognized and embraced the value of small UAVs in field investigations (Koh and Wich, 2012). The many appeals include rapid deployment, wide site overviews, fast motion and ever-improving payload capacity, cost, and flight times. Initially, applications focused on aerial photography for land studies and construction of digital terrain models (DTMs) (Niethammer et al., 2012). However, applications quickly branched out to areas of hydrology including shoreline assessment (Mancini et al., 2013), river bathymetry (Zinke and Flener, 2013), and flood monitoring (Perks et al., 2016).
1.1.2 Optical and aerial stream flow estimation
Due to the hazards and labor intensiveness of manual stream flow measurement, non-contact streamgaging methods have been long sought after, and techniques involving specialized stroboscope instruments (Rantz, 1982) and doppler radars (Costa et al., 2006) have been demonstrated with some success. Direct visual determination of surface flow by observing the motion of artificial tracer or marker objects placed on the surface is possible (Harpold et al., 2006), but also labor intensive and potentially pollutive. More recently, purely passive vision-based approaches have shown promise, such as particle image velocimetry (PIV) which tracks the apparent motion of a set of virtual particles on the water surface across frames of an aerial video sequence using contrast introduced by surface perturbations, ripples, or incidental natural tracers such as foam or debris (Raffel et al., 2018), albeit with less reliability and greater noise than artificial ones (Biggs et al., 2022). With adequate resolution and highly favorable lighting conditions, this process may be performed on typical visible-light camera imagery (Muste et al., 2008), but much more reliable performance has been demonstrated using thermal infrared imagery with a noise equivalent temperature difference (NETD) sensitivity below 20 mK (Kinzel et al., 2024). We therefore adopt such a camera in our UAV payload design.
Velocimetry from fixed camera stations on channel banks providing oblique imagery has been used with success (Schweitzer and Cowen, 2021), however periodic in situ streamgaging is still necessary to validate stage-discharge curves or when channel heights may change (Braca, 2008). Aerial measurement from UAVs provides advantages including approximately nadir viewpoints of consistent areal resolution and the ability to cover wider rivers given sufficient altitude.
Surface flow velocity alone is insufficient to estimate total waterway discharge, or volumetric flow rate. Rather, at any cross-sectional slice of the waterway, this is comprised of a surface-to-bottom flow rate curve, integrated across the width of the channel, which may also vary in depth. Recent studies have confirmed a small range of correction factors provide reasonable translation between surface flow velocity and depth-averaged velocity at any one point in a river (Duan et al., 2023), with a constant factor often assumed for simplicity (Rantz, 1982) though more elaborate models may prove substantially more accurate (Biggs et al., 2023). With a cross-section of depth-averaged velocity, bathymetric depth information is needed to complete the integration. This may be known directly if the waterway is an artificially constructed one (e.g., a concrete channel), from prior topographic maps if the cross-section is stable, or from any of several survey techniques such as echosounders, water-penetrating laser rangefinder (LIDAR) (Kinzel and Legleiter, 2019), or radar (Lane et al., 2020).
1.1.3 Vehicle and environmental simulations
As UAV missions grow increasingly complex, particularly with the incorporation of autonomy capabilities, simulations have become a critical part of validating vehicle behaviors and operational performance. Tightly coupled simulations involving high-fidelity vehicle physics, environmental modeling, sensor measurements, and control software intended to mirror physical counterparts - known as Digital Twins (DT) - are a “holy grail” of AI and robotics (Attaran and Celik, 2023). DT enable high-throughput debugging, hardening for robustness, and optimization with the power of computing, while minimizing the significant time and cost of deploying hardware for field testing. NASA pioneered the DT concept during the Apollo era (Attaran and Celik, 2023), and now uses modern, high-fidelity simulators to drive the development of missions such as RPSim for Lunar exploration (Allan et al., 2019), OceanWATERS for icy worlds (Dalal et al., 2024), and DARTS for Mars (Jain, 2020). In the UAV community, notable simulators include RotorS for micro aerial vehicles (Furrer et al., 2016), Hector for quadrotor vehicles (Meyer et al., 2012), and the now-defunct AirSim for AI research (Shah et al., 2018). Many of these examples are built on the popular open-source ROS/Gazebo framework (Koenig and Howard, 2004), and this paper continues this trend by levering the previously mentioned Hector work. However, our RiOS-Sim is distinguished from prior works with an approach that is tailored to UAV stream flow applications, focusing on multi-modal sensing of the water surface with an intelligent payload.
2 Materials and equipment
Guiding requirements for the RiOS UAV sensor payload were dictated by a combination of regulatory restrictions, organizational policies, industry best practices, and consultation with both hydrological scientists and experienced small UAV pilots who fly science missions. A number of collected and distilled desirable properties soon became apparent. Among the most important was for the payload to be platform-independent and self-contained (providing its own power, computing, and data downlink) to provide safety isolation and portability between different UAVs. Another was for the payload to contain an appropriate sensor suite, which for this application came to consist of thermal and visible cameras, a LIDAR rangefinder for scale recovery, and a satellite/inertial navigation sensor for image stabilization and vehicle-independent pose recording. This all must fit within a tight size and mass envelope. A low-rate downlink provides for live data preview, and full-rate onboard data logging permits more thorough laboratory post-processing. Finally, a straightforward semi-automated operation structure is desirable for field workload reduction and eventual use by field scientists and technicians with differing expertise. The overall system architecture settled upon is depicted in Figure 2.
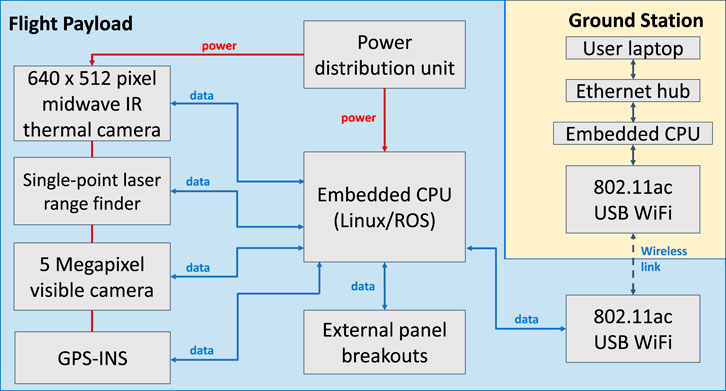
Figure 2. Overall UAV sensing payload system architecture and data flow.
2.1 UAV airframe
With these guiding principles in mind, the selection of UAV platform was primarily steered by the approximate size (3,000–5,000
The M600 was chosen as our target archetype platform due to its long flight heritage for these purposes, its proven reliability, existing pilot familiarity, availability of vehicles, and replacement components. Its recent discontinuation by the manufacturer and tightening restrictions on the use of foreign-produced UAVs by U.S. government agencies affirmed the value of separating payload design and operation from the airframe to aid transfer to future alternatives. At this time, the M600 continues to be used, but domestic competitors such as the Freefly Alta 6 are under evaluation by the DOI.
2.2 Payload hardware
Payload component selection was heavily influenced by compatibility of typical specifications such as size, weight, and power (SWaP) with the tight mass and volume constraints on what can be carried by a small UAV, as well as the results of prior field experimentation by partner hydrology scientists.
On the basis of this input and motivated by results from prior publication on thermal flow estimation (Section 1.1.2), a thermal camera designed for mid-wave infrared wavelengths (3–5
An accompanying high-resolution visible light camera was selected to provide context imagery as well as serve as another potential source of optical flow data. The chosen Allied Vision Technologies Mako G-503C color camera contains a 2,592 × 1944 CMOS sensor and is paired with a 4 mm fixed-focus lens to provide an approximately 71° horizontal field of view with a combined mass of 150 g while consuming less than 2 W.
The focal lengths for these two cameras were selected as a compromise between the competing goals of attempting to maximize areal resolution to provide the clearest imagery for optical flow computation (motivating a narrow field of view) and attempting to maximize the observed portion of a river channel below to reduce the number of observation locations required to accumulate a full flow field estimate (motivating a wide field of view). Variable zoom lenses were dismissed as an option owing to their substantially larger size and fears that vehicle vibration might affect zoom stability. Ultimately, following an iterative evaluation process, commercially available lenses were selected that provided a full view of the entire river width at the flying altitudes used during the field evaluation.
To assist with scale recovery, needed to translate flow rates from image pixel coordinates to physical distances, a single-point LIDAR was also included to serve as an altimeter. Under assumed level orientation during dwell periods and locally flat terrain within the camera field of view (i.e., river water surface), a single scale factor may be applied to all flow estimates across the image. To fulfill this role, a Laser Technology Incorporated TruSense S200 was chosen, providing 4 cm accuracy at up to 750 m distance, while occupying 100 g and consuming less than 2 W. Operating at a wavelength of 905 nm, this device should reliably measure distances from the reflection boundary at the surface of the water rather than penetrating the water.
Likewise, to provide a self-contained and consistent source of pose estimation to aid with image stabilization (a core step in optical flow determination), a miniature device combining an additional GPS receiver and an inertial measurement unit (IMU) consisting of an accelerometer, a gyroscope, and a compass is included. Combining satellite positioning and an inertial navigation system, this is commonly referred to as a GPS-INS unit, though IMU is still used interchangeably. For this purpose, a Vectornav VN-300 was selected, which implements a combined pose filter specified to provide absolute pose estimates with less than 0.5° orientation and 1.5 m position error, from an underlying gyroscope and magnetometer with claimed bias stability below 10° per hour and 0.04 mg respectively, placing it in the category of tactical-grade microelectromechanical system (MEMS) IMUs1 while weighing 30 g and consuming less than 1.5 W. While higher-accuracy angular estimation would certainly aid image stabilization, positioning accuracy is a non-critical parameter as it is only used to identify the flow estimate grid cell corresponding to the center point of incoming imagery.
An embedded computer was used to communicate with these various sensors, record pre-processed data for later study, and transmit preview data to the ground for review. A wide and ever-evolving landscape of options is available, but once it was concluded that live optical flow estimation would occur on the ground, for this payload the choice was highly constrained by the need to record a very high-rate data stream with relatively little need for onboard computational power. As such, internal memory bandwidth, flash memory write speed, and high parallel thread count support to handle the many sensor data streams without data loss and with minimal relative time jitter became the crucial parameters. Based on this, the Hardkernel Odroid XU4 single board computer (SBC) was chosen. This computer consumes a peak of 15 W and weighs 125 g with its attached cooling fan.
A wireless transceiver is also included for live radio downlink of our preview data for ground-side review visualization and any desired field processing prior to landing. This link is also used for control in the reverse direction to issue commands to the payload such as to start and stop onboard data recording. As a balance of performance and design simplicity, early testing determined and later verified in field trials that commercial IEEE 802.11n 5 GHz WiFi operating at maximum license-free power (1 W) would provide sufficient range and bandwidth for typical operations. To implement this, a RadioLabs Wave Stealth 802.11ac compact transceiver was further included in the payload, with two monopole “rubber ducky” antennas, each respectively placed on opposite sides of the exterior of the payload enclosure for maximum directional coverage. The selection of such common commercial antennas permits simple replacement in case of damage and leverages extensive industry experience and design optimization, while more precise tuning for this application would require highly specialized laboratory testing of the complete vehicle and reduce the independence of the payload design from the choice of airframe. During flight, the two antennas are oriented outward on the horizontal plane and perpendicular to the payload, positioning their radiation patterns to be strongest toward the ground.
To supply power to these components, a custom power distribution printed circuit board (PCB) was designed containing two 5 V and 12 V step-down commercial Recom regulators, each respectively providing up to 30 W. Given the potential sensitivity of the onboard sensors, each output channel included separate electrical noise filtering and current limiting for overload protection. This isolation allows the system to continue operating if one or more devices suffer a fault, minimizing lost time and data while speeding diagnosis. Two Inspired Energy 14.4 V rechargeable Lithium Ion batteries provide input, with one adequate for operation, allowing hot-swapping of batteries or transfer to an external power source without shutting down the system. These batteries were selected for their existing certification and proven flight heritage on the International Space Station, high energy density (0.2 Wh/g), and internal monitoring circuitry that is used to provide visual indication of charge level and battery state telemetry recording by the power distribution PCB. With this PCB having a mass of 150 g including heatsinking and each battery 240 g, the overall power system represents a significant contribution to overall payload weight.
These components were mounted within a prismatic frame bordered by aluminum struts and a sturdy 1/8 in thick carbon fiber plate to provide rigidity to maintain relative alignment between sensors. The outer enclosure consisted of 1/16 in thick carbon fiber panels with an additional cooling fan to provide circulation and slight positive pressurization of the payload interior to minimize dust accumulation during payload operations. Various requisite power and data interconnect cabling between components completed the design. Attachment to the airframe was made via four rubber dampers to provide vibration isolation, with backup steel safety lanyards in case of attachment failure. Overall, wiring and structure added nearly 2.8 kg to the overall payload mass, leading to a focus on optimizing this aspect of this design.
The overall payload in its first assembled iteration is shown in Figure 3. The payload dimensions are approximately 26 cm × 28.5 cm × 15.5 cm, for a total volume of 11,600
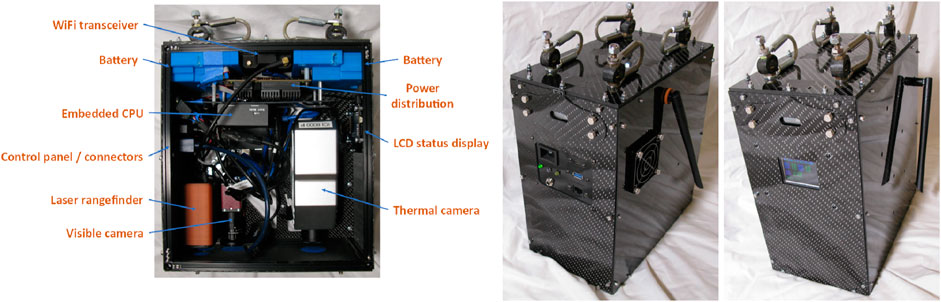
Figure 3. Hardware realization of UAV sensing payload, version 1 showing the interior layout and the packaged exterior. Antennas are shown stowed and point directly outwards during flight.
This version of the payload was intended as a first prototype and proof of concept. Following the success of this design in early field trials, lessons learned were incorporated into a more optimized “version 2” of the payload. The primary optimization made was to reduce size and mass through more compact mounting and tighter shaping of the outer payload envelope. This was to improve flight time as well as reduce vulnerability to buffeting by wind. All sensors and computing are mounted across both sides of a single carbon fiber plate, forming a central pillar and ensuring tight coupling in the presence of any vibration, with the outer shell shaped to fit tightly over these. With greater confidence in the overall reliability of the payload, a significant simplification of the power distribution system was undertaken, removing per-channel isolation and power telemetry reporting, while switching to lower-cost and lighter-weight lithium-polymer batteries now mounted on the top of the airframe to further shrink the payload itself. While this latter modification does represent a trade-off in ruggedness and available state information, the reduction in power system SWaP and assembly effort has so far proven worthwhile. Finally, a novel airframe attachment system was introduced that consists of a single-point quick release (Alta X Short Quick Release Mount combined with a Toad in the Hole M4 Quick Release Receiver), directly compatible with the Alta X payload connector and requiring only a small adapter for the M600. This significantly reduces field preparation and teardown time compared to the 4 bolts required for the version-1 payload.
The version 2 payload assembly is shown in Figure 4. Overall dimensions are approximately 18 cm × 14.5 cm in breadth, narrowing to 13 cm × 9 cm for the proximal 6.5 cm of its 24 cm total height, for a total volume of 5,500
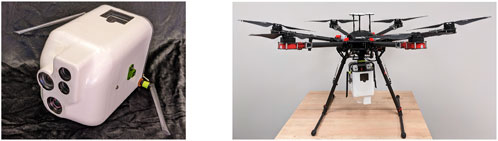
Figure 4. Side view of RiOS's mass- and shape-optimized UAV sensing payload, version 2 and its airframe mounting configuration. Antennas are shown stowed and point directly outwards during flight.
2.3 Field ground station
A ground station provides the interface between the UAV payload and any ground-based field computers that may be used for live processing and visualization. It also provides centralized data recording and pre-processing of downlinked data. It consists of a waterproof hard case containing a modified high-power commercial WiFi router, breakouts to an external power source and external antennas, and a small embedded computer. This router bridges two network segments: a wireless side communicating with the UAV payload, and a wired network to which the small embedded computer is connected along with an additional port for any desired number of field computers. Typically, at least one laptop would be in use to view a live preview of collected imagery and to generate approximate PIV flow measurements from this to guide operational decision-making and the UAV flight path. For simplicity and compactness, the internal computer selected was another Odroid XU4 identical to that in the payload, however arbitrarily more powerful computing could be used, up to the limits of available electrical power and thermal cooling capacity. In its present use, this computer offers a central point of continuous logging of downlinked data and an optional data relay function so that only one copy of any data needs to be wirelessly downlinked for any number of attached field computers.
Attached to the ground station are two RadioLabs dual-band 2.4 GHz/5 GHz WiFi directional patch antennas with 12 dBi peak gain, each with a 35° beam half-width at 0 dBi along both the horizontal and vertical axes. These are placed on portable tripods near the ground station and each is attached with two coaxial cables, providing an overall 4 × 4 multiple-input/multiple-output (MIMO) configuration–that is, four simultaneous input channels and four simultaneous output channels–for improved transfer bandwidth and signal sensitivity.
The assembled device with attached antennas as typically used in the field is shown in Figure 5A.
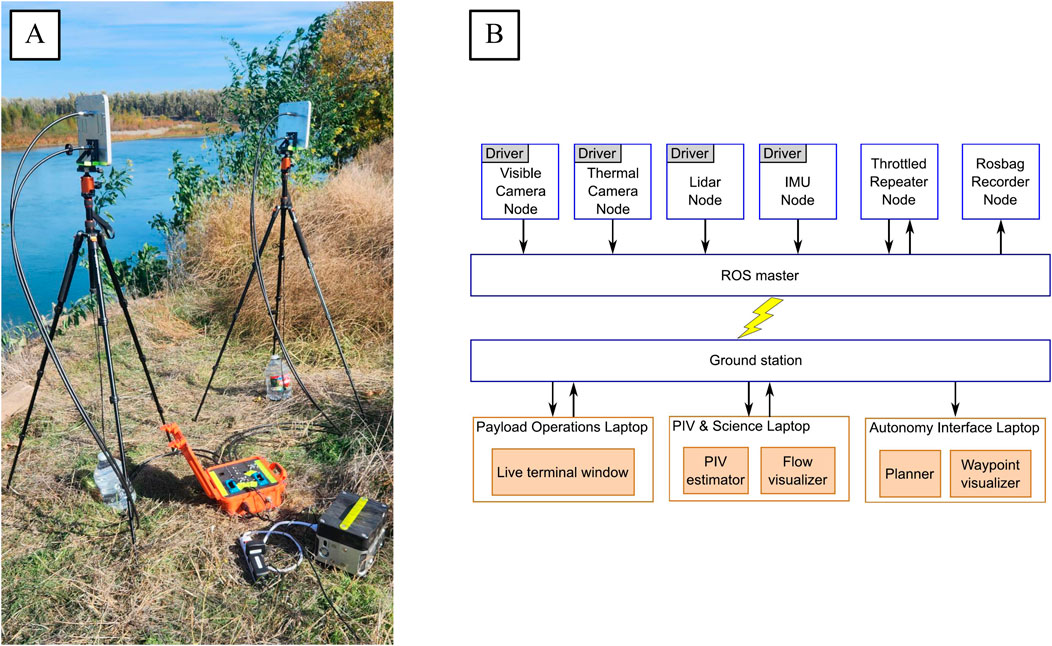
Figure 5. Deployed ground station (A) and payload to ground communication architecture (B).
3 Methods
The sensor hardware payload and its contents were subjected to a progressive sequence of validation and evaluation during development, consisting of characterization, integrated bench testing, flight airworthiness trials, and first tests of field science data collection.
In conjunction with this, a complementary simulation environment was developed to act as a digital twin for purposes such as mission planning and visualization, aircraft motion planning and decision-making algorithm development, and studying varying scenario parameters or introducing varied sensor uncertainties or anomalies.
3.1 Pre-flight payload testing
Prior to any flight use, payload components underwent several straightforward but critical assessment steps. After adjusting and securing lens focus and aperture settings, intrinsic camera calibration parameters (precisely quantifying focal length, center of projection, and lens distortion coefficients) were computed using the OpenCV toolkit (Bradski, 2000) from collected image sequences of varying angles of a checkerboard-patterned target. These parameters are required for accurate simulation modeling, image rectification, and for any purposes requiring translation of image coordinates and physical metric distances, including flow estimation. As this needed to be performed for both the visible and thermal cameras, a suitable target providing adequate contrast (sharply spatially varying temperature) between sections of the pattern was required. Some solutions have been previously proposed for this nontrivial problem (Liu et al., 2018), but the most robust and expedient was to use a commercially available target obtained from the company calib.io2 consisting of high contrast alternating black squares printed on a low thermal conductivity and high thermal capacity substrate. To create the thermal difference between black and white squares, the target had to be exposed to direct sunlight for several minutes before calibration.
A number of custom wire harnesses of precise lengths and having particular endpoint connector types were needed for interconnection between components, and these were completed and inspected to the NASA-STD-8739.4 (NASA, 2016) agency standard, with soldering performed to the IPC J-STD-001/S (IPC, 2020) industry standard. Although not strictly required, this streamlined organizational approval processes and served to avoid any potential re-inspections during flight validation. Joint component electrical compatibility and overall power load testing were then performed as part of a burn-in test campaign, in which the payload was left to run for extended durations in different modes. This verified properties such as a lack of signal interference between components, adequate power availability for each, system software stability, and thermal performance demonstrating adequate cooling. Finally, overall mechanical integrity of the payload was checked by ensuring the tightness of all fasteners and the presence of anti-loosening measures (such as a threadlocker, lock washer, or locknut), repeating overall weight measurements, and confirming the center of mass lay near the geometric center of the horizontal plane to prevent vehicle imbalance during flight.
3.2 Software processing
At its core, the software architecture of the payload is designed to maximize onboard data collection while providing a reduced wireless downlink for live preview and approximate flow estimation. For implementation simplicity, modularity, and future maintainability, the onboard software is constructed as a collection of task-isolated ROS nodes with associated ROS topics and sensor hardware drivers. A ROS node is a small software process within the ROS framework, while a ROS topic is a communication data stream that can be broadcast to any other ROS-enabled device on the same network. Each connected sensor utilizes a ROS node, which wraps a lower-level device-specific software driver interfacing directly with the respective hardware component and broadcasts a data stream on a correspondingly named ROS topic. A logging ROS node is used to accumulate all data streams into a single ROS bag file for each flight for later laboratory study offline. A separate ROS “throttle” node was run to receive and rebroadcast the higher-rate sensor data streams at a lower rate, e.g. dropping image frames, for wireless downlink. A single ROS launch script is used to activate and stop all nodes, which in turn is executed by a top-level startup script that also records several measures of system health telemetry such as internal temperatures, wireless signal strength, and (on the version-1 payload) power system telemetry. For the ground side, the ground station’s embedded computer subscribes to the “throttle” node’s data streams. A bridge service transfers these to a separate locally-running ROS network so that any field computer may in turn subscribe without duplication over the limited-bandwidth wireless link. This overall architecture is summarized in the top portion of Figure 5B.
This onboard data recording alone is sufficient if execution of purely exhaustive or pre-specified flight paths and offline flow estimation are adequate, but live ground-side processing was implemented to demonstrate realtime flow estimation and adaptive flight path decision making. Whether live or offline, the essential process of PIV consists of comparing two images
For live vehicle motion decision making, the “pre-planned” and “adaptive-time” planning strategies developed in simulation and detailed in Section 3.4.5 were tested and compared, which respectively optimize the PIV observation location sequence and adaptively adjust the time spent dwelling at each location, both with the goal of minimizing the mission time required to cover a given area.
3.3 Field flight trials
An iterative test campaign spanning over 4 years has been so far undertaken to validate the functionality and performance of the UAV payload, consisting of shake-down tests at local open field sites near the University of California at Santa Cruz (UCSC) and University of California at Berkeley, plus four annual data collections at a high science interest site near Hartley Island on the Sacramento River. First steps required securing site access permissions, which for shake-down tests entailed a permit from the university and for the annual data collections involved coordination with collaborating National Oceanic and Atmospheric Administration (NOAA) scientists simultaneously making use of the site via the property owner, The Nature Conservancy. Federal Aviation Administration (FAA) regulation (U.S. Code of Federal Regulations, 2022) permits licensed pilots to fly within Class G (uncontrolled) airspace up to an above-ground altitude of 400 ft. This was adequate for initial shake-down flights, but an FAA Certificate of Authorization (COA) was procured permitting higher altitudes up to 1,200 ft, as these were desired in later tests to capture views of the entire river breadth. Operations and payload safety were further regulated by the DOI National Uncrewed Systems Office (NUSO) guidelines specifying requirements such as limitations on weather conditions, visual line of sight rules, signal strength minimums, operator certification, and flight crew teaming processes. Key among these are the need to keep the aircraft within view and the use of a two-person minimum flight crew consisting of the operating pilot and a visual observer tasked with “heads-up” monitoring of the aircraft and the surrounding environment and recording of flight logs. Further written Project Aviation Safety Plans (PASPs) approved by respective agencies documented field personnel certifications, aircraft registrations, hazard risk assessments, and emergency procedures. Notice to Airmen (NOTAM) filings were made during periods of flight operations to inform other potential airspace users. The operating pilot had the training and authority to determine if environmental conditions were safe for flight. During all field tests, the weather cooperated, and no tests were canceled due to adverse conditions such as rain or strong wind. The pilot also designated clearly marked takeoff and landing areas, free of vegetation or other obstacles and at a safe distance from ground personnel.
For the four campaigns on the Sacramento River, data were collected from a series of pre-determined, manually selected waypoints corresponding to equally-spaced river cross sections of interest. These waypoints were chosen to capture potential key features of the river’s hydrodynamics and flow conditions. For these flights, up to three ground-side computers were used. For initial trials, only a single computer was needed, running a live command-line terminal window connected over the wireless link to the payload through which commands to execute the ROS launch scripts could be issued, data logging could be selectively activated to reserve disk space for only relevant flight segments, and measures of live system health could be observed. Live image stream viewers subscribing to either the visible or thermal camera ROS topics provided situational awareness and were available to the UAV pilot when desired. Later flights incorporated an additional laptop running the live PIV estimation software that subscribed to each of the ROS topics and published resultant local flow fields that were also visualized for immediate review. Final flights added a third laptop running the live UAV motion planning software that subscribed to receive these flow fields and IMU data for live position information to determine optimized waypoint sequence and dwell time selections. A waypoint visualizer displayed this information on a satellite map for review and pilot direction. These ground-based computers are depicted in the lower half of Figure 5B and effectively corresponded to personnel roles comprising a payload operator, science data monitor, and autonomy director. This required considerably more equipment and larger teaming than would be expected in future operational use but proved valuable in these earlier stages of iterative system development and evaluation.
Additional specifics of the field test campaign and observations and lessons from these flights are summarized in Section 4.2.
3.4 Simulation architecture
Even though field experiments provide the best real-world data, they are costly in terms of time, travel costs, and wear on the hardware. Additionally, hardware deployment of untested novel algorithms for path planning and navigation poses additional risks. For these reasons, a physics-based simulation was created to facilitate the development and evaluation of new algorithms before their deployment in the field. Development was driven by the requirement of controlled and directed UAV flight over a digital representation of real-world test sites while collecting PIV flow data. This simulation, named RiOS-Sim, is built around the ROS1/Gazebo-classic framework, the core of which is shown in Figure 6.
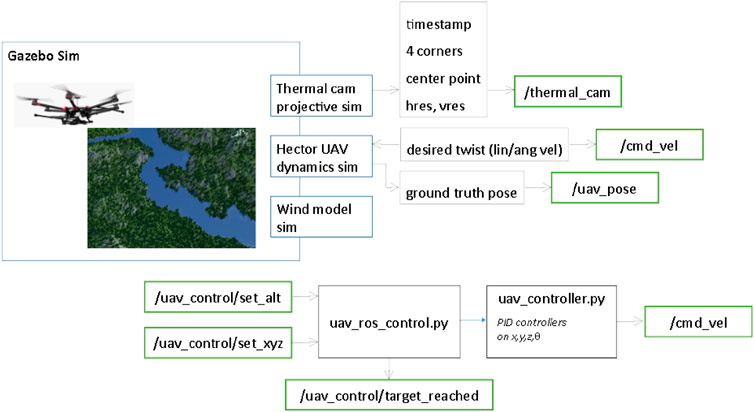
Figure 6. Core simulation hardware architecture.
The main building block of RiOS-Sim is the Gazebo open-source 3D robotics simulator, which provides a physics engine, 3D rendering, and support for sensor simulation and actuator control. Gazebo was chosen for its heritage in several NASA projects, its community support, and its close integration with the ROS ecosystem, which is already in use on the physical payload. Plugins are added to the core simulator to enable specific capabilities, such as UAV dynamics simulation.
A key step of the RiOS concept is the collection of images of the water surface, which are then passed to a PIV workflow to generate estimates of the flow. Recreating this step in RiOS-Sim would require either a realistic river flow simulation, which is outside the core capabilities of Gazebo, or a pipeline for synthetic imagery generation. Given that the core objective of the development of RiOS-Sim is to test UAV navigation algorithms and not to validate the PIV-collection process, it was decided to abstract the image collection and PIV calculation using an external, pre-calculated flow lookup table. In-depth details of this process are provided in Section 3.4.4.
3.4.1 Robot description
The UAV and payload structures are modeled using Gazebo’s Unified Robotics Description Format (URDF), with the aid of Xacro (XML Macros). The kinematic structure and inertial properties are derived from CAD models and real-world mass measurements. Realistic 3D meshes for the UAV and payload are also extracted from CAD, simplified to reduce the polygon count, and converted to the Gazebo-friendly COLLADA format. Collision volumes are simplified using geometric primitives (cylinders for the landing gear and a cube for the payload), since, during nominal operations, contacts with the environment are only expected while on the launch pad.
3.4.2 Terrain model
The terrain is modeled using Digital Elevation Models (DEM), representing either synthetic terrains or real-world locations. Synthetic terrains are used to test specific scenarios or for unit testing of the simulator’s components. DEMs of the RiOS field test site were obtained from USGS, converted to GeoTiff format using gdal (Geospatial Data Abstraction Library), and imported into Gazebo as models. Aerial imagery is used as texturing for the terrain models (Figure 7). Rivers are modeled as static elements and their surface is part of the DEM.
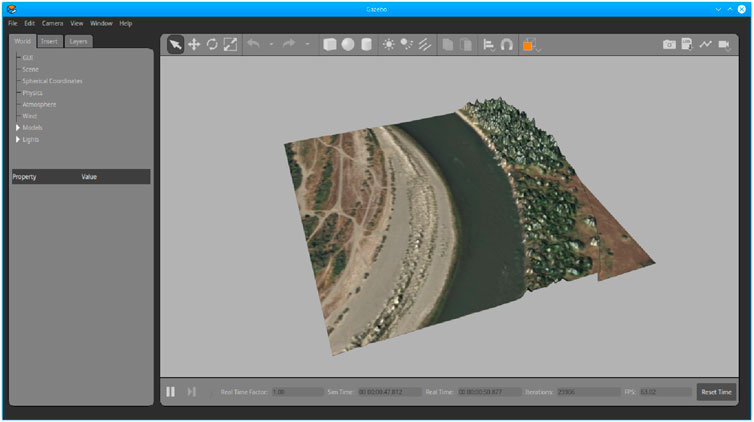
Figure 7. Gazebo’s user interface with a terrain model representing a section of the Sacramento River.
3.4.3 Payload sensors
The modeling of the payload instrumentation takes advantage of Gazebo’s built-in sensors. The internal IMU is modeled with a Gazebo IMU sensor, with added Gaussian noise based on datasheet specifications. The LIDAR altimeter uses a Gazebo ray sensor, with one horizontal sample pointed toward the ground. Noise is added based on datasheet specifications. Since a GPS sensor model is not available in Gazebo, RiOS-Sim uses a modified P3D plugin (https://wiki.ros.org/gazebo_ros_pkgs) to get ground truth 3D pose information. Gaussian noise is added to this reading to simulate position uncertainty of our payload’s commercial-grade Vectornav GPS receiver. The output coordinates of the modified P3D plugin, in local Gazebo World coordinates, are converted to a Vectornav Ins message containing the current latitude, longitude, and altitude. Cameras are added to the payload model but at this stage of the project are only used for visual feedback/debugging. The visible camera is modeled with a Gazebo camera sensor and appropriate distortion model coefficients calculated from physical camera geometric calibration. Gazebo does not have a built-in thermal camera sensor. The implementation of a dedicated infrared sensor plugin was considered but discarded early on, given the project’s choice to use flow lookup tables to abstract the PIV process in RiOS-Sim. The thermal camera is therefore also modeled as a normal visible-light camera.
3.4.4 River flow and PIV collection
In the ideal scenario, a simulator should simulate all the steps of a given process. In the case of RiOS-Sim, this would mean taking images of a time-evolving simulated river surface. However, flow modeling simulation is outside the basic capabilities of Gazebo. While there have been some interesting efforts to implement fluid dynamics in Gazebo [for instance Angelidis et al. (2022), Bingham et al. (2019)], their level of realism was deemed insufficient to produce valid aerial images that could be used in a PIV workflow. Some other approaches such as synthetic flow image generation have been considered for future work.
RiOS-Sim abstracts the PIV workflow through specific requests to external, pre-computed flow lookup tables, as shown in Figure 8. The framework necessary to mock PIV measurements at a specific location is composed of the following components:
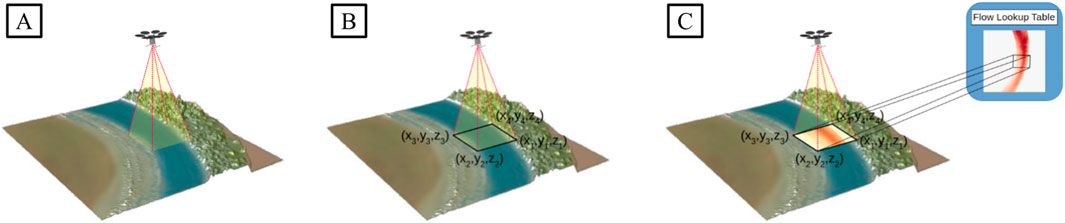
Figure 8. Simulated hovering over a river surface (A). Ground coordinates of the imaged area are computed by the GroundLocator plugin (B), which are used by the Flow Parser Script to look up flow vectors from the external Flow Lookup Table (C).
The GroundLocator plugin is a custom Gazebo Model plugin used to identify the current area of interest. It uses a Gazebo ray shape sensor to project the current camera FOV (viewing frustum) onto the ground and extract the four corners of such footprint. The coordinates of these four corners, along with the camera’s field of view and resolution, are packaged and published as a custom/camera/ground_pose ROS topic.
The Flow Lookup Table is a pre-computed comma-separated values (CSV) file containing flow information at discretized locations, i.e., each row containing (x, y, flow_x, flow_y, magnitude) values. Given the essentially planar nature of rivers considered in this work, the z coordinate is ignored. Data in the Flow Lookup Table can either be synthetically generated, for instance, using a River Flow Simulator such as iRIC Software (Shimizu et al., 2020), or the output of a PIV workflow applied to previously collected real-world data.
The Flow Parser Script loads the data from a user-defined Flow Lookup Table and then listens for new/camera/ground_pose topics. When a new topic is received, the script creates a polygon using the four new corner coordinates and then extracts all the flow data points within the polygon using Matplotlib’s mpath module. These data points are further clustered and averaged according to user-defined PIV parameters such as the desired interrogation area and output vector spacing. The resulting values of this operation are then published as a custom/flow_data ROS topic, containing (x, y, flow_x, flow_y, magnitude) values for each calculated flow vector.
3.4.5 UAV flight control
RiOS-Sim,s UAV flight controller has several levels of abstraction. The low-level controller takes advantage of the mature hector-quadrotor package (Meyer et al., 2012), which was adapted to correctly model the properties of the current UAV used in the RiOS project. Hector-quadrotor is controlled via ROS Twist topics. A mid-level waypoint UAV controller enables reaching user-defined positions and orientations, which can be in world or UAV-relative coordinates. This waypoint controller modulates the linear x, y, and z components and the angular z component (yaw) of the Twist topic using four separate PID controllers. The parameters of these PID controllers are optimized to match the specifications and performance of the physical UAV. A waypoint tasker manages a complete flight plan, commanding the UAV to visit several waypoints and adjusting the dwell time at each destination based on science data collection. Finally, a high-level planner allows for the design of different flight plans based on the UAV’s payload sensor’s output, outlined in Section 3.4.3, and desired performance metrics. The general data flow between each of these abstraction layers can be seen in Figure 9. Three planners were developed and evaluated within our simulation environment which we labeled as pre-planned, adaptive-data, adaptive-time.

Figure 9. Basic data flow diagram between simulation levels of abstraction.
The pre-planned planner is a basic planner where all aspects of the UAV flight plan are computed prior to the start of a flight. This includes the waypoints that will be visited and in what order, as well as the time to dwell during data captures. This planner is used as the baseline for comparing our other two planners, as it most closely simulates a typical non-automated UAV flight during a normal field trial.
The adaptive-data planner tries to maximize the quality of the data gathered at each waypoint based on a user-set threshold. At each visited waypoint, the UAV gathers one data sample and then estimates how many more samples are needed to drive the standard error of the mean below a defined threshold. This allows the planner to adapt to increases in sensor noise, such as noise induced by environmental conditions. However, total flight time may increase compared to the pre-planned planner.
The adaptive-time planner uses a Markov Decision Process (MDP) to try and balance flight times with data quality. At each waypoint, a single data point is taken. This is compared to an a priori estimation of the expected flow and total allowed flight time to visit every waypoint. The MDP will then select an action to either collect more data or move to the next waypoint. The expected behavior is a trade-off between the quality of data and meeting the total flight time requirement. There is no guarantee that all waypoints will be visited if the planner commands longer dwell times.
4 Results
Through the process of both pre-flight and field flight trials, extensive data and numerous qualitative observations were collected and studied to validate the sensor payload design, assess its performance at the task of flow rate estimation, and accumulate feedback useful to the further evolution of the system and operations plans. Parallel simulation validation has demonstrated the fundamental usefulness of such a digital twin for the purpose of mission planning and algorithmic development of vehicle motion planning strategies.
4.1 Pre-flight validation
During the pre-flight validation, a thermal flat-field correction was performed by averaging image sequences (to eliminate noise) of a blank surface with consistent temperature, as a ratio over the overall mean pixel value, repeated under several different ambient temperature conditions to generate a correction factor for each pixel valid across the expected typical ambient operating temperature range. This improves the performance of the PIV algorithm by ensuring that the section of the observed river does not depend on its position within the image. Unlike the Non-Uniformity Correction (NUC) commonly performed by uncooled thermal cameras during operation to adjust for minor detector drifts, this flat-field correction was performed only once during pre-flight validation. The selected actively cooled Mirage 640 camera does not perform NUC. Characterization of IMU performance was completed through observation of noise magnitudes and bias drift rates of each axis while stationary, roughly validating these against published device specifications. The extrinsic calibration (describing relative translational and rotational offsets) between the IMU and each camera respectively is nominally known from the CAD model of the payload but is further optimized by applying the Kalibr toolkit (Rehder et al., 2016). This is important for any tasks such as using IMU-reported displacements to stabilize camera imagery during vehicle motion.
Electrically, the real-world power requirements of each sensor were individually verified to lie within vendor specifications. The operation of the custom-built power system was also assessed through artificial load testing under nominal and overload conditions, confirming its proper behavior under all circumstances, that it reliably transferred load between one or both batteries and an external power source, that no overheating occurred, and that reported power consumption telemetry was accurate.
Similar integrated testing took place to validate wireless communications functionality between the payload and ground station, via an indoor dry run of typical field operations, to ensure a consistent wireless link and data transfer. As this cannot evaluate operation at the expected distances between the two sides, further outdoor testing took place at varied distances, confirming adequate signal strength to at least a range of 250 m.
4.2 Field trial performance
A summary of the two shake-down tests and four science data collection tests comprising the overall field test campaign described earlier in Section 3.3 is given in Table 1. Overall, these tests spanned 65 flights totaling in excess of 14 h of in-air time and exercised progressively more complex features of the RiOS payloads.
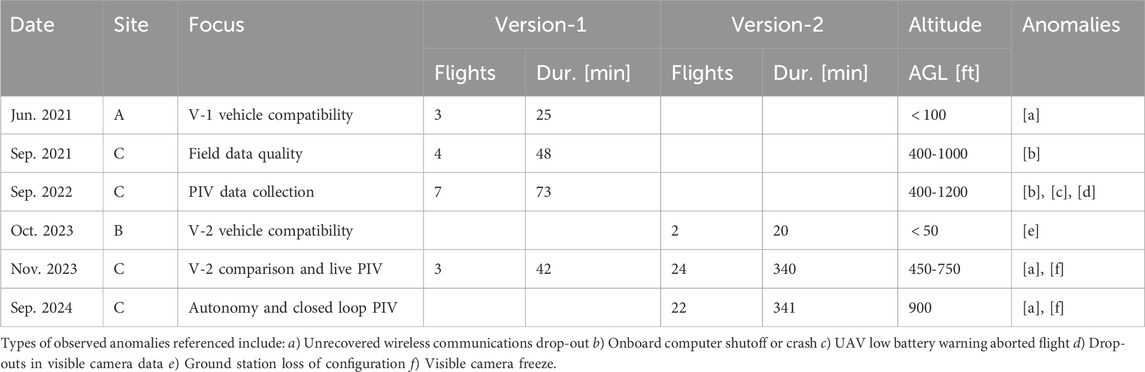
Table 1. Summary of field test campaign flights with RiOS payloads at sites A (UCSC), B (Berkeley), and C (Sacramento River).
The first shake-down testing of the version-1 payload at UCSC consisted of a small number of flights at relatively safer low altitudes over land and was primarily intended to confirm the structural integrity of the payload and mounting hardware, its essential electrical and software functions, and the performance handling characteristics of the UAV with it attached. This also served as an opportunity to develop and exercise equipment setup and flight operations processes. Though near the high end of the carrying capacity of the M600 vehicle, smooth flying remained possible albeit with some vulnerability to wind buffeting. Over the course of these flights, poor performance and unreliability of WiFi communications were observed. This was rectified in later field tests by replacing what was at the time a single ground-side patch antenna (providing 2 × 2 MIMO) attached to a transceiver identical to that in the UAV with instead two patch antennas (providing 4 × 4 MIMO) attached to the commercial router previously described.
With the essential safety and function of the payload confirmed, the next test comprised of a series of longer flights over the Sacramento River was more ambitious and explored significantly higher altitudes. Predominantly an opportunity to evaluate data quality in a realistic relevant environment, varied imagery was collected at diverse locations and altitudes for later study to prove that PIV flow estimation is possible with this sensor suite and to determine most appropriate future flight parameters. This field test was repeated the following year at the same location, focusing this time on science-relevant data collection to validate this overall remote sensing concept against existing manual processes and to better explore spatiotemporal flow variations at this particular site.
The next year following the completion of the version-2 payload saw a brief shakedown test at the Berkeley field site, essentially repeating the testing performed previously for version-1. Vehicle and payload performed as expected, except for a briefly serious but readily corrected anomaly causing loss of software configuration of the ground station due to inadequately precise assembly documentation. The next month, a third data collection over the Sacramento River made more intensive use of this payload in over triple the number of flights and duration, focusing on two primary objectives: evaluating the performance of the upgraded RiOS version-2 payload and achieving live PIV estimation. The payload exceeded expectations in nearly every aspect, with its lighter and more aerodynamic design enabling longer and more stable flights. The elimination of live battery monitoring necessitated a more careful assessment of battery status between flights by field test personnel. On the other hand, the addition of the new quick-release attachment greatly streamlined operations, making it easy to connect and disconnect the payload from the UAV, which in turn reduced setup time in the morning and packing time at the end of the day. This efficiency proved invaluable during multi-day testing sessions. Live PIV flow computation was performed on a ground-based laptop processing a reduced-framerate thermal image stream transmitted over the constrained wireless downlink. Full-framerate imagery continued to be logged onboard the payload for later more precise study, which for these tests centered on various noise and stability characteristics of the resultant estimates. Quantitative analyses are summarized in (Kinzel et al., 2024), an important highlight of which is that there was very good consistency in estimates taken over successive days over river segments predicted to have consistent flow.
The fourth and most recent field test over the Sacramento River continued intensive use of the version-2 payload, extending to even longer average flight times given growing comfort in its use. Quantitative analyses of live PIV estimation for the fourth field test are reported in Legleiter et al. (2024). This test marked the first demonstration of fully closed-loop autonomy for PIV flow estimation and vehicle control. As live flow estimates were computed, the decision-making strategies previously developed in simulation to either optimize waypoint sequences for most efficient coverage or adaptively adjust dwell time were evaluated for their practical efficacy in maximizing the value of data return in minimum time. For safety and regulatory simplicity, the final autonomy segment between decision making and vehicle command issuance was implemented by verbally communicating machine-generated waypoint selections to the human pilot who technically retained full control at all times. This hybrid process proved to be smooth and allowed demonstration of autonomy with minimum risk. Two key resultant autonomy examples included slight reduction in overall path lengths of even exhaustive river coverage patterns over human-selected waypoint sequences and a deliberate reduction in observation dwell times at locations for which estimates indicated similar data distributions to prior datasets. Figure 10 shows the UAV during a test flight and the live data view on the ground. Combined, we conclude that these tests strongly validate the sensor payload design for river flow monitoring and the value of both a priori and sensor-directed autonomy for 2D mapping of surface velocity distributions along river reaches.
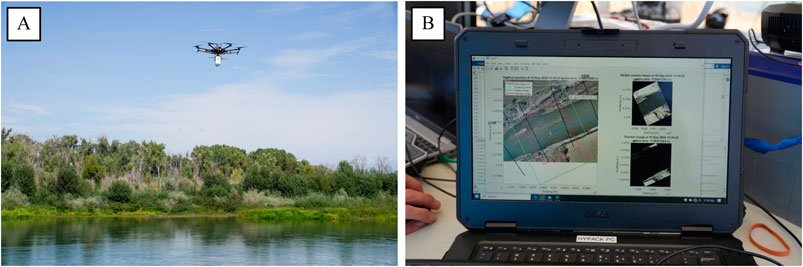
Figure 10. RiOS version-2 payload in flight over the Sacramento River (A) and the live visualization interface showing the current viewpoint over the river with visible and thermal video previews (B).
In all flight tests, the M600 vehicle performed reliably, with only one case of an emergency abort due to an unexpected rapid drop in battery level and two flights requiring conservative evasive maneuvers due to incursion by other aircraft into visible flight range. Anecdotally, pilots reported minor wind buffeting due to the surface area of the version-1 payload and nearly none with version-2, with little to no difficulty in maneuverability despite slim payload mass margins.
With few exceptions, onboard sensors performed as designed throughout flight tests, and the small number of operational anomalies recorded in Table 1 required only restarting the recording software or on rare occasions power-cycling the payload. Occasional adjustments in frame exposure time for the visible-light camera were performed to maintain consistent brightness of images throughout each day while avoiding activating built-in auto-exposure that would have resulted in unpredictable brightness variability. Similar adjustments were not required for the thermal camera. The onboard LIDAR reported highly consistent values for each given flight altitude that aligned well with approximate water surface height, indicating reflections were indeed occurring from the surface as expected. Some measurement drop-outs did occur, particularly when the vehicle was oriented at highly oblique angles relative to the water surface or during brief periods of rapid maneuvering, as well as during moments of significant sun glint (specularity) off the water surface. However as only a single distance value is required at each observation waypoint, ample distance samples were available at each and were easily averaged for further noise reduction and outlier elimination.
Typical overall payload power consumption as measured by the instrumented power distribution system incorporated in the version-1 payload was 32 W during flight and data recording, and 25 W during idle periods. With a pair of 49 Wh batteries, this permits approximately 2.5 h of runtime before requiring replacement, such that only one such swap may be needed during a full day of data collection. Though less precisely instrumented, bench measurements indicate similar power consumption for the version-2 payload, and the two 62 Wh batteries used in this design provide slightly longer runtime, albeit without the convenience of hot-swapping. During the course of all flight testing, only one anomaly occurred at one early point at which the version-1 power system channel for the embedded computer tripped its over-current protection, which was quickly identified as being caused by higher than expected power draw by the WiFi transceiver. This was addressed in future flights by integrating a miniature USB hub, itself powered by a separate power system channel, to which the WiFi transceiver was instead attached.
Wireless connectivity was a constant point of attention throughout these field tests, with naturally insatiable demand for bandwidth and range. Specific characterization flights were undertaken during the 2023 test campaign to evaluate performance and its influences. As summarized in Figure 11, the primary factor affecting signal strength was observed to be the relative angle of the vehicle with respect to the antennas at the ground site. This behavior arises from the use of two monopole antennas on the payload, each having a toroidal beam pattern with a relative dead zone face-on to the long axis of the antenna nominally oriented so as to be parallel to the ground. Consequently, maintaining specific vehicle heading orientations during data collection was identified as critical, as it allowed the ground station to more consistently view the antennas edge-on, where the signal strength is the highest. A directional gimbaled antenna would avoid this but contribute significant mass and complexity, while alternative antenna mounting configurations may reduce but not completely eliminate such dead zones and could not be easily iteratively evaluated without significant internal structural changes to the payload. Signal strength falloff due to range in open air was a much less significant effect up to the maximum operational distance of roughly 1 km required for these field tests. As effective line of sight operation is likely lost beyond this range, this indicates that the selection of commercial WiFi as the communication medium appears to be an entirely appropriate and expedient choice for this application.
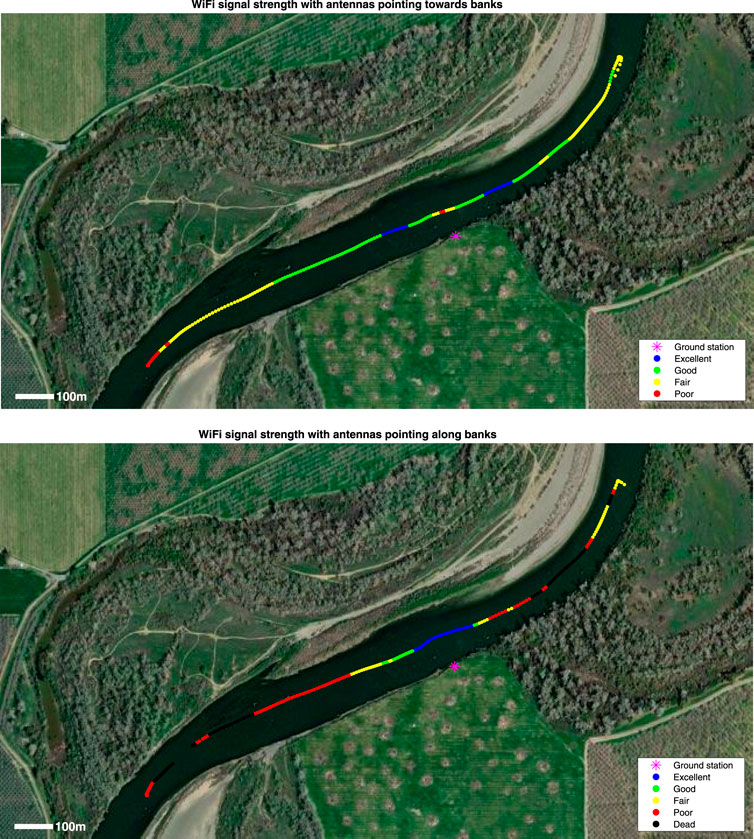
Figure 11. Geographic visualizations from the September 2023 field test showing the angular dependence of wireless signal strength during operation with payload monopole antenna tips pointed both cross-stream, towards banks, and stream-wise, parallel to the river.
Onboard data logging functioned reliably during all flight tests except one, where the Odroid computer crashed. Ground operators remotely monitored the logging process and ensured sufficient remaining disk space throughout the flights. Recording data rates were variously adjusted over the course of these field tests, initially starting near practical maximums for the flash memory of the onboard computer and in later tests reducing to approximately 4 Hz for images, 2 Hz for LIDAR range, and 100 Hz for IMU data. This was determined to be adequate for PIV flow estimation and results in data rates below 25 MB/s. With approximately 100 GB of available onboard storage, this fits just over an hour of flight data, or around 5 flights. This was observed to align well with typical flight operations, with strategic pauses around such intervals, and in future use would probably encompass a complete dataset for most field sites. The primary observed weakness was a data offload rate of approximately 35 MB/s, which was limited by the data bus speed of the onboard computer.
4.3 Simulation results
Our simulation environment was built to enable the development of UAV mission planners with increased levels of autonomy. Three metrics were used to evaluate each planner's performance: the Mean Squared Error (MSE) of the observed data, the flight time during data gathering, and the percent coverage of the observable data. The evaluation metrics of percent coverage and MSE were compared against the non-noisy observable flow data (ground-truth) while the flight time metric is the relative time difference between each run. Each planner was simulated 10 times to account for run-to-run variance, and the same observable flow data was used with realistic noise injected to simulate sensor and environmental working conditions. What will be shown in the next sub-sections is that the adaptive-data and adaptive-time planners will increase the quality of the data gathered by lowering the MSE by
4.3.1 Metric 1: mean squared error
The Mean Squared Error (MSE) represents the amount of error in a run's data gathering compared to the ground-truth flow data. The basic formula for calculating the MSE is given in Equation 1 as
where
As outlined in Section 3.4.5, each planner was designed around gathering quality data under different conditions. The pre-planned planner had a fixed dwell time to gather data at each waypoint, which was selected as 5 s for each simulation run. Note that this short dwell time was selected to obtain large spatial coverage for 2D surface velocity distribution mapping and is not representative of standard discharge gaging measurement time. The two adaptive planners could increase their dwell time depending on the estimated efficacy of the data being collected. The adaptive-data planner had no limits on the time needed to complete observing all the waypoints. This allowed the UAV to dwell longer at each waypoint during data collection, lowering observation error due to noise. The more interesting planner is the adaptive-time planner. This planner tried to increase the dwell time at each waypoint to decrease the observation error, but did so without breaching flight time limit. Figure 12 shows the plots of the MSE for each planner’s 10 simulation runs. One can see that there is an improvement in the quality of the data gathered as the needed dwell time increases between each planner. However, below we will show that the adaptive-data planner would routinely be the slowest planner and may exceed a mission’s total flight time.
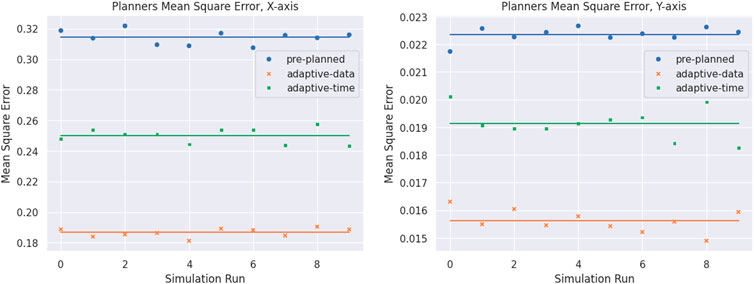
Figure 12. The Mean Square Error of the three planners for each simulation run along the X-axis and Y-axis. The UAV is typically oriented so that the detected water flow magnitude is pointing in the X direction, resulting in higher MSE for the X-axis.
4.3.2 Metric 2: flight time
The flight time metric is a comparative value between each of the planners and a base achievable time. This is the total time from take-off to landing. Since the waypoints used for all simulation runs were consistent, the flight times to the first waypoint and from the last back to the base station were typically consistent. However, the authors kept the comparison to total flight time so that any user error in timing would not be induced. While these simulation runs allow the UAV to operate for its best-case scenario flight time of 30 min, a simulation result is however deemed achievable only if the total flight time remains within a safer and more conservative 10 min threshold. If a simulation flight exceeded this achievable time, then the simulation was deemed marginal. The flight time results are shown in Table 2. It is clear that the adaptive-data planner exceeded the achievable time for all simulation runs and the adaptive-time planner was able to keep the total flight time within the planner condition of 10 min.
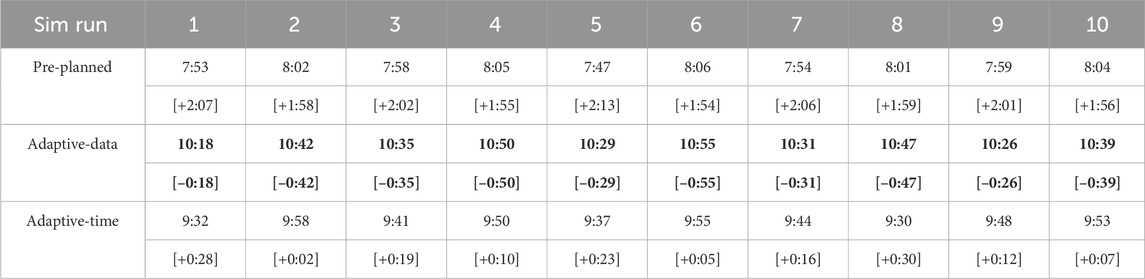
Table 2. Flight times [min:sec] for all simulation runs. Each time is then shown with a time difference from the base achievable time of 10 min. Times in bold are deemed marginal for achieving acceptable flight times.
4.3.3 Metric 3: percent coverage
The percent coverage is the amount of the observable flow data that a planner collected data from. For all three planners, waypoints were selected that would achieve near 90% coverage of the observable data. This means all planners should achieve near full coverage of the observable data during each run. If a planner fails to get within 90%, it is marked as a failure. Table 3 shows the percent coverage for all runs and shows that at least 90% coverage was met by every run.
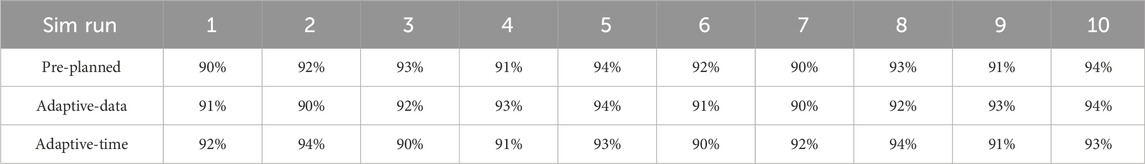
Table 3. Percent coverage of the observable flow data. This verifies that all runs visited all waypoints and gather appropriate data.
5 Discussion
By applying experience from field use of the initial version-1 RiOS payload, an optimized version-2 payload providing a 52% reduction in volume and 22% reduction in mass was developed and extensively field tested. Looking forward to further iteration, an ideal version-3 is likely to incorporate a slightly less simplified power system than the version-2 design, as though the much reduced size and complexity has proven valuable, restoring battery hot-swapping and more precise estimation of remaining battery life would further streamline field use. Naturally, component cost reduction is another avenue of valuable exploration, particularly focusing on the thermal camera currently constituting the majority of payload cost. Earlier mentioned existing work suggests that water surface flow rates can be observed by much less sensitive cameras or radars under some circumstances, albeit not nearly to the same fidelity, and these merit further study.
This is counterbalanced by the potential value that even higher resolution or more sensitive cameras might offer in allowing higher-altitude operation with fewer required dwell locations and hence shorter mission times. As this may drastically escalate payload cost, required airframe size, and regulatory permissions for operations, such designs would represent a significant departure from the intended goals of an accessible, highly-portable, and rapidly-launched system. While we believe the latter regime to be the most valuable midpoint between satellite remote sensing and ground-based sensing, further study of design tradeoffs and customer scientists’ needs remains worthwhile.
The size and weight of the current payload make it challenging to integrate with a gimbal mount, increasing its susceptibility to vibrations and changes in orientation during flight. While IMU-based image stabilization can mitigate the effects of small pose changes, the absence of a gimbal may limit the payload’s performance in extremely windy conditions, where UAV movements are more pronounced. In such conditions, the UAV and payload may need to hover at an angle, invalidating the assumption of nadir (vertically downward) imagery and requiring accurate projection of the images onto the river surface.
Towards operationalization, that is, larger-volume production and use by field scientists who are not necessarily experts in the design of the payload, a number of possible improvements in both payload design and operational process are apparent. Likely design improvements primarily revolve around identifying components such as internal wiring harnesses that presently require tedious assembly to either develop alternatives or procure specialized automated tooling. Similarly, a more rugged mold and better-optimized casting process for the outer shell would build upon the currently hand-shaped molding used for the prototype. Other small improvements in labeling and intuitiveness of interconnections would likewise aid non-experts, as also simply would even more detailed documentation of every aspect of the system.
Thorough exercise of the live data collection process through field trials has offered numerous valuable lessons for future field operations. Chief among these is the importance of a simple but precise set of procedures for setup, teardown, flight preparation, flight execution, and data offloading. Taking cues for instance from flight checklists long used in professional aviation would ensure that no steps are inadvertently skipped and that errors are minimized, while maximizing the pace of their implementation. Relatedly, clearly defined personnel roles for varying potential team sizes will reduce uncertainty and inefficiency in cooperation, while simplifying planning for field outings. Another valuable lesson from field testing is that the time of day of data collection has a significant impact on data quality, specifically that early morning, before the air has heated significantly from overnight temperatures, is most preferable. Analyses of the exact circumstances continue and would likely benefit from testing at more varied field sites and seasons.
Reliable wireless communications with the RiOS payload has consistently been a focus of attention, both due to a desire to monitor the status of its operation and as a necessary dependency for live flow estimation if performed on the ground. The current implementation, built upon commodity WiFi operating near maximum legal power limits and chosen as a balance of expedience and function, has proven largely adequate, as it has typically provided sufficient range to the most distant observation locations reachable within a UAS flight. Nevertheless, as flight durations, data processing ambitions, terrain complexity of field sites, and the desire for consistent turn-key operation continue to increase, further improvements will be needed. One avenue already under consideration is to transition from Transmission Control Protocol (TCP) based data transfer (which incorporates latency-inducing packet acknowledgment and retransmission steps) to a more loss-tolerant mechanism better suited for primarily unidirectional downlink. ROS version 2 provides some such alternatives including the option to use the Data Distribution Service (DDS) middleware, which supports User Datagram Protocol (UDP) for faster, non-reliable transmission where minimal latency is prioritized over guaranteed packet delivery. Another path might be to directly transmit a stream of UDP packets while disabling link-level WiFi packet acknowledgments and including additional forward error correction (FEC) data blocks to allow reconstruction of larger data frames (e.g., images) even in the presence of lost packets, without any need to acknowledge or retransmit packets.
Though difficult to precisely quantify, evidently pointing of the ground antennas having finite beam width towards the payload while in flight is of some importance, yet allocating personnel to this tedious task is undesirable. In principle, the addition of a small two-axis motorized head beneath the antennas would allow continuous accurate pointing without human intervention by computing the relative angle between the known GPS-reported locations of both the ground station and vehicle. We expect to attempt this in the future, though it is not without some complications such as rotational limits and the need to avoid entangling of cables. On the payload side, additional experimentation is merited to evaluate alternative (e.g. orthogonally mounted) antenna arrangements or transceivers having larger numbers of antennas. Finally, completely different non-WiFi radio transceivers optimized for long-range mobile point-to-point communications do exist in several forms commercially and will be further studied for compatibility with SWaP constraints and operational needs.
RiOS-Sim was employed to evaluate two adaptive planners against a pre-planned baseline, eliminating the risk and costs involved with physical UAV or payload testing for arbitrary experimentation. These preliminary results showed the advantage of using a digital twin to extensively test and validate new navigation algorithms before their deployment in real-world conditions. This becomes even more evident as novel and more advanced path-planning and autonomous navigation algorithms are being developed for RiOS. The simulator provides a safe, controlled, and repeatable environment where various scenarios, ranging from ideal conditions to edge cases, can be tested comprehensively, ensuring that potential challenges, obstacles, or algorithmic weaknesses are discovered and mitigated before actual deployment. Additionally, RiOS-Sim can be readily expanded to support multiple concurrent UAVs, facilitating the investigation of multi-robot path-planning approaches and collaborative decision-making strategies for efficient and rapid river flow gaging. As physical field use of multiple UAVs simultaneously is particularly challenging and requires special planning and permissions, developing and thoroughly testing strategies in simulation in advance will immensely streamline approval processes and ensure earlier field success.
Section 3.4.4 discussed RiOS-Sim,s design choice of using pre-computed Flow Lookup Tables. An alternative approach could be to abstract the simulated image collection process, used in conjunction with the mature PIV workflow used with the physical system. For instance, pre-recorded real-world footage from past field tests could be used as input to the PIV algorithm. Given a database of real-world image collections, a classifier could pick the images that most closely represent the current world conditions and UAV state in the simulation. Another option would be the use of an external synthetic flow image generator, such as (Mendes et al., 2020). Environmental and UAV state information (e.g., camera pose) would need to be included as inputs to the image generator. The advantage of this method is that the flow images would match very well with the UAV state in the simulator and could also capture new scenarios that have not been seen before with the hardware payload. The main challenge however would be validating the synthetic image generator against ground truth flow images.
In the current RiOS-Sim implementation, it is possible to update the “river flow” in real time, commanding the Flow Parser Script to load a new Flow Lookup Table. This can be used to simulate a discrete time evolution of the river flow, enabling interesting research scenarios such as planning against seasonal flow variation or sudden flooding. One interesting future research direction could also be the detection and autonomous identification of pollutant sources in aquatic environments. This presents a unique challenge where UAVs could be deployed to not only detect the presence of contaminants but also trace their origin. Leveraging RiOS-Sim in this context could provide immediate value, as it would allow for the testing and validation of path-planning and navigation algorithms specifically designed for this application.
Paired together, the RiOS UAV sensing payload provides a now heavily tested aerial monitoring hardware system for rapid semi-autonomous river flow gaging complemented by RiOS-Sim, a simulation framework that accelerates development and exploratory testing of novel field scenarios and autonomy strategies as a digital twin. Building upon a mix of commercial hardware components, limited custom hardware assemblies, and open source software, these systems have so far been shown to be effective and expedient foundations for fulfilling immediate science data collection needs and exploring future field operational processes. With the long term goal of completely closing the loop to enable fully autonomous, unsupervised river flow monitoring, key areas of ongoing work include refined operationalization of such systems, accessibility to scientist users without requiring aerospace domain expertise, and algorithmic autonomy development for expanded and more complex application environments.
Data availability statement
Publicly available datasets were analyzed in this study. This data can be found here: https://www.sciencebase.gov/catalog/item/65eb1953d34e14033297db7d.
Author contributions
MD: Conceptualization, Data curation, Formal Analysis, Funding acquisition, Investigation, Methodology, Software, Visualization, Writing–original draft, Writing–review and editing. MV: Data curation, Formal Analysis, Investigation, Methodology, Software, Visualization, Writing–original draft, Writing–review and editing. JB: Data curation, Formal Analysis, Investigation, Methodology, Software, Visualization, Writing–original draft, Writing–review and editing. UW: Conceptualization, Data curation, Formal Analysis, Funding acquisition, Investigation, Methodology, Project administration, Resources, Supervision, Validation, Visualization, Writing–original draft, Writing–review and editing.
Funding
The author(s) declare that financial support was received for the research, authorship, and/or publication of this article. This research was initially funded with grant NASA/USGS SAA2-403489-4 from the U.S. Geological Survey National Innovation Center and was subsequently supported by the National Aeronautics and Space Administration’s Advanced Information Systems Technology program through grant NASA-AIST-21-0049.
Acknowledgments
This work was made possible through the supporting technical and operational contributions of Carl Legleiter, Paul Kinzel, Cian Dawson, Christopher Gazoorian, Isaac Anderson, and Elizabeth Hyde of the USGS and Antoine Tardy and Theodore Morse of NASA. We thank Greg Golet and Luis Ojeda of The Nature Conservancy for providing access to the Sacramento River at Hartley Island field site. We appreciate Jonathan Stock of the USGS for his advice and support. Any use of trade, firm, or product names is for descriptive purposes only and does not imply endorsement by the U.S. Government.
Conflict of interest
The authors declare that the research was conducted in the absence of any commercial or financial relationships that could be construed as a potential conflict of interest.
Generative AI statement
The author(s) declare that no Generative AI was used in the creation of this manuscript.
Publisher’s note
All claims expressed in this article are solely those of the authors and do not necessarily represent those of their affiliated organizations, or those of the publisher, the editors and the reviewers. Any product that may be evaluated in this article, or claim that may be made by its manufacturer, is not guaranteed or endorsed by the publisher.
Footnotes
1https://www.vectornav.com/resources/inertial-navigation-primer/theory-of-operation/theory-inertial - Introduction to Inertial Sensors [Accessed: 30 December 2024].
2https://calib.io/- Camera Calibration Boards, Targets and Software by Calib.Io [Accessed: 16 December 2024].
References
Allan, M., Wong, U., Furlong, P. M., Rogg, A., McMichael, S., Welsh, T., et al. (2019). “Planetary rover simulation for lunar exploration missions,” in 2019 IEEE aerospace conference (IEEE), 1–19.
Andrews, L., and Grantham, T. E. (2024). Strategic stream gauging network design for sustainable water management. Nat. Sustain. 7, 714–723. doi:10.1038/s41893-024-01357-z
Angelidis, E., Bender, J., Arreguit, J., Gleim, L., Wang, W., Axenie, C., et al. (2022). “Gazebo fluids: sph-based simulation of fluid interaction with articulated rigid body dynamics,” in IEEE/RSJ international conference on intelligent robots and systems (IROS) (IEEE), 11238–11245.
Attaran, M., and Celik, B. G. (2023). Digital twin: benefits, use cases, challenges, and opportunities. Decis. Anal. J. 6, 100165. doi:10.1016/j.dajour.2023.100165
Biggs, H., Smart, G., Doyle, M., Eickelberg, N., Aberle, J., Randall, M., et al. (2023). Surface velocity to depth-averaged velocity—a review of methods to estimate alpha and remaining challenges. Water 15, 3711. doi:10.3390/w15213711
Biggs, H. J., Smith, B., Detert, M., and Sutton, H. (2022). Surface image velocimetry: aerial tracer particle distribution system and techniques for reducing environmental noise with coloured tracer particles. River Res. Appl. 38, 1192–1198. doi:10.1002/rra.3973
Bingham, B., Agüero, C., McCarrin, M., Klamo, J., Malia, J., Allen, K., et al. (2019). “Toward maritime robotic simulation in Gazebo,” in OCEANS 2019 MTS/IEEE seattle (IEEE), 1–10.
Braca, G. (2008). Stage-discharge relationships in open channels: practices and problems. Trento, Italy: Università degli Studi di Trento, Dipartimento di Ingegneria Civile e Ambientale. Tech. Rep. 11.
Costa, J., Cheng, R., Haeni, F., Melcher, N., Spicer, K., Hayes, E., et al. (2006). Use of radars to monitor stream discharge by noncontact methods. Water Resour. Res. 42. doi:10.1029/2005wr004430
Dalal, K. M., Stucky, T., Kulkarni, C. S., and Welsh, T. M. (2024). “Autonomous ocean world exploration: advancement of a virtual testbed,” in AIAA aviation forum and ASCEND 2024, 4910.
Duan, J. G., Engel, F. L., and Cadogan, A. (2023). Discharge estimation using video recordings from small unoccupied aircraft systems. J. Hydraulic Eng. 149, 04023048. doi:10.1061/jhend8.hyeng-13591
Furrer, F., Burri, M., Achtelik, M., and Siegwart, R. (2016). Rotors—a modular Gazebo MAV simulator framework. Robot Operating Syst. (ROS) Complete Reference 1, 595–625.
Harpold, A., Mostaghimi, S., Vlachos, P. P., Brannan, K., and Dillaha, T. (2006). Stream discharge measurement using a large-scale particle image velocimetry (LSPIV) prototype. Trans. ASABE 49, 1791–1805. doi:10.13031/2013.22300
IPC (2020). Requirements for soldered electrical and electronic assemblies, space and military applications addendum. J-STD-001 Revis. H.
Jain, A. (2020). “DARTS - multibody modeling, simulation and analysis software,” in Multibody dynamics 2019: proceedings of the 9th ECCOMAS thematic conference on multibody dynamics (Springer), 433–441.
Kinzel, P. J., and Legleiter, C. J. (2019). sUAS-based remote sensing of river discharge using thermal particle image velocimetry and bathymetric lidar. Remote Sens. 11, 2317. doi:10.3390/rs11192317
Kinzel, P. J., Legleiter, C. J., and Gazoorian, C. L. (2024). Reach-scale mapping of surface flow velocities from thermal images acquired by an uncrewed aircraft system along the Sacramento River, California, USA. Water 16, 1870. doi:10.3390/w16131870
Koenig, N., and Howard, A. (2004). “Design and use paradigms for Gazebo, an open-source multi-robot simulator,” in IEEE/RSJ international Conference on intelligent Robots and systems (IROS) (IEEE), 3, 2149–2154. doi:10.1109/iros.2004.1389727
Koh, L. P., and Wich, S. A. (2012). Dawn of drone ecology: low-cost autonomous aerial vehicles for conservation. Trop. conservation Sci. 5, 121–132. doi:10.1177/194008291200500202
Lane, J. W., Dawson, C. B., White, E. A., and Fulton, J. W. (2020). “Non-contact measurement of river bathymetry using sUAS radar: recent developments and examples from the northeastern United States,” in Fifth international conference on engineering geophysics (ICEG) (Al Ain, UAE: Society of Exploration Geophysicists), 119–122.
Legleiter, C. J., and Dille, M. (2024). A robot operating system (ROS) package for mapping flow fields in rivers via particle image velocimetry (PIV). SoftwareX 26, 101711. doi:10.1016/j.softx.2024.101711
Legleiter, C. J., Kinzel, P. J., Dille, M., Vespignani, M., Wong, U., Anderson, I., et al. (2024). Mapping river flow from thermal images in approximately real time: proof of concept on the Sacramento River, California, USA. Remote Sensing 16, 4746. doi:10.3390/rs16244746
Legleiter, C. J., and Kinzel, P. J. (2023). The toolbox for river velocimetry using images from aircraft (TRiVIA). River Res. Appl. 39, 1457–1468. doi:10.1002/rra.4147
Liu, R., Zhang, H., and Scherer, S. (2018). Multiple methods of geometric calibration of thermal camera and a method of extracting thermal calibration feature points. Robot. Inst., Carnegie Mellon Univ., Tech. Rep.
Mancini, F., Dubbini, M., Gattelli, M., Stecchi, F., Fabbri, S., and Gabbianelli, G. (2013). Using unmanned aerial vehicles (UAV) for high-resolution reconstruction of topography: the structure from motion approach on coastal environments. Remote Sens. 5, 6880–6898. doi:10.3390/rs5126880
Mendes, L., Bernardino, A., and Ferreira, R. M. (2020). PIV-image-generator: an image generating software package for planar piv and optical flow benchmarking. SoftwareX 12, 100537. doi:10.1016/j.softx.2020.100537
Meyer, J., Sendobry, A., Kohlbrecher, S., Klingauf, U., and Von Stryk, O. (2012). “Comprehensive simulation of quadrotor UAVs using ROS and Gazebo,” in 3rd int. Conf. On simulation, modeling and programming for autonomous robots (SIMPAR) (Springer), 400–411.
Muste, M., Fujita, I., and Hauet, A. (2008). Large-scale particle image velocimetry for measurements in riverine environments. Water Resour. Res. 44. doi:10.1029/2008wr006950
NASA (2016). Workmanship standard for crimping, interconnecting cables, harnesses, and wiring. NASA-STD-8739.4 Version A, change 4.
Nex, F., and Remondino, F. (2014). UAV for 3D mapping applications: a review. Appl. geomatics 6, 1–15. doi:10.1007/s12518-013-0120-x
Niethammer, U., Rothmund, S., Schwaderer, U., Zeman, J., and Joswig, M. (2012). Open source image-processing tools for low-cost UAV-based landslide investigations. Int. Archives Photogrammetry, Remote Sens. Spatial Inf. Sci. 38, 161–166. doi:10.5194/isprsarchives-xxxviii-1-c22-161-2011
Perks, M. T., Russell, A. J., and Large, A. R. (2016). Technical Note: advances in flash flood monitoring using unmanned aerialvehicles (UAVs). Hydrology Earth Syst. Sci. 20, 4005–4015. doi:10.5194/hess-20-4005-2016
Raffel, M., Willert, C. E., Scarano, F., Kähler, C. J., Wereley, S. T., and Kompenhans, J. (2018). Particle image velocimetry: a practical guide. Springer.
Rantz, S. E. (1982). Measurement and computation of streamflow, 2175. Washington, DC: US Department of the Interior, Geological Survey.
Rehder, J., Nikolic, J., Schneider, T., Hinzmann, T., and Siegwart, R. (2016). “Extending Kalibr: calibrating the extrinsics of multiple IMUs and of individual axes,” in IEEE international conference on robotics and automation (ICRA) (IEEE), 4304–4311.
Schweitzer, S. A., and Cowen, E. A. (2021). Instantaneous river-wide water surface velocity field measurements at centimeter scales using infrared quantitative image velocimetry. Water Resour. Res. 57. doi:10.1029/2020wr029279
Shah, S., Dey, D., Lovett, C., and Kapoor, A. (2018). “Airsim: high-fidelity visual and physical simulation for autonomous vehicles,” in Field and service robotics: results of the 11th international conference (Springer), 621–635.
Shimizu, Y., Nelson, J., Arnez Ferrel, K., Asahi, K., Giri, S., Inoue, T., et al. (2020). Advances in computational morphodynamics using the international river interface cooperative (iRIC) software. Earth Surf. Process. Landforms 45, 11–37. doi:10.1002/esp.4653
Keywords: streamflow, remote sensing of rivers, particle image velocimetry (PIV), thermal imaging, small uncrewed aircraft, robot simulation, robot operating system (ROS), planning
Citation: Dille M, Vespignani M, Bruce J and Wong U (2025) Advancing river flow monitoring with small uncrewed aircraft and simulation-driven development. Front. Remote Sens. 6:1520963. doi: 10.3389/frsen.2025.1520963
Received: 31 October 2024; Accepted: 24 January 2025;
Published: 18 March 2025.
Edited by:
John Fulton, United States Geological Survey (USGS), United StatesReviewed by:
Andrea Scozzari, National Research Council (CNR), ItalyMarco Limongiello, University of Salerno, Italy
Hamish Biggs, National Institute of Water and Atmospheric Research (NIWA), New Zealand
Copyright © 2025 Dille, Vespignani, Bruce and Wong. This is an open-access article distributed under the terms of the Creative Commons Attribution License (CC BY). The use, distribution or reproduction in other forums is permitted, provided the original author(s) and the copyright owner(s) are credited and that the original publication in this journal is cited, in accordance with accepted academic practice. No use, distribution or reproduction is permitted which does not comply with these terms.
*Correspondence: Michael Dille, bWRpbGxlM0Bjcy5jbXUuZWR1