 Pranay Panjala
 Murali Krishna Gumma
 Shashi Mesapam
- 1Geospatial and Big Data Sciences, International Crops Research Institute for the Semi-Arid Tropics (ICRISAT), Patancheru, India
- 2Remote Sensing and GIS, Civil Engineering Department, National Institute of Technology, Warangal, India
Efficient monitoring of crop water requirements is crucial for assessing the impacts of major irrigation projects, such as the Kaleshwaram lift irrigation project, both before and after their implementation. These projects can significantly change agricultural practices and water usage patterns, necessitating thorough evaluations to ensure sustainable water management and agricultural resilience. The main aim of this study is to evaluate and compare crop water needs during the winter (rabi) seasons of 2018–2019 and 2022–2023 across the command area of the project. This is achieved by mapping major crops and their respective length of growing periods across the study area using sentinel-2 satellite data and ground data, and quantifying crop water requirements using reference evapotranspiration and FAO crop coefficients. Results reveal a significant shift towards rice cultivation, with an over 80% increase in the winter season of 2022–2023 compared to 2018–2019, indicating substantial escalations in crop water requirements. These findings provide valuable insights into agricultural transformations induced by large-scale irrigation interventions, emphasizing the need for sustainable water management practices to ensure agricultural resilience and resource conservation in similar contexts.
1 Introduction
Agriculture in India’s dryland regions, heavily dependent on rainfed practices, represents a critical sector that contributes significantly to the nation’s food security and rural livelihoods. Approximately 60% of India’s net sown area is rainfed, covering about 68 million hectares (Pratibha et al., 2024; Rao et al., 2015; Sharma et al., 2010). However, the vulnerability of rainfed agriculture to climate variability and water stress necessitates innovative approaches to enhance productivity and resilience (Rockström and Barron, 2007). In states like Telangana, where rainfed agriculture predominates, represents a crucial sector facing unique challenges and opportunities. Telangana, known for its predominantly rainfed agricultural practices, relies heavily on monsoon rainfall to support its agricultural activities (Gumma et al., 2023; Guntukula and Goyari, 2020). Approximately 60% of Telangana cultivated area is rainfed, making it susceptible to climate variability and water scarcity (Telangana State Agriculture Department).
The adoption of irrigation technologies has been pivotal in transforming agricultural landscapes in dryland areas (de Araujo et al., 2021; Kpadonou et al., 2017). Over the years, India has significantly expanded its irrigated area, reaching approximately 70 million hectares (Jain et al., 2019; Sharma et al., 2010). This expansion has led to increased agricultural output and diversified cropping patterns, contributing to improved food security and economic stability in rainfed regions (Rao et al., 2015). The adoption of irrigation technologies has been instrumental in augmenting agricultural productivity and resilience in Telangana. According to the Telangana State Irrigation Development Corporation (TSIDC), the state has made significant strides in irrigation development, with the coverage of irrigated area expanding from 19.88 lakh hectares in 2014 to 24.81 lakh hectares in recent years. This expansion has not only stabilized crop production but has also diversified cropping patterns, leading to improved food security and economic prosperity in rainfed regions.
The Kaleshwaram Lift Irrigation Project (KLIP) in Telangana has had a profound impact on agriculture in the region. By using water from the Godavari river, the project has significantly expanded the irrigation potential, allowing vast areas of farmland previously dependent on erratic rainfall to be brought under consistent irrigation (Venkateshwarlu and Deshpande, 2021). This expansion of cultivable land has not only increased agricultural output but also diversified the types of crops grown (Aizen et al., 2019; Rahman, 2009). Moreover, these type of projects will mitigated the impact of droughts by providing a steady water supply during dry periods, reducing farmers’ vulnerability to climate variability (Gohar and Cashman, 2016).
Satellite-based remote sensing has emerged as a game-changing technology for agricultural monitoring and management (Obi Reddy et al., 2023). The constellation of remote sensing satellites, including Resourcesat, Cartosat, Sentinel-2, Landsat, MODIS, and others, provides valuable data on croplands, growing periods, and land use dynamics (Kumar et al., 2022). These satellites enable accurate mapping of crop types and monitoring of vegetation health, achieving a classification accuracy of over 90% for crop type mapping (Gumma et al., 2022). Such precise information empowers farmers and policymakers to make informed decisions regarding land use planning, water allocation, and crop management strategies (Weiss et al., 2020). Recently, there has been significant interest in utilizing machine-learning algorithms such as Random Forest (RF), Support Vector Machines (SVM), and Artificial Neural Networks (ANN) for classifying satellite data and its derivatives into various crop types (Feng et al., 2019; Gumma et al., 2022; Panjala et al., 2022; Saini and Ghosh, 2018; Sun et al., 2019; Xiong et al., 2017). Additionally, several studies have employed satellite-derived data, such as spectral mixture models (SMTs), to assess land use and land cover (LULC) dynamics in different regions (Teluguntla et al., 2017; Thenkabail et al., 2007). In this context, our study aims to utilize a hybrid model integrating machine learning algorithms and traditional methods to map crop types and estimate the length of growing periods effectively.
Quantifying crop water requirements is fundamental to optimizing water use efficiency in agriculture (Hsiao et al., 2007). The National Commission on Agriculture, Government of India, and Telangana State Department of Irrigation emphasize the adoption of water-saving technologies such as drip and sprinkler irrigation systems to meet crop water demands more effectively (Abhilash et al., 2020). Research suggests that optimizing irrigation scheduling based on crop water requirements can result in water savings of up to 40% while maintaining or even increasing crop yields (Playán and Mateos, 2006). Research studies conducted by the International Crops Research Institute for the Semi-Arid Tropics (ICRISAT) demonstrate the benefits of precise irrigation scheduling based on crop water requirements in improving water productivity and yield stability in rainfed agriculture (Serraj et al., 2003). This underscores the potential for efficient water management practices to enhance agricultural sustainability in rainfed areas (Rost et al., 2009; Sharma et al., 2010). Evapotranspiration (ET) combines evaporation (water loss from soil and water bodies) and transpiration (water loss from plants). Crop water requirements (ETc.) reflect how much water crops need for optimal growth. Remote sensing, like satellite imagery, helps estimate ET ETc by monitoring surface temperatures, vegetation health (using indices like NDVI), and detecting water stress (Gerhards et al., 2019; Khanal et al., 2017; Kundu et al., 2016; Virnodkar et al., 2020). This technology is vital for efficient water management in agriculture.
This study aims to analyse crop types, their growing periods, and quantify water requirements before and after the KLIP in Telangana. It will identify major crops grown in the area, assess their typical growing durations using sentinel-2 satellite data imagery and analyse historical water needs based on factors like evapotranspiration and crop coefficients. Additionally, the study will focus on crop water productivity, measuring the efficiency of water use in relation to crop yield, to provide comprehensive insights into the impact of KLIP on agricultural water management and productivity.
2 Data and methods
2.1 Study area
Telangana, situated in southern India, is the 12th largest state by both geographical area and population. It lies between 15° 46′ and 19° 47′N latitude and 77° 16′and 81° 43′E longitude. The state shares borders with Maharashtra to the North and North-west, Karnataka to the West, Chhattisgarh to the north-east, and Andhra Pradesh to the south and east. Positioned on the Deccan Plateau in a semi-arid zone, Telangana experiences a typical yearly average rainfall of 713 mm, ranging from 700 mm to 1,500 mm annually. The south-west monsoon contributes around 80% of this rainfall, with the remaining 20% from the north-east monsoon (MOSPI, 2016). Telangana has a tropical climate, with slight variations influenced by elevation and maritime factors. Rainfall patterns play a crucial role in determining the cropping patterns followed by farmers in the region.
Telangana exhibits a diverse agricultural profile with crops cultivated during both the kharif (monsoon) and rabi (winter) seasons. In irrigated regions during the kharif season, major crops like paddy (rice), maize, cotton, and soybeans thrive due to the availability of water through irrigation. The rainfed areas witness the cultivation of millets and pulses benefiting from the natural monsoon rainfall. Telangana state is drained with major, medium and minor rivers. Of these, two are major interstate river basins, i.e., Godavari and Krishna. The KLIP in Telangana, India, is the world’s largest multi-stage lift irrigation project. It aims to irrigate about 18.75 lakh hectares of drought-prone land across 13 districts of Telangana. KLIP comprises 7 links, 28 segments, and an extensive canal network covering over 1,800 km. This project aimed to enhance agricultural prospects and water availability in the region, benefiting 118 mandals/blocks as per the Telangana government’s notification (Figure 1).
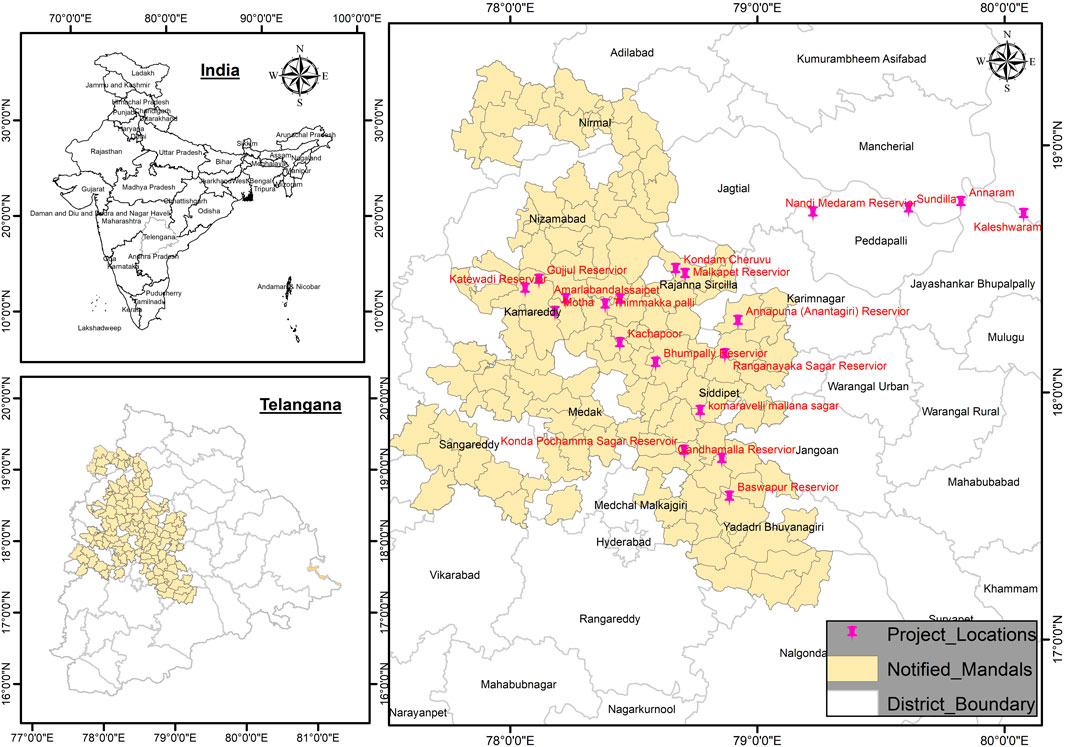
Figure 1. The study area showing the notified blocks of Telangana
2.2 Ground survey data
Ground data were collected in March 2023 from 594 sample points across the study area (Figure 2). The data collection process involved utilizing pre-classified output and Google Earth imagery through the iCrops mobile application (https://maps.icrisat.org/icrops/index.php). Detailed information from specific locations was gathered for training purposes, including class identification and labelling. The collected dataset comprises geographical coordinates, land use categories, percentages of land cover, seasonal cropping patterns (gathered through farmer interviews), crop types, and irrigation methods (irrigated or rainfed).
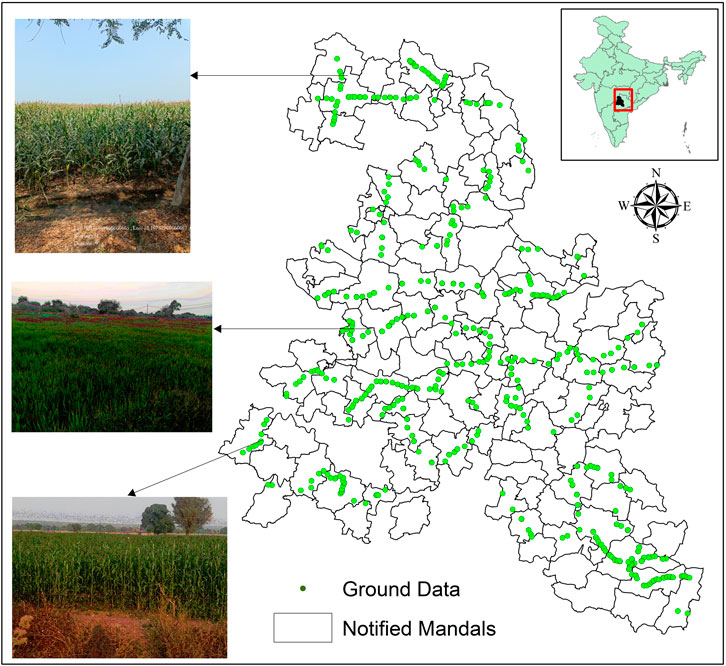
Figure 2. Spatial distribution of ground data collected.
Independent data, not utilized for training, will be employed for accuracy assessment. The ground data encompasses various crop types such as Rice, Maize, Millet, as well as other land use and land cover categories.
2.3 Methodology
2.3.1 Crop type mapping using satellite imagery and ground data
The methodology for crop type mapping employed in this study combines remote sensing techniques in Google Earth Engine (GEE) with traditional ground truthing for accurate classification and labelling (Figure 3). The study utilized Sentinel-2 satellite imagery within the Google Earth Engine platform. Initially, the Normalized Difference Vegetation Index (NDVI) was calculated for each image captured during the winter season spanning from November to May over the years 2018–2019 and 2022–2023. Subsequently, the maximum NDVI value was determined for each month, and these values were stacked to form a composite image comprising seven bands, each representing the monthly maximum NDVI.

Figure 3. Methodology of crop type mapping.
The stacked image was subjected to unsupervised classification, i.e., k-means algorithm, dividing it into clusters, with each cluster representing a unique signature known as a cluster signature. Ground signatures were derived from the stacked imagery using ground truth data collected in the field. The cluster signatures obtained from the unsupervised classification were then compared against the ground signatures and high-resolution imagery from google earth. The best-matched clusters were labelled with corresponding crop class names. Any misclassifications identified were corrected through reclassification of the affected clusters.
This hybrid approach integrates the efficiency and scalability of machine learning in GEE for initial classification with the precision of ground truthing to validate and refine the results, ensuring accurate crop type mapping for the study area.
2.3.2 Mapping of length of growing periods
The methodology involves utilizing Sentinel-2 satellite data within the GEE platform to map the length of growing periods for specific crop types (Figure 4). Initially, the satellite images are processed to create composite images and mask out non-crop pixels, focusing solely on the desired specific crop areas.
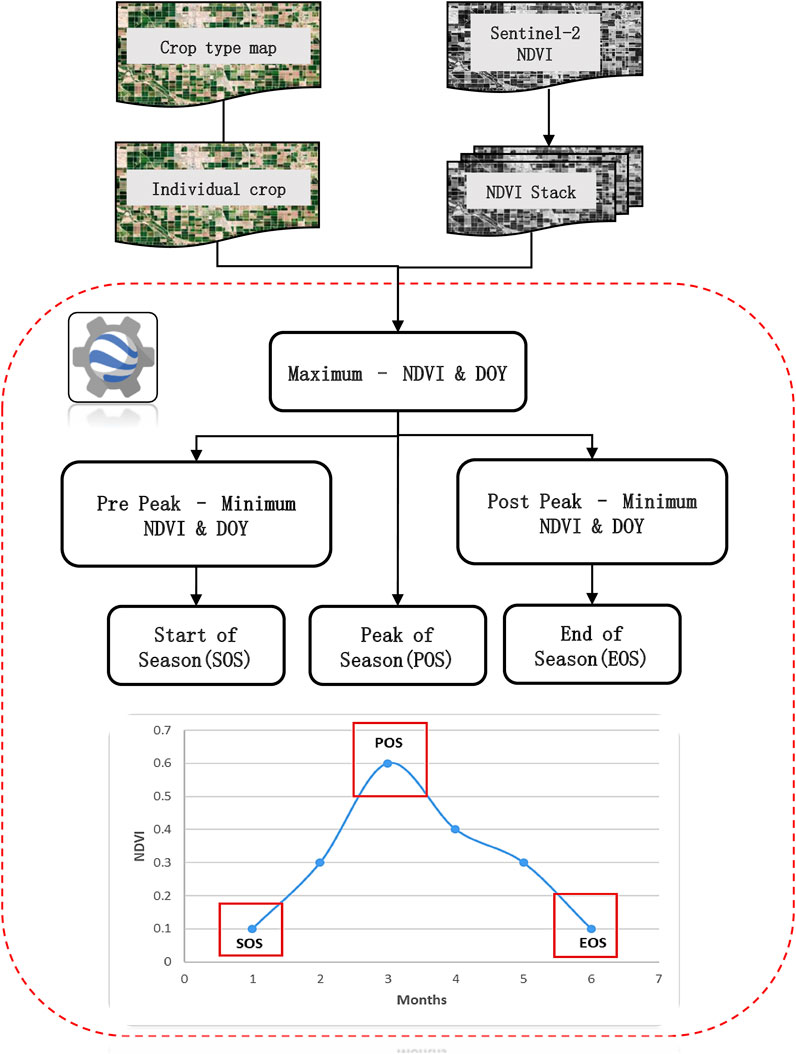
Figure 4. Methodology for mapping length of growing periods.
The next step involves identifying the peak of the growing season (POS) by identifying the maximum NDVI and its corresponding date (Day of Year, DOY). Subsequently, the start of the season (SOS) is determined by locating the pre-peak minimum NDVI, and the end of the season (EOS) is identified using the post-peak minimum NDVI. These critical dates (SOS, POS, and EOS) are then aggregated into monthly intervals and labelled accordingly for each pixel, repeating the entire process for all specific crop types of interest.
2.3.3 Spatial mapping of crop water requirements
The methodology for estimating crop water requirements involves several key steps to ensure accurate calculations based on crop coefficients (Kc) and reference evapotranspiration (ETo) data (Figure 5). Initially, the start of the growing season (SOS), peak of the season (POS), and end of the season (EOS) for each crop will be considered. These critical periods serve as the basis for applying appropriate crop coefficients during different growth stages.
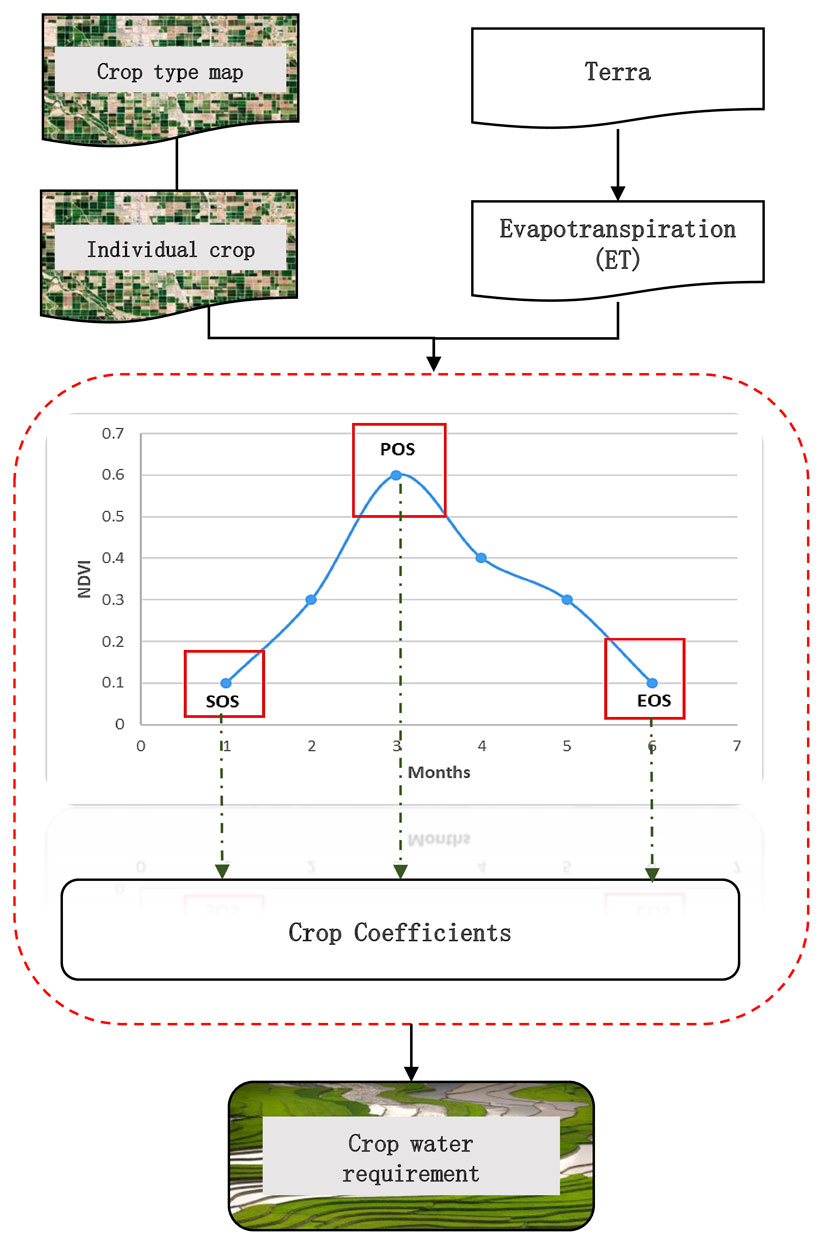
Figure 5. Methodology for mapping crop water requirements.
The use of crop coefficients (Kc) as outlined in the FAO56 guidelines is fundamental to this methodology (Table 1). For example, crops like rice and maize exhibit varying water requirements throughout their growth stages. The provided Kc ranges specify how much water a crop requires relative to the surrounding environmental conditions, with different coefficients assigned to initial, mid-season, and late-season stages. By applying these coefficients to the corresponding growth stages of the crop, we can estimate the relative water needs during these periods.
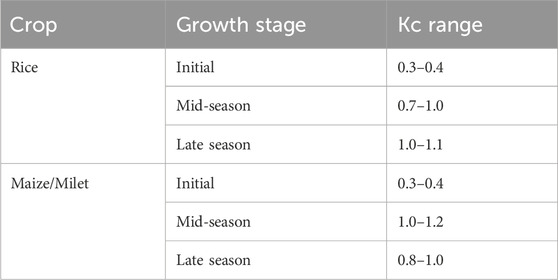
Table 1. Growth stage wise crop coefficients (Kc).
To estimate the crop water requirements, the methodology integrates reference evapotranspiration (ETo) data obtained from the Terraclimate database (Abatzoglou et al., 2018) for specific growing periods. ETo represents the amount of water lost from the soil and plant surfaces due to evaporation and transpiration under standard conditions. By multiplying the ETo values by the appropriate crop coefficient (Kc) for each growth stage, the crop evapotranspiration (ETc.) values were derived which indicate the actual water needs of the crop during those periods. It is important to note that while the FAO56 crop coefficients provide a standard framework, actual Kc values can vary based on factors such as local environmental conditions, crop variety, and management practices. Due to potential data constraints, similar values from the FAO guidelines are often utilized for estimating crop water requirements.
2.4 Accuracy assessment
Accuracy has been assessed using validation data. A total of 402 ground survey samples were utilized to test the accuracy of the classification findings to produce a confusion matrix. A confusion matrix’s columns include field-plot data points, while the rows provide crop map classification results (Congalton, 1991). Kappa (Cohen, 1960) is a widely used metric that represents the agreement between user and reference ground survey data.
3 Results
3.1 Spatial distribution of crop types and their changes
The results of this study reveal significant changes in land use and land cover within the notified mandals/blocks of the Kaleshwaram project between 2018–2019 and 2022–2023 (Figure 6; Table 2). Rice cultivation experienced a remarkable expansion, with the cultivated area increasing by 82.1% from 313,929 ha to 571,632 ha. Conversely, there was a notable decline in millets/maize cultivation by 15.2%, with the area shrinking from 73,604 ha to 62,396 ha over the study period. Other crops showed marginal change, decreasing slightly by 0.6% from 88,961 ha to 88,385 ha. The most substantial reduction was observed in fallow land, which decreased by 30.3% from 754,954 ha to 526,559 ha. Notably, water bodies exhibited an 18.2% increase, expanding from 81,533 ha to 96,375 ha. The overall classification accuracy obtained about 85%. These findings highlight dynamic shifts in agricultural practices and land management possibly influenced by the implementation of the Kaleshwaram project.
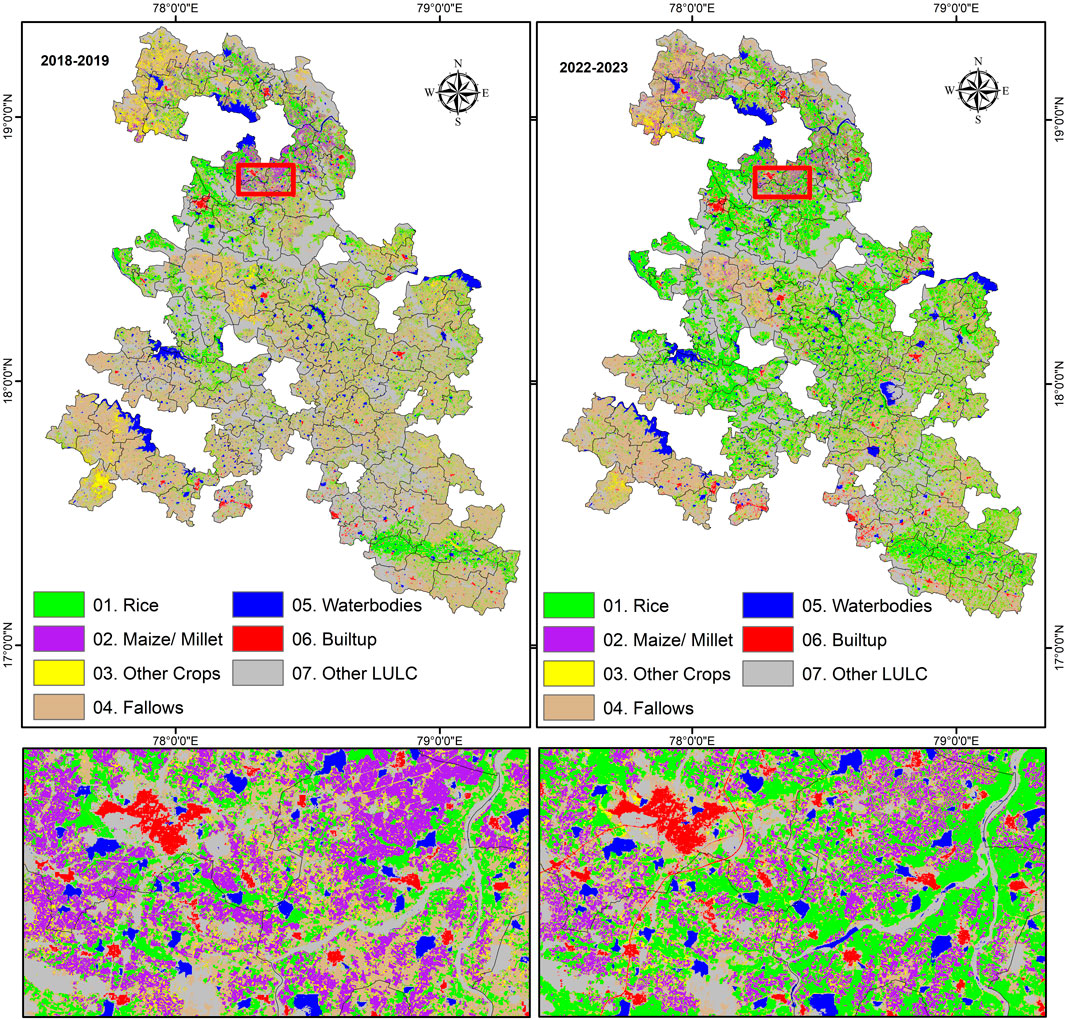
Figure 6. Spatial maps of crop types for 2018–2019 and 2022–2023.
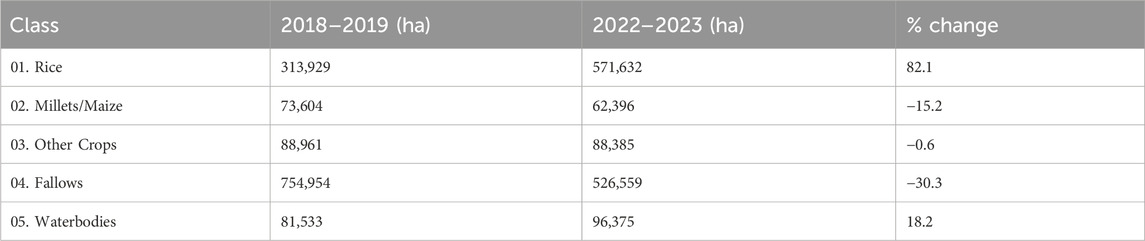
Table 2. Classes and their respective areas for 2018–2019 and 2022–2023.
The district-level changes in rice cultivation between the winter seasons of 2018–2019 and 2022–2023 reflect significant shifts in agricultural practices across different regions within the study area (Table 3). The analysis presented in Table 3 demonstrates both substantial increases and decreases in rice cultivation areas among various districts. Medak district experienced the most dramatic expansion in rice cultivation, with the area increasing by 219.7% over the study period. This substantial growth suggests a shift towards rice as a dominant crop in Medak, potentially driven by factors such as irrigation improvements or market demands. Rajanna Sircilla, Nalgonda, Siddipet, and Kamareddy districts also exhibited notable increases in rice cultivation areas, ranging from 75.5% to 134.6%. These districts may have seen intensified efforts to promote rice farming or favorable conditions that have encouraged farmers to expand their rice acreage.
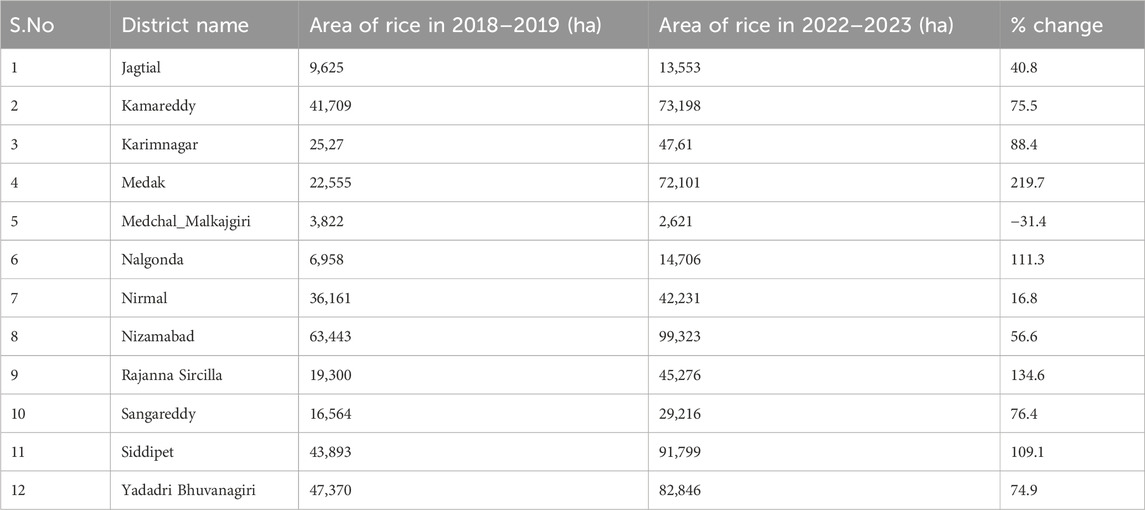
Table 3. District wise Rice crop changes in the study area.
Conversely, Medchal Malkajgiri district experienced a decline of 31.4% in rice cultivation area, indicating a shift away from rice towards other crops or land uses in this region mainly due to urbanisation. The overall trend of increasing rice cultivation across several districts underscores the dynamic nature of agricultural activities influenced by factors such as infrastructure development (like irrigation projects), and climatic conditions. These findings highlight the need for targeted interventions and policy adjustments to optimize land use, promote sustainable agriculture, and ensure food security in the context of evolving agricultural landscapes within the Kaleshwaram project area.
The statistical analysis of the area under rice cultivation during the winter seasons of 2018–2019 and 2022–2023 revealed significant changes. The mean area under rice cultivation increased from 26,160.58 ha in 2018–2019 to 47,635.92 ha in 2022–2023, representing a substantial rise of approximately 82.1%. The total area under rice cultivation also saw a significant increase, rising from 313,927 ha to 571,631 ha. This indicates a notable shift towards rice cultivation within the command area of the Kaleshwaram lift irrigation project. The standard deviation for the area under rice cultivation increased from 19,881.25 ha in 2018–2019 to 35,159.82 ha in 2022–2023, suggesting greater variability across different districts. The mean percentage change in the area under rice cultivation was 81.06%, with a standard deviation of 62.47, highlighting considerable variability in the percentage change across districts.
The paired t-test results further confirmed the statistical significance of these changes, with a t-statistic of −4.053 and a p-value of 0.0019, indicating that the increase in rice cultivation area between the two seasons is highly significant. These findings underscore the significant impact of the Kaleshwaram lift irrigation project on cropping patterns, with a marked shift towards the cultivation of rice, a water-intensive crop. The observed variability across districts suggests differing levels of adoption and efficiency in utilizing the irrigation facilities, providing valuable insights for policymakers and stakeholders involved in agricultural planning and water resource management.
3.2 Spatial distribution of length of growing periods and crop water requirement
The spatial distribution of growing season lengths reveals distinct cultivation windows (SOS-POS-EOS) in the Kaleshwaram region for both the 2018–2019 and 2022–2023 periods (Figure 7). For rice cultivation, the primary sowing periods were November and December, with harvests occurring in April and May, respectively. For Millet and Maize, sowing occurred predominantly in November and December in 2022, resulting in harvests by March and April. This pattern saw significant change in the 2018–2019 period, with sowing occurring in December and January. The earlier sowing dates in 2022 could be attributed to improved irrigation facilities. These spatial maps aid in estimating water requirements by integrating with ETr (Evapotranspiration).
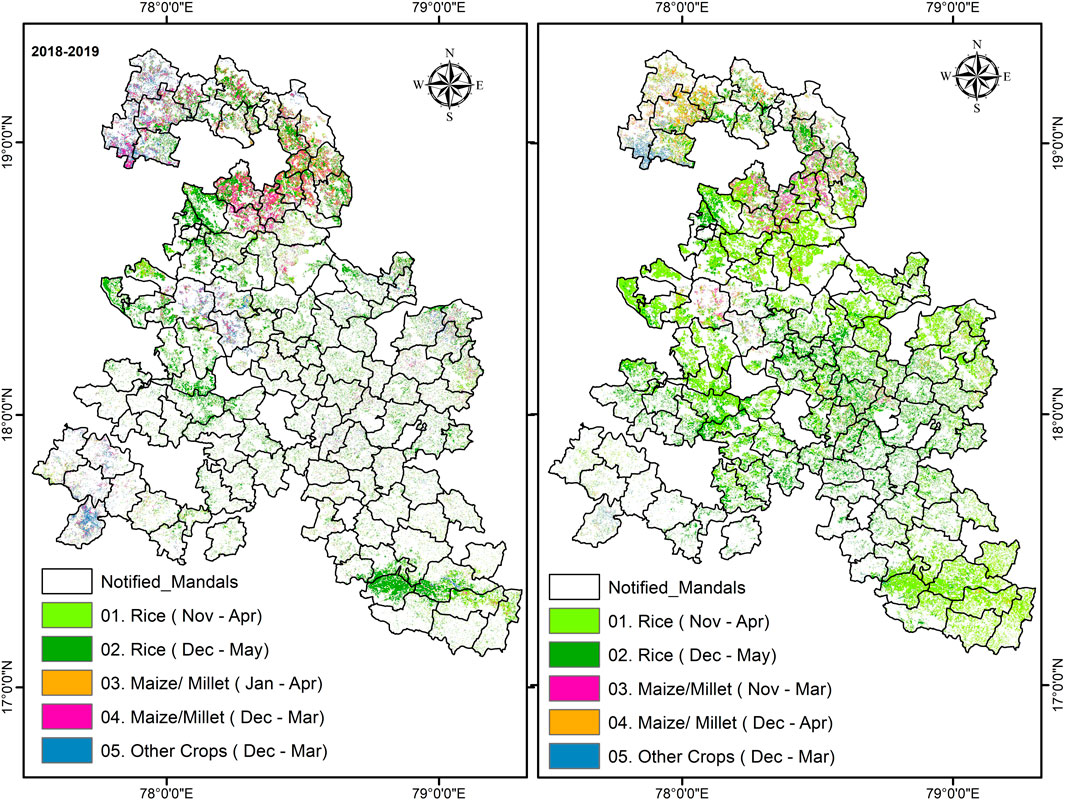
Figure 7. Spatial distribution of length of growing periods across study area.
As mentioned in the methodology, the crop water requirement estimation relies on crop coefficients derived from FAO56, reference evapotranspiration, and growing period lengths extracted from spatial maps. The results obtained provide a comprehensive overview of the crop water needs for the Kaleshwaram project region.
The crop water requirements (CWR) across various districts within the Kaleshwaram project region during the years 2018–2019 and 2022–2023 reveals substantial changes in irrigation water demand (Figure 8; Table 4). Among these districts, Medak showed the most significant increase in CWR, soaring by 234.24% from 184,235,500 m3 in 2018–2019–615,788,797 mm in 2022–2023. This notable surge signals a substantial transformation in agricultural water requirements within Medak. Similarly, districts such as Kamareddy, Siddipet, and Rajanna Sircilla also demonstrated noteworthy increases of 54.48%, 120.12%, and 119.34%, respectively. These sharp rises reflect evolving patterns in crop cultivation, likely influenced by changing agricultural techniques and climatic conditions.

Figure 8. Spatial distribution of crop water requirements across study area.
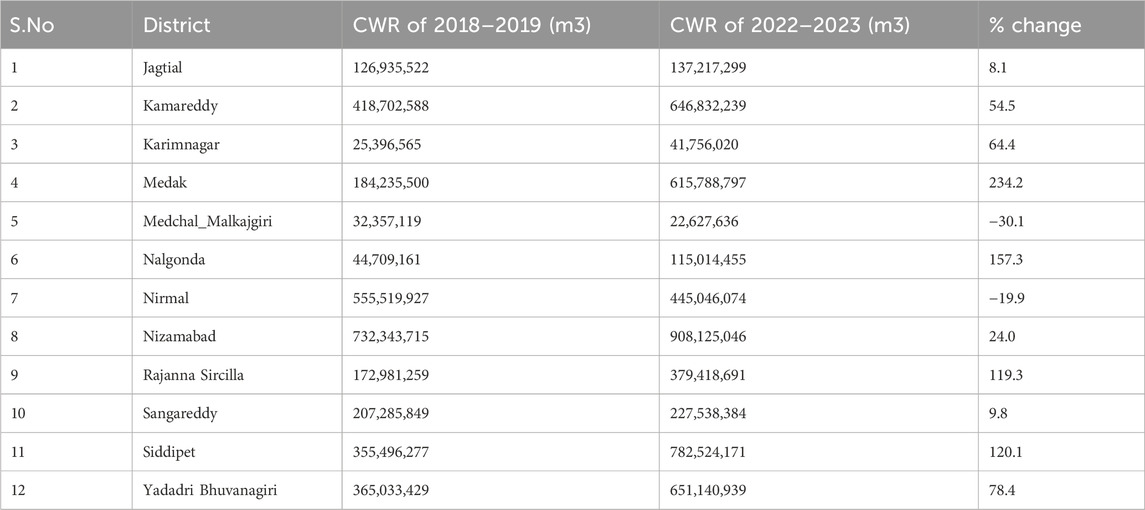
Table 4. Total crop water requirements at district level.
Some districts experienced decreases in CWR over the same period. Medchal_Malkajgiri witnessed a reduction of 30.07%, while Nirmal’s CWR decreased by 19.89%. These declines could be attributed to factors like enhanced water management practices, shifts in crop choices, or variations in climate conditions affecting water demand. Understanding these trends is critical for effective water resource management and sustainable agricultural development within the Kaleshwaram project area.
The statistical analysis of CWR across various districts during the winter seasons of 2018–2019 and 2022–2023 revealed significant changes. The mean CWR increased from 268,416,409.25 m³ in 2018–2019 to 414,419,145.92 m³ in 2022–2023, reflecting a substantial rise of approximately 54.4%. This indicates a notable escalation in water usage, driven by shifts in agricultural practices, particularly an increased preference for water-intensive crops like rice. The total CWR also saw a significant jump from 3,220,996,911 m³ in 2018–2019 to 4,973,029,751 m³ in 2022–2023, underscoring the scale of this transformation. The standard deviation of CWR values for both years (221,961,566.84 m³ for 2018–2019 and 305,375,997.76 m³ for 2022–2023) highlights the variability in water demand across different districts, suggesting diverse agricultural practices and irrigation efficiencies.
A paired t-test confirmed the statistical significance of these changes, with a t-statistic of −2.884 and a p-value of 0.0149 (p < 0.05), indicating that the increase in CWR between the two seasons is significant. This analysis underscores the profound impact of the project on water usage patterns and the necessity for sustainable water management practices to ensure agricultural resilience and resource conservation.
Analyzing these changes in crop water requirements enables policymakers and stakeholders to allocate resources more efficiently and devise strategies to optimize water usage and enhance agricultural productivity across the region.
3.3 Accuracy assessment
The accuracy assessment table provides a detailed evaluation of the classification performance for various land use/land cover (LULC) classes in the study area, yielding an overall accuracy of 91.6% and kappa coefficient 0.838 (Table 5). This high level of agreement between the classified map and the ground truth data demonstrates the robustness of the classification model, which effectively integrates Sentinel-2 satellite data with ground truth data.

Table 5. Accuracy assessment for Crop Type Classification.
Rice exhibited the highest accuracy metrics, with a User’s Accuracy of 0.98 and a Producer’s Accuracy of 0.96. This indicates that the classification model is highly effective in identifying rice fields, likely due to the distinct spectral signature of rice, particularly during the growing season. Millets/Maize also performed well, with a User’s Accuracy of 0.95 and a Producer’s Accuracy of 0.78. However, the slightly lower Producer’s Accuracy suggests some confusion with other crop types, potentially due to spectral similarities during certain growth stages. Other Crops had lower accuracy metrics, with a User’s Accuracy of 0.63 and a Producer’s Accuracy of 0.71, indicating higher rates of misclassification. This could be attributed to the diverse nature of crops in this category, which might overlap spectrally with Millets/Maize and Fallows. Fallows showed a high Producer’s Accuracy of 0.95 but a lower User’s Accuracy of 0.70, suggesting that while most actual fallow lands were correctly identified, some areas classified as fallow were actually other crop types.
Water Bodies achieved perfect accuracy with both User’s and Producer’s Accuracy at 1.00, highlighting the distinct and easily identifiable spectral characteristics of water. Built-up areas had a User’s Accuracy of 0.75 and a Producer’s Accuracy of 1.00, indicating some misclassification with Other LULC classes. Finally, Other LULC had a User’s Accuracy of 0.86 and a Producer’s Accuracy of 0.67, reflecting moderate misclassification rates.
These findings underscore the effectiveness of the classification model in mapping LULC types, particularly for rice and water bodies. However, they also highlight areas for improvement, especially in distinguishing between different crop types and fallows. The high overall accuracy suggests that the model is a valuable tool for monitoring crop water demand and land use changes, providing critical insights for sustainable water management and agricultural planning in the region.
4 Discussion
The study results show significant alterations in land use and agricultural practices within the mandals/blocks affected by the Kaleshwaram project over the span from 2018–2019 to 2022–2023. These changes are crucial for understanding the project’s impact on the region’s agricultural landscape and water demands. The most notable shift observed was the substantial expansion of rice cultivation by 82.1%, indicating a preference for this crop possibly due to enhanced irrigation facilities provided by the Kaleshwaram project. Conversely, there was a decline in millets/maize cultivation, suggesting a change in crop preferences or adaptation strategies among farmers. The decrease in fallow land by 30.3% points towards increased utilization of previously unproductive areas, which could be linked to improved water availability and agricultural infrastructure. The district-level analysis further reveals variations in agricultural practices. Medak district stands out with a remarkable 219.7% increase in rice cultivation, indicating a major transformation likely driven by factors such as irrigation enhancements or market dynamics. Other districts like Rajanna Sircilla, Nalgonda, Siddipet, and Kamareddy also witnessed substantial rises in rice acreage, highlighting localized shifts in crop patterns and land use strategies. The spatial distribution of growing seasons and crop water requirements offers critical insights for water resource management. The shift in sowing periods, particularly for rice and millets/maize, points towards changes in agricultural calendars possibly influenced by improved irrigation schedules. These changes are fundamental for estimating and managing water needs efficiently, ensuring sustainable agricultural development.
The analysis of Crop Water Productivity (CWP) across various districts from 2018–2019 to 2022–2023 reveals no major change in water use efficiency for crop production (https://aps.dac.gov.in/APY/Public_Report1.aspx). The CWP varies from 0.25 to 0.47 across the study area. Most districts experienced slight decreases in CWP, with reductions in Nirmal, Medak, Medchal Malkajgiri, Nizamabad, and Kamareddy ranging from 0.04 to 0.06. The districts of Karimnagar and Siddipet showed minimal decreases of about 0.01, while Sangareddy remained stable with no change in CWP (Table 6).
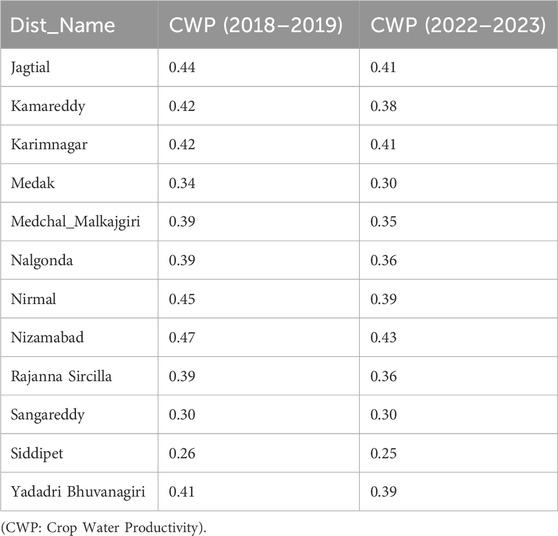
Table 6. Crop water Productivity for study areas at district level.
These findings suggest relatively stable water productivity levels, though minor declines highlight the need for continuous monitoring and improvement. Addressing potential challenges through improved irrigation techniques, better water management policies, climate adaptation strategies, and enhanced soil health practices can help maintain and potentially improve water productivity in the future.
This study provides valuable insights into the impact of the Kaleshwaram project on agriculture and water management from 2018–2019 to 2022–2023. However, it is important to acknowledge several limitations. Firstly, the reliance on satellite imagery and ground-based data introduces potential variability in data quality and coverage across different districts. Secondly, the study’s temporal scope is limited to a specific period, potentially missing longer-term trends and seasonal variations. Thirdly, while efforts were made to assess spatial variability, the study may not fully capture localized impacts within diverse socio-economic contexts. Methodologically, uncertainties exist in estimating crop water requirements and land use changes using FAO crop coefficients and remote sensing techniques. Lastly, the study primarily focuses on agricultural and water management aspects, with less exploration of broader environmental and socio-economic implications. Addressing these limitations would enhance the study’s applicability and provide a more comprehensive understanding of the project’s impacts. Generally, crop water requirements are estimated at administrative levels, whereas this method can estimate crop water requirements at the pixel level in real-time using satellite imagery.
Future research should concentrate on longitudinal and comparative studies to track how agricultural practices and water management evolve post-Kaleshwaram project. Enhancing data integration using satellite imagery, ground-based data, and socio-economic factors will improve accuracy in assessing crop water requirements and land use changes. Developing climate-resilient agricultural strategies tailored to local conditions, evaluating water management policies, engaging local communities in decision-making, and conducting comprehensive environmental impact assessments are essential. These efforts will provide insights to optimize agricultural outcomes and inform sustainable water management policies in the Kaleshwaram project area.
5 Conclusion
The findings underscore the dynamic interplay between infrastructure development, climate, and agricultural practices within the Kaleshwaram project area. The significant increase in rice cultivation alongside declines in other crops reflects adaptive responses to changing conditions and opportunities afforded by irrigation improvements. Key districts like Medak demonstrate substantial shifts towards rice cultivation, potentially reshaping regional agricultural economies. Conversely, districts like Medchal Malkajgiri show declines in rice cultivation, possibly due to urbanization pressures or alternative land use priorities.
Understanding these shifts in land use and crop water requirements is essential for policymakers to optimize resource allocation and promote sustainable practices. Effective management of water resources, guided by detailed assessments of crop water needs and growing season dynamics, is vital for ensuring the long-term viability of agriculture in the Kaleshwaram project region. In summary, the study highlights the transformative impact of the Kaleshwaram project on agriculture, emphasizing the need for targeted interventions to harness opportunities and address challenges associated with evolving agricultural landscapes.
While the increase in rice cultivation has positive aspects, such as enhanced food security and economic benefits, it also poses environmental challenges. One significant concern is the impact of rice cultivation on methane emissions, a potent greenhouse gas. Future studies will focus on the environmental side of rice cultivation, particularly its contribution to methane emissions, to develop strategies that mitigate these impacts and promote more sustainable agricultural practices.
Data availability statement
The original contributions presented in the study are included in the article/supplementary material, further inquiries can be directed to the corresponding author.
Author contributions
PP: Conceptualization, Formal Analysis, Methodology, Visualization, Writing–original draft, Writing–review and editing. MG: Conceptualization, Funding acquisition, Methodology, Resources, Supervision, Validation, Writing–original draft, Writing–review and editing. SM: Conceptualization, Resources, Supervision, Writing–original draft, Writing–review and editing.
Funding
The author(s) declare that no financial support was received for the research, authorship, and/or publication of this article.
Acknowledgments
This work was conducted in collaboration with the Geospatial and Big Data Sciences cluster of ICRISAT, Hyderabad and RS and GIS of NIT Warangal. We would like express our gratitude for providing the facilities to do the research.
Conflict of interest
The authors declare that the research was conducted in the absence of any commercial or financial relationships that could be construed as a potential conflict of interest.
Publisher’s note
All claims expressed in this article are solely those of the authors and do not necessarily represent those of their affiliated organizations, or those of the publisher, the editors and the reviewers. Any product that may be evaluated in this article, or claim that may be made by its manufacturer, is not guaranteed or endorsed by the publisher.
References
Abatzoglou, J. T., Dobrowski, S. Z., Parks, S. A., and Hegewisch, K. C. (2018). TerraClimate, a high-resolution global dataset of monthly climate and climatic water balance from 1958–2015. Sci. data 5 (1), 170191–170212. doi:10.1038/sdata.2017.191
Abhilash Singh, C., Rani, A., Kumari, A., and Kumar, J. (2020). Water resource and use efficiency under changing climate. Resour. use Effic. Agric., 519–576. doi:10.1007/978-981-15-6953-1_15
Aizen, M. A., Aguiar, S., Biesmeijer, J. C., Garibaldi, L. A., Inouye, D. W., Jung, C., et al. (2019). Global agricultural productivity is threatened by increasing pollinator dependence without a parallel increase in crop diversification. Glob. change Biol. 25 (10), 3516–3527. doi:10.1111/gcb.14736
Cohen, J. (1960). A coefficient of agreement for nominal scales. Educ. Psychol. Meas. 20, 37–46. doi:10.1177/001316446002000104
Congalton, R. G. (1991). A review of assessing the accuracy of classifications of remotely sensed data. Remote Sens. Environ. 37 (1), 35–46. doi:10.1016/0034-4257(91)90048-B
de Araujo, H. F., Machado, C. C., Pareyn, F. G., do Nascimento, N. F., Araújo, L. D., de Ap Borges, L. A., et al. (2021). A sustainable agricultural landscape model for tropical drylands. Land use policy 100, 104913. doi:10.1016/j.landusepol.2020.104913
Feng, S., Zhao, J., Liu, T., Zhang, H., Zhang, Z., and Guo, X. (2019). Crop type identification and mapping using machine learning algorithms and sentinel-2 time series data. IEEE J. Sel. Top. Appl. Earth Observations Remote Sens. 12 (9), 3295–3306. doi:10.1109/jstars.2019.2922469
Gerhards, M., Schlerf, M., Mallick, K., and Udelhoven, T. (2019). Challenges and future perspectives of multi-/Hyperspectral thermal infrared remote sensing for crop water-stress detection: a review. Remote Sens. 11 (10), 1240. doi:10.3390/rs11101240
Gohar, A. A., and Cashman, A. (2016). A methodology to assess the impact of climate variability and change on water resources, food security and economic welfare. Agric. Syst. 147, 51–64. doi:10.1016/j.agsy.2016.05.008
Gumma, M. K., Panjala, P., Deevi, K. C., Bellam, P. K., Dheeravath, V., and Mohammed, I. (2023). Impacts of irrigation tank restoration on water bodies and croplands in Telangana State of India using Landsat time series data and machine learning algorithms. Geocarto Int. 38 (1), 2186493. doi:10.1080/10106049.2023.2186493
Gumma, M. K., Thenkabail, P. S., Panjala, P., Teluguntla, P., Yamano, T., and Mohammed, I. (2022). Multiple agricultural cropland products of South Asia developed using Landsat-8 30 m and MODIS 250 m data using machine learning on the Google Earth Engine (GEE) cloud and spectral matching techniques (SMTs) in support of food and water security. GIScience and Remote Sens. 59 (1), 1048–1077. doi:10.1080/15481603.2022.2088651
Gumma, M. K., Tummala, K., Dixit, S., Collivignarelli, F., Holecz, F., Kolli, R. N., et al. (2022). Crop type identification and spatial mapping using Sentinel-2 satellite data with focus on field-level information. Geocarto Int. 37 (7), 1833–1849. doi:10.1080/10106049.2020.1805029
Guntukula, R., and Goyari, P. (2020). Climate change effects on the crop yield and its variability in Telangana, India. Stud. Microeconomics 8 (1), 119–148. doi:10.1177/2321022220923197
Hsiao, T. C., Steduto, P., and Fereres, E. (2007). A systematic and quantitative approach to improve water use efficiency in agriculture. Irrigation Sci. 25, 209–231. doi:10.1007/s00271-007-0063-2
Jain, R., Kishore, P., and Singh, D. K. (2019). Irrigation in India: status, challenges and options. J. Soil Water Conservation 18 (4), 354–363. doi:10.5958/2455-7145.2019.00050.x
Khanal, S., Fulton, J., and Shearer, S. (2017). An overview of current and potential applications of thermal remote sensing in precision agriculture. Comput. Electron. Agric. 139, 22–32. doi:10.1016/j.compag.2017.05.001
Kpadonou, R. A. B., Owiyo, T., Barbier, B., Denton, F., Rutabingwa, F., and Kiema, A. (2017). Advancing climate-smart-agriculture in developing drylands: joint analysis of the adoption of multiple on-farm soil and water conservation technologies in West African Sahel. Land use policy 61, 196–207. doi:10.1016/j.landusepol.2016.10.050
Kumar, S., Meena, R. S., Sheoran, S., Jangir, C. K., Jhariya, M. K., Banerjee, A., et al. (2022). Remote sensing for agriculture and resource management Natural Resources Conservation and Advances for Sustainability. Elsevier, 91–135.
Kundu, A., Dwivedi, S., and Dutta, D. (2016). Monitoring the vegetation health over India during contrasting monsoon years using satellite remote sensing indices. Arabian J. Geosciences 9, 144–215. doi:10.1007/s12517-015-2185-9
MOSPI (2016). Ministry of statistics and program implementation (MOSPI) statistical year book India.
Obi Reddy, G., Dwivedi, B., and Ravindra Chary, G. (2023). “Applications of geospatial and big data technologies in smart farming Smart Agriculture for Developing Nations,” in Status, perspectives and challenges (Springer), 15–31.
Panjala, P., Gumma, M. K., and Teluguntla, P. (2022). Machine learning approaches and sentinel-2 data in crop type mapping. Data Sci. Agric. Nat. Resour. Manag., 161–180. doi:10.1007/978-981-16-5847-1_8
Playán, E., and Mateos, L. (2006). Modernization and optimization of irrigation systems to increase water productivity. Agric. Water Manag. 80 (1-3), 100–116. doi:10.1016/j.agwat.2005.07.007
Pratibha, G., Srinivas, I., Raju, B., Suvana, S., Rao, K., Rao, M. S., et al. (2024). Do rainfed production systems have lower environmental impact over irrigated production systems? on-farm mitigation strategies. Sci. Total Environ. 917, 170190. doi:10.1016/j.scitotenv.2024.170190
Rahman, S. (2009). Whether crop diversification is a desired strategy for agricultural growth in Bangladesh? Food policy 34 (4), 340–349. doi:10.1016/j.foodpol.2009.02.004
Rao, C. S., Lal, R., Prasad, J. V., Gopinath, K. A., Singh, R., Jakkula, V. S., et al. (2015). Potential and challenges of rainfed farming in India. Adv. Agron. 133, 113–181. doi:10.1016/bs.agron.2015.05.004
Rockström, J., and Barron, J. (2007). Water productivity in rainfed systems: overview of challenges and analysis of opportunities in water scarcity prone savannahs. Irrigation Sci. 25, 299–311. doi:10.1007/s00271-007-0062-3
Rost, S., Gerten, D., Hoff, H., Lucht, W., Falkenmark, M., and Rockström, J. (2009). Global potential to increase crop production through water management in rainfed agriculture. Environ. Res. Lett. 4 (4), 044002. doi:10.1088/1748-9326/4/4/044002
Saini, R., and Ghosh, S. K. (2018). Crop classification on single date sentinel-2 imagery using random forest and suppor vector machine. Int. Archives Photogrammetry, Remote Sens. Spatial Inf. Sci. 42, 683–688. doi:10.5194/isprs-archives-xlii-5-683-2018
Serraj, R., Bidinger, F., Chauhan, Y., Seetharama, N., Nigam, S., and Saxena, N. (2003). “Management of drought in ICRISAT cereal and legume mandate crops,” in Water productivity in agriculture: Limits and opportunities for improvement, 127–144.
Sharma, B. R., Rao, K., Vittal, K., Ramakrishna, Y., and Amarasinghe, U. (2010). Estimating the potential of rainfed agriculture in India: prospects for water productivity improvements. Agric. Water Manag. 97 (1), 23–30. doi:10.1016/j.agwat.2009.08.002
Sun, C., Bian, Y., Zhou, T., and Pan, J. (2019). Using of multi-source and multi-temporal remote sensing data improves crop-type mapping in the subtropical agriculture region. Sensors 19 (10), 2401. doi:10.3390/s19102401
Teluguntla, P., Thenkabail, P. S., Xiong, J., Gumma, M. K., Congalton, R. G., Oliphant, A., et al. (2017). Spectral matching techniques (SMTs) and automated cropland classification algorithms (ACCAs) for mapping croplands of Australia using MODIS 250-m time-series (2000–2015) data. Int. J. Digital Earth 10 (9), 944–977. doi:10.1080/17538947.2016.1267269
Thenkabail, P., GangadharaRao, P., Biggs, T., Krishna, M., and Turral, H. (2007). Spectral matching techniques to determine historical land-use/land-cover (LULC) and irrigated areas using time-series 0.1-degree AVHRR pathfinder datasets. Photogrammetric Eng. and Remote Sens. 73 (10), 1029–1040.
Venkateshwarlu, N., and Deshpande, S. R. (2021). Kaleshwaram project–A growth engine for comprehensive Godavari basin development plan. Water Energy Int. 64 (5), 6–15.
Virnodkar, S. S., Pachghare, V. K., Patil, V., and Jha, S. K. (2020). Remote sensing and machine learning for crop water stress determination in various crops: a critical review. Precis. Agric. 21 (5), 1121–1155. doi:10.1007/s11119-020-09711-9
Weiss, M., Jacob, F., and Duveiller, G. (2020). Remote sensing for agricultural applications: a meta-review. Remote Sens. Environ. 236, 111402. doi:10.1016/j.rse.2019.111402
Keywords: lift irrigation, crop water, crop types, remote sensing, change detection
Citation: Panjala P, Gumma MK and Mesapam S (2024) Geospatial assessment of cropping pattern shifts and their impact on water demand in the Kaleshwaram lift irrigation project command area, Telangana. Front. Remote Sens. 5:1451594. doi: 10.3389/frsen.2024.1451594
Received: 19 June 2024; Accepted: 30 September 2024;
Published: 11 October 2024.
Edited by:
Ahmet Cilek, Arizona State University, United StatesReviewed by:
Senem Tekin, Adiyaman University, TürkiyeMar G. Spiliotopoulos, University of Thessaly, Greece
Kemal Sulhi Gündoğdu, Bursa Uludağ University, Türkiye
Copyright © 2024 Panjala, Gumma and Mesapam. This is an open-access article distributed under the terms of the Creative Commons Attribution License (CC BY). The use, distribution or reproduction in other forums is permitted, provided the original author(s) and the copyright owner(s) are credited and that the original publication in this journal is cited, in accordance with accepted academic practice. No use, distribution or reproduction is permitted which does not comply with these terms.
*Correspondence: Pranay Panjala, cHJhbmF5LnBhbmphbGFAaWNyaXNhdC5vcmc=