 Lina Xun
 Yuting Chu
- The Key Laboratory of Intelligent Computing and Signal Processing of Ministry of Education, School of Electrical Engineering and Automation, Anhui University, Hefei, China
The aerosol size distribution is a crucial metric for evaluating aerosol optical characteristics and determines the direct and indirect radiative forcings of aerosols. Traditional methods for inversion of aerosol size distribution often suffer from ambiguities and limitations. To address these shortcomings, this paper introduces a method for inferring aerosol volume size distribution utilizing an improved Lévy flight and chaotic sparrow search algorithm (ILCSSA). The algorithm incorporates Circle chaotic mapping onto the basic Sparrow Search Algorithm (SSA) to obtain a high-quality initial population and employs a Lévy flight strategy to enhance population diversity. Additionally, the process of updating the population’s positions is optimized to improve algorithm accuracy. To validate the feasibility of the proposed method, the measured aerosol optical depth (AOD) data obtained from a Precision Solar Radiometer (PSR) sun photometer in Shouxian are utilized and a series of comparisons were conducted among the Sparrow Search Algorithm, Standard Particle Swarm Algorithm, Improved Particle Swarm Algorithm, and Spider Wasp Optimization Algorithm. The results demonstrate a significant performance advantage for the ILCSSA, evidenced by an average reduction of 50
1 Introduction
Aerosols are defined as minute particles suspended within a specific volume of gas, existing in the atmosphere in solid, liquid, or a combination of both states, thus forming a fundamental component of the atmospheric system. These microscopic aerosol particles can impact the balance of the atmosphere-Earth system through direct and indirect radiation Goldsmith et al. (1998), consequently affecting weather conditions and climate change, as well as posing potential threats to human health. Atmospheric aerosols play a crucial role in climate, ecology, and human health Carslaw et al. (2010).
Aerosols are characterized by a range of optical parameters, such as aerosol optical depth (AOD), scattering coefficient, phase function, and particle size distribution. AOD, recognized as a fundamental parameter, provides information on the combined impacts of aerosol light absorption and scattering across the atmosphere, thus serving as a crucial tool for assessing the degree of air pollution Xun et al. (2021). Moreover, particle size distribution characterizes the distribution of aerosol particles with varying radii in the atmosphere, affecting other optical parameters and thereby influencing climate radiation effects. Accurate calculation of these optical parameters holds crucial significance for comprehensive research into the impacts of aerosols on human health and climate change Mao and Li (2014).
Since the 20th century, researchers in the field of engineering science have encountered the challenge of inferring original images from measured values, a problem commonly known as the mathematical-physical inverse problem Engl et al. (1996). AOD can be directly obtained through direct solar irradiance, and its relationship with particle size distribution follows the first type of Fredholm integral equation. The process of solving for the particle size distribution entails resolving the unknown variables in this integral equation. Nevertheless, because of the oscillations of the Mie kernel function, the aforementioned equation is ill-posed. The first type of Fredholm integral equation was originally proposed by Philips and Tikhonov and further developed by Twomey (1963). This theoretical framework forms the basis for most inversions of particle size distribution using sun photometers. For example, King et al. utilized this theory to conduct linearly constrained inversion for aerosol particle size distribution. However, the inversion results exhibited significant errors because the actual aerosol particle size distribution may not necessarily conform to a smooth function. Furthermore, due to the nonlinearity of the problem and limitations in solutions, the uniqueness of the solution remains uncertain Lienert et al. (2001). Hence, when the assumption of a smooth function is unreasonable, the Philips-Twomeny method becomes ineffective. Currently, there are numerous methods for aerosol particle size distribution inversion. These encompass regularization algorithms for multi-wavelength lidar data Engl et al. (1996), improved particle swarm optimization algorithms Mao and Li (2015), spectral extinction fitting techniques for Microtops II sun photometer data Lee et al. (2015), genetic algorithms Ye et al. (1999), and ant colony optimization algorithms Goldsmith et al. (1998). The utilization of these methods provides researchers with additional options and opportunities to conduct comprehensive investigations into aerosol particle size distribution.
The Sparrow Search Algorithm is a novel swarm intelligence optimization algorithm introduced by Xue and Shen in 2020, inspired by the foraging and feeding behaviors of sparrows Xue and Shen (2020). SSA is widely adopted in various domains owing to its straightforward structure, limited parameters, and rapid convergence. For instance, Xingjia Li employed SSA to improve the control precision of robot manipulators Li et al. (2022). Shenghao Bi utilized SSA to design efficient workshop layouts Bi et al. (2024); Ahmed Fathy applied SSA to optimize the operation of microgrids Fathy et al. (2022). However, like other swarm intelligence algorithms, SSA faces challenges such as blind initialization of the population, limited global search capabilities, and susceptibility to local optima. To address these issues, we propose an improved algorithm called the Improved Levy Flight and Circle Chaotic Sparrow Search Algorithm (ILCSSA), which outperforms the standard SSA and other classical swarm intelligence algorithms in terms of computational accuracy and global optimization capability.
This study utilizes AOD data collected by a PSR sun photometer and applies ILCSSA for the inversion of aerosol volume size distribution. The paper provides a detailed description of the principles underlying aerosol particle size distribution based on ILCSSA. To validate the efficacy of ILCSSA and determine its feasibility in inverting volume distribution under varying air quality conditions, a series of experiments were conducted, and their outcomes were thoroughly compared with several other methods.
2 Materials and methods
2.1 Aerosol volume size distribution
According to Mie scattering theory, assuming aerosol particles are spherical, the relationship between aerosol optical depth and aerosol size distribution is as follows:
Where Qext(
A conversion relationship exists between aerosol volume size distribution and particle size distribution Dubovik and King (2000). Equation 1 can be rewritten as:
Additionally,
Where K(
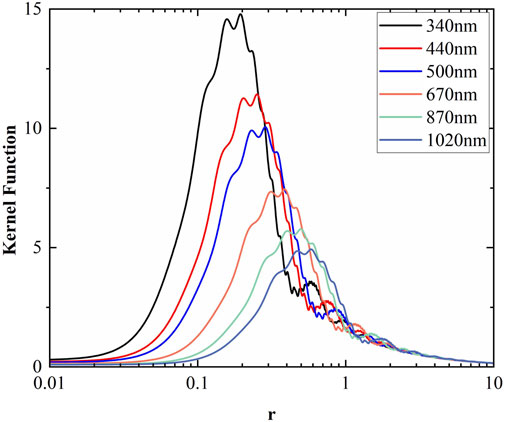
Figure 1. The curve of extinction efficiency kernel function corresponding to different wavelengths.
2.2 Aerosol size distribution
In aerosol particle size distribution studies, distribution functions such as the single log-normal distribution and multiple log-normal distributions are commonly used to describe the characteristics of aerosols across different scales. These functions accurately reflect the variation in aerosol particle sizes in the atmosphere and are suitable for analyzing and modeling various types of aerosols.
2.2.1 Single-lognormal spectrum
The single-lognormal distribution is a statistically significant aerosol particle size distribution function, expressed as follows:
where N is the normalized particle number constant,
2.2.2 Multi-lognormal distribution
In reality, aerosol patterns in the atmosphere are not singular but rather multifaceted. The multiple-peak lognormal distribution provides a better description of multi-source, multi-scale aerosol spectrum distribution. The expression for the number concentration spectrum is Whitby (1978):
Where
While analyzing aerosol particle size distribution, number density spectra might not always capture the true particle distribution accurately. In contrast, volume size distribution offers substantial advantages. The expression for the volume spectrum is written as Dubovik et al. (2011):
Where
2.3 Principle of SSA
The Sparrow Search Algorithm Xue and Shen (2020) primarily achieves position optimization by mimicking the foraging behavior and reciprocity behavior of sparrows. Research has indicated that in captive sparrow populations, two distinct types exist: discoverers and followers. Discoverers possess the richest resources, responsible for locating food and providing direction and area foraging for the followers. The followers exploit the discoverer to obtain food. Additionally, when faced with external attacks, they use a danger alert mechanism. The mathematical model of SSA is presented as follows.
Assuming the search space is D-dimensional and there are n sparrows, the spatial positions of the population X can be represented as follows, as described in Equation 8:
Based on the randomly initialized positions, the fitness value of each sparrow can be calculated. Those with superior fitness are chosen as discoverers, and the remaining are considered followers. The updated formula for the positions of the discoverer is as follows:
Where t is the current iteration number, j = 1,2,3, … ,d.
The update formula for the follower positions is given by Equation 10:
Where
Opting for a minority of individuals from the population to function as sentinels, the formula for updating vigilantes’ positions is as follows:
Where
In brief, if
2.4 Principle of ILCSSA
During the initialization phase of the population, random positions are generated for various dimensions of sparrow individuals. This often leads to the local clustering of sparrow individuals. Hence, the introduction of Circle chaotic mapping is incorporated to enhance the distribution of the initial population. This allows the sparrow population to explore the entire space more extensively, thereby improving the optimization capability of the algorithm. The mathematical model is written as Equation 12:
Where n is the dimensionality of the solution.
Lévy flight Yang and Deb (2009) is a type of random walk model that simulates long-distance movement with random step lengths and directions. A key characteristic of this model is that its step lengths follow a Lévy distribution, which has a long tail. This means there is a probability, albeit low, of encountering extreme values with large step lengths. This allows for both small and large step lengths, enhancing the likelihood of long-distance jumps Yang and Deb (2010). Consequently, Lévy flight is widely used in swarm intelligence optimization algorithms, effectively broadening the exploration range of the search space, enhancing the randomness of the swarm’s search, and aiding in avoiding local optima Yang (2010).
The formula for updating positions using Lévy flight is given in Equation 13:
Where
Lévy flight involves random step lengths that conform to a Lévy distribution, which is very complex and has not been fully implemented. Therefore, the Mantegna algorithm is commonly used for simulation. The mathematical representation of this algorithm is given in Equation 15:
In Equation 16, u and v follow a normal distribution, and
According to Equation 9, when
In each iteration, the sparrow population is uniformly distributed. When followers distance themselves from poor positions in all dimensions and move closer to the optimal position, they tend to converge quickly but are susceptible to local optima. Therefore, the position update formula for followers in the SSA is:
2.5 Experimental inversion of aerosol particle size distribution using ILCSSA
Initially, the population is initialized using the Circle chaotic mapping. In Equation 6,
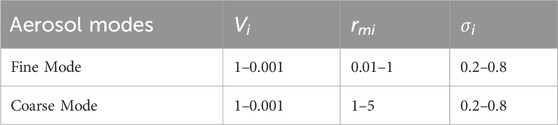
Table 1. Range of parameters for different Aerosol mode particles.
In this study, the AOD measurements at six different wavelengths obtained from the PSR sun photometer are used as the true values, denoted by
Where
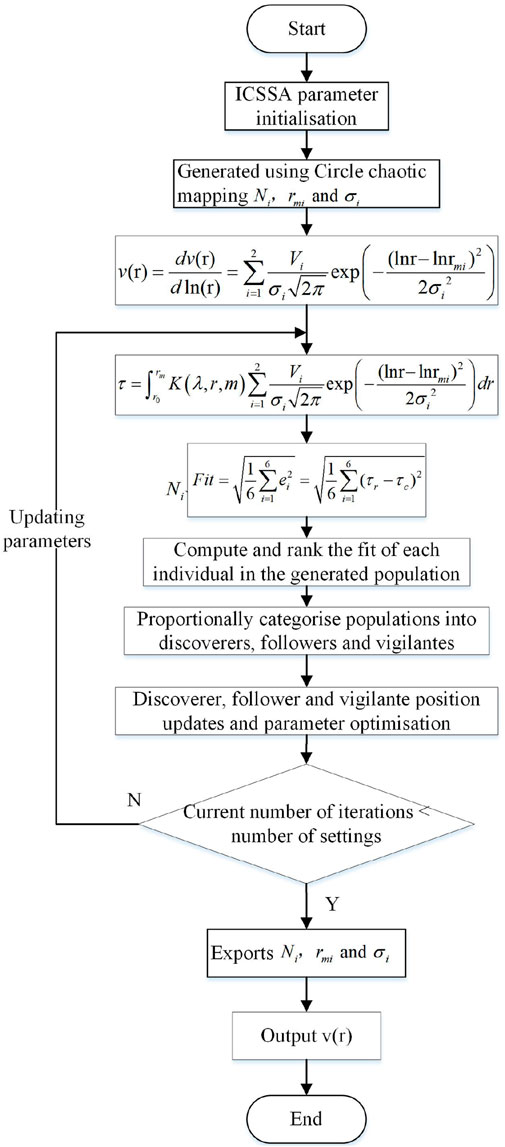
Figure 2. Flowchart illustrating the inversion of aerosol particle size distribution using the enhanced Circle chaotic mapping sparrow search algorithm.
Step 1: Utilize the Circle chaotic mapping to generate unknown parameters, which will be employed in the subsequent inversion process of the aerosol volume size distribution.
Step 2: Employ Equation 6 to invert the aerosol volume size distribution based on the generated parameters, and compute the corresponding AOD values using Equation 7.
Step 3: Compute the fitness function value (Fit) for each sparrow individual and rank them accordingly. Based on the sorted results, designate 20
Step 4: Retrieve the current individual positions
Step 5: Update the positions of discoverers, followers, and vigilantes using Equation 18, Equation 19, and Equation 11, respectively, and recalculate the fitness function values. Repeat the process from Step 2 until the set number of iterations is achieved.
Step 6: After completing the iterations, output the global best position
3 Results and discussion
3.1 The comparison and analysis of multiple algorithms
The research employed measurement data from the PSR sun photometer for analysis. As shown in Figure 3, the PSR sun photometer is located at the Shouxian National Meteorological Observatory (32.56°N, 116.78°E). This device features broad spectral coverage, with each scan covering 9 bands, comprising 340 nm and 380 nm in the ultraviolet spectrum, 440 nm, 500 nm, and 670 nm in the visible spectrum, and 870 nm, 940 nm, 1020 nm, and 1640 nm in the infrared spectrum.
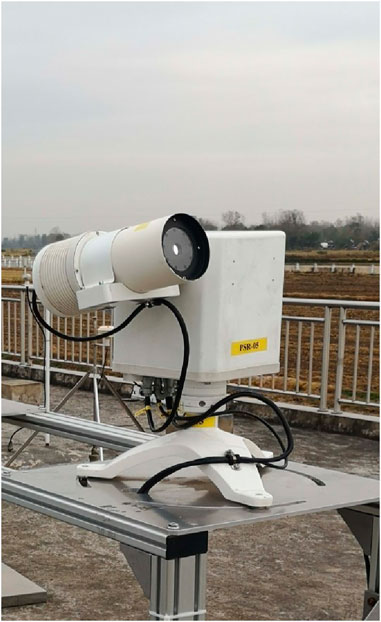
Figure 3. PSR sun photometer device utilized in the experiment.
The sun photometer is engineered with complete automation, enabling direct irradiance observation through sun tracking and sky radiance measurement. Developed by Anhui Zhongke Puruida Optoelectronics Co., Ltd., detailed instrument parameters and other relevant information can be referenced from Xun et al. (2021).
The aerosol size distribution inversion method based on the Improved Particle Swarm Optimization Algorithm (IPSO) proposed by Mao et al Mao and Li (2015). has received widespread recognition and application in the field of atmospheric science. This method enhances global optimization capabilities by adjusting the speed and position of particles and has effectively solved the accurate inversion of aerosol size distribution under various weather conditions. Mao et al.‘s approach has demonstrated exceptional performance, particularly in dealing with nonlinear and ill-posed problems, which is crucial for aerosol size distribution inversion.
Mao et al.’s research not only provides a theoretical foundation for subsequent studies but has also validated its effectiveness in several practical applications. For instance, comparisons with traditional methods show that their approach offers higher accuracy and robustness under dust and haze conditions. Consequently, Mao et al.’s method is regarded as an important reference standard for aerosol size distribution inversion.
In this context, to evaluate the feasibility of the ILCSSA algorithm, we have compared it with SSA, PSO, IPSO, and SMO Abdel-Basset et al. (2023) algorithms. Table 2 provides a detailed list of the experimental parameters of these algorithms for further analysis.
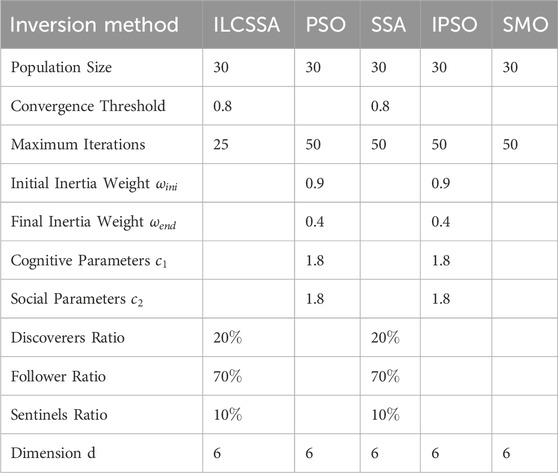
Table 2. Range of parameters for different Aerosol mode particles.
Figure 4 shows the variations in fitness values over different numbers of iterations for the ILCSSA, SSA, PSO, IPSO, and SMO methods. Despite initially demonstrating faster convergence rates, both the ILCSSA and PSO algorithms show that after 10 iterations, the ILCSSA’s fitness value decreases more rapidly than that of PSO. Furthermore, compared to the SSA, IPSO, and SMO methods, the ILCSSA significantly addresses premature convergence issues while achieving superior results in terms of both convergence speed and accuracy.
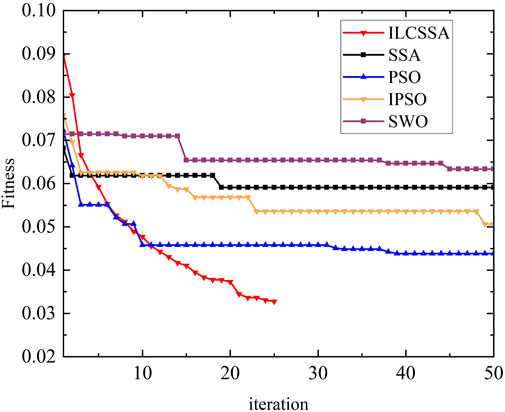
Figure 4. The variation of fitness function values with evolutionary generations for the ILCSSA, SSA, PSO, IPSO, and SMO methods.
The aerosol volume size distributions retrieved by the ILCSSA, SSA, PSO, IPSO, and SMO algorithms are presented in Figure 5. To further evaluate the inversion performance of these five algorithmic sets, we also randomly selected the sum of squared errors and the mean square error between the calculated and true values of eight sets of AOD at six wavelengths, as depicted in Figure 6. Notably, the superiority of the ILCSSA algorithm is evident.
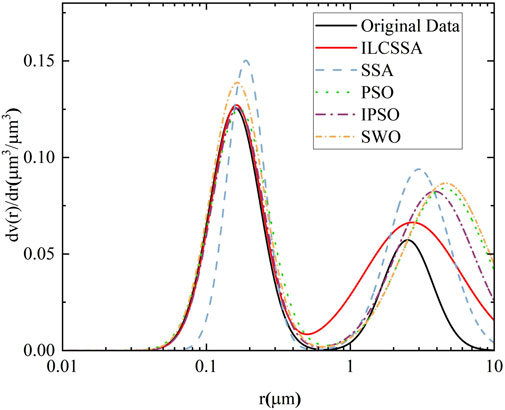
Figure 5. Aerosol volume size distributions retrieved by various algorithms.
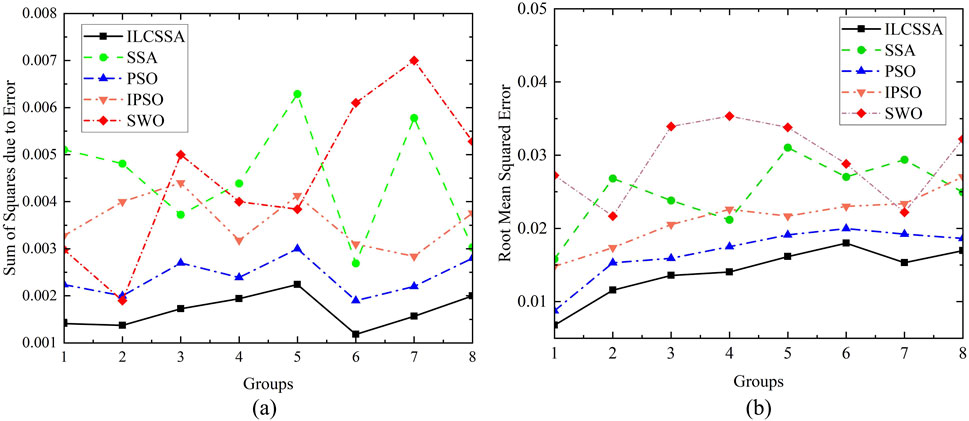
Figure 6. Using the Sparrow Search Algorithm and the Circle Chaotic Sparrow Search Algorithm based on improved Levy flight for solving the sum of squared errors (A) and mean square errors (B).
The correlation between the calculated AOD values obtained through the ILCSSA algorithm and the measured values is presented in Figure 7. We randomly selected 24 data sets to assess their correlation, achieving a maximum correlation coefficient of 0.9748. This result further confirms the superiority of the ILCSSA algorithm in aerosol inversion.
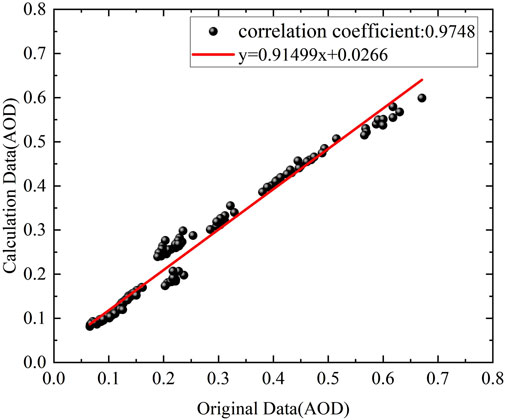
Figure 7. The correlation between the original and calculated values of aerosol optical depth using the Circle Chaotic Sparrow Search Algorithm based on improved Levy flight.
3.2 Inversion and analysis of volume size distribution
To assess the practical application of ILCSSA, we describe the characteristics of atmospheric aerosol volume size distribution in the Shouxian. Experimental data were selected from periods of excellent, good, and mild pollution air quality in Shouxian.
Figure 8 shows the diurnal variations in AOD and volume size distribution based on the ILCSSA algorithm, during a period of excellent air quality in Shouxian County on 1 August 2020. It is evident from Figure 8A that there is a pronounced similarity between the wavelength-dependent trend of AOD and its diurnal variation. At the same moment, the relationship between AOD values and wavelength exhibits an inverse correlation: longer wavelengths correspond to smaller AOD values and trends, whereas shorter wavelengths correspond to larger AOD values and trends. The temporal variations in AOD values across different wavelengths also demonstrate similarities. Following sunrise in the morning, rapid heating of the Earth’s surface induces a gradual increase in atmospheric temperature, leading to intense convection. This convective process transports surface pollutants upwards to higher altitudes, leading to an increase in AOD during the morning hours. As human activities intensify around noon, emissions from vehicular exhausts and industrial pollutants escalate, coupled with the introduction of ground-level dust into the atmosphere. These factors collectively contribute to a rise in AOD, peaking at 12:54 PM. Subsequently, AOD values start declining in the afternoon due to the decrease in surface temperature and reduced human activities, facilitating the settling of particulate matter back to the ground. As depicted in Figure 8B, the volume size distributions at four different time points exhibit bimodal spectra, mirroring the trends observed in AOD values, with higher aerosol volume concentrations in the morning and lower concentrations in the afternoon. Influenced by various factors, the amplitude of the aerosol volume size distribution curves for the day is substantial, indicating a predominance of anthropogenic fine particulate matter in the atmospheric pollution of Shouxian County.

Figure 8. Aerosol optical depth (A) and volume size distribution (B) based on improved Lévy Flight and Circle Chaos Sparrow Search Algorithm for excellent air day in Shouxian on 1 August 2020.
Figure 9 presents AOD and aerosol volume size distribution in Shouxian on 14 March 2021, during a period of favorable air quality, as determined through the ILCSSA algorithm. Despite the overcast weather conditions, AOD values remained relatively steady until 11:42 a.m. Subsequently, over, for the next hour, there was a slight decrease followed by an increase back to the initial values, peaking abruptly at 2:51 p.m., after which AOD values began declining across all spectral bands. Analysis of the volume spectra at different time intervals reveals marginal discrepancies in volume concentration throughout the day, yet the primary and secondary peaks exhibit consistent values, suggesting a stable overall structure of atmospheric aerosols in Shouxian County for the day. The retrieved aerosol volume size distribution demonstrates minimal variability, consistent with the observed good air quality conditions.
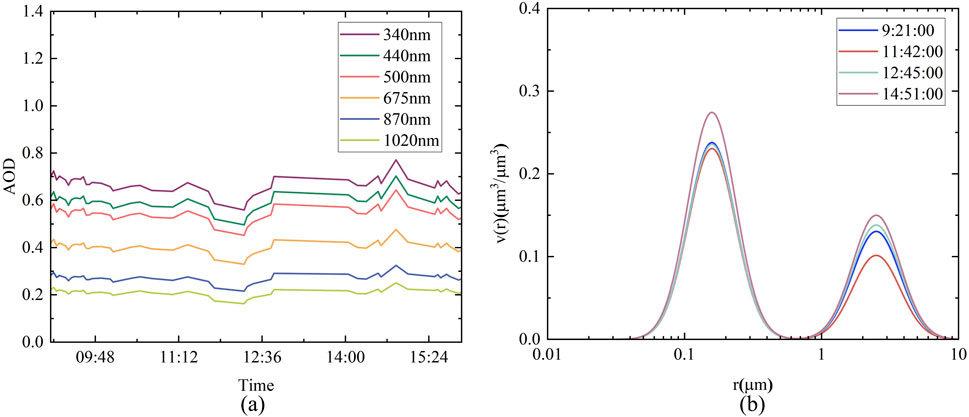
Figure 9. Aerosol optical depth (A) and volume size distribution (B) based on improved Lévy Flight and Circle Chaos Sparrow Search Algorithm for good air day in Shouxian on 14 March 2021.
Figure 10 illustrates the AOD and aerosol volume size distribution in Shouxian County on 4 December 2020, during a period of mild pollution, as derived using the ILCSSA algorithm. In Figure 10A, before 12:40 p.m., AOD values exhibit significant fluctuations at wavelengths of 340 nm, 440 nm, 500 nm, and 675 nm, while remaining relatively stable at 870 nm and 1020 nm. Subsequently, AOD values commence an ascent, reaching their peak at 2:51 p.m., indicating a pronounced influence of fine particles on afternoon AOD levels. Figure 10B portrays a comparable trend in volume size distribution at 9:18 a.m. and 11:33 a.m., characterized by relatively low volume concentrations, followed by a marked increase in particles smaller than 1 micron in volume concentration at 1:30 p.m. and 2:33 p.m. as aerosols accumulate. Relative to the volume size distribution of aerosols at various time points on 1 August 2020, and 14 March 2021, the aerosol volume concentration on this day is elevated, indicative of poor air quality conditions consistent with the prevailing weather. Furthermore, the elevated presence of fine particles suggests that anthropogenic emissions of fine particulate matter primarily influenced the air quality in Shouxian County on that day.
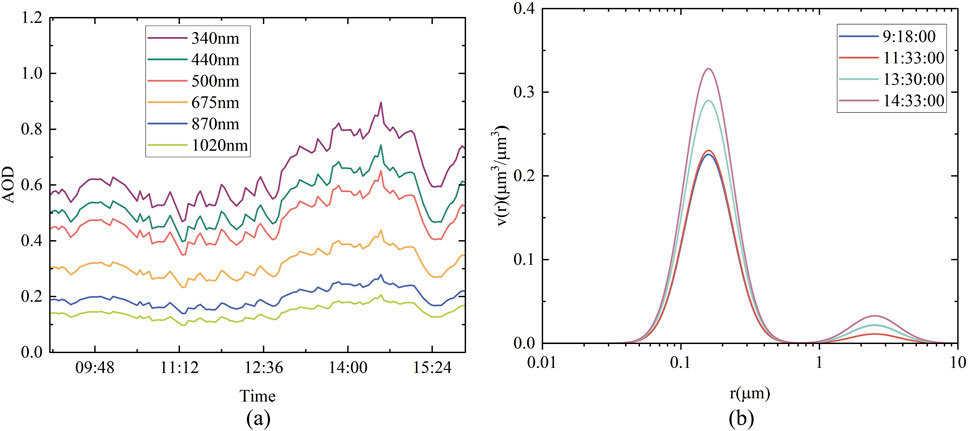
Figure 10. Aerosol optical depth (A) and volume size distribution (B) based on improved Lévy Flight and Circle Chaos Sparrow Search Algorithm for mild pollution day in Shouxian on 4 December 2020.
The AOD values for 14 March 2021, were slightly lower or comparable to those for 4 December 2020, but exhibited instability. On 4 December 2020, the air quality index (AQI) was 104, classified as lightly polluted, while on 14 March 2021, the AQI was 94, classified as good. Notably, the AOD values for the mild pollution air day were higher than those for the good air quality day and this phenomenon is further analysed.
This discrepancy may be attributed to differences in meteorological conditions and ozone concentrations. 4 December 2020, was a clear day, whereas 14 March 2021, was cloudy. Cloud cover likely reduced solar radiation and increased atmospheric humidity, which could have led to aerosol particle condensation or growth, affecting the accuracy of AOD measurements and resulting in lower AOD values. Additionally, the higher ozone concentration on 14 March 2021 (128
4 Conclusions
Aerosols constitute a vital component of the atmosphere, exerting significant influence on atmospheric radiation balance, air quality, and human health. The aerosol size distribution is a crucial parameter for assessing aerosol optical properties. In this study, the ILCSSA algorithm was successfully employed to overcome the limitations of traditional methods in solving particle spectra. This approach initializes the population using a typical Circle chaotic mapping, optimizes the positions of explorers and followers through optimization, and introduces Levy flights to prevent convergence to local optima.
Compared to SSA, PSO, IPSO, and SMO algorithms, the ILCSSA algorithm demonstrates superior performance in terms of computational time and accuracy. Specifically, ILCSSA achieves an average reduction of 60
Data availability statement
The original contributions presented in the study are included in the article/supplementary material, further inquiries can be directed to the corresponding author.
Author contributions
LX: Conceptualization, Investigation, Methodology, Writing–original draft. YC: Methodology, Software, Writing–original draft. HZ: Data curation, Writing–original draft. SW: Writing–review and editing. QY: Validation, Writing–review and editing. JZ: Supervision, Writing–review and editing.
Funding
The author(s) declare that no financial support was received for the research, authorship, and/or publication of this article. This work was supported in part by the National Key R & D Plan of China under Grant 2018YFB0504604.
Acknowledgments
Authors are grateful to the referees and handling editor for their constructive comments.
Conflict of interest
The authors declare that the research was conducted in the absence of any commercial or financial relationships that could be construed as a potential conflict of interest.
Publisher’s note
All claims expressed in this article are solely those of the authors and do not necessarily represent those of their affiliated organizations, or those of the publisher, the editors and the reviewers. Any product that may be evaluated in this article, or claim that may be made by its manufacturer, is not guaranteed or endorsed by the publisher.
References
Abdel-Basset, M., Mohamed, R., Jameel, M., and Abouhawwash, M. (2023). Spider wasp optimizer: a novel meta-heuristic optimization algorithm. Artif. Intell. Rev. 56, 11675–11738. doi:10.1007/s10462-023-10446-y
Bi, S., Shao, L., Zheng, J., and Yang, R. (2024). Workshop layout optimization method based on sparrow search algorithm: a new approach. J. Industrial Prod. Eng. 41, 324–343. doi:10.1080/21681015.2024.2302630
Bohren, C. F., and Huffman, D. R. (2008). Absorption and scattering of light by small particles. John Wiley and Sons.
Carslaw, K., Boucher, O., Spracklen, D., Mann, G., Rae, J., Woodward, S., et al. (2010). A review of natural aerosol interactions and feedbacks within the earth system. Atmos. Chem. Phys. 10, 1701–1737. doi:10.5194/acp-10-1701-2010
Dubovik, O., Herman, M., Holdak, A., Lapyonok, T., Tanré, D., Deuzé, J., et al. (2011). Statistically optimized inversion algorithm for enhanced retrieval of aerosol properties from spectral multi-angle polarimetric satellite observations. Atmos. Meas. Tech. 4, 975–1018. doi:10.5194/amt-4-975-2011
Dubovik, O., and King, M. D. (2000). A flexible inversion algorithm for retrieval of aerosol optical properties from sun and sky radiance measurements. J. Geophys. Res. Atmos. 105, 20673–20696. doi:10.1029/2000jd900282
Engl, H. W., Hanke, M., and Neubauer, A. (1996). Regularization of inverse problems, 375. Springer Science and Business Media.
Fathy, A., Alanazi, T. M., Rezk, H., and Yousri, D. (2022). Optimal energy management of micro-grid using sparrow search algorithm. Energy Rep. 8, 758–773. doi:10.1016/j.egyr.2021.12.022
Goldsmith, J., Blair, F. H., Bisson, S. E., and Turner, D. D. (1998). Turn-key Raman lidar for profiling atmospheric water vapor, clouds, and aerosols. Appl. Opt. 37, 4979–4990. doi:10.1364/ao.37.004979
Lee, K. H., Wong, M. S., Nichol, J., and Chan, P. W. (2015). Retrieval of aerosol size distribution from microtops ii sunphotometer in Hong Kong. Aerosol Air Qual. Res. 15, 1712–1719. doi:10.4209/aaqr.2015.01.0048
Li, X., Gu, J., Sun, X., Li, J., and Tang, S. (2022). Parameter identification of robot manipulators with unknown payloads using an improved chaotic sparrow search algorithm. Appl. Intell. 52, 10341–10351. doi:10.1007/s10489-021-02972-5
Lienert, B. R., Porter, J. N., and Sharma, S. K. (2001). Repetitive genetic inversion of optical extinction data. Appl. Opt. 40, 3476–3482. doi:10.1364/ao.40.003476
Mao, J., and Li, J. (2014). Dust particle size distribution inversion based on the multi population genetic algorithm. TAO Terr. Atmos. Ocean. Sci. 25, 791. doi:10.3319/tao.2014.06.12.01(a)
Mao, J., and Li, J. (2015). Retrieval of particle size distribution from aerosol optical thickness using an improved particle swarm optimization algorithm. Opt. Rev. 22, 809–818. doi:10.1007/s10043-015-0130-5
Twomey, S. (1963). On the numerical solution of Fredholm integral equations of the first kind by the inversion of the linear system produced by quadrature. J. ACM (JACM) 10, 97–101. doi:10.1145/321150.321157
Whitby, K. T. (1978). “The physical characteristics of sulfur aerosols,” in Sulfur in the atmosphere (Elsevier), 135–159.
Xue, J., and Shen, B. (2020). A novel swarm intelligence optimization approach: sparrow search algorithm. Syst. Sci. and control Eng. 8, 22–34. doi:10.1080/21642583.2019.1708830
Xun, L., Lu, H., Qian, C., Zhang, Y., Lyu, S., and Li, X. (2021). Analysis of aerosol optical depth from sun photometer at shouxian, China. Atmosphere 12, 1226. doi:10.3390/atmos12091226
Yang, X.-S., and Deb, S. (2009). “Cuckoo search via lévy flights,” in 2009 World congress on nature and biologically inspired computing (NaBIC) (Ieee), 210–214.
Yang, X.-S., and Deb, S. (2010). Engineering optimisation by cuckoo search. Int. J. Math. Model. Numer. Optimisation 1, 330–343. doi:10.1504/ijmmno.2010.035430
Keywords: sparrow search algorithm, aerosol size distribution, aerosol optical depth, sun photometer, Lévy flight, circle chaos
Citation: Xun L, Chu Y, Zeng H, Wang S, Yan Q and Zhang J (2024) Retrieval of aerosol particle size distribution using an improved lévy flight and circle chaos sparrow search algorithm. Front. Remote Sens. 5:1449854. doi: 10.3389/frsen.2024.1449854
Received: 16 June 2024; Accepted: 21 August 2024;
Published: 30 August 2024.
Edited by:
Quan Wang, Shizuoka University, JapanCopyright © 2024 Xun, Chu, Zeng, Wang, Yan and Zhang. This is an open-access article distributed under the terms of the Creative Commons Attribution License (CC BY). The use, distribution or reproduction in other forums is permitted, provided the original author(s) and the copyright owner(s) are credited and that the original publication in this journal is cited, in accordance with accepted academic practice. No use, distribution or reproduction is permitted which does not comply with these terms.
*Correspondence: Lina Xun, YWh1eGxuQGFodS5lZHUuY24=