- 1Sanya Institute of Hunan University of Science and Technology, Sanya, China
- 2School of Earth Sciences and Spatial Information Engineering, Hunan University of Sciences and Technology, Xiangtan, China
- 3Hunan Institute of Geological Disaster Investigation and Monitoring, Changsha, Hunan, China
The study focuses on identifying fireburning and burnt areas in a large-scale forest fire that occurred in Xintian County, China, in October 2022. To investigate the adaptability of machine learning methods in various scenarios for mapping forest fire areas, this study presents a comparative study on the recognition and mapping accuracy of three machine learning algorithms, namely, Support Vector Machine (SVM), Random Forest (RF), and Neural Network (NN), based on Sentinel-1B and 2A imagery. Initially, three sets of pre-fire, during-fire, and post-fire remote sensing data were preprocessed. Various feature parameters from Sentinel-1B and 2A imagery were combined to identify firerelated land cover types. The experimental results revealed that: (i) During the pre-fire period, the SVM method demonstrated superior accuracy compared to the other two methods. The combination of spectral and Normalized Difference Vegetation Index (NDVI) features achieved an optimal accuracy for identifying forest areas with an overall accuracy (OA) of 93.52%. (ii) In the during-fire period, RF method exhibited higher accuracy compared to the other two methods with peak fire identification accuracy reached by combining spectral and Normalized Burn Ratio (NBR) index features at an OA of 95.43%. (iii) In the post-fire period, SVM demonstrated superior accuracy compared to other methods. The highest accuracy of 94.97% was achieved when combining spectral and radar features from Sentinel-1B imagery, highlighting the effectiveness of using spectral and radar backward scattering coefficients as feature parameters to enhance forest fire recognition accuracy for burnt areas. These findings suggest that appropriate machine learning algorithms should be employed under different conditions to obtain more precise identification of forest fire areas. This study provides technical support and empirical evidence for extracting and mapping forest fire areas while assessing damage caused by fires.
1 Introduction
Forest fires are a significant natural disaster that can have far-reaching impacts on global and regional ecosystems, as well as on human activities and social development (Zhao et al., 2023). Known for their rapid and unpredictable nature, these fires can cause extensive destruction, making them difficult to detect and accurately predict (Fu, 2021). Therefore, monitoring and mapping forest fires are crucial for early detection, tracking fire progression, improving firefighting efforts, assessing disaster damage, evaluating environmental impact, and monitoring vegetation recovery (Zhao et al., 2023). The advancement of space remote sensing technology has provided valuable tools for obtaining information on forest fires at global and regional scales. Satellite remote sensing offers advantages such as short imaging period, multi-spectral and high-resolution imagery, and wide coverage, surpassing traditional manual survey methods (Robinson, 1991). It enables comprehensive observation capabilities and serves as an effective tool for monitoring fire dynamics, assessing landscape impacts, and planning restoration activities (Dozier, 1981; Pacheco et al., 2021). Specifically, multi-spectral and high-resolution remote sensing images obtained during satellite overpasses facilitate various monitoring activities, including early fire point identification, analysis of burning and burned areas, and tracking vegetation recovery along fire paths (Zhao et al., 2023). Current research by experts and scholars focuses on using different remote sensing data to enhance the classification accuracy of forest fire features and improve the extraction of burned areas (Sunar and Özkan, 2001; Lazecky et al., 2018; Abdikan et al., 2022; Nguyen et al., 2021).
Remote sensing technology can be utilized for mapping forest and fire areas, serving as a valuable reference for government initiatives aimed at reforestation in areas affected by fires (Sukojo and Arimurti, 2021). Therefore, various methods and algorithms have been proposed for identifying forest fires and mapping burned-fire areas based on remote sensing images. These methods include the extraction of fire trails, rapid extraction of burned areas, evaluation of changes in the forest ecological environment, quantification of intervention outcomes, and monitoring post-fire forest regrowth. (Huang et al., 2023) proposed a remote sensing image-based method for extracting fire trails. Their method automates the pre-processing and extraction using only one vegetation index, simplifying the process. (Zhang S. et al., 2023) the differential Normalized Burn Ratio (dNBR) index and the OTSU threshold method to rapidly and accurately extract burned areas. They also evaluated changes in the ecological environment using the remote sensing environment index (RSEI). (Gale et al., 2023) utilized airborne LiDAR data to investigate the contribution of fuel structure to fire severity under different weather conditions. They found a positive association between fuel cover in the understorey and canopy, vertical vegetation heterogeneity, and fire severity. (Zhao et al., 2023) conducted a study to map the burned area of forest fires in Chongqing using three methods: visual interpretation, dNDVI, and dNBR.The burned area was identified using various satellite images, including Sentinel-2, Landsat8, Environmental Mitigation II A (HJ2A), and Gaofen-6 (GF-6). (Shin et al., 2019; Liu et al., 2018) investigated the application of UAV multispectral images in classifying the severity of forest burn after a fire. Their findings indicate high overall accuracy for all classifiers, demonstrating the potential of multispectral remote sensing images in analyzing burn severity following a forest fire. Overall, these methods utilize a combination of various indices, thresholds, and machine learning models to accurately and efficiently identify and evaluate forest fires.
Meanwhile, machine learning methods offer numerous advantages, such as lower computational complexity, reduced need for parameter tuning, enhanced capability in classification and regression, and improved performance in integrating multi-source data (Liu et al., 2018; Xi et al., 2022). When compared to traditional parametric classifiers, machine learning methods demonstrate greater robustness and higher classification accuracy than traditional parametric classifiers (Maxwell et al., 2018). In recent years, more and more machine learning methods have been widely used in the fusion of multi-source remote sensing data. (Pourghasemi et al., 2020) utilized a Random Forest (RF) model to construct susceptibility maps for floods, landslides, and forest fires in Fars Province, Shiraz City, and its four strategic watersheds. The study found that the RF model had an AUC of 0.943 for the forest fire susceptibility map, indicating satisfactory performance in forecasting the spatial behavior of multi-hazard events. (Gigović et al., 2019) compared the performance of support vector machine (SVM) and RF models in forest fire susceptibility assessment and mapping in Serbia’s Tara National Park. The results showed that the ensemble model, which combined the prediction results of SVM and RF using Bayesian average, had an AUC of 0.848, indicating satisfactory performance in predicting forest fire susceptibility. (Gibson et al., 2020) also employed a RF machine learning framework to map fire severity in South-eastern Australia using Sentinel two imagery. The study found that fire severity could be mapped with very high accuracy, with mean accuracy rates exceeding 70% for all severity classes. The authors noted that higher canopy cover and topographic complexity were associated with a higher rate of under-prediction,highlighting the limitations of optical sensors in viewing burnt understorey of low severity classes under these conditions. Additionally, (Mohajane et al., 2021) developed hybrid machine learning algorithms for mapping forest fire susceptibility in the north of Morocco. The study found that the Random Forest-Frequency Ratio (RF-FR) model achieved the highest performance with an AUC of 0.989, demonstrating the effectiveness of the model in forecasting forest fire risk areas. Furthermore, (Grabska et al., 2020) demonstrated the potential of Sentinel-2 imagery and machine learning algorithms in mapping forest stand species in the Polish Carpathian Mountains. The study also found that SVM outperformed other classifiers, achieving an overall accuracy of 86.9% for all variables. The authors also highlighted the usefulness of the ensemble approach in assessing classification precision, which allowed for the determination of areas with the lowest and highest precision in forest stand species mapping.
Obviously, the above mentioned studies demonstrate the effectiveness of machine learning techniques, particularly RF and SVM, in mapping forest fires, fire severity, and forest stand species. These approaches have shown promising results in accurately assessing and forecasting forest fire susceptibility and severity, providing crucial support for the management of forest ecosystems. However, it is important to note that different remote sensing data sources, spatial resolutions, spectral features, and feature classification methods can greatly affect the accuracy and results of identification. For instance, excessively high spatial resolution can lead to the reduced spectral separability of features, and the spectral information of vegetation (NDVI) on forest fire traces may be significantly diminished. Therefore, extensive efforts have been dedicated to exploring appropriate remote sensing data sources, spatial and temporal resolutions, and feature classification methods.
Furthermore,the previous focus of forest fire studies has primarily been on the use of traditional optical remote sensing imagery, such as MODIS, Landsat-8, and Sentinel-2, for mapping burning or burned areas and assessing losses (Hu et al., 2021; Huang et al., 2016; Navarro et al., 2017; Quintano et al., 2018; Zhang et al., 2018; Roteta et al., 2019). However, these optical remote sensing techniques have limitations. They can experience signal saturation and are sensitive to meteorological conditions like fog, clouds and rain (Luo et al., 2023). In addition, with MODIS and Landsat-8 satellite images with larger pixel dimensions, the burnt areas can be often overestimated, due to the fact that the pixel size is large and therefore, when a whole pixel is not burnt, it can be classified as burnt. On the other hand, microwave radar, like the one on the Sentinel-1 satellite, can operate in any weather condition, making it a valuable tool for estimating forest topographic features (Xi et al., 2022; Luo et al., 2023). Notably, the launch of the Sentinel-2 satellite in 2015 has made it popular due to its ability to provide global optical data with a short revisit period, which enhances the monitoring of forest system dynamics on a global scale (Xi et al., 2022). Thus, our study fully considers combining Sentinel-1B SAR imagery and Sentinel-2A optical data to achieve higher temporal and spatial resolutions with rich spectral information. To our knowledge, there have been limited studies on using Sentinel-1B and 2A imagery data for active forest fire detection or mapping (Hu et al., 2021).
In the comparative study for this, recent research has primarily concentrated on the utilization of machine learning algorithms for forest fire prediction and susceptibility mapping. (Tehrany et al., 2019) carried out a comparative case study in the Lao Cai region of Vietnam, assessing the effectiveness of the LogitBoost ensemble-based decision tree (LEDT) machine learning method for forest fire susceptibility mapping. The study revealed that the LEDT model exhibited the highest performance, achieving a 92% prediction capability. (Thach et al., 2018) also conducted a comparative study in the Thuan Chau district of Vietnam, employing advanced machine learning algorithms such as SVM, RF, and Multilayer Perceptron Neural Network (MLP-Net). The results indicated that the MLP-Net model demonstrated the best prediction performance, followed by the RF model and the SVM model. Similarly, (Eskandari et al., 2020) evaluated the accuracy of individual and hybrid machine learning models for predicting fire hazard in the Golestan Province, Iran, with the RF model emerging as the most accurate. (Preeti et al., 2021) investigated forest fire prediction using various machine learning techniques, finding that Random Forest regression and Hyperparameter tuning with RandomizedSearchCV produced the most favorable outcomes. (Chang et al., 2020) conducted a comparative analysis of machine learning techniques for fire prediction, with the random forest model exhibiting the highest accuracy and the neural network model achieving the best F1 Score. (Pacheco et al., 2021) evaluated the performance of the k-Nearest Neighbor (kNN) and Random Forest (RF) classifiers for mapping forest fire areas in central Portugal. They used Landsat-8, Sentinel-2, and Terra imagery. The classifiers based on the kNN and RF algorithms showed satisfactory results, with an overall accuracy (OA) ranging from 89% to 93%. (Sun et al., 2022) developed a forest fire susceptibility model based on the Light Gradient Boosting Machine (LightGBM) algorithm, demonstrating superior performance compared to logistic regression (LR) and RF models in terms of F1-score, accuracy, and area under the curve (AUC). However, these comparative studies focus solely on the application of machine learning algorithms for forest fire prediction and susceptibility mapping, rather than analyzing forest burning and burnt fire areas.
Therefore, the motivation of this study was to evaluate the adaptability of machine learning algorithms in more various scenarios, considering different classification algorithms, feature combinations and three forest-fire periods. Three commonly used algorithms (SVM, RF, and NN) were utilized to extract and map the burning and burnt area of forest fires using Sentinel-1B and 2A images from Xintian County, China. The research has two main objectives: (i) assess the performance of three commonly used machine learning classifiers - SVM, RF, and NN - when applied to Sentinel-1B and 2A images across different forest fire periods in the study area; and (ii) investigate how spectral reflectance characteristics, vegetation index properties, and radar attributes impact the accuracy of forest fire area extraction results produced by these classifiers. By conducting a comparative analysis of the methodologies used in this study, our goal is to offer technical support for precise mapping of forest fire areas and post-disaster assessments, while also facilitating recovery efforts in forest vegetation.
Because of this, we have obtained three Sentinel-1B and Sentinel-2A images (in three periods of pre-fire,during-fire and post-fire) to evaluate the burnt areas in Xintian County, China corresponding to fires produced during October 2022. The Sentinel-1B satellite uses C-band radar data to acquire high-resolution surface observations under all weather conditions. The long wavelength of the radar image allows for better penetration of clouds and smoke from fires. On the other hand, the Sentinel-2A’s high spatial resolution, allows us to assess the degree of fire heterogeneity, exhibiting the great potential for studying fine-scale heterogeneity in fire-effects across large areas. The remaining sections of this paper are organized as follows. Section 2 presents the study region and methods. Comparative experiments and analysis are conducted in Section 3. In Sections 4, 5, we summarize our research while discussing its future work.
2 Materials and methods
2.1 Study area
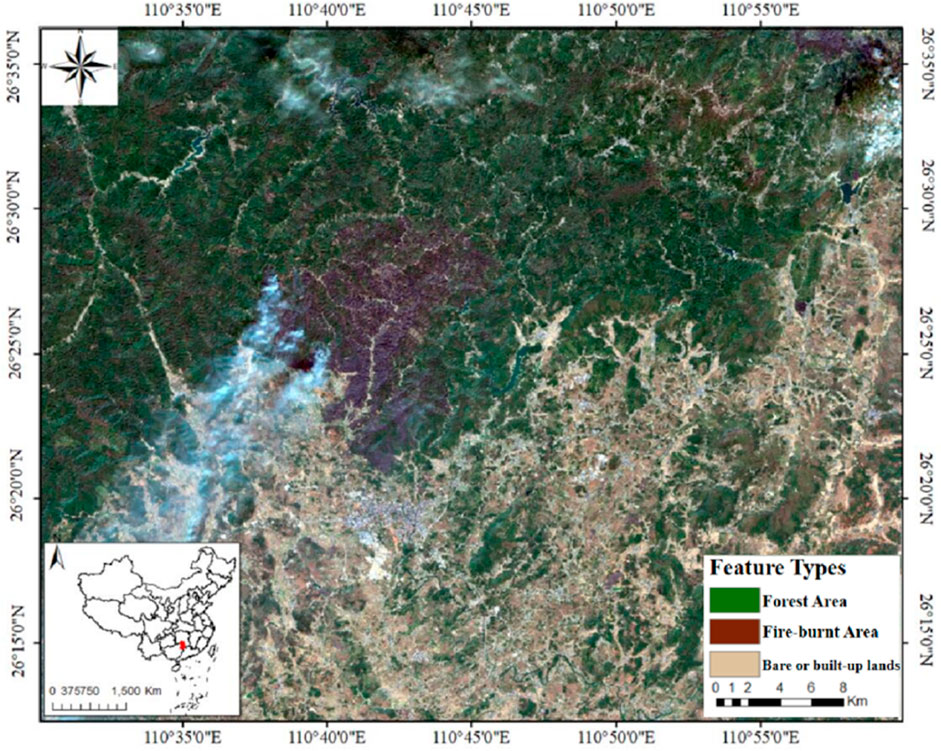
The study area for this research is Xintian County, China, where a severe forest fire occurred on 17 October 2022 (as shown in Figure 1). The county spans an area of 1,022.4 km2 and is situated at the southern edge of Hunan Province, China. Its geographic coordinates range from 25°47′N to 26°47′N and 111°29′E to 112°15′E. Here, Xintian County is characterized by hilly and mountainous terrains, with abundant vegetation, particularly in the mountainous regions. The vegetation types in the area include coniferous forests, broad-leaved forests, and bushes. The combination of high temperatures, low precipitation, and monsoon conditions during the summer and fall seasons contributes to the dryness of the vegetation, making it susceptible to ignition and increasing the risk of wild fires, such as the severe forest fire event in Xintian County. To determine the extent of the forest fire, satellite images from the Sentinel-1/2 satellite were obtained, with images taken before the fire on October 14, during the fire on October 19, and after the fire on 24 October 2022.
2.2 Architecture
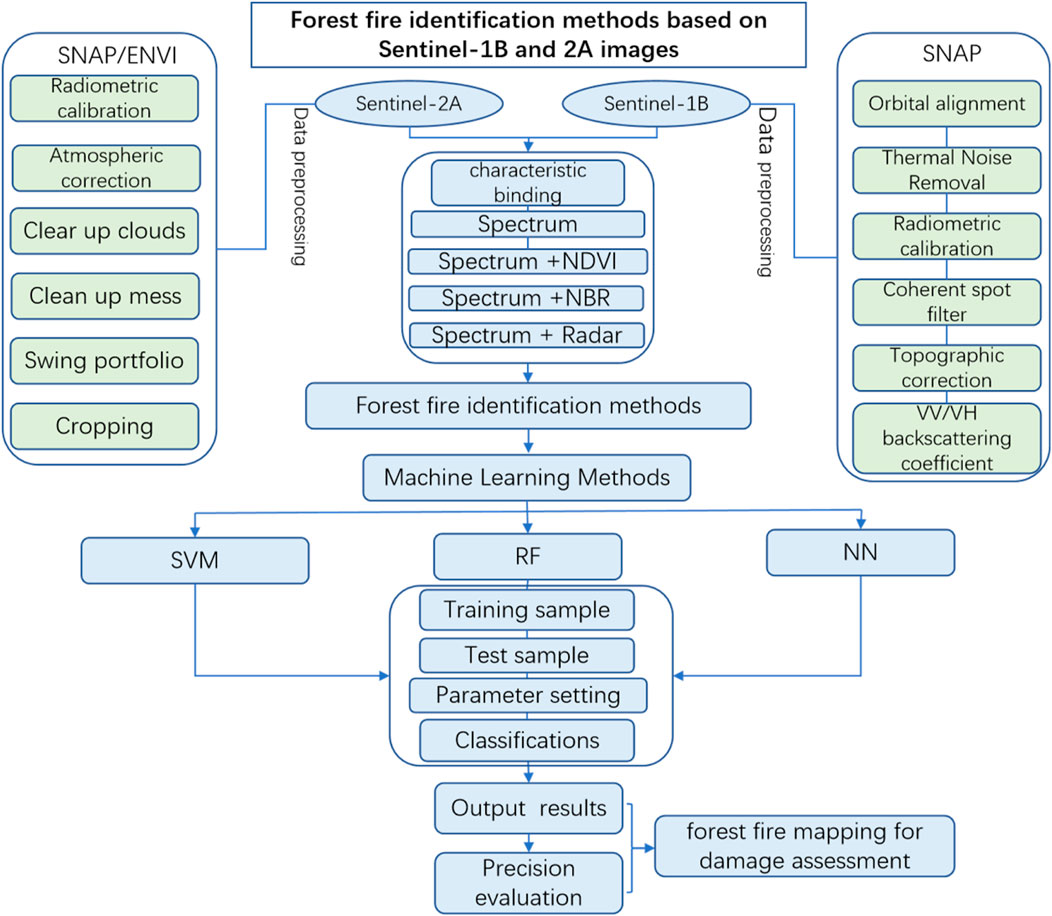
The overall workflow architecture of this study is illustrated in Figure 2. The forest-fire identification and loss assessment process comprises five stages. Firstly, data preprocessing is conducted using SNAP and ENVI software to reduce noise and smoke interference, and enhance image quality for Sentinel-2A and Sentinel-1B images respectively. Secondly, appropriate combinations of spectral features (e.g., NDVI index) and radar back-scattering coefficient are selected. Thirdly, machine learning methods, specifically SVM, RF, and NN, are employed to identify forest fire areas during the three periods of pre-fire, fire-during, and post-fire stages. Fourthly, accuracy evaluation is performed by selecting training and test samples for classification parameter setting, followed by classification and assessment of accuracy using the test samples. Lastly, the forest-fire damage area is assessed by selecting optimal parameters and methods for comparative recognition before and after the forest fire, and conducting statistical analysis.
2.3 Data preprocessing
The Sentinel-1B and 2A image data in this study area were obtained from the official website of the European Union Aviation Safety Agency (EASA). Sentinel-1B primarily acquires radar data. The data should undergo preprocessing steps including orbit correction, thermal noise removal, radiometric calibration, coherent spot filtering, and terrain correction. The VV/VH backscatter coefficients were then computed as radar characteristic variables. For this study, the radar backscatter coefficient was extracted from the Sentinel-1B IW imagery of the post-fire area in Xintian County, China on 24 October 2022.
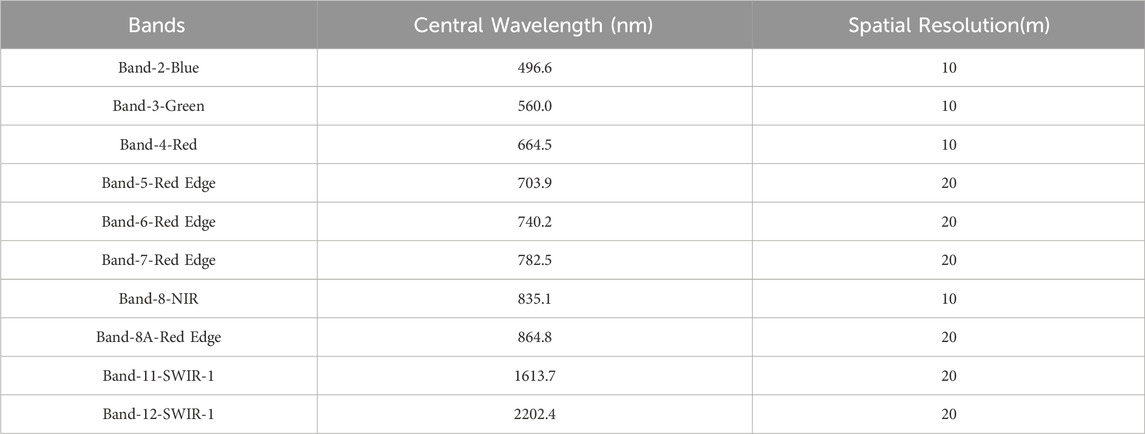
In addition, Sentinel-2A is to acquire optical remote sensing image data. The acquired data is processed using SNAP software to perform various tasks such as radiometric calibration, atmospheric correction, de-clouding, de-smoking, band combining, and image cropping. The processed data is then used to establish spectral features (NDVI, NBR) and their corresponding feature sets. For this study, we selected the L2A-level data product of Sentinel-2A located in the Xintian County,and captured during three phases: fire-before (14 October 2022), fire-during (19 October 2022), and fire-post (24 October 2022). These images were used to compare the accuracy of identification across the three phases. The parameter information of each band from Sentinel-2A is shown in Table 1. Here,the three bands unrelated to vegetation growth (Band-1,Band-9 and Band-10) were removed.
2.4 Classification characteristics of forest fires
Utilizing Sentinel-1B and 2A imagery, this study categorized features into three groups: (1) Multispectral features from Sentinel-2 images (Spectrum); (2) Vegetation index characteristics (including commonly-used NDVI and NBR); and (3) Radar characteristics from Sentinel-1B imagery. By analyzing these sets of characteristics and their combinations, the study investigated the effectiveness of three machine learning algorithms (SVM, RF, and NN) in identifying and mapping forest fire areas.
2.4.1 Vegetation indices
(1). The Normalized Difference Vegetation Index (NDVI) is a spectral index commonly used in remote sensing imagery to assess vegetation cover and growth status. It is widely utilized in various fields related to vegetation cover or vegetation change. The NDVI index is calculated by comparing the reflectance of the red-light band with that of the near-infrared band, using the following formula (Equation 1):
where NIR is the reflectance of the near-infrared band and RED is the reflectance of the red-light band. The NDVI value typically ranges from −1 to 1, with a higher value indicating greater vegetation cover and better forest growth. However, when a forest fire occurs, the vegetation undergoes significant damage, resulting in a dramatic decrease in the NDVI index. In this research, we propose a feature combination scheme that utilizes both spectral features and NDVI index for classifying forest fire recognition.
(2). The Normalized Burn Ratio (NBR) is an index used to assess the loss of vegetation cover caused by forest fires. It measures the standardized burn ratio by comparing the difference in reflectance between the near-infrared (NIR) and short-wave infrared (SWIR) bands. The NBR index is a valuable tool for indicating the extent of vegetation loss. The formula for calculating the NBR index is (Equation 2):
where NIR is the reflectance of the near-infrared (NIR) band and SWIR is the reflectance of the short-wave infrared (SWIR) band. In general, the value of NBR index ranges from −1 to 1, with higher values indicating more severe vegetation loss. In this research, The NBR index can be used to extract and identify the vegetation loss in combination with spectral features.
2.4.2 Radar bands
Radar remote sensing image data also plays a crucial role in forest fire monitoring. Unlike optical remote sensing images, radar images have the advantage of longer wavelengths, which makes them less susceptible to interference from clouds, fog, and smoke caused by forest fires. The radar backscatter coefficient in the data can be utilized to extract fire-point information and identify the trajectories of fire burning. During a forest fire, the fire point typically exhibits a higher backward scattering coefficient compared to the surrounding features. Additionally, the backward scattering coefficients of the fire-burned area undergo significant changes, allowing for the extraction and identification of the fire burning areas. In this study, the radar backward scattering coefficient is combined with spectral features as part of the feature parameters. This combination aims to enhance the classification accuracy of machine learning methods and improve the precision of forest fire recognition.
2.5 Classification algorithms from machine learning
2.5.1 Support vector machine (SVM)
Support Vector Machine (SVM) is a supervised learning algorithm commonly used for identifying and monitoring the trajectories of forest fires. The fundamental principle of the SVM algorithm is to find an optimal hyperplane that maximizes the difference between classes. In higher dimensional space, SVM aims to find an optimal hyperplane to correctly separate different types of points. This is achieved by maximizing the spacing. In cases where the data in the original feature space is not linearly separable, we can use a Kernel function to map the data to a higher dimensional space and then perform classification. The main advantage of SVM is its ability to efficiently handle high-dimensional and small sample data, as well as effectively deal with nonlinear problems. However, SVM does have some limitations, such as higher computational complexity and longer training and classification times for large-scale data. Additionally, as the number of sample categories increases, there may be a decline in classification accuracy.
The objective function of the SVM model, which is a hyperplane, his formula can be expressed as:
Where Φ(x) in Equation 3 is the Kernel function, which is equivalent to a dimensional transformation of x. If we can correctly classify the existence of hyperplanes for all sample points, we can go ahead and predict the sample points, and the corresponding decision function, which is the function used for prediction. The formula is as follows (Equation 4):
When the sample points are classified correctly (Equation 5):
The core idea of Support Vector Machine (SVM) is to find the optimal hyperplane that separates the samples and maximizes the distance between the hyperplane and the closest points. The formula for solving the optimal hyperplane is as follows (Equation 6):
2.5.2 Random forest (RF)
Random Forest (RF) is a classification method that combines decision trees with randomness. The RF principle involves using bootstrap sampling from the original training set. Each set of data is processed using the decision tree algorithm, where a subset of characteristics is randomly selected from the entire set, scored, and the optimal characteristics are chosen. The RF integration method is then used to classify the data, with the results being counted through voting. The final result is determined by the classification with the highest number of votes. In regression models, the final prediction value is obtained by calculating the average of the prediction results from each tree. During the construction of an RF model, the importance of each feature can be assessed. This is typically done by considering the number of times a feature is used in the decision tree and the accuracy of the node splits. By combining multiple decision trees, RF reduces the risk of overfitting and improves generalization. In comparison to the SVM method, RF is better suited for handling large-scale datasets and evaluating feature importance.
2.5.3 Neural network (NN)
The Neural Network (NN) algorithm is a widely used method in the field of machine learning that aims to simulate the information transfer and processing between neurons in the human brain. The basic structure of the NN method consists of an input layer, one or more hidden layers, and an output layer. The input layer receives external remote sensing image data, the hidden layer extracts features by learning from training samples and reasoning about them, and the output layer generates the final classification results. During the training process, the NN algorithm continuously adjusts the weight of each neuron node based on labeled sample information to improve the accuracy and prediction ability of input data classification. The iterative training method enables the neural network algorithm to learn and discover patterns within the data. The trained model allows the neural network to classify or predict input data, resulting in improved classification results.
2.5.4 Comparison of methods
SVM, RF and NN are three widely used machine learning algorithms for classification and regression. Among them, SVM achieves classification by finding hyperplanes that maximize the class distance, which is suitable for small datasets and high-dimensional sparse data, and has good generalization ability. The advantage of SVM is that it performs well on a small number of samples, while the disadvantage is that it is slower to train on large data and requires special treatment for multi-categorization problems. RF integrates a large number of decision trees and votes to achieve classification results, which has strong noise immunity and high-dimensional processing ability, is suitable for large data, and naturally supports multi-categorization. The advantage of RF is that it performs stably on the task with diverse features and is not easy to overfit, but it requires more computational resources due to the high complexity of the model. NN, on the other hand, realizes the learning of complex features through multi-layer neuron connections and non-linear activation functions, which is particularly suitable for large datasets and feature-rich tasks such as image classification and natural language processing. Its advantage lies in the strong expressiveness and scalability of the model, which is suitable for multi-categorization and complex regression tasks, but its disadvantage lies in the high computational resources required for training, and it is prone to overfitting or gradient disappearance. Finally, the main difference between the three methods lies in the data requirements and applicable scenarios: the SVM method is suitable for small data sets and is more sensitive to features, while the RF method performs stably on high-dimensional data and large data of four scales, and the NN method is suitable for large data and complex features. Overall, SVM, RF, and NN have advantages in high-dimensional data processing, but each has its own strength.
2.6 Training sample datasets
The training dataset was compiled using raw Sentinel-2 data and visually interpreted through high-resolution imagery from Google Earth, as showing in Figure 3. Training sample data was collected utilizing the Regions of Interest tool in the ENVI 5.6 Toolbox. The number of pixels for each land cover class varied due to differences in polygon sizes. For both training and test samples, 550 samples were selected from each of the three categories during the forest pre-fire period: forest, water body, bare land, and other ground features. In the forest during-fire and post-fire period, 550 samples were chosen from each of the five categories: fire points, burned areas, forests, water bodies, bare land, and other features. The verification sample datasets are mainly field survey data, although it also refers to Google images for visual interpretation.
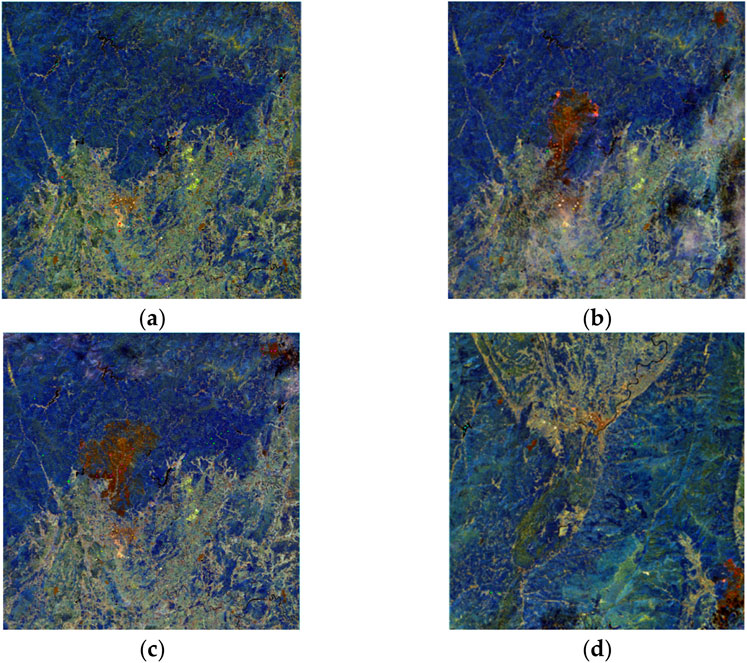
Figure 3. The training dataset from raw Sentinel-2 data in different periods. (A) In the early stage of forest fire (4 October, 2022); (B) In the middle stage of forest fire (9 October, 2022); (C) in the post stage of forest fire (4 October, 2022); and (D) The test dataset samples.
3 Results and analysis
This study utilized four combinations (Spectrum, Spectrum-NDVI, Spectrum-NBR, and Spectrum-Radar) with three classifiers (SVM, RF, and NN) across pre-fire, during-fire, and post-fire stages. To evaluate classifier accuracy, metrics such as overall accuracy (OA), user accuracy (UA), and producer accuracy (PA) were calculated based on validation samples (Zhang C. et al., 2023). These metrics were used to compare the effectiveness of the algorithms in extracting forest fire-related areas across different feature combinations.
3.1 Results of pre-fire feature classification
The identification of features in the pre-fire state of a forest can serve as a reference map for computing and assessing the area after forest fires. The land cover types were categorized into three groups: forests (forest), water areas (water), and bared or built-up lands (others), based on the actual situation before the forest fire. Table 4 illustrates the accuracy of the forest land types for the three feature combinations (Spectrum, Spectrum-NDVI, Spectrum-NBR) and three classifiers (SVM, RF, and NN). Among the three feature combinations, the SVM algorithm of the Spectrum and NDVI achieved the highest overall accuracy (OA) at 93.52% with the best Kappa coefficient of 0.8966, while the RF algorithm had the lowest OA, followed by the NN. Additionally, the classification accuracy for forest areas outperformed that of water areas, while the accuracy for the ‘others’ type was poor (PA < 92.05%). In comparison to the other two feature combinations, the SVM algorithm in the combination of spectrum and NBR maintained the highest User’s Accuracy (UA) at 100% for water areas and Producer’s Accuracy (PA) at 92.05% for bared/built-up lands.
The spatial distribution results of classification are illustrated in Figure 4. With fewer categories of features, the classification results show similarities and lack significant differences. The classification outcomes from the three algorithms, utilizing spectral features alone, spectral and NDVI indices, and spectral and NBR indices, exhibit no discernible variations, suggesting that all three algorithms offer distinct advantages. This phenomenon can be attributed to the fact that forests and bared/built-up lands collectively constitute 90% of the area, with clear and well-defined spatial distribution boundaries for these two categories, resulting in minimal omissions or misclassifications in their classification results.

Figure 4. Spatial classification results based on the imagery of forest pre-fire. (9 October, 2022).
3.2 Results of during-fire feature classification
To enhance the identification of forest fire features and monitor the spread of forest fires, forest fire-related information is categorized into five groups during a forest fire event: forest areas (forest), burning-fire areas (burning),burnt-fire areas (burnt), water areas (water), and Bare or built-up lands (others). Comparison of the classification results between forest pre-fire data (Table 2) and forest during-fire image data (Table 3) reveals improved accuracy in terms of PA, UA, and OA. As shown in Table 3, the RF algorithm exhibited subtle advantages over the other two algorithms. Among the different feature combinations, the combination of Spectrum integrated with NBR achieved the highest OA of 95.43%, UA of 100% on burnt areas, and UA of 98.63% on burning areas, particularly with the assistance of the RF algorithm. This highlights the sensitivity of the NBR index to forest fire characteristics and its ability to enhance the accuracy of identifying forest fire areas.
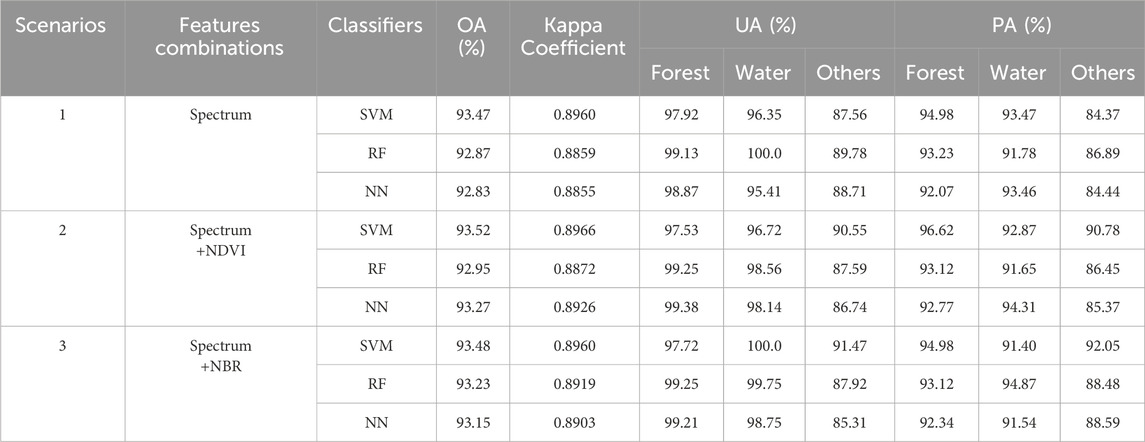
Table 2. The land cover types classification accuracy of three classifiers based on three spectrum combinations in the pre-fire period.

Table 3. The forest fire-related information classification accuracy of three classifiers based on three spectrum combinations in the during-fire period.
The results of spatial distribution classification during the fire period are presented in Figure 5. The SVM, RF, and NN algorithms demonstrate high accuracy in identifying forest fire-burnt areas and fire-burning areas using spectral features alone, as well as in combination with NDVI or NBR features. The classification results still show similarities and lack significant differences. Meanwhile, the RF algorithm, when combined with spectral and NBR index features, shows slightly brighter colors in fire burning areas (highlighted in red) compared to the other two algorithms, which can aid in monitoring the location and spread of fires.

Figure 5. Spatial classification results based on the imagery of forest during-fire (9 October, 2022).
3.3 Results of post-fire feature classification
The identification of post-fire information is crucial for assessing damage. Based on the actual situation of post-fire features, these elements can be classified into four categories: forest areas (forest), burnt-fire areas (burnt), water areas (water), and bare or built-up lands (others). Table 4 shows that after adding radar features to multi-spectrum data, the classification effectiveness of the four types of ground objects improved when compared to adding NDVI or NBR. The SVM algorithm of the Spectrum and Radar achieved the highest overall accuracy (OA) at 94.97% with the best Kappa coefficient of 0.9287, while the NN algorithm had the lowest OA, followed by the RF. Additionally, the SVM algorithm demonstrated higher accuracy than the other two algorithms in certain categories. Notably, Table 4 also reveals a significant decrease in accuracy for both water and bare/built-up lands compared to the results from the pre-fire period (refer to Table 2), which are related to mis-classifications.
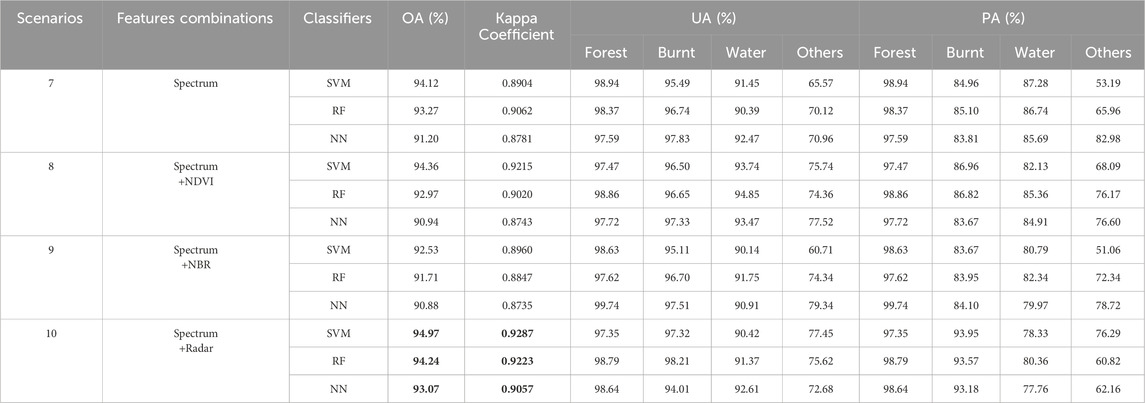
Table 4. The forest fire-related information classification accuracy of three classifiers based on three spectrum combinations in the post-fire period.
The spatial distribution classification results in the post-fire period are illustrated in Figure 6. Overall, the classification outcomes of the three algorithms utilizing various feature combinations exhibit a high level of similarity. This suggests that all three algorithms maintained their effectiveness in identifying and categorizing features even after a forest fire. Notably, among the three feature combinations, the combination of Spectrum and radar features displays a clearer classification texture compared to the other two. Nevertheless, there may be challenges in mistakenly delineating water bodies within forested areas, as highlighted in red rectangular box.
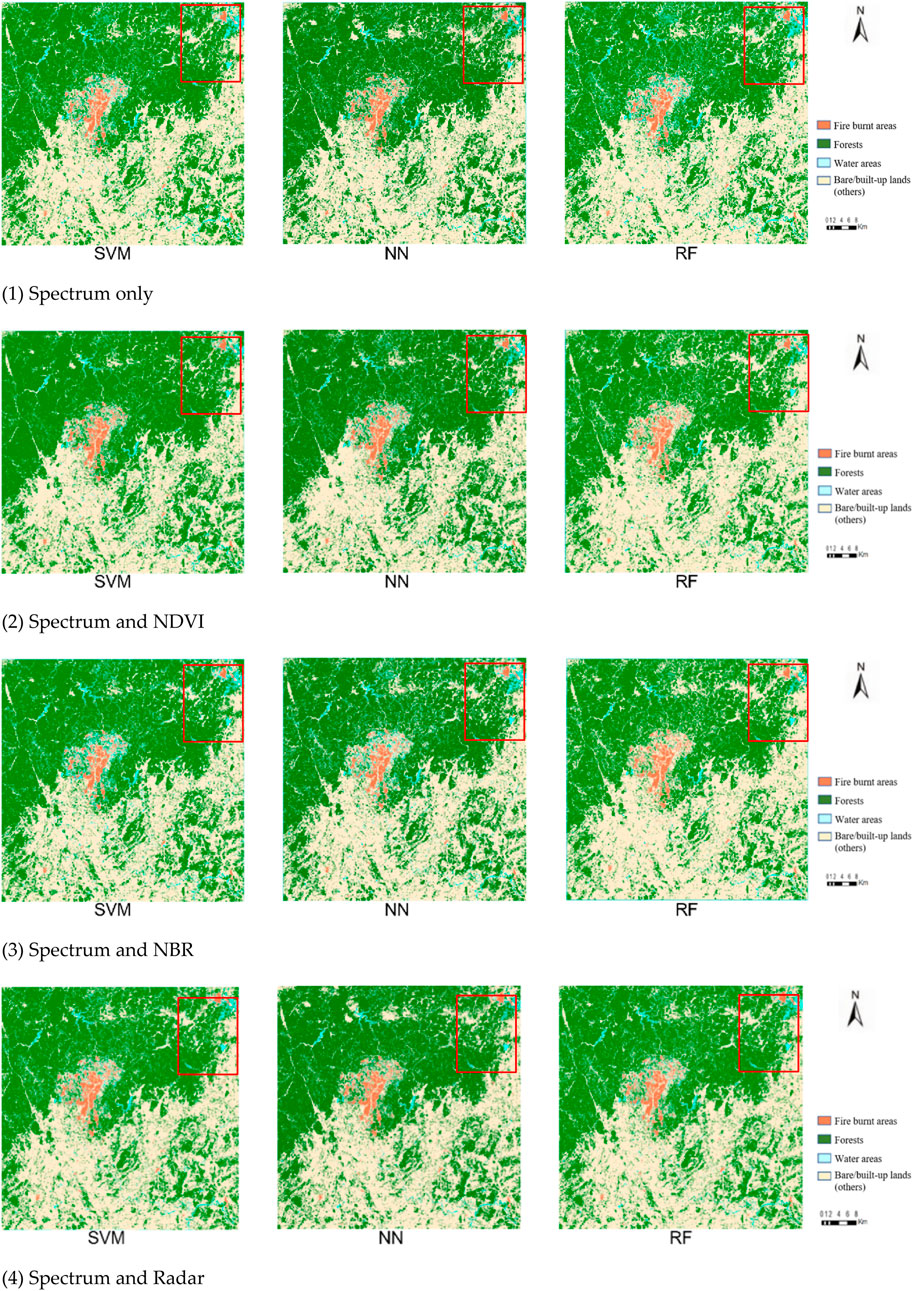
Figure 6. Spatial classification results based on the imagery of forest post-fire. (4 October 4, 2022).
3.4 Forest fire mapping and assessment
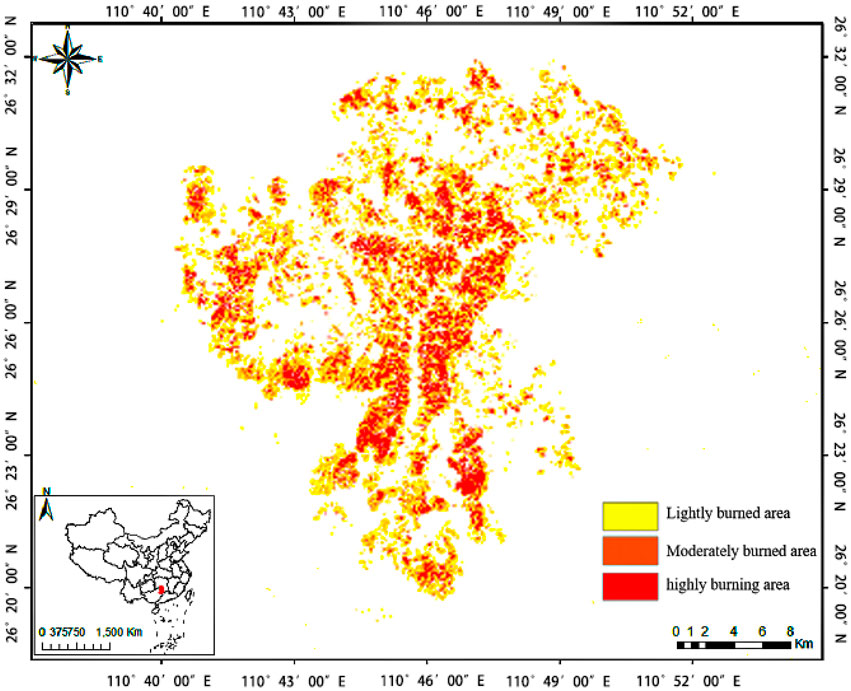
This comparative experiment aimed to assess the severity and extent of a forest fire in the study area by employing a composite index and appropriate classification method. The most accurate method and feature combination were chosen by comparing the results of forest fire classification. GIS overlay analysis was utilized to examine the feature classification outcomes of the Xintian County area in China before and after the forest fire, effectively identifying the impacted area. Initially, prior to the forest fire, a suitable combination of spectral and NDVI features was used to determine forest density class and its range through thresholding. Subsequently, remote sensing images with optimal spectral and radar features were employed after the fire to generate a forest land mask and detect change areas using the SVM algorithm and IR-MAD change detection tool. Following this, the severity levels of fire trails were computed by overlaying the GIS analysis with a map layer displaying these trails.
The results of forest-fire mapping and assessment are illustrated in Figure 7. According to statistical data, the forest fire in Xintian County, China, known as the “10.17 Forest Fire Event” given by local government, had a significant impact on the region. The fire resulted in 31,358 pixels in mildly affected areas, 58,083 pixels in moderately affected areas, and 38,599 pixels in severely affected areas. The remote sensing imagery used in this analysis had a spatial resolution of 20 m. Based on this data, it is estimated that the mildly affected area covers approximately 1,154.32 ha, the moderately affected area spans around 2,123.32 ha, and the severely affected area encompasses roughly 1,243.96 ha. Therefore, the total impacted region measures approximately 4,521.6 ha. During the process of fighting the Xintian forest fire, which was a particularly significant event due to its scale, more than 4,000 individuals bravely fought on the front line. Tragically, two firefighters named Cai Maoqiang and Xiao Jianqiang lost their lives in the line of duty.
4 Discussions
4.1 Classification effect of machine learning in pre-fire period
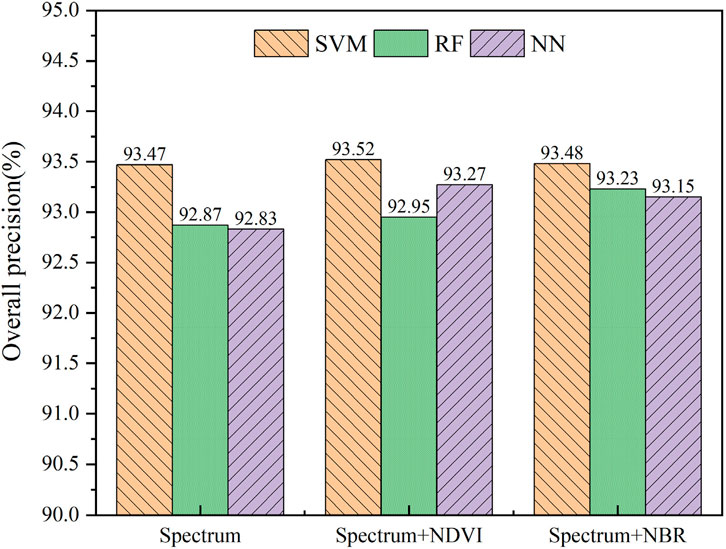
According to the classification overall accuracy and Kappa coefficient results (seeing in the Table 2) shown in Figure 8, the accuracy differences can be observed as follows: (i). When considering only the spectral features, the overall accuracy (OA) of the SVM, RF, and NN algorithms among the three machine learning methods are 93.47%, 92.87%, and 92.83%, respectively. The SVM algorithm has the highest accuracy. (ii). By using the combination of spectral and NDVI indices, the overall accuracy of classification slightly improved compared to using spectral features alone. The OA of the SVM, RF, and NN algorithms were 93.52%, 92.95%, and 93.27%, respectively. (iii). When comparing the feature combinations of spectra and NBR indices to the feature combinations of spectra and NDVI indices, there were differences in the changes in the OA of the three algorithms’ classifications. The RF algorithm showed continued improvement in accuracy, while the SVM, RF, and NN algorithms slightly decreased in accuracy. The OA of the three algorithms were 93.48%, 93.23%, and 93.15%, respectively.
Overall, the feature combination using spectral and NDVI indices achieved the highest classification accuracy and was more effective in recognizing and classifying forest land. Previous studies have shown that NDVI can significantly reflect vegetation cover and plant physiological status (Tucker et al., 1979 (Tucker, 1979);). On the other hand, the machine learning classification using only multi-spectral features had the lowest accuracy. Among the three machine learning methods, the SVM method had higher classification accuracy than the other two methods in all three feature combinations. The SVM method achieved the highest of recognition accuracy of 93.52% when using the combination of spectral and NDVI indices.
4.2 Classification effect of machine learning in during-fire period
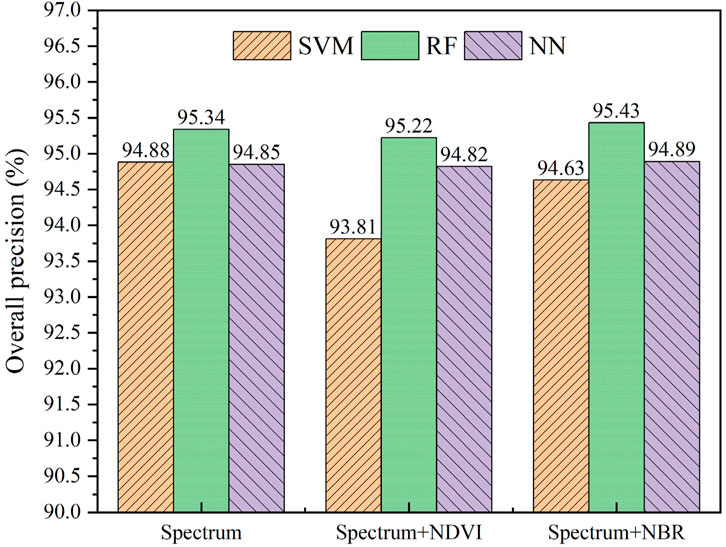
Based on the classification overall accuracy and Kappa coefficient results (seeing in the Table 3) as shown in Figure 9, further differences can be observed. Firstly, when considering spectral features alone, the SVM, RF, and NN algorithms achieved overall accuracy (OA) of 94.88%, 95.34%, and 94.85%, respectively. The RF algorithm exhibited the highest accuracy among the three methods. Secondly, when combining spectral and NDVI indices, the SVM algorithm showed the fastest decrease in accuracy, reaching only 93.81%, while the RF and NN algorithms experienced slight decreases in OA at 95.22% and 94.82%, respectively. Thirdly, when combining spectral and NBR indices, the accuracy slightly improved compared to the previous feature combinations. The overall accuracy of the SVM, RF, and NN algorithms in this case was 95.43% and 94.89%, respectively.
In general, during the forest fire, the feature combination using spectral and NBR indices from Sentinel-2A optical remote sensing imagery achieved the highest classification accuracy and demonstrated better performance in recognizing and classifying fire points and fire trails in forest fires. The NBR index is a valuable tool for indicating the extent of vegetation loss. This is quite consistent with previous research results (Sukojo and Arimurti, 2021). On the other hand, the use of spectral features and NDVI resulted in lower accuracy, more misclassification cases, and misclassification of fire points and fire trails as buildings or other land. Among the three machine learning algorithms, SVM exhibited the lowest accuracy for classifying features in forest fires, while RF outperformed the other two methods in all three feature combinations. Notably, the RF algorithm achieved the highest OA of 95.43% when using the combination of spectral and NBR features, indicating that the inclusion of the NBR burning index as a feature parameter enhances forest fire identification.
4.3 Classification effect of machine learning in post-fire period
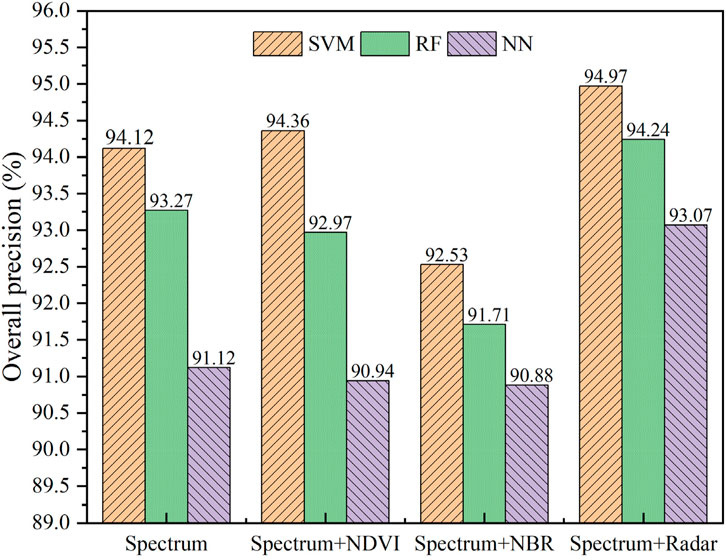
Based on the results of the overall accuracy and Kappa coefficient of classification (seeing in the Table 2), as shown in Figure 10, the differences in the accuracy of the classification of features in the scene after the forest fire can be further verified: (i). When considering the spectral features alone, the overall accuracy (OA) of the SVM, RF, and NN algorithms among the three machine learning methods are 94.12%, 93.27%, and 91.12%, respectively. The SVM algorithm has the highest accuracy, while NN has the lowest. (ii). When the spectral features and NDVI indices are combined, the accuracy of the SVM algorithm slightly increases to 94.36% compared to using spectral features alone. However, the RF and NN algorithms show a slight decrease in accuracy, with overall accuracy of 92.97% and 90.94%, respectively. (iii). The combinations of spectral and NBR indices have the lowest accuracy among the three algorithms. The overall accuracy of the SVM, RF, and NN algorithms for these feature combinations are 92.53%, 91.71%, and 90.88%, respectively. (iv). The acquisition of radar data from Sentinel-1 during the time range of forest fire occurrence leads to the highest accuracy for the SVM, RF, and NN algorithms when combined with spectral features. The overall accuracy of the three algorithms for this feature combination is 94.97%, 94.24%, and 93.07%, respectively.
In a word, in the post-fire period, the combination of spectral and radar backward scattering coefficients from Sentinel-1B imagery yields the highest classification accuracy, particularly for recognizing fire trails in forest fires. It also exhibits the highest Kappa coefficient. On the other hand, the machine learning classification using spectral features and the NBR index combination scheme has a lower accuracy with more omissions and misclassifications. Among the three machine learning methods, the SVM algorithm consistently achieves higher classification accuracy compared to the other two methods across all feature combinations. In fact, the SVM algorithm achieves a recognition accuracy of 94.97% when using the combination of spectral and radar backscattering coefficients. This demonstrates that utilizing spectral and radar backscattering coefficients as feature parameters greatly enhances the recognition accuracy of forest fire areas.
In summary, this study clearly demonstrates differences in the performance of SVM, RF, and NN models when applied to multi-spectral features, vegetation features, and Radar features during three distinct periods of forest fires. The experimental results highlight the importance of selecting appropriate combinations of feature parameters and machine learning methods to effectively enhance the recognition rate of forest fires in remote sensing images before, during, and after fire events. Notably, SVM exhibited remarkable stability across all phases of forest fires; This result is consistent with the previous study (Zhang C. et al., 2023). however, the RF model showed superior performance specifically during the fire period when combined with spectrum and NBR index. On the other hand, three classifier algorithms in the combination of spectrum and radar demonstrated the best performance more than other combinations or Spectrum when carrying on extracting the forest post-fire areas. The result implicate that the radar characteristics from Sentinel-1A can improve the identification accuracy of the burnt fire area, which is neglected in the previous studies. These findings provide robust technical support and empirical evidence for subsequently mapping and assessing forest fire areas and damages.
The study still has some shortcomings and there is a need to broaden comparative research on new methods. The comparison methods primarily aim to enhance the practical value of both traditional machine learning methods (such as SVM, RF, NN) and newer methods (such as KNN, MLP, deep learning) through their expansion. In future studies, researchers can diversify remote sensing data sources by incorporating multiple sources and examining how different data sources affect recognition accuracy when using the same method. When selecting feature parameters, it is crucial to consider a variety of parameters, including the red edge band of Sentinel-2B, as well as index features that demonstrate higher sensitivity to forest fires. Moreover, future research could explore integrating additional quantifiable features such as topography and forest vegetation types.
5 Conclusion
This study aimed to explore the applicability of machine learning techniques in more various scenarios, with a specific focus on accurately extracting and mapping the forest fire areas using the Sentinel-1B and 2A images. Three commonly used machine learning algorithms (SVM, RF, and NN) were applied to Sentinel-1B and 2A images. The key findings are summarized as follows: (i) SVM, RF, and NN exhibit robust strengths in analyzing remote sensing images related to forest fires, with performance varying based on the combination of features utilized. SVM consistently outperforms the other methods, achieving the highest accuracy of 93.52% when spectral and NDVI index features are combined in the pre-fire period. (ii) In the context of remote sensing images of forest during-fires, RF shows slightly better performance compared to the other algorithms, particularly when considering different feature combinations. The RF algorithm excels in detecting fire-affected areas and forests, achieving the highest accuracy of 95.43% when spectral and NBR index features are combined. (iii) When focusing on remote sensing images post-forest fires, SVM demonstrates superior accuracy compared to the other methods. The highest accuracy of 94.97% is achieved when combining spectral and radar features from Sentinel-1B imagery, highlighting the effectiveness of using spectral and radar backward scattering coefficients as feature parameters to enhance forest fire recognition accuracy for forest burnt fire areas. Obviously, These findings provide robust technical support and empirical evidence for mapping and assessing forest fire areas. It has also produced more efficient and accurate acquisition of forest fire information, scientific management and effective use of forest resources.
In general, forest fires pose a significant concern due to their environmental and human safety implications. Remote sensing imagery, such as that from Sentinel-1B and 2A satellites has emerged as an indispensable tool for monitoring, analyzing, and mapping forest fire areas. With the advancements in remote sensing technology, freely available satellite-based remote sensing images from Sentinel-1B/2A or other sources now provide multi-spectral, high-resolution information, large-coverage scope and short-time revisit period. Leveraging advanced classification algorithms such as machine learning and deep learning, these images enable large-scale forest fire monitoring while accurately delivering prompt access to crucial details regarding fire location, its surrounding environment, and spread.
Data availability statement
The original contributions presented in the study are included in the article/supplementary material, further inquiries can be directed to the corresponding authors.
Author contributions
XC: Data curation, Supervision, Formal analysis, Project administration, Validation, Funding acquisition, Writing–review and editing. YZ: Data curation, Methodology, Formal analysis, Software, Writing–review and editing. SW: Formal analysis, Resources, Writing–review and editing. ZZ: Data curation, Formal analysis, Writing – original draft. CL: Data curation, Software, Writing–review and editing. JW: Data curation, Formal analysis, Resources, Writing–review and editing.
Funding
The author(s) declare that financial support was received for the research, authorship, and/or publication of this article. This research was funded the Open Fund of Hunan Geological Disaster Monitoring, Early Warning and Emergency Rescue Engineering Technology Research Center under Grant (hndzgczx2024012); and in part by Chinese National College Student Innovation and Entrepreneurship Training Program under Grant S202310534031 and Grant S202310534169.
Acknowledgments
The authors would like to express many thanks to all the reviewers.
Conflict of interest
The authors declare that the research was conducted in the absence of any commercial or financial relationships that could be construed as a potential conflict of interest.
Publisher’s note
All claims expressed in this article are solely those of the authors and do not necessarily represent those of their affiliated organizations, or those of the publisher, the editors and the reviewers. Any product that may be evaluated in this article, or claim that may be made by its manufacturer, is not guaranteed or endorsed by the publisher.
References
Abdikan, S., Bayik, C., Sekertekin, A., Bektas Balcik, F., Karimzadeh, S., Matsuoka, M., et al. (2022). Burned area detection using multi-sensor SAR, optical, and thermal data in mediterranean pine forest. Forests 13, 347. doi:10.3390/f13020347
Chang, J., Industrial, D., Yoon, J., and Lee, G. (2020). Machine learning techniques in structural fire risk prediction. Int. J. Softw. Eng. its Appl. 14, 17–26. doi:10.21742/ijseia.2020.14.1.03
Dozier, J. (1981). A method for satellite identification of surface temperature fields of subpixel resolution. Remote Sens. Environ. 11, 221–229. doi:10.1016/0034-4257(81)90021-3
Eskandari, S., Amiri, M., Sadhasivam, N., and Pourghasemi, H. R. (2020). Comparison of new individual and hybrid machine learning algorithms for modeling and mapping fire hazard: a supplementary analysis of fire hazard in different counties of Golestan Province in Iran. Nat. Hazards 104, 305–327. doi:10.1007/s11069-020-04169-4
Gale, M. G., Cary, G. J., Dijk, A. I., Yebra, M., and Untangling, F. (2023). Weather and management effects on fire severity: insights from large-sample LiDAR remote sensing analysis of conditions preceding the 2019-20 Australian wildfires. J. Environ. Manag. 348, 119474. doi:10.1016/j.jenvman.2023.119474
Gibson, R., Danaher, T., Hehir, W., and Collins, L. (2020). A remote sensing approach to mapping fire severity in SouthSouth-eastern Australia using sentinel 2 and random forest. Remote Sens. Environ. 240, 111702. doi:10.1016/j.rse.2020.111702
Gigović, L., Pourghasemi, H. R., Drobnjak, S., and Bai, S. (2019). Testing a new ensemble model based on SVM and random forest in forest fire susceptibility assessment and its mapping in Serbia’s Tara national park. Forests 10, 408. doi:10.3390/f10050408
Grabska, E., Frantz, D., and Ostapowicz, K. (2020). Evaluation of machine learning algorithms for forest stand species mapping using sentinel-2 imagery and environmental data in the polish carpathians. Remote Sens. Environ. 251, 112103. doi:10.1016/j.rse.2020.112103
Hu, X. K., Ban, Y. F., and Nascetti, A. (2021). Sentinel-2 MSI data for active fire detection in major fire-prone biomes: a multi-criteria approach. Int. J. Appl. Earth Observation Geoinformation 101, 102347. doi:10.1016/j.jag.2021.102347
Huang, H., Fan, Q., Wu, J. R., Liu, K., Mao, X., Zhang, Y. Z., et al. (2023). “Research and application of remote sensing image-based extraction technology for fire trails,” in Other conferences environmental science, computer science.
Huang, H. Y., Roy, D. P., Boschetti, L., Zhang, H. K., Yan, L., Kumar, S. S., et al. (2016). Separability analysis of Sentinel-2A Multi-Spectral Instrument (MSI) data for burned area discrimination. remote Sens. 8, 873. doi:10.3390/rs8100873
Lazecky, M., Lhota, S., Pohanková, Z., Wenglarzyová, P., and Joshi, N. (2018). Evaluation of forest loss in balikpapan bay in the end of 2015 based on sentinel-1A polarimetric analysis. IOP Conf. Ser. EARTH Environ. Sci. 169, 012026. doi:10.1088/1755-1315/169/1/012026
Liu, T., Abd-Elrahman, A., Morton, J., and Wilhelm, V. L. (2018). Comparing fully convolutional networks, random forest, support vector machine, and patch-based deep convolutional neural networks for object-based wetland mapping using images from small unmanned aircraft system. GIScience and Remote Sens. 55, 243–264. doi:10.1080/15481603.2018.1426091
Luo, Y., Qi, S., Liao, K., Zhang, S., Hu, B., and Tian, Y. (2023). Mapping the forest height by fusion of ICESat-2 and multi-source remote sensing imagery and topographic information: a case study in jiangxi Province, China. Forests 14, 454. doi:10.3390/f14030454
Maxwell, A. E., Warner, T. A., and Fang, F. (2018). Implementation of machine-learning classification in remote sensing: an applied review. Int. J. Remote Sens. 39, 2784–2817. doi:10.1080/01431161.2018.1433343
Mohajane, M., Costache, R., Karimi, F., Bao Pham, Q., Essahlaoui, A., Nguyen, H., et al. (2021). Application of remote sensing and machine learning algorithms for forest fire mapping in a Mediterranean area. Ecol. Indic. 129, 107869. doi:10.1016/j.ecolind.2021.107869
Navarro, G., Caballero, I., Silva, G., Parra, P. C., Vázquez, Á., and Caldeira, R. (2017). Evaluation of forest fire on Madeira Island using Sentinel-2A MSI imagery. Int. J. Appl. Earth Observation Geoinformation 58, 97–106. doi:10.1016/j.jag.2017.02.003
Nguyen, K.-A., Liou, Y.-A., and Ho, L.-T. (2021). A view of recent forest fire in Australia by satellite derived indices. EGU General Assem. doi:10.5194/egusphere-egu21-8562
Pacheco, A. d.P., Junior, J. A. d.S., Ruiz-Armenteros, A. M., and Henriques, R. F. F. (2021). Assessment of k-nearest neighbor and random forest classifiers for mapping forest fire areas in Central Portugal using landsat-8, sentinel-2, and Terra imagery. Remote Sens. 13, 1345. doi:10.3390/rs13071345
Pourghasemi, H. R., Kariminejad, N., Amiri, M., Edalat, M., Zarafshar, M., Blaschke, T., et al. (2020). Assessing and mapping multi-hazard risk susceptibility using a machine learning technique. Sci. Rep. 10, 3203. doi:10.1038/s41598-020-60191-3
Preeti, T., Kanakaraddi, S., Beelagi, A., Malagi, S., and Sudi, A. (2021). “Forest fire prediction using machine learning techniques,” in 2021 international conference on intelligent technologies (CONIT) (Hubli, India), 1–6. doi:10.1109/CONIT51480.2021.9498448
Quintano, C., Fernández-Manso, A., and Fernández-Manso, O. (2018). Combination of Landsat and Sentinel-2 MSI data for initial assessing of burn severity. Int. J. Appl. Earth Observation Geoinformation 64, 221–225. doi:10.1016/j.jag.2017.09.014
Robinson, J. M. (1991). Fire from space: global fire evaluation using infrared remote sensing. Int. J. Remote Sens. 12, 3–24. doi:10.1080/01431169108929628
Roteta, E., Bastarrika, A., Padilla, M., Storm, T., and Chuvieco, E. (2019). Development of a Sentinel-2 burned area algorithm: generation of a small fire database for sub-Saharan Africa. Remote Sens. Environ. 222, 1–17. doi:10.1016/j.rse.2018.12.011
Shin, J.-i., Seo, W.-w., Kim, T., Park, J., and Woo, C.-s. (2019). Using UAV multispectral images for classification of forest burn severity—a case study of the 2019 gangneung forest fire. Forests 10, 1025. doi:10.3390/f10111025
Sukojo, B. M., and Arimurti, A. S. P. (2021). Forest fire mapping using normalized burned ratio and cloud computing to calculate the losses incurred in mount lawu, magetan regency. IOP Conf. Ser. Earth Environ. Sci. 936 (1), 012002. doi:10.1088/1755-1315/936/1/012002
Sun, Y., Zhang, F., Lin, H., and Xu, S. (2022). A forest fire susceptibility modeling approach based on light gradient boosting machine algorithm. Remote Sens. 14, 4362. doi:10.3390/rs14174362
Sunar, F., and Özkan, C. (2001). Forest fire analysis with remote sensing data. Int. J. REMOTE Sens. 22, 2265–2277. doi:10.1080/01431160118510
Tehrany, M. S., Jones, S., Shabani, F., Martínez-Álvarez, F., and Tien Bui, D. (2019). A novel ensemble modeling approach for the spatial prediction of tropical forest fire susceptibility using LogitBoost machine learning classifier and multi-source geospatial data. Theor. Appl. Climatol. 137, 637–653. doi:10.1007/s00704-018-2628-9
Thach, N. N., Ngo, D. B., Pham, X. C., Nguyen, H., Thi, B. H., Nhat-Duc, H., et al. (2018). Spatial pattern assessment of tropical forest fire danger at Thuan Chau area (Vietnam) using GIS-based advanced machine learning algorithms: a comparative study. Ecol. Inf. 46, 74–85. doi:10.1016/j.ecoinf.2018.05.009
Tucker, C. J. (1979). Red and photographic infrared linear combinations for monitoring vegetation. Remote Sens. Environ. 8, 127–150. doi:10.1016/0034-4257(79)90013-0
Xi, Z., Xu, H., Xing, Y., Gong, W., Chen, G., and Yang, S. (2022). Forest canopy height mapping by synergizing ICESat-2, sentinel-1, sentinel-2 and topographic information based on machine learning methods. Remote Sens. 14, 364. doi:10.3390/rs14020364
Zhang, C., Liu, Y., and Tie, N. (2023b). Forest land resource information acquisition with sentinel-2 image utilizing support vector machine, K-nearest neighbor, random forest, decision trees and multi-layer Perceptron. Forests 14, 254. doi:10.3390/f14020254
Zhang, H. K., Roy, D. P., Yan, L., Li, Z., Huang, H., Vermote, E., et al. (2018). Characterization of Sentinel-2A and Landsat-8 top of atmosphere, surface, and nadir BRDF adjusted reflectance and NDVI differences. Remote Sens. Environ. 215, 482–494. doi:10.1016/j.rse.2018.04.031
Zhang, S., Bai, M., Wang, X., Peng, X., Chen, A., and Peng, P. (2023a). Remote sensing technology for rapid extraction of burned areas and ecosystem environmental assessment. PeerJ 11, e14557. doi:10.7717/peerj.14557
Keywords: comparative study, forest fire, machine learning, Sentinel-1B/2A, classification
Citation: Chen X, Zhang Y, Wang S, Zhao Z, Liu C and Wen J (2024) Comparative study of machine learning methods for mapping forest fire areas using Sentinel-1B and 2A imagery. Front. Remote Sens. 5:1446641. doi: 10.3389/frsen.2024.1446641
Received: 10 June 2024; Accepted: 18 November 2024;
Published: 04 December 2024.
Edited by:
Adrián Regos, Forest Technology Center of Catalonia (CTFC), SpainReviewed by:
Huiran Gao, Ministry of Emergency Management, ChinaXintao Liu, Hong Kong Polytechnic University, Hong Kong SAR, China
Bilal Muhammad, Beijing Forestry University, China
Copyright © 2024 Chen, Zhang, Wang, Zhao, Liu and Wen. This is an open-access article distributed under the terms of the Creative Commons Attribution License (CC BY). The use, distribution or reproduction in other forums is permitted, provided the original author(s) and the copyright owner(s) are credited and that the original publication in this journal is cited, in accordance with accepted academic practice. No use, distribution or reproduction is permitted which does not comply with these terms.
*Correspondence: Xinbao Chen, eGNoZW5AaG51c3QuZWR1LmNu; Yaohui Zhang, ZW1pbmVtQG1haWwuaG51c3QuZWR1LmNu; Zecheng Zhao, MTkwMTA4MDEwOEBtYWlsLmhudXN0LmVkdS5jbg==
 Xinbao Chen1,2*
 Yaohui Zhang