 Zanpin Xing1,2,3
 Xiaojun Li3*
 Lei Fan4
 Frédéric Frappart3
 Hyunglok Kim5
 Lanka Karthikeyan6,7
 Preethi Konkathi3,6Yuqing Liu3Lin Zhao8
 Jean-Pierre Wigneron3
- 1Center for the Pan-Third Pole Environment, Lanzhou University, Lanzhou, China
- 2Cryosphere Research Station on the Qinghai-Tibet Plateau, State Key Laboratory of Cryospheric Science, Northwest Institute of Eco-Environment and Resource, Chinese Academy of Sciences, Lanzhou, Gansu, China
- 3National Research Institute for Agriculture, Food and Environment (INRAE), UMR1391 ISPA, Université de Bordeaux, Bordeaux, France
- 4Chongqing Jinfo Mountain Karst Ecosystem National Observation and Research Station, School of Geographical Sciences, Southwest University, Chongqing, China
- 5School of Earth Sciences and Environmental Engineering, Gwangju Institute of Science and Technology, Gwangju, Republic of Korea
- 6Centre of Studies in Resources Engineering, Indian Institute of Technology Bombay, Bombay, India
- 7Interdisciplinary Programme in Climate Studies, Indian Institute of Technology, Bombay, India
- 8School of Geographical Sciences, Nanjing University of Information Science and Technology, Nanjing, China
Two L-band passive microwave satellite sensors, onboard the Soil Moisture and Ocean Salinity (SMOS) launched in 2009 and Soil Moisture Active Passive (SMAP) launched in 2015, are specifically designed for surface soil moisture (SM) monitoring. The first global continuous fused L-band satellite SM product based on SMOS and SMAP observations (SMOS-SMAP-INRAE-BORDEAUX, the so-called Fused-IB) was recently released to the public. Currently, the performance of Fused-IB has only been evaluated collectively over the entire data records in the study period, without specific evaluation for individual seasons. To fill this gap, this study intercompared the Fused-IB and the enhanced SMAP-L3 version 6 (SMAP-E) SM products against in situ SM data from the International Soil Moisture Network (ISMN) from 2016 to 2020 regarding the whole period and different seasons. We aim to investigate the performance of these two products at different time scales and to explore the potential eco-hydrological factors (i.e., precipitation and vegetation) driving their seasonal variations. Results show that both SM products are in good agreement with the in situ measurements, demonstrating high median correlation (R) and low ubRMSD (median R = 0.70 and ubRMSD = 0.058 m3/m3 for Fused-IB vs. R = 0.68 and ubRMSD = 0.059 m3/m3 for SMAP-E) during 2016–2020. For most land use and land cover (LULC) types, Fused-IB outperformed SMAP-E with higher accuracy and lower errors, particularly in forests, partly due to the advantage of the robust SMAP-IB (SMAP-INRAE-BORDEAUX) algorithm used to generate Fused-IB in forests, which avoids the pronounced saturation effects of vegetation optical depth caused by relying on optical information. Besides, both products had superior performances across most LULC types in summer (JJA) and autumn (SON), yet increased uncertainties were observed in forests, grasslands, and croplands during spring (MAM) and winter (DJF). These uncertainties could be mainly attributed to the effects of vegetation growth in forests, grasslands and croplands, and the interception of water from rainfall events in grasslands. The results of this study can serve as a reference for algorithm developers to enhance the accuracy of SM and thus promote hydro-meteorological applications that benefit from L-band radiometer soil moisture products.
1 Introduction
Surface soil moisture (SM) is a key parameter in the exchange of mass and energy at the soil-atmosphere boundary, as well as in eco-hydrological processes, weather, climate, and agricultural monitoring (Miralles et al., 2013). Over the last two decades, two L-band passive microwave remote sensing satellites, Soil Moisture and Ocean Salinity (SMOS) launched in 2009 (Kerr et al., 2010) and Soil Moisture Active Passive (SMAP) launched in 2015 (Entekhabi et al., 2010), have demonstrated a strong ability to monitor surface SM on a global scale (Xing et al., 2023). Recently, Li et al. (2022b) developed the first global continuous fused L-band SM dataset retrieved from merging brightness temperature (TB) observations of both SMOS and SMAP (SMOS-SMAP-INRAE-BORDEAUX, hereafter the Fused-IB). Fused-IB SM presents advantages over previous single-sensor-based SM products by increasing the number of daily overpasses, thus enhancing data coverage for global hydro-meteorological and ecological applications. In addition, the fusion of SMOS and SMAP SM products could ensure continuous availability of L-band SM data, in case one of the sensors fails.
Comprehensive knowledge of the satellite SM performance at the seasonal scale or during the growing season is necessary because 1) SM is one of the most important drivers in crop production estimations and ecology applications which are mainly associated with seasonal dynamics, and 2) evaluating SM products over the entire data record may suffer from seasonal biases (Hornbuckle et al., 2016). For example, Walker et al. (2019) have found that the SMAP Level 2 SM products fail to meet mission goals in the U.S. Corn Belt and there is a clear seasonal pattern in the validation metrics according to their seasonal evaluation. Besides, the vegetation cycle or intense precipitation periods may reduce the accuracy of satellite SM retrievals in different seasons (Pratola et al., 2014). However, most studies have currently evaluated satellite SM products over the entire data records (e.g., Li et al., 2022a; Li et al., 2022b; Yi et al., 2023), and there is a lack of assessment regarding their performances at the seasonal scale. Therefore, exploring the performance of SM products on a seasonal scale under the effects of related eco-hydrological factors including precipitation and vegetation can enhance the identification of uncertainties in SM products and thus improve their retrieval algorithms. The inter-comparison of SM products over the entire data records has shown that the Fused-IB outperformed another well-known merged satellite SM product, the European Space Agency Climate Change Initiative (ESA CCI), as well as single products from the SMOS-IC and original SMAP (Li et al., 2022b). However, as of now, the robustness of the Fused-IB SM product and its influencing factors in different seasons have not been investigated.
In this study, we aim to evaluate the performances of global satellite-based Fused-IB and SMAP-E SM products over the entire period (overall) and different seasons (seasonal), and carefully examine the potential errors associated with eco-hydrological factors that affect the accuracy of the two SM products in different seasons under different land use and land cover (LULC) types. The results of this analysis could benefit the long-term practical applications of the Fused-IB and the SMAP-E SM products, especially in the eco-hydrological sector, as well as the improvement of their retrieval algorithms.
2 Data and method
2.1 Satellite-based and ground-based SM datasets
Two L-band satellite SM products including the Fused-IB version 1 in the Equal-Area Scalable Earth Grid v2 (EASE-Grid 2) with a 25 km resolution (https://ib.remote-sensing.inrae.fr, accessed on 2024.05.01) and the enhanced SMAP-L3 version 6 (SMAP-E) in EASE-Grid 2 with a 9 km resolution (https://nsidc.org./data/ease/index.html, accessed on 2024.05.01) were considered here. Fused-IB is the first global continuous fused L-band satellite SM dataset, which was retrieved based on merging TB observations from SMOS and SMAP sensors at an incidence angle of 40° using the SMAP-IB algorithm (Li et al., 2022b). Here, the descending Fused-IB SM dataset from 2016 to 2020 was used since this is the only available orbit for this product. SMAP-E is derived from the TB of SMAP Level-1C with the Backus-Gilbert interpolation technique (O’Neill et al., 2021). The SMAP-E was selected for the comparison because its measured TB data were used as the inputs of the Fused-IB SM retrievals. Here, the descending SMAP-E SM product based on the new baseline algorithm [i.e., Dual Channel Algorithm (DCA)] from 2016 to 2020 was used. The period of 2016–2020 is a comprehensive consideration of the available periods of the Fused-IB (2010–2020) and SMAP-E (April 2015–present) SM products. Note that despite the validation period of this study (2016–2020) not being the most recent due to the availability of SM products, this has little impact on the relative performance between the products, only potentially affecting the absolute values of the metrics (Xing et al., 2023).
Following the recommendations provided with the dataset’s quality control documents, Fused-IB SM pixels were excluded when “Scene flag > 1” to filter out SM retrievals impacted by strong topography, pixels covered by urban and water fractions and frozen soils, and “RMSE > 8 K” to reduce the impact of strong radio frequency interference (Li et al., 2022b), and contaminated pixels of SMAP-E were processed following the same quality control procedures in Xing et al. (2023). Besides, the SM values of both products out of the range (0–0.6 m3/m3) were also removed. To ensure consistency with the spatial resolution of Fused-IB, the SMAP-E SM product was resampled to a 25 km grid scale with a bilinear sampling technique.
The ISMN SM observations were regarded as the most accurate SM product and widely used as the reference product in the satellite SM-based calibration/validation activities (Dorigo et al., 2021). Here, the observations measured at the top soil layer of 5 cm covering from 2016 to 2020 from all sparse and dense networks were collected (available at https://ismn.geo.tuwien.ac.at/, accessed on 2024.05.01) to assess the performance of the Fused-IB and SMAP-E SM products. Besides, the ISMN observations labeled as “Good” quality within the same 25 km pixel were spatially averaged, to ensure the high quality of the SM observations and narrow the spatial resolution discrepancy between remotely sensed data at a pixel scale and in situ measurements at a point scale (Li et al., 2022b). In particular, 472-pixel locations at a global 25 km grid were retained and distributed over distinct LULC types such as forests (covering 95 pixels), shrublands (64), savannas (17), grasslands (175), croplands (117), and barren land (4) (Figure 1).
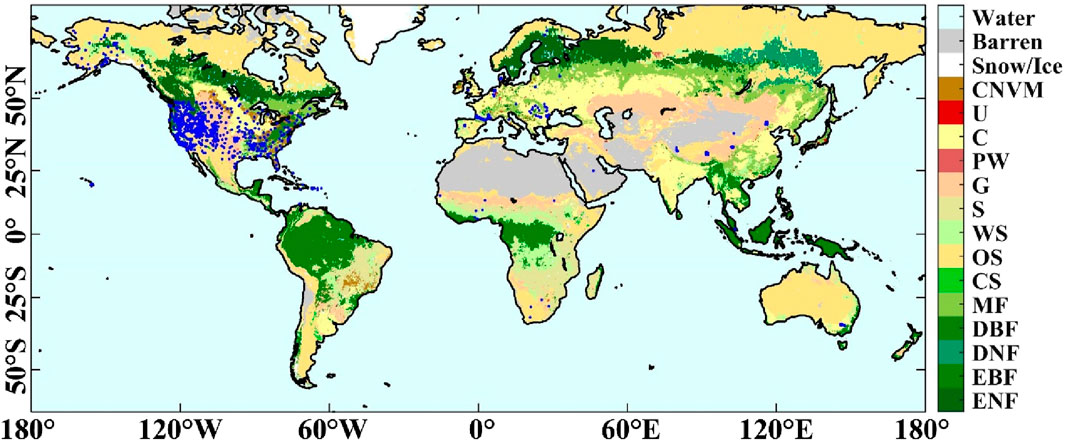
Figure 1. Distribution of the used SMAP footprints. The International Geosphere-Biosphere Programme (IGBP) LULC is shown in the background and was aggregated to the 25 km grid by dominant class and combined into 17 land cover types including Water, ENF (Evergreen Needleleaf Forest), EBF (Evergreen Broadleaf Forest), DNF (Deciduous Needleleaf Forest), DBF (Deciduous Broadleaf Forest), MF (Mixed Forests), CS (Closed Shrublands), OS (Open Shrublands), WS (Woody Savannas), S (Savannas), G (Grasslands), PM (Permanent Wetland), C (Croplands), U (Urban), CNVM (Cropland/Natural vegetation mosaics), Snow/Ice and Barren. The in situ sites from ISMN are indicated in blue dots.
2.2 Ancillary datasets
The 25 km EASE-Grid 2 global IGBP Land Cover Classifications from the Boston University MODIS/Terra Land Cover Data was utilized to interpret the SM inter-comparison results over the different land cover types (Knowles, 2004). A total of twelve MODIS IGBP LULC types covering the corresponding 472 selected pixels were extracted. For convenience, these twelve LULC types were merged into six main categories of land cover classifications (i.e., forests, shrublands, savannas, grasslands, croplands, and barren). More specifically, ENF, EBF, DBF, and MF were merged as forests, CS, and OS were merged as shrublands, S and WS were merged as savannas, and C and CNVM were merged as croplands.
The temporal variability of two potential eco-hydrological factors including vegetation density and precipitation were used to investigate the uncertainties associated with the performance of SM retrievals at the whole and seasonal periods. Vegetation Optical Depth (VOD), often regarded as a vegetation index, highly influences the precision of the microwave SM retrievals over the vegetated regions (Wigneron et al., 2017; Wigneron et al., 2024) and was used to represent vegetation density, and precipitation is also strongly related to the quality of satellite SM products (Pratola et al., 2014). Here, the annual mean VOD provided by the L-band SMAP-E DCA (SMAP-E DCA L-VOD) and the annual mean total precipitation derived from the fifth-generation reanalysis global atmosphere dataset from the European Center for Medium-Range Weather Forecasts (ERA5) from 2016 to 2020 were employed (https://www.ecmwf.int/en/forecasts/dataset/ecmwf-reanalysis-v5, accessed on 2024.05.10). The ERA5 precipitation data was reprojected to EASE-Grid 2 format and resampled to a 25 km grid scale to be consistent with the Fused-IB SM product with a bilinear sampling technique.
2.3 Evaluation methods
To ensure a fair comparison, the two satellite SM products were assessed at the same descending overpass time during the period from 2016 to 2020. The in situ measurements were matched to the overpass time of the satellite SM products at each pixel within a maximum time discrepancy of 1 h. To assess the overall (5 years) and seasonal (MAM: spring (Mar.–May), summer (JJA: Jun.–Aug.), autumn (SON: Sept.–Nov.), and winter (DJF: Dec.–Feb.) performance of the SM products, four commonly used statistical metrics including the Pearson correlation coefficient (R), Root Mean Square Difference (RMSD), unbiased RMSD (ubRMSD), and Bias, together with the Taylor diagrams were used (Taylor, 2001; Entekhabi et al., 2010). A more detailed description of these statistical metrics and Taylor diagram can be found in Fan et al. (2022), R and ubRMSD are regarded as the top evaluation criteria following Xing et al. (2021) and Li et al. (2022b) since the spatial mismatches between the satellite footprints and in situ sites can affect the bias and RMSD metrics. Besides, the calculated metrics were only kept for the sites where at least one SM product obtained significantly positive R values that were higher than 0.4 following (Al-Yaari et al., 2019; Li et al., 2022a) (this step allows us to further filter in situ observations that do not adequately represent satellite observations due to spatial mismatches between them), and the number of data pairs for each footprint was above 31 (Kolassa et al., 2017).
3 Results and discussion
3.1 Overall and seasonal performance of the SM products
Table 1 shows the overall performance of the Fused-IB and SMAP-E SM products, which were evaluated against the in situ SM measurements from 2016 to 2020 regarding median values of R, ubRMSD, RMSD, and Bias for all footprints and six different LULC types. Evaluation results showed that Fused-IB performed slightly better than SMAP-E with a higher R and lower ubRMSD value (median R = 0.70 and ubRMSD = 0.058 m3/m3 for Fused-IB vs. R = 0.68 and ubRMSD = 0.059 m3/m3 for SMAP-E). Particularly in forests, the median R value and ubRMSD, RMSD value of Fused-IB is, respectively, 0.68, 0.062 m3/m3 and 0.098 m3/m3, vs. 0.61, 0.070 m3/m3 and 0.107 m3/m3 for SMAP-E, suggesting that Fused-IB had an advantage over SMAP-E in estimating the temporal variations of the in situ SM in forests. This is consistent with the results of Li et al. (2022b), who reported that Fused-IB led to metrics that were equally good or better than the official SMAP products. The superior performance of Fused-IB at the global scale over different LULC types compared to that of SMAP-E could be partly due to the robustness of the SMAP-IB algorithm compared to the DCA retrieval algorithm (Table 1), as reported in Xing et al. (2023). In addition, Fused-IB also has advantages over SMAP-E in practice due to its higher number of daily overpasses than SMAP-E. For illustration, the spatial distribution of the number of available SM retrievals for Fused-IB and SMAP-E in 2016 is shown in Figures 2A, B, respectively. It can be seen the number of available SM retrievals for Fused-IB is twice as much as SMAP-E, especially in the mid-low latitude areas. This is because Fused-IB SM merges the retrievals derived from both SMAP and SMOS data, and thus the data number at each grid is greatly increased (Figures 2C–H).
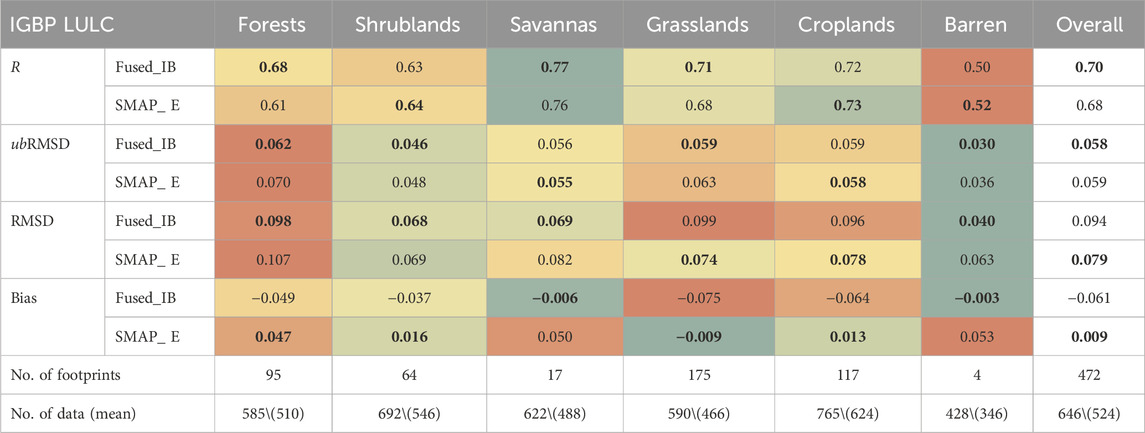
Table 1. Statistical metrics (i.e., R, ubRMSD, RMSD, and Bias) of Fused-IB and SMAP-E compared with ISMN data from 2016 to 2020. The best performance of the three SM datasets for all footprints and six different IGBP LULC types is highlighted in bold. The number of footprints and average data pairs (Fused-IB/SMAP-E) for each LULC are also shown. Red < Orange < Yellow < Light green < Green < Dark green represents the code of colors from the poorest to the best metrics for each product and performance metrics across the six LULC types. The p-values for the t-tests between the overall statistical metrics obtained by the two SM products are lower than 0.05.
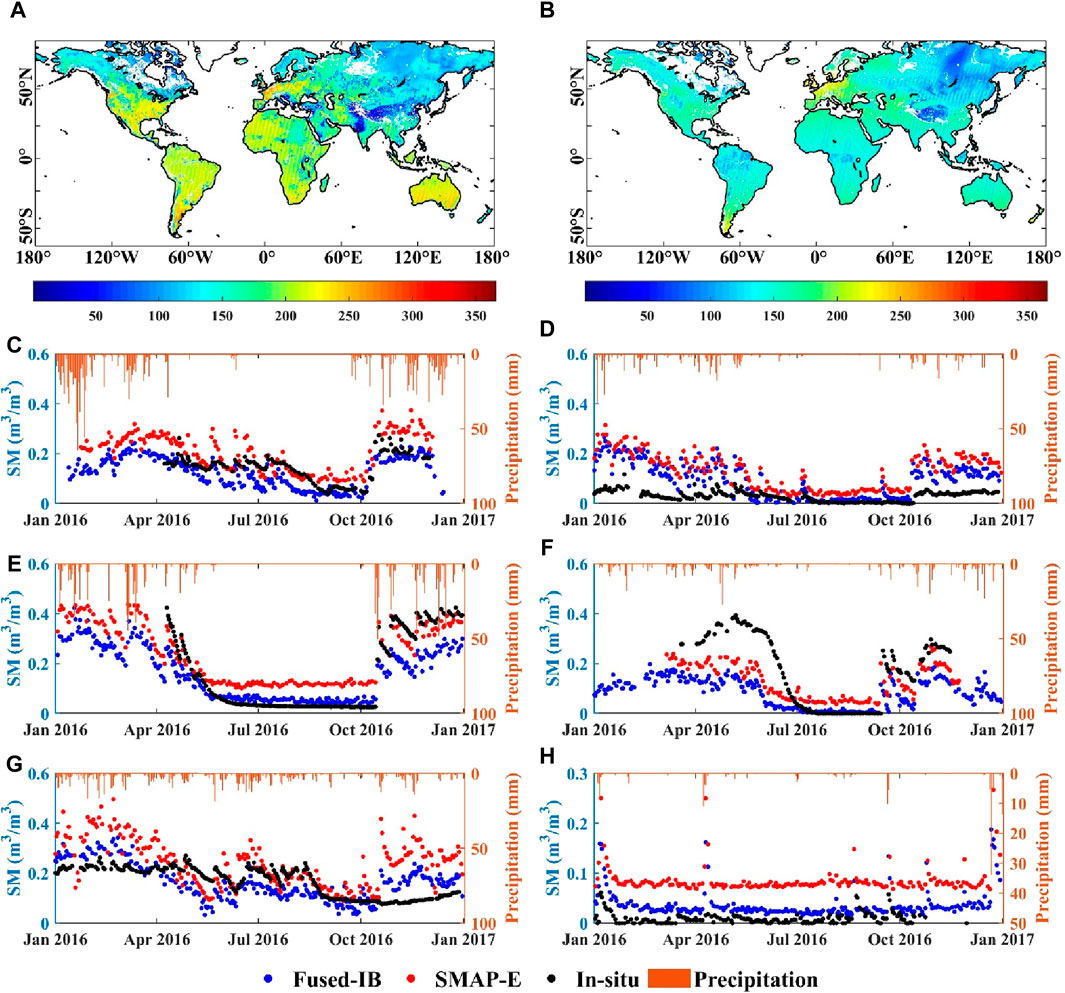
Figure 2. Overview of the number of available SM retrievals in 2016. (A,B) show the spatial distribution of the number of SM retrievals available for Fused-IB and SMAP-E, respectively. The other six subplots show illustrations of the time series of the two SM products and in situ measurements in the sites corresponding to (C) forests (109.08°W, 48.36°N), (D) shrublands (5.42°W, 41.38°N), (E) savannas (120.80°W, 38.17°N), (F) grasslands (116.01°W, 41.53°N), (G) croplands (120.80°W, 53.32°N), and (H) barren (115.31°W, 33.80°N). Daily precipitation obtained from the ERA5 product is indicated by orange vertical bars.
Besides, under different LULC types, regarding R, both products performed better in sparse vegetation areas (e.g., savannas, grasslands, and croplands) than in dense vegetation areas (e.g., forests and shrublands). The lowest R for both SM products on drylands could be due to the inherent aridity of these areas and the limited number of footprints for evaluation. The limited dynamic range of SM time series on barren land may not be sufficient to be effectively detected by radiometers (Figure 2H). In terms of ubRMSD, RMSD, and Bias, slightly larger errors were found in forests, grasslands, and croplands with a median ubRMSD, RMSD and absolute Bias value higher than 0.059 m3/m3, 0.096 m3/m3 and 0.049 m3/m3 for Fused-IB and 0.058 m3/m3, 0.074 m3/m3 and 0.009 m3/m3 for SMAP-E, respectively. Although the evaluation results over the whole study period showed high accuracy in catching the temporal variations in in situ SM, some uncertainties were observed in forests, grasslands, and croplands, which could be partly due to the seasonal biases of the SM retrievals (Walker et al., 2019). To better investigate the performance of the two SM products at the seasonal scale, the statistical metrics for Fused-IB and SMAP-L3 SM products under different LULC types for each season were considered.
Figure 3 shows the Taylor diagrams of the three metrics for Fused-IB and SMAP-L3 SM products under different LULC types in the four seasons. It can be seen that the performance of the Fused-IB SM product was generally better than that of SMAP-E in the four seasons, as the scatters for Fused-IB are closer to the observations, in line with the overall evaluation result (Table 1). Regarding different seasons, both products had higher performance across most LULC types in the summer (JJA) and autumn (SON) seasons, with the normalized STD values lower than 1 and R values ranging from 0.5 to 0.7. In contrast, larger uncertainties were observed in forests, grasslands, and croplands during the spring (MAM) and winter (DJF) seasons with STD values higher than 1 and centered RMSE higher than 0.7. The dispersed scatters in DJF for both Fused-IB and SMAP-E could be due to the limited number of data and sites available in this season considering the influence of frozen ground.
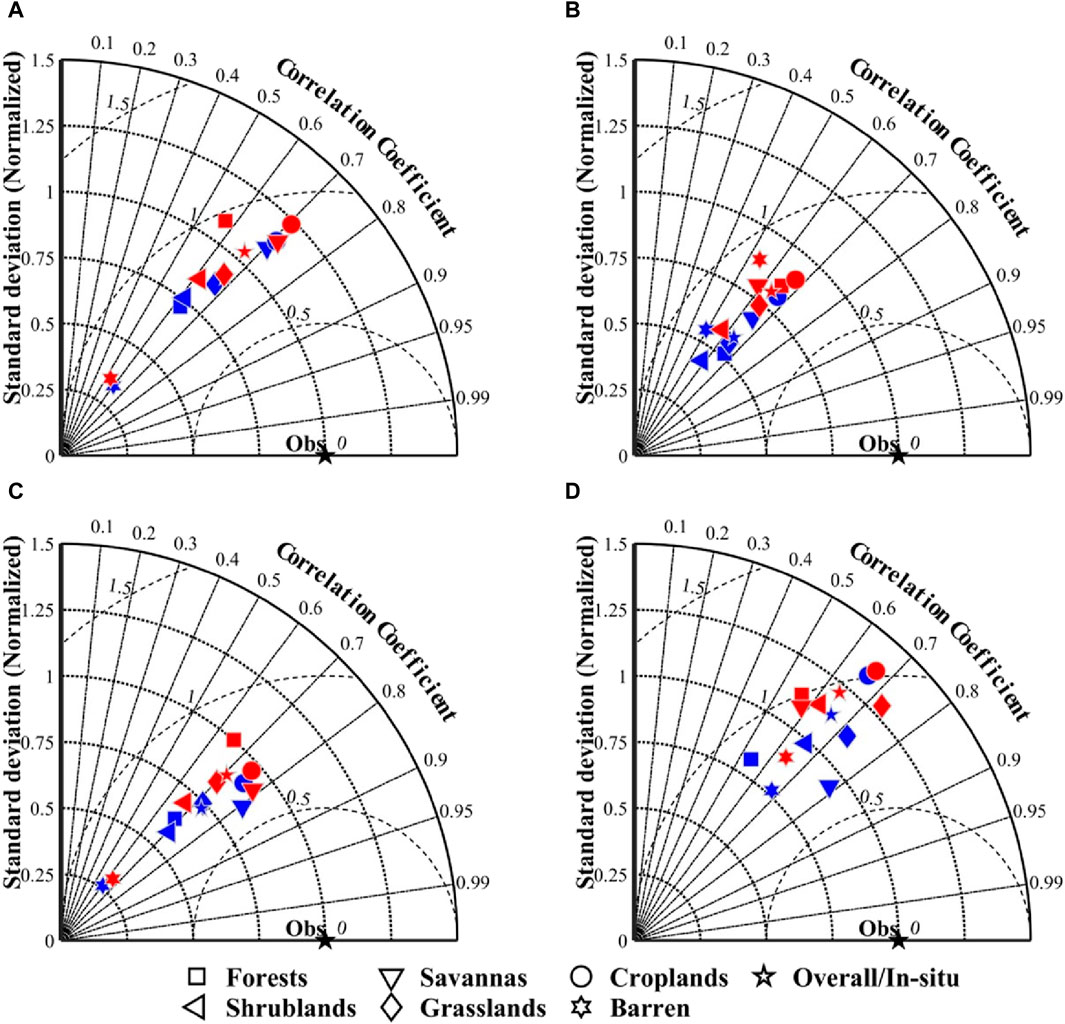
Figure 3. Taylor diagrams of the three metrics for Fused-IB (blue) and SMAP-E SM (red) products under different IGBP LULC in (A) spring (MAM), (B) summer (JJA), (C) autumn (SON) and (D) winter (DJF). The long dashed curves represent the centered Root Mean Square Error (cRMSE).
3.2 Sensitivity of the SM products’ performance to eco-hydrological factors
The potential eco-hydrological factors affecting these seasonal performances, including vegetation density and precipitation, were collected to carefully investigate the errors associated with the two SM retrievals at different time scales. To achieve this, the R values between the potential factors and the overall and seasonal performances of the two SM products [the latter were represented by the performance metrics (i.e., R, ubRMSD, RMSD, and absolute Bias) between the SM products and the observations shown in Table 1; Figure 3A] were calculated (Figure 4). Then, to explore the errors associated with SM product under different LULC types and time scales, further statistics were made by calculating the R values between the potential factors and the R of the two SM products in different LULC types over the overall study period and for different seasons (Table 2). To ensure the robustness of the results, only the potential factors that obtained a significant (p-value < 0.05) correlation with the metrics of the SM products were discussed.
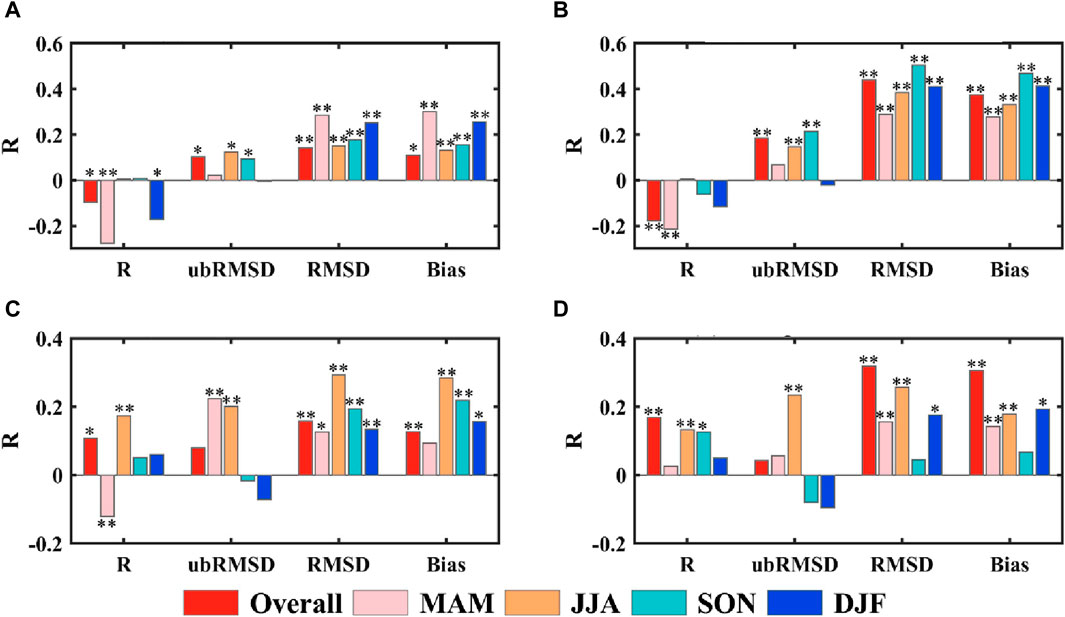
Figure 4. Bars of the correlation coefficients (R) between the four metrics of (A) Fused-IB and L-VOD, (B) SMAP-E and L-VOD, (C) Fused-IB and precipitation, and (D) SMAP-E and precipitation under the overall study period and different seasons (i.e., spring (MAM), summer (JJA), autumn (SON) and winter (DJF)). The relationship with correlation coefficients significant (P-Value < 0.05 or 0.01) is labeled with * or ** above each bar.
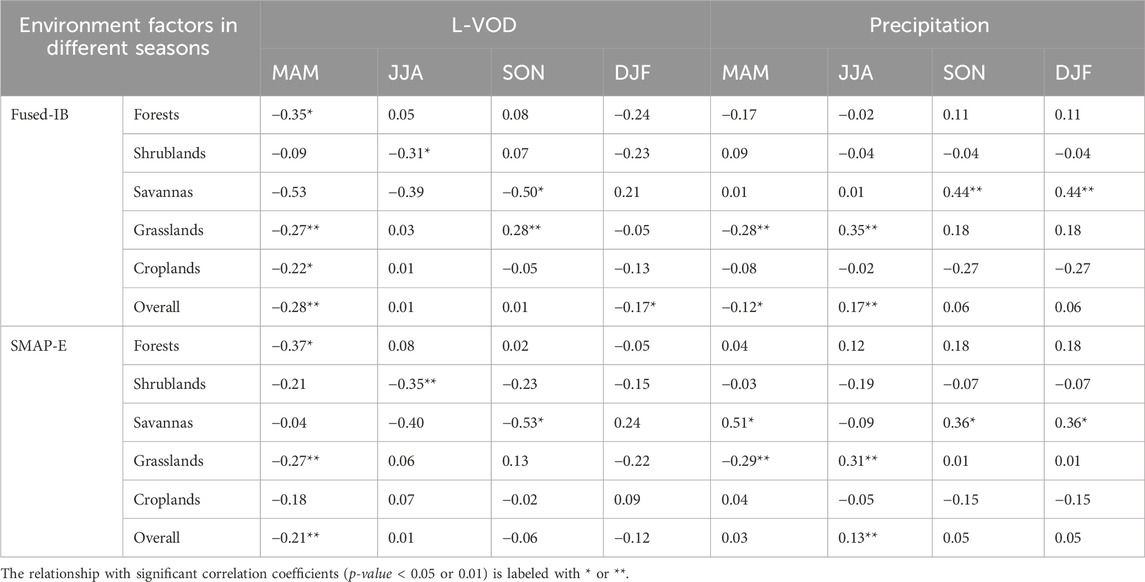
Table 2. Statistics of the spatial correlation coefficients (R) between the R metrics (obtained by validating each SM products with the ISMN observations) and eco-hydrological factors (i.e., L-VOD, precipitation) across all in situ sites for different seasons [i.e., spring (MAM), summer (JJA), autumn (SON), and winter (DJF)] in various IGBP LULC types.
3.2.1 Vegetation density
Regarding the whole study period, significant negative R values between L-VOD and the accuracy (i.e., R values calculated between each of the two SM products and ISMN observations) of the two SM products were observed (R = −0.10 for Fused-IB and R = −0.18 for SMAP-E), and almost all the other three error metrics (i.e., ubRMSD, RMSD and Bias values calculated between each of the two SM products and ISMN observations) of the two SM products had significant positive correlations with L-VOD (Figures 4A, B). This suggests that both Fused-IB and SMAP-E performed better in sites covered with sparse vegetation than in sites with dense vegetation covers. This can be explained by the fact that the soil signal contributing to the total above canopy emission is more attenuated over dense vegetation, leading to higher uncertainties in SM retrievals over densely vegetated regions than over sparse ones (Grant et al., 2008). Besides, higher absolute R values between the metrics obtained between SM retrievals and L-VOD were generally found for SMAP-E rather than for Fused-IB, indicating the performance of SMAP-E SM was more sensitive to the attenuation effect of vegetation than Fused-IB. This could be because SMAP-E incorporates optical information into the algorithms, leading to the compromise of the independence of L-VOD in accurately reflecting the real-time dynamic in the vegetation water content and biomass (Li et al., 2022a).
As for different seasons (Table 2), significant negative R values between L-VOD and the accuracy of the two SM products were observed mainly in MAM (R = −0.28 for Fused-IB and R = −0.21 for SMAP-E). Significant negative R values between L-VOD and the R of SM retrievals in forests (R = −0.35), grasslands (R = −0.27), and croplands (R = −0.22) for Fused-IB and forests (R = −0.37) and grasslands (R = −0.27) for SMAP-E were found in MAM. Namely, for forests, grasslands, and croplands, the decreasing performance of the SM retrievals in densely vegetated regions could be mainly attributed to the uncertainties in the SM retrievals in MAM. This could be explained by the fact that changes in soil surface roughness occur simultaneously with changes in vegetation effects (parameterized by L-VOD during the growing season), while the roughness parameter is assumed to be static (Patton and Hornbuckle, 2013), and any increases in surface roughness are interpreted by the DCA or SMAP-IB algorithm as increasing vegetation (Walker et al., 2019). For example, as illustrated in Figure 2G, the SM products were too wet and noisy for croplands in early MAM, suggesting that the changes in croplands caused by land management activities and vegetation growth led to wetter SM retrievals. Using a dynamic soil surface roughness in MAM may be useful to better retrieve the L-VOD variations and thus improve the accuracy of SM retrievals during this season.
3.2.2 Precipitation
SM is mainly driven by precipitation which is partly linked to antecedent SM as wet soil evaporates water into the atmosphere (Koster et al., 2004). As indicated in Figures 4C, D, positive R values between precipitation and the R values of the two SM products were observed except for in MAM for Fused-IB. This can be explained by the fact that precipitation events can lead to high amplitude in the SM dynamics and thus enhance the ability of SM retrievals to catch the temporal variations of in situ SM (i.e., R values calculated between SM retrievals and in situ measurements) (Table 2). However, negative R values between precipitations and R values calculated between Fused-IB and in situ measurements in MAM. The potential reasons could be the frequent and heavy rainfall during this period. In many regions, MAM is characterized by frequent and heavy rainfall. This frequent rainfall causes rapid changes in SM, making it challenging for remote sensing observations to capture these changes accurately, thereby affecting SM inversion accuracy (Suman et al., 2021). Furthermore, similar to L-VOD, almost all the three metrics (i.e., ubRMSD, RMSD, and Bias) calculated between the two SM products and the in situ measurements had significant positive correlations with precipitation during the whole study period and at most seasonal scales. This could be attributed to the influence of water interception by the vegetation canopy and ground litter effects, which have a significant effect on the upwelling microwave radiative TB observations (Saleh et al., 2006; Grant et al., 2007; Wigneron et al., 2007). For example, some results have shown that the effects of precipitation interception by the vegetation canopy may increase retrieved L-VOD by two or three times during and after rainfall in natural grass (Saleh et al., 2006). Although, no general rules can be used to define how precipitation interception affects the accuracy of SM retrievals (Hornbuckle et al., 2006; Saleh et al., 2006), accounting for some specific effects linked to precipitation interception by the canopy and litter would be of great importance to improve SM retrievals derived from passive microwave satellite data as suggested by Wigneron et al. (2017).
4 Conclusion
The satellite-based Fused-IB and SMAP-E SM products were intercompared against the ISMN observations from 2016 to 2020 over the whole period and different seasons, allowing the investigation of the accuracy performance of these two products at different time scales and exploring the potential eco-hydrological factors that influence their performance. The results from the evaluation over the whole period showed that both Fused-IB and SMAP-E SM are in good agreement with the in situ measurements with high median R and low ubRMSD (median R = 0.70 and ubRMSD = 0.058 m3/m3 for Fused-IB vs. R = 0.68 and ubRMSD = 0.059 m3/m3 for SMAP-E). Besides, Fused-IB performed well compared to SMAP-E with higher accuracy and lower errors in most LULC types when both SM products were intercompared under the same number of footprints, particularly in forests. This result could be partly due to the advantage of the robust SMAP-IB algorithm over the dense vegetation regions, and the high daily coverage of the Fused-IB SM product. Regarding the evaluation over the four seasons, the Fused-IB SM product generally outperformed SMAP-E. Besides, both products had superior performance under most LULC types in JJA and SON, but presented higher uncertainties in forests, grasslands, and croplands, particularly during MAM and DJF. The lower performance found in DJF for both Fused-IB and SMAP-E could be due to the limited number of data and sites in this season considering the influence of frozen ground. The uncertainties of both SM products in MAM could be mainly attributed to the impact of vegetation growth in forests, grasslands, and croplands, and the rainfall in grasslands. This suggests that utilizing a dynamic soil surface roughness parameterization in the retrieval algorithm may improve the L-VOD retrievals (Konkathi and Karthikeyan, 2022) and thus improve the accuracy of the SM retrievals during that season, accounting for some specific effects linked to precipitation interception by the canopy and litter in the SM retrieval algorithms may also contribute to improving accuracy of the retrieved SMOS and SMAP SM products.
Data availability statement
The original contributions presented in the study are included in the article/Supplementary Material, further inquiries can be directed to the corresponding author.
Author contributions
ZX: Conceptualization, Formal Analysis, Investigation, Methodology, Software, Writing–original draft, Writing–review and editing, Funding acquisition. XL: Conceptualization, Investigation, Software, Supervision, Writing–review and editing. LF: Investigation, Writing–review and editing. FF: Writing–review and editing. HK: Writing–review and editing. LK: Writing–review and editing. PK: Writing–review and editing. YL: Writing–review and editing. LZ: Methodology, Supervision, Writing–review and editing. J-PW: Conceptualization, Formal Analysis, Funding acquisition, Supervision, Writing–review and editing.
Funding
The author(s) declare that financial support was received for the research, authorship, and/or publication of this article. This study was supported by CNES TOSCA, France (Centre National d’Etudes Spatiales). ZX was sponsored by the China Scholarship Council (202204910459).
Acknowledgments
We thank the INRAE Bordeaux and National Snow and Ice Data Center for providing the remotely sensed SM datasets, the ECMWF for providing the precipitation dataset, and for providing the in situ SM measurements.
Conflict of interest
The authors declare that the research was conducted in the absence of any commercial or financial relationships that could be construed as a potential conflict of interest.
The author(s) declared that they were an editorial board member of Frontiers, at the time of submission. This had no impact on the peer review process and the final decision.
Publisher’s note
All claims expressed in this article are solely those of the authors and do not necessarily represent those of their affiliated organizations, or those of the publisher, the editors and the reviewers. Any product that may be evaluated in this article, or claim that may be made by its manufacturer, is not guaranteed or endorsed by the publisher.
References
Al-Yaari, A., Wigneron, J. P., Dorigo, W., Colliander, A., Pellarin, T., Hahn, S., et al. (2019). Assessment and inter-comparison of recently developed/reprocessed microwave satellite soil moisture products using ISMN ground-based measurements. Remote Sens. Environ. 224, 289–303. doi:10.1016/j.rse.2019.02.008
Dorigo, W., Himmelbauer, I., Aberer, D., Schremmer, L., Petrakovic, I., Zappa, L., et al. (2021). The international soil moisture network: serving Earth system science for over a decade. Hydrogeology Earth Syst. Sci. 25, 5749–5804. doi:10.5194/hess-25-5749-2021
Entekhabi, D., Njoku, E. G., O'Neill, P. E., Kellogg, K. H., Crow, W. T., Edelstein, W. N., et al. (2010). The soil moisture active passive (SMAP) mission. Proc. IEEE 98, 704–716. doi:10.1109/jproc.2010.2043918
Fan, L., Xing, Z., Lannoy, G. D., Frappart, F., Peng, J., Zeng, J., et al. (2022). Evaluation of satellite and reanalysis estimates of surface and root-zone soil moisture in croplands of Jiangsu Province, China. Remote Sens. Environ. 282, 113283. doi:10.1016/j.rse.2022.113283
Grant, J. P., Saleh-Contell, K., Wigneron, J. P., Guglielmetti, M., Kerr, Y. H., Schwank, M., et al. (2008). Calibration of the L-MEB model over a coniferous and a deciduous forest. IEEE Trans. Geoscience Remote Sens. 46, 808–818. doi:10.1109/tgrs.2007.914801
Grant, J. P., Wigneron, J. P., Van de Griend, A. A., Kruszewski, A., Søbjærg, S. S., and Skou, N. (2007). A field experiment on microwave forest radiometry: L-band signal behaviour for varying conditions of surface wetness. Remote Sens. Environ. 109, 10–19. doi:10.1016/j.rse.2006.12.001
Hornbuckle, B. K., England, A. W., Anderson, M. C., and Viner, B. J. (2006). The effect of free water in a maize canopy on microwave emission at 1.4GHz. Agric. For. Meteorology 138, 180–191. doi:10.1016/j.agrformet.2006.05.003
Hornbuckle, B. K., Patton, J. C., VanLoocke, A., Suyker, A. E., Roby, M. C., Walker, V. A., et al. (2016). SMOS optical thickness changes in response to the growth and development of crops, crop management, and weather. Remote Sens. Environ. 180, 320–333. doi:10.1016/j.rse.2016.02.043
Konkathi, P., and Karthikeyan, L. (2022). Error and uncertainty characterization of soil moisture and VOD retrievals obtained from L-band SMAP radiometer. Remote Sens. Environ. 280, 113146.
Kerr, Y. H., Waldteufel, P., Wigneron, J.-P., Delwart, S., Cabot, F., Boutin, J., et al. (2010). The SMOS mission: new tool for monitoring key elements ofthe global water cycle. Proc. IEEE 98, 666–687. doi:10.1109/jproc.2010.2043032
Knowles, K. (2004). EASE-grid land cover classifications derived from Boston university MODIS/terra land cover data, version 1. Boulder, Colorado USA: NASA National Snow and Ice Data Center Distributed Active Archive Center. doi:10.5067/J0CJG7RZW3IJ
Kolassa, J., Reichle, R. H., Liu, Q., Alemohammad, S. H., Gentine, P., Aida, K., et al. (2017). Estimating surface soil moisture from SMAP observations using a neural network technique. Remote Sens. Environ. 204, 43–59. doi:10.1016/j.rse.2017.10.045
Koster, R. D., Dirmeyer, P. A., Guo, Z., Bonan, G., Chan, E., Cox, P., et al. (2004). Regions of strong coupling between soil moisture and precipitation. Science 305, 1138–1140. doi:10.1126/science.1100217
Li, X., Wigneron, J.-P., Fan, L., Frappart, F., Yueh, S. H., Colliander, A., et al. (2022a). A new SMAP soil moisture and vegetation optical depth product (SMAP-IB): algorithm, assessment and inter-comparison. Remote Sens. Environ. 271 (12), 112921. doi:10.1016/j.rse.2022.112921
Li, X., Wigneron, J.-P., Frappart, F., Lannoy, G. D., Fan, L., Zhao, T., et al. (2022b). The first global soil moisture and vegetation optical depth product retrieved from fused SMOS and SMAP L-band observations. Remote Sens. Environ. 282 (24), 113272. doi:10.1016/j.rse.2022.113272
Miralles, D. G., van den Berg, M. J., Gash, J. H., Parinussa, R. M., de Jeu, R. A. M., Beck, H. E., et al. (2013). El Niño–La Niña cycle and recent trends in continental evaporation. Nat. Clim. Change 4, 122–126. doi:10.1038/nclimate2068
O’Neill, P. E., Chan, S., Njoku, E. G., Jackson, T., Bindlish, R., and Chaubell, J. (2021). SMAP L3 radiometer global daily 36 km EASE-grid soil moisture, version 8. Boulder, CO: NASA National Snow and Ice Data Center Distributed Active Archive Center.
Patton, J., and Hornbuckle, B. (2013). Initial validation of SMOS vegetation optical thickness in Iowa. IEEE Geoscience Remote Sens. Lett. 10, 647–651. doi:10.1109/lgrs.2012.2216498
Pratola, C., Barrett, B., Gruber, A., Kiely, G., and Dwyer, E. (2014). Evaluation of a global soil moisture product from finer spatial resolution SAR data and ground measurements at Irish sites. Remote Sens. 6, 8190–8219. doi:10.3390/rs6098190
Saleh, K., Wigneron, J.-P., de Rosnay, P., Calvet, J.-C., Escorihuela, M. J., Kerr, Y., et al. (2006). Impact of rain interception by vegetation and mulch on the L-band emission of natural grass. Remote Sens. Environ. 101, 127–139. doi:10.1016/j.rse.2005.12.004
Suman, S., Srivastava, P. K., Pandey, D. K., Prasad, R., Mall, R. K., and O’Neill, P. (2021). Comparison of soil dielectric mixing models for soil moisture retrieval using SMAP brightness temperature over croplands in India. J. Hydrology 602, 126673. doi:10.1016/j.jhydrol.2021.126673
Taylor, K. E. (2001). Summarizing multiple aspects of model performance in a single diagram. J. Geophys. Res-Atmos. 106, 7183–7192. doi:10.1029/2000jd900719
Walker, V. A., Hornbuckle, B. K., Cosh, M. H., and Prueger, J. H. (2019). Seasonal evaluation of SMAP soil moisture in the U.S. Corn Belt. Remote Sens. 11, 2488. doi:10.3390/rs11212488
Wigneron, J.-P., Ciais, P., Li, X., Brandt, M., Canadell, J. G., Tian, F., et al. (2024). Global carbon balance of the forest: satellite-based L-VOD results over the last decade. Remote Sens. 5, 1338618. doi:10.3389/frsen.2024.1338618
Wigneron, J. P., Jackson, T. J., O'Neill, P., De Lannoy, G., de Rosnay, P., Walker, J. P., et al. (2017). Modelling the passive microwave signature from land surfaces: a review of recent results and application to the L-band SMOS & SMAP soil moisture retrieval algorithms. Remote Sens. Environ. 192, 238–262. doi:10.1016/j.rse.2017.01.024
Wigneron, J. P., Kerr, Y., Waldteufel, P., Saleh, K., Escorihuela, M. J., Richaume, P., et al. (2007). L-band microwave emission of the biosphere (L-MEB) model: description and calibration against experimental data sets over crop fields. Remote Sens. Environ. 107, 639–655. doi:10.1016/j.rse.2006.10.014
Xing, Z., Fan, L., Zhao, L., De Lannoy, G., Frappart, F., Peng, J., et al. (2021). A first assessment of satellite and reanalysis estimates of surface and root-zone soil moisture over the permafrost region of Qinghai-Tibet Plateau. Remote Sens. Environ. 265, 112666. doi:10.1016/j.rse.2021.112666
Xing, Z., Li, X., Fan, L., Colliander, A., Frappart, F., de Rosnay, P., et al. (2023). Assessment of 9 km SMAP soil moisture: evidence of narrowing the gap between satellite retrievals and model-based reanalysis. Remote Sens. Environ. 296, 113721. doi:10.1016/j.rse.2023.113721
Keywords: soil moisture, assessment, fused products, seasonal scale, eco-hydrological factors
Citation: Xing Z, Li X, Fan L, Frappart F, Kim H, Karthikeyan L, Konkathi P, Liu Y, Zhao L and Wigneron J-P (2024) Seasonal-scale intercomparison of SMAP and fused SMOS-SMAP soil moisture products. Front. Remote Sens. 5:1440891. doi: 10.3389/frsen.2024.1440891
Received: 30 May 2024; Accepted: 15 July 2024;
Published: 30 July 2024.
Edited by:
Morteza Sadeghi, California Department of Water Resources, United StatesReviewed by:
Ebrahim Babaeian, University of Florida, United StatesNeda Mohamadzadeh, Kansas State University, United States
Copyright © 2024 Xing, Li, Fan, Frappart, Kim, Karthikeyan, Konkathi, Liu, Zhao and Wigneron. This is an open-access article distributed under the terms of the Creative Commons Attribution License (CC BY). The use, distribution or reproduction in other forums is permitted, provided the original author(s) and the copyright owner(s) are credited and that the original publication in this journal is cited, in accordance with accepted academic practice. No use, distribution or reproduction is permitted which does not comply with these terms.
*Correspondence: Xiaojun Li, eGlhb2p1bi5saUBpbnJhZS5mcg==