 Matthew G. McHarg1*
 Imogen R. Jones2Zachary Wilcox3Richard L. Balthazor3Alexandre Marcireau4
 Gregory Cohen4
- 1United States Air Force Academy, Colorado Springs, CO, United States
- 2MARCS Institute for Brain Behaviour and Development, Western Sydney University, Westmead, NSW, Australia
- 3i2 Strategic Services in Cooperative Agreement with United States Air Force Academy, Colorado Springs, CO, United States
- 4International Centre for Neuromorphic Systems, Western Sydney University, Werrington, NSW, Australia
The observation of lightning from space can have several advantages, including views of the tops of clouds, that can facilitate the study of in-cloud lightning as well as the world-wide access provided by the orbital parameters of a satellite. Given the brief duration of lightning, current space-based lighting monitors are necessarily complex in order to resolve both the spatial and temporal features of lighting discharges. Event-based sensors provide a new low-cost way of using a commercial camera to study lightning from space. The Falcon Neuro mission comprises two event-based vision sensors attached to the Columbus Module of the International Space Station. Its mission is to detect lightning and related electrical discharges in the Earth’s atmosphere. We report here on initial data collection and analysis of lightning by the United States Air Force Academy and Western Sydney University.
1 Introduction
Neuromorphic vision sensors, or event-based sensors, are non-traditional imaging devices that independently detect changes in contrast at each pixel, emitting these changes in a high-speed asynchronous manner (Gallego et al., 2020). This allows them to achieve lower latency and data output and higher dynamic range than conventional frame-based cameras. These factors enable event-based sensors to perform comparably to high-speed cameras in certain applications, achieving high-speed data capture with a low data rate and power consumption. This makes them ideal for on-orbit observations of lightning, objects in Earth orbit, and background stars.
Observations of lighting from Earth’s orbit, starting as early as the 1970s, have been conducted across a range of wavelengths (Labrador, 2017), with some of the most recent observations coming from the Geostationary Lightning Mapper (GLM) that covers the Americas (Thomas et al., 2004), the Lightning Imager (LI) covering Europe and Africa (Goodman et al., 2013), and the Lightning Mapper Imager (LMI) covering East and South East Asia (Yang et al., 2017). These detectors were designed to provide a count of the number and/or density of lightning strikes, the intensity of their radiant energy, and sometimes their spectra.
The Falcon Neuro payload comprises the first operational event-based sensors in orbit (McHarg et al., 2022); it consists of two DAVIS240C sensors (Brandli et al., 2014) that were installed on the Columbus module of the International Space Station in 2022. The Falcon Neuro payload was developed through collaboration between the United States Air Force Academy and the International Centre for Neuromorphic Systems (ICNS) at Western Sydney University. The payload was installed on the Columbus module on the International Space Station on 11 January 2022 with a guaranteed mission time of 12 months from first light. The instrument has operated successfully for over 2 years and is still operating at the time of publication.
This study presents recent observations from the Falcon Neuro instrument to demonstrate the capabilities of an event-based vision sensor to observe lightning in-orbit and to discuss planned upgrades to a future Falcon mission. We give examples of lightning detected with the Falcon Neuro sensors, which have been cross-referenced with ground-based radio observations.
2 Materials and methods
2.1 Instrumentation
The specifications of the Falcon Neuro optical sensors are shown below in Table 1. Falcon Neuro is a visible band sensor with no optical filters. The peak quantum efficiency (QE) for the focal plane is approximately 7% at 600 nm. This modest QE is a result of the poor fill factor due to placing the 48 active transistors in each pixel on the front side of the focal plane. Current neuromorphic vision sensors have backside illuminated focal planes, with
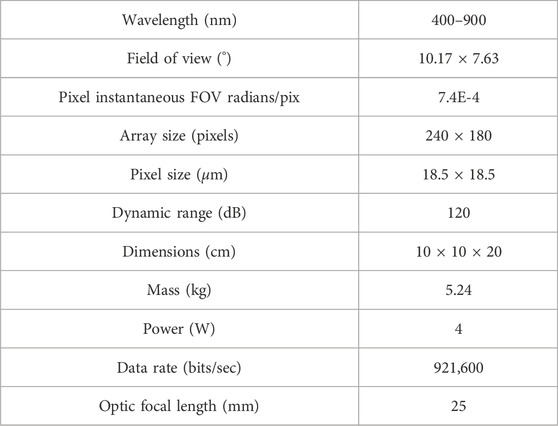
Table 1. Specifications of Falcon Neuro sensors.
Falcon Neuro comprises two fixed position DAVIS240C neuromorphic vision sensors, complete with a Fujinon HF2518-12M-F1.8 25 mm focal length lens. One sensor is pointed towards the Earth’s (in the direction of the ISS’s trajectory) horizon (ram sensor), with the other pointing down toward Earth (nadir sensor). Both sensors are controlled by custom processing hardware developed by ICNS and built around an Intel Cyclone V SoC field programmable gate array (FPGA). The Falcon Neuro payload is part of the DoD Space Test Program STP-H7 mission to the ISS.
The pixels in each sensor are controlled by a set of independent biases that control factors such as contrast thresholds and refractory periods. The contrast change events are timestamped with microsecond resolution by the FPGA controller as soon as they are emitted from the sensors. The absolute timing of the data is such that the Neuro timestamp (in UTC) will always be earlier than real UTC by 1–2 s. The relative timings of the individual events are performed at the microsecond level, and intervals between detected lightning flashes from the DAVSI240C sensors were used in comparison with traditional lightning detection networks to identify the recorded Neuro lightning flashes.
The DAVIS240C focal planes used in Falcon Neuro are a mixed analog and digital system. Unlike a traditional framing camera, every pixel in an EBVS responds individually to changes in the light level in that pixel. Each pixel contains analog electronics which provide a fast logarithmic response to the current provided by the photo receptor, followed by a differencing circuit, and finally a set of comparators, one for the positive change threshold and one for the negative threshold. The output of the comparator circuit is collected by an arbiter circuit through an asynchronous process and emitted as a list of “events” in the address-event representation (AER) format. Details are provided in Lichtsteiner et al. (2008)
This list of events is the raw output of the camera. At this level, there are no “frames” of data as provided by a traditional framing camera. Subsequent analysis of the data occurs on this list of events with custom software used to “render” the data. We use two different “rendering” methods. The first processes the events with fixed time increments (here 100 ms) using a two-dimensional histogram to produce a “frame” of data (Gallego et al., 2020). The second method segments the events in time, estimates the motion of objects in the data, and uses a clustering algorithm to “offset and co-add” the events to provide a sharp motion compensated image (Stoffregen et al., 2019)
In both cases, the “image” provided is an integration over a variable time width. Due to this unique feature, there is no fixed frame rate for an EVBS camera. Effectively, the frame rate is set in the post processing software used to analyze the raw event stream coming from the camera.
2.2 Data collection
Falcon Neuro science operations on the International Space Station (ISS) are performed from the Payload Operations Control Center (POCC) located at the United States Air Force Academy in Colorado. Operations are coordinated with other experiment groups on STP-H7 and with the NASA Payload Operations and Integration Center (POIC) in Alabama. Falcon Neuro is operated during pre-planned “command windows”, and special windows can be requested to observe other targets of interest.
A custom GUI with an application programming interface to the NASA Telescience Resource Kit (TReK) command application transmits instrument commands to Falcon Neuro via the POIC and the ISS Mission Control Center in Houston.
A typical data acquisition consists of establishing a command path, configuring the sensor parameters, and beginning a recording, which typically lasts 1–180 s (effectively limited by the combination of generated data volume and limited telemetry bandwidth). During the acquisition, the science data is stored onboard Falcon Neuro in flash memory. Acquisition start times are chosen by operator judgment depending on the target of interest and are flexible within the command path latency and human response time limits (2–3 s); greater precision is not required. Absolute knowledge of the commanded start of the acquisition is obtained from the onboard GPS timestamp provided to Falcon Neuro.
Analysis of the total Neuro data set shows an average event rate (when calculated in 100 ms time bins) of 16,700 events per second, with a standard deviation of 63,771 events per second. This low average and large standard deviation are driven by three recordings made at night over uninhabited areas of the globe with durations of up to 40 min. These three recordings greatly reduce the average event rate. If instead we calculate the event rate within each recording and then calculate a mean and standard deviation across the 328 datasets, we obtain an average event rate of 53,444 events/sec with a standard deviation of 134,982 events/sec. The second method “weights” each recording the same, allowing outliers within the data sets to greatly increase the average event rate while also increasing the standard deviation.
After the acquisition has finished, the science data is then packetized and transmitted to the host platform and downloaded to the NASA Huntsville Payload Operations and Integration Center (POIC). The POIC acts as a final bent pipe to forward the data to the Falcon Neuro across the internet, which arrives at the POCC within a few minutes of completion of the acquisition.
ISS ephemeris and STP-H7 attitude data are downloaded from the NASA Data Storage and Retrieval System (DSRS) for post-processing. Falcon Neuro science data is extracted from the transport layer packets using a MATLAB tool. The data is assembled into a single HDF5 file for each acquisition that contains the event data array (time, pixel identifier, and event polarity) and acquisition metadata. The use of the open HDF5 file format enables ease of manipulation by a number of commercial and open software packages.
2.3 Data analysis
In order to quickly and reliably find lightning events in the raw Falcon Neuro data, a feature finding (FF) algorithm was developed. This segments the data in time and compares the number of events in each segment with the number in the other segments. Since lighting causes an order of magnitude more events in a small time segment, we use statistical methods to find the lightning events.
To find these high event regions of lightning, a raw dataset from Falcon Neuro (typically 180 s long) is ingested into the FF algorithm, and all events with OFF polarities are removed. This leaves a smaller dataset consisting of the four columns, x, y, polarity, and a timestamp, where the polarity is always positive. The dataset is then divided into time-based segments, each 0.1 s in length. For each of these segments, the total number of events is calculated and divided by 0.1 to provide a number representing the event rate, or events per each 0.1 s,
If
If a frame contains probable lightning, we must compare it to a second lightning detection system to confirm our signal. To establish geolocation of the Neuro cameras, telemetry data from the ISS is loaded into Systems Toolkit (STK) along with the appropriate date and time of the probable lightning. The ground footprint of the ram and nadir cameras is projected onto a globe using STK, and the corners of the ground footprint have their coordinates recorded.
When processing ram camera images, the resulting location of the lighting is less accurate than that of the nadir camera due to the longer ranges in the ram camera view as well as the fact that the ram camera has both “on earth” and “off earth” pixels in one frame. The resulting fields of view of the two Falcon Neuro cameras are shown in Figure 7 of McHarg et al. (2022)
Lightning strikes seen by the nadir camera can be directly compared to GLD360 data by overlaying the motion compensated image on the appropriate region of the earth. Figure 1 shows the motion compensated image for a pass recorded on 23 May 2023 at 17:10:24 UT. The top panel of Figure 1 shows the motion compensated image, which shows the number of events recorded by Falcon Neuro from 17:10:24 to 17:12:14. The bottom panel of the image shows a zoom into the motion compensated recording of two lighting flashes occurring between 17:10:31 and 17:10:36 UT. The image is shown superimposed over the Earth at night.
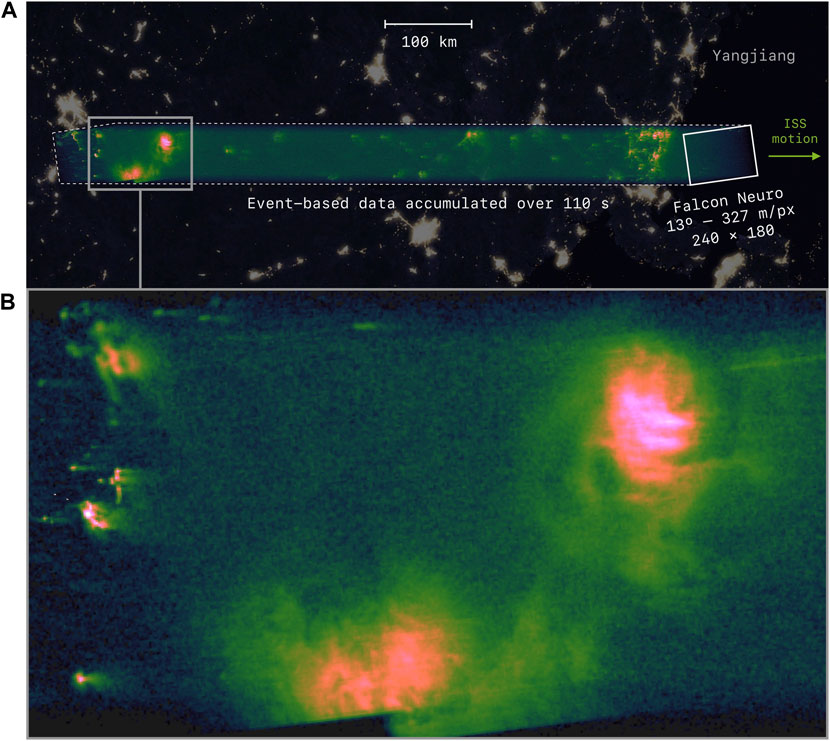
Figure 1. (A) Motion-compensated image of Falcon Neuro data recorded on 23 May 2023 at 17:10:24 UT. (B) Zoom into the motion compensated image showing two lightning flashes occurring between 17:10:31 and 17:10:36 UT.
The geo-referencing presented in Figure 1 is imprecise due to two main factors. Because of a problem with inserting GPS time into the event stream, we only have the time the command was sent to record the data, which is time stamped with 1 s intervals. We attribute the time of the first event to this command recording time, resulting in uncertainty regarding the absolute timing of the events to approximately 1–2 s. The second contributing factor to geo-referencing is the current ISS orientation we obtain from NASA. This orientation is inserted into STK along with the measured orientation of the two cameras with respect to the STP-H7 pallet. The STP-H7 pallet is currently located on the Columbus module; given the size and possible flexing of the ISS structure along with the timing uncertainty mentioned above, we estimate the uncertainty of the geo-referencing shown in Figure 1 to be approximately 15 km.
The Global Lightning Detection Network (GLD360), operated by Vaisala, is a long-range network of very low frequency (VLF) sensors that provide time and location information on individual lighting lightning flashes (Said and Murphy, 2016). The data from these ground stations was used to confirm the presence of lightning in the data from Falcon Neuro.
A coordinate representing a GLD360 lightning event is placed directly on the map and compared with the lightning detected in the motion-compensated image. A GLD360 coordinate anywhere within a Neuro-detected lightning event at the same time as the Neuro event is considered confirmation of a lighting detection by Falcon Neuro.
3 Results
From 21 January 2022 to 25 August 2023, Falcon Neuro recorded 174 ram and 154 nadir observations. Lightning was detected in 14 ram and 7 nadir recordings of these recordings. All lightning detected was obtained in night conditions.
Figure 1 is an example of lightning as seen in the nadir camera. The camera’s field of view is 73 × 55 km, with an instantaneous per pixel size of 320 m. The motion-compensated image seen in Figure 1 is effectively integrated in time over the 180 s acquisition. The resulting motion-compensated image is thus a strip 55 km wide by approximately 1350 km long. A comparison with GLD360 data is shown in Figure 2, where the top panel is the motion-compensated image from Falcon Neuro overlaid onto Google Earth. The four numbers show the locations of four lighting flashes recorded by GLD360 during this same period. The bottom panel of Figure 2 is a time series of the numbers of events in each 100 ms bin from Falcon Neuro with the times of the four GLD360 lightning flashes superimposed. Every time GLD360 records a lighting flash, Falcon Neuro records an increase in the number of events.
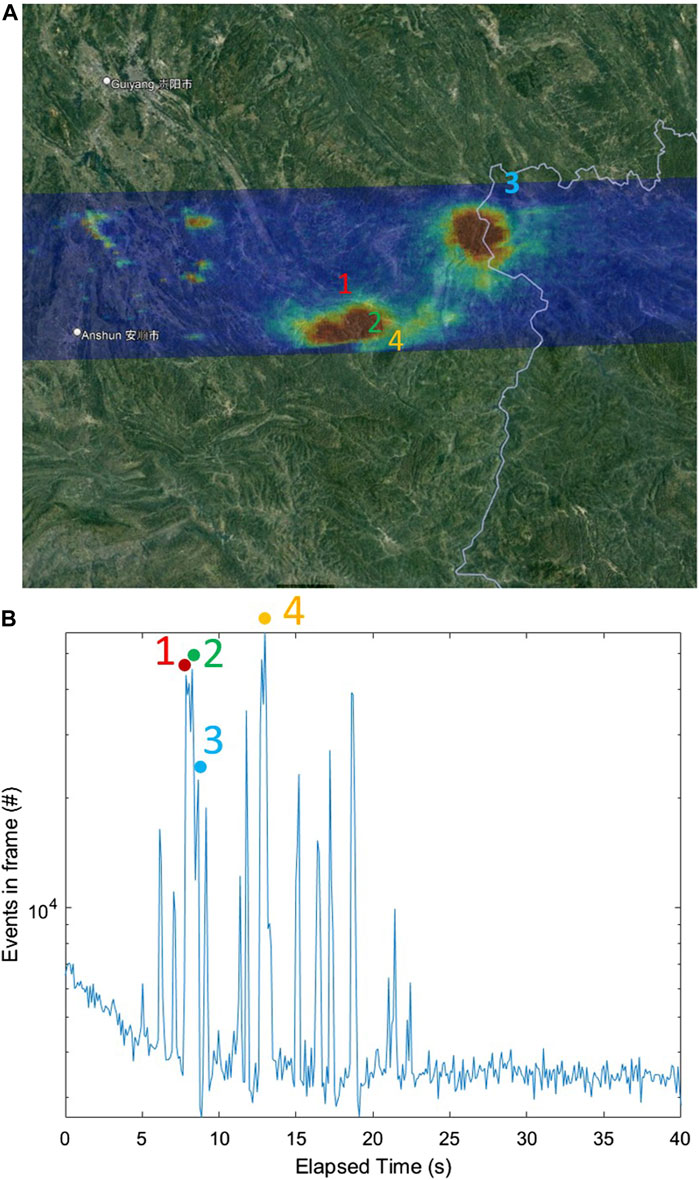
Figure 2. (A) Motion-compensated image of Falcon Neuro data recorded on 23 May 2023 at 17:10:24 UT. Also shown are the locations of four flashes observed by GLD360 for this period. (B) Time series of the number of events per 100 ms from Falcon Neuro for 40 s beginning at 17:10:24 UT. Overlaid are the times of the four flashes observed in GLD360 during the same period.
The Neuro event time series for GLD360 flash 3 shown in Figure 2 is
Falcon Neuro routinely detects more lightning flashes than GLD360. During this pass, Falcon Neuro recorded a total of 28 lighting flashes while GLD360 reported four events within our field of view. Several factors may cause this discrepancy. In this case, all four GLD360 flashes were listed as intracloud. We do not know if the flashes seen in Falcon Neuro are intracloud or cloud-to-ground. Additionally, this recording is over China, and the detection efficiency of GLD360 drops off with increasing range from North America. A comparison of GLD360 with the space-based TRMM LIS optical transient detector shows a decrease in the relative detection efficiency (DE) between TRMM LIS and GLD360. GLD360 detects 52.9% of TRMM LIS detected groups over North America and detects 22.2% of TRMM LIS detected groups over Africa (Rudlosky et al., 2017). A relative DE between GLD360 and TRMM LIS was not reported for China.
As an example of Falcon Neuro’s increased detection capability, GLD360 records one flash for event 3 on Figure 2 while Falcon Neuro records five individual flashes over a 700 ms time period. Individual 40 ms images of these five flashes are shown in Figure 3. We define a unique flash by requiring that the number of events go back to the background (effectively less than 1000 events in the entire frame) before the next flash. These five “reflashes” represent increases in optical intensity coming out of the cloud as the energy from different pockets of charge within the cloud are added to the in-cloud flash.
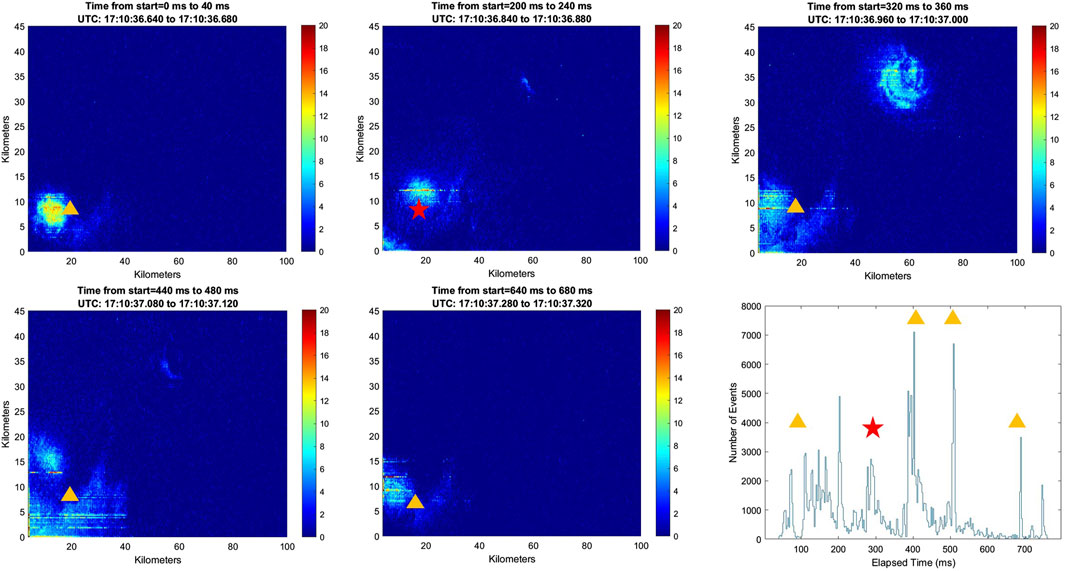
Figure 3. Five individual flashes recorded by Falcon Neuro beginning at 17:10:36.640 UT. Each flash image lasts 40 ms. The time for each flash is shown and the location of GLD360 flash number 3 from Figure 2 is shown by the yellow triangle or red star. The second Neuro flash that corresponds most closely in time to GLD360 flash number 3 is shown with a red star. The bottom-right panel is an event time series in 1 ms bins for the 800 ms in consideration.
The ram camera orientation results in a much longer, more extended field of view on the ground. Depending on the details of the ISS orientation, anywhere between 0 and 70 pixels will be above the limb of the Earth. Figure 4 below shows the footprint of the ram camera at the beginning of the pass (at 21:47:38 on 10 March 2022 UT) in blue and the same footprint at the end of the pass 90 s later. The ISS is located approximately 1,095 km behind the start of the ram footprint. During the 90 s pass, the ISS travels 869 km. The total distance on the ground of the ram footprint is 1,402 km. In this pass, approximately 50–70 pixels are above the limb of the earth. During this period, Falcon Neuro recorded four lightning flashes, two of which were detected by GLD360.
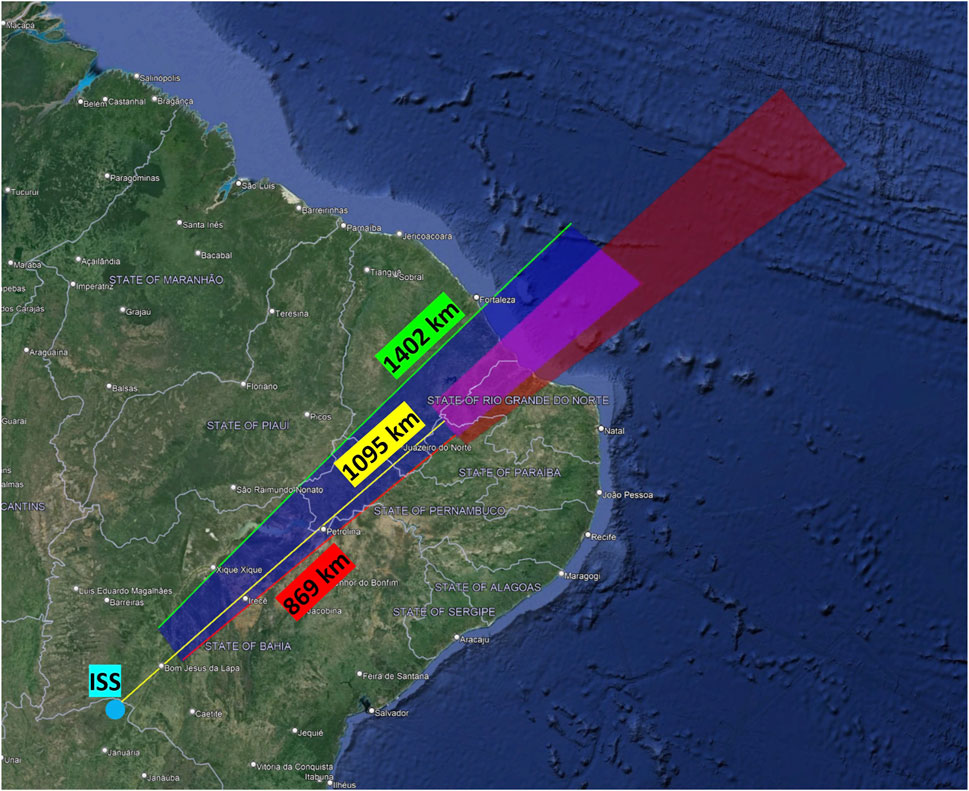
Figure 4. Footprint of the ram camera at the start (blue) and end of the pass (red); see text for details. This ram data collection recorded a total of four lightning flashes, two of which were detected by GLD360.
Figure 5 has four panels each with a lightning flash recorded by the Falcon Neuro ram camera on 10 March 2022. The numbers on the ordinate and abscissa are pixel values; both Falcon Neuro cameras have 240 × 180 pixels. The integration time for each panel is 250 ms. GLD360 recorded two lighting flashes in the same locations at the same general time. The positions of the GLD360 lightning flashes are shown with colored stars. Red stars show the GLD360 position when GLD360 matches the time of the Falcon Neuro flash, while green stars are the GLD360 position when Falcon Neuro records a flash at that time but GLD360 does not.
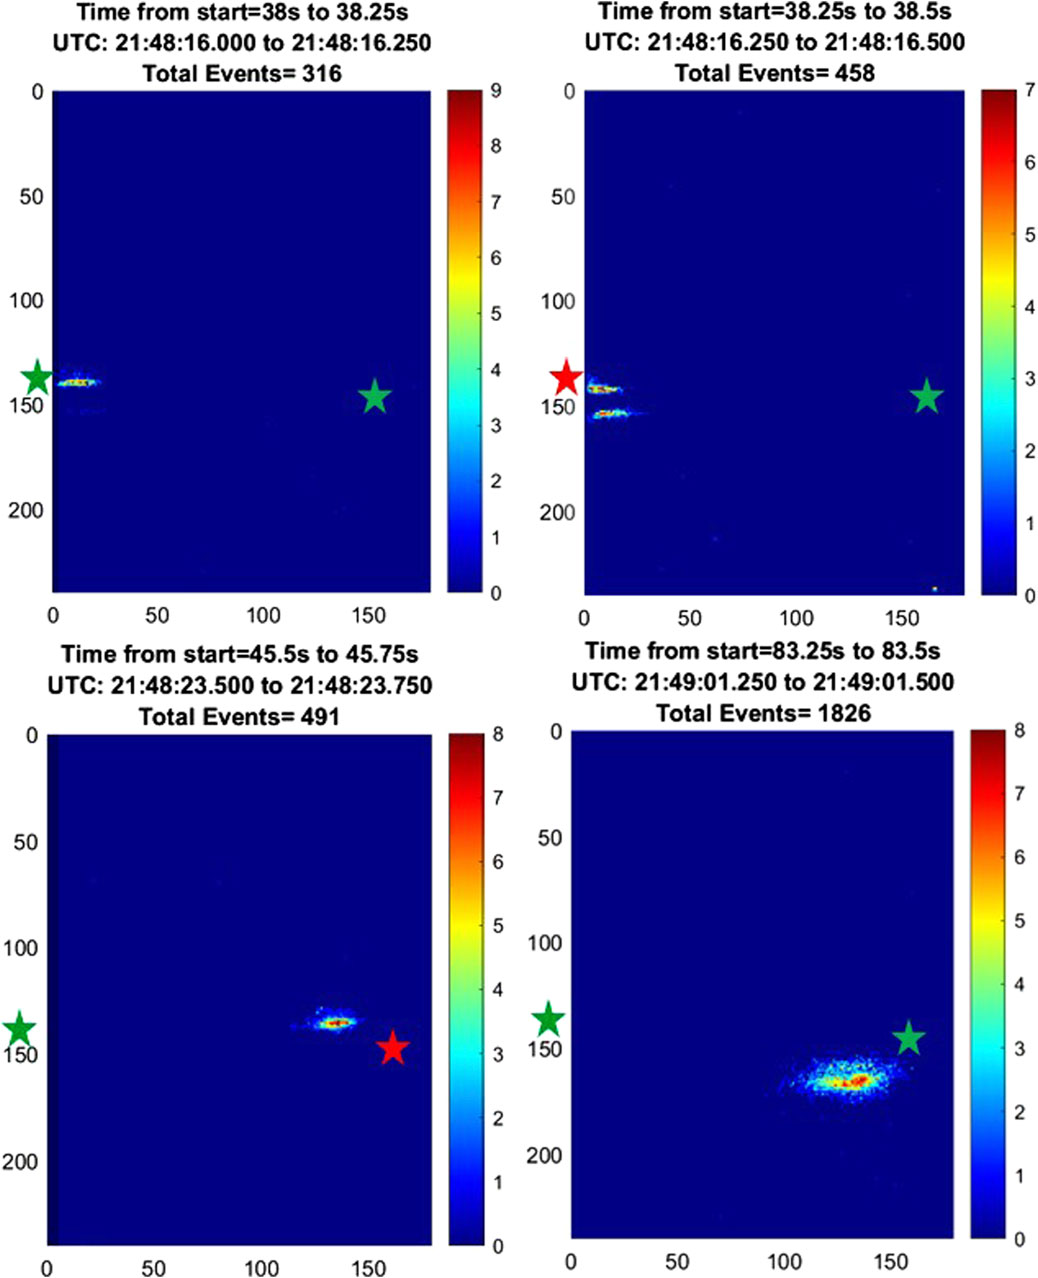
Figure 5. Four lightning flashed recorded with the ram camera on 10 March 2022. The red and green stars denote the position of lighting recorded by GLD360. The red stars are when the GLD360 time is the same as the Falcon Neuro time, and the green stars are when Falcon Neuro records a lighting flash at a different time but in the same general location as GLD360.
The top-left panels of Figure 5 show that Falcon Neuro recorded a flash 250 ms before GLD360 at 21:48:16 UT on the left side of the panel, with the center of the flash located at pixel y = 140, x = 10. The top-right panel of Figure 5 shows this flash intensifying 250 ms later at the same time as the reported GLD360 flash. The bottom two panels show a similar pattern a few seconds later at 21:48:23.5 UT. Now the flash is in a physically different location on the focal plane, centered at approximately y = 140, x = 140 in the bottom-right panel and y = 160, x = 140 in the bottom-right panel. The GLD360 strike aligns most closely in time with the bottom-left panel at 21:48:23.5 UT. Note the GLD360 position is offset slightly (y = 150, x = 160) from where Falcon Neuro records the flash. Given the good time alignment, these seem to be the same flash.
4 Discussion
This paper demonstrates the successful on-orbit observations of lightning with an event-based vision sensor. Lightning detected from both the nadir and ram cameras in orbit can be confirmed using ground-based RF sensors, in this case with GLD360 data. The data presented here reveals that Falcon Neuro detects additional temporal and spatial detail of lightning compared to ground-based RF detection systems. As can be seen in Figures 2 and 3, Falcon Neuro recorded a total of 28 flashes that match four GLD360 reported flashes in terms of time and location. During this pass, we compared over 3 min and 22 s (the approximate time it took Falcon Neuro to pass across the area we compared to GLD360) a total of 290 GLD360 detections, of which 110 were cloud-to-ground (CG) and 180 were intra-cloud (IC). The four flashes that we matched between Falcon Neuro and GLD360 shown in Figure 3 were all ICs. The detection efficiency of GLD360 for ICs are less than for CGs (
One frequent feature repeatably observed is that Falcon Neuro records multiple flashes in the same cloud within a short period of time. The example of Figure 3 shows five re-brightening events within 700 ms. Similar observations are seen in the ram camera.
The multiple flashes seen here in Neuro are similar to Jensen et al. (2023), who reported K-leaders which retrace a leader path from a previous discharge. If these K-leaders occur within a cloud, it is reasonable to expect that the scattered light from the K-leader illuminates the cloud. Jensen et al. (2023) used bi-static VLF and report spatial scale sizes of the K-leaders within clouds of a few to 10 km and temporal scales of 100s of ms. These are similar scale sizes to the examples in Figure 3
Larger spatial scale sizes of lighting in clouds seen from space have been recorded by the Geostationary Lightning Mapper (GLM) on the NOAA Geostationary Operational Environment Satellites (GOES). GLM is a high-speed lighting event detector that uses traditional CCD focal planes framing at 500 frames per second. Differences between frames provide the events, and a sophisticated clustering algorithm is used to report event locations and times. GLM uses a narrow band optical filter centered at the oxygen-plasma emission triplet (777.4 nm) which ensures that the light in the events reported are from hot lightning leaders (Goodman et al., 2013). The GLM CCD array has a unique pixel array providing approximately 8 km resolution over most of the hemisphere in view of the particular GOES satellite. This field of view increases to approximately 14 km per pixel at the edges of the earth (Goodman et al., 2013)
A new clustering method developed by Peterson (2019) reported statistics for the entire 2018 GLM dataset. On average, the horizontal length of flashes was found to be 16.3 km (approximately 2 GLM pixels), with the largest horizontal extent reported at 673 km (Peterson, 2019). The flash evolution in time was calculated by drawing line segments between centroids of groups of clusters. Using this technique, Peterson (2019) reported temporal durations of approximately 100–700 ms in the largest flashes.
Comparing Falcon Neuro data directly with GLM is difficult due to the differences in the instruments. Falcon Neuro has no optical filter but rather gathers light across the visible and near IR spectrum (roughly 400–900 nm). Pixel resolutions in Falcon Neuro are 300 m compared to 8 km in GLM. Finally, as discussed above, Falcon Neuro uses a mixed analog/digital signal chain to produce the events, while GLM relies on differences between the frames recorded at 500 fps.
Despite these differences, the overall results from Falcon Neuro compare favorably with GLM. Figure 6 shows the temporal progression in the centroids of lightning flashes in the same recording shown in Figure 3. The top-left panel of Figure 6 shows all events during the 360 ms under consideration. Additionally, the top-left panel has the centroids of flashes color coded in time. The panels labeled 1–8 show individual 40 ms integrations, with the flash centroid the same color as the panel number. As is evident, in this instance the centroids move in a roughly counter-clockwise direction during the 360 ms. This example is very similar to the GLM analysis reported by Peterson (2019)
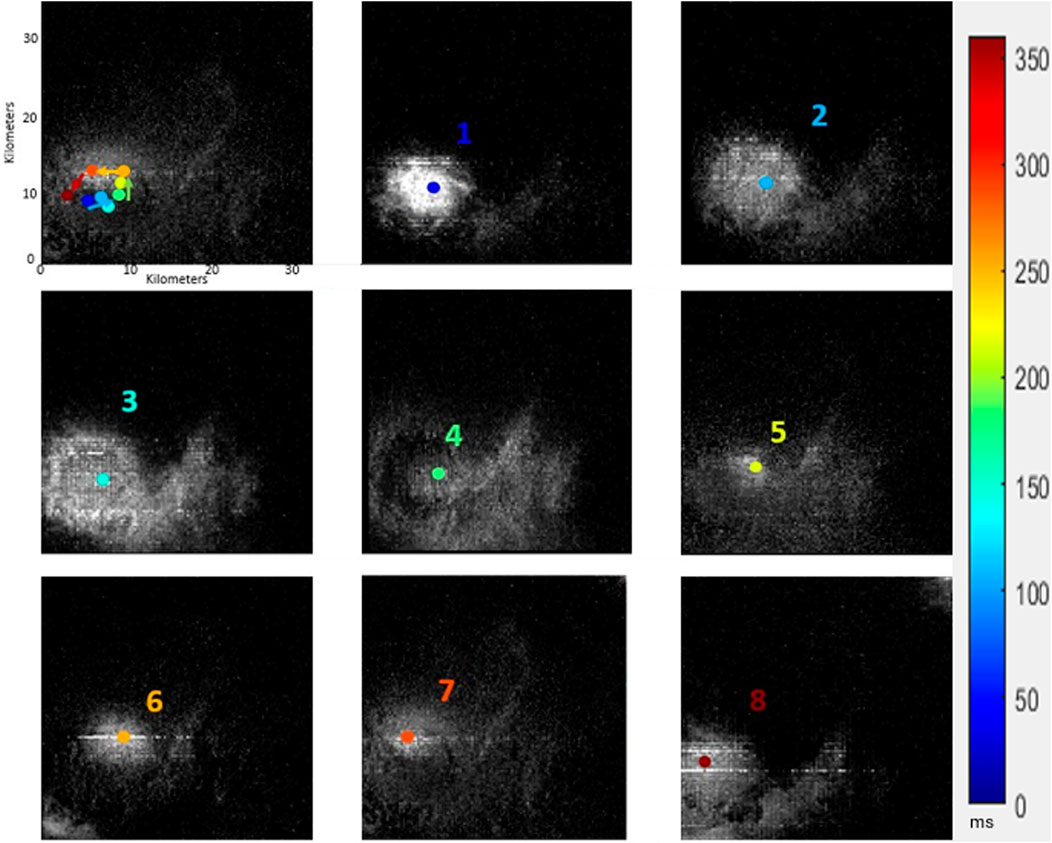
Figure 6. Temporal progression of lightning flash centroids over 360 ms; see text for description.
The lighting imaging sensor (LIS) on the ISS is of a similar design to GLM with pixel resolutions of 4–5 km (Mach et al., 2007). Since both the LIS and Falcon Neuro are mounted on the ISS, they should look at the same lighting. Efforts are currently underway to find and compare data sets on the same lighting flashes with the two instruments.
4.1 Limitations
Several limitations have been identified over the course of the Falcon Neuro mission. The DAVIS 240C sensors currently onboard Falcon Neuro are now outdated technology featuring a focal plane with 240 × 180 pixels. Additionally, the analog portion of the circuit is on the same side of the focal plane as the photodetector, resulting in very low quantum efficiencies of approximately 7%–8%. Gen4 EBVS now available from the manufacturer Prophesee has pixel arrays of 1280 × 720 pixels, with quantum efficiencies over 90%.
The current Falcon Neuro was not designed to record lightning. There is no lightning trigger mode in the software, and the Neuro hardware has fixed fields of view. In order to record lighting with Neuro, we must select times where we are flying over active lightning areas and hope for the best. Additionally, since Neuro was a tech demonstration mission, the bandwidth of the instrument to the ground was limited to 921 kbits/sec. This constraint limited the data recordings to 1–3 min in length. In a few cases, we experimented with longer duration recordings while Falcon Neuro was in eclipse. The two longest recordings were 40 min and 37.21 min respectively. In these recordings, the overall event rate is approximately 1 megabyte per minute. One recording had lightning and one recording did not capture any lightning. This experiment indicates that Falcon Neuro lightning observations are most useful in case studies such as comparisons with other data sets rather than worldwide monitoring of lighting.
Confirming the presence and location of lightning with ground stations from GLD360 is a difficult task, given that there are places within the orbital path of the ISS that are not covered by RF ground stations. Furthermore, those ground stations sometimes do not capture lighting due to technical issues, such as WiFi disconnections at the ground station. Future work comparing Neuro recordings of lightning with those from the NASA LIS instrument on the ISS should prove fruitful.
4.2 Falcon ODIN: a new mission
After identifying potential improvements to a system, and further improvements in EBVS technology, a new mission was devised by ICNS and USAFA to build a better version of Falcon Neuro: Falcon ODIN. This will include improved optics with a 306 mm focal length (FL) lens for the nadir camera, giving an 8 m per pixel resolution and a 50 mm FL lens for the ram camera. The focal planes are the Prophesee Gen4 EVBS IMX 646 camera developed in conjunction with Sony. Additionally, the Falcon ODIN design incorporates an azimuth/elevation (az/el) mirror system for each camera which allows the field of view of the ODIN cameras to swing up to 50° in one direction (along the track for the nadir and vertically for the ram camera) and 10° in the perpendicular direction.
Two traditional framing CMOS cameras with wide fields of view are included in Falcon ODIN to provide context when understanding the EVBS camera data. The context cameras are IDS U3 cameras modified to survive exposure to the atomic oxygen environment found at ISS altitudes. The ram context camera has an 8 mm FL Fujinon lens which gives an 80° field of view, while the nadir context camera uses a 16 mm FL Fujinon lens with a 40° field of view. The two context cameras have fixed fields of view which encompass the entire field of regard of the ram and nadir EVBS cameras.
All four cameras on Falcon ODIN use USB. An industrial grade Jetson TX2 graphical processor unit (GPU) was selected as a single board computer to run the four cameras. Using the Jetson GPU enables the possibility of more advanced software, including possible scheduling software that allows use during periods when live commands are not available to the instrument as well as a lighting trigger developed in conjunction with the lighting data recorded by Falcon Neuro discussed here. Custom power and command and data handling boards are incorporated to power the az/el mirror system as well as pass commands to and data back from Falcon ODIN.
Falcon ODIN has passed environmental testing and has been delivered to the DoD Space Test Program (STP) office in Houston Texas. Integrating into the STP-H10 (Houston 10) mission, it will be installed on the outside of the ISS in early 2025. STP provides integration and, in conjunction with NASA, provides operations support for the STP-H missions.
In addition to the increased spatial resolution, Falcon ODIN will have significantly increased temporal resolution. Ground based testing recording using the same focal plane as that in Falcon ODIN can record lightning details at the 50 micro second level (equivalent to 20,000 frames per second) (McReynolds et al., 2023). This increased performance indicates that Falcon ODIN may be able to make interesting case studies of lightning.
5 Conclusion
Observations of lightning with the sensors in the Falcon Neuro payload were confirmed using RF ground station data from GLD360. Lightning recorded in both the ram and nadir cameras have been correlated in both space and time with the GLD360 data. Multiple isolated increases in the event rate were detected, consistent with the optical detection of reoccurring flashes with the clouds. These may be related to the known propensity of K-leaders within clouds.
The current Falcon Neuro system provides good signal-to-noise event-rate time series at the 1 ms cadence and “pseudo-frame” images at 40 ms cadence. The spatial extent and temporal progression of centroids of the lightning are consistent with that seen in other space-based lighting imagers such as GLM and LIS.
The Falcon ODIN instrument is a follow-on mission to Falcon Neuro with improved focal planes, optics and traditional framing context cameras. Falcon ODIN is scheduled to fly to the ISS on the STP-H10 mission in early 2025. The increased resolution in Falcon ODIN affords exciting new capabilities to study lighting using EVBS cameras.
Data availability statement
The datasets presented in this study can be found in online repositories. The names of the repository/repositories and accession number(s) can be found in the article/Supplementary Material
Author contributions
MM: Conceptualization, Supervision, Writing–original draft, Writing–review and editing. IJ: Conceptualization, Writing–original draft, Writing–review and editing. ZW: Formal Analysis, Software, Visualization, Writing–original draft, Writing–review and editing. RB: Writing–original draft, Writing–review and editing, Methodology. AM: Software, Visualization, Writing–original draft, Writing–review and editing. GC: Software, Visualization, Writing–original draft, Writing–review and editing.
Funding
The author(s) declare financial support was received for the research, authorship, and/or publication of this article. We are funded by Air Force Office of Scientific Research (AFOSR).
Acknowledgments
The authors acknowledge the support of the US Department of Defense (DoD) Space Test Program which provides mission design, spacecraft acquisition, integration, launch, and on-orbit operations support for DoD’s science and technology (S&T) experiments, and also manages all DoD payloads on the International Space Station.
We acknowledge AGI, an Ansys company, and its Educational Alliance Program for donating its Systems Tool Kit (STK) software which was used in geo-referencing the data.
We acknowledge 14th Weather Squadron for providing Global Lightning Dataset Network (GLD360), via Vaisala via 557th Weather Wing.
Conflict of interest
The authors declare that the research was conducted in the absence of any commercial or financial relationships that could be construed as a potential conflict of interest.
Publisher’s note
All claims expressed in this article are solely those of the authors and do not necessarily represent those of their affiliated organizations, or those of the publisher, the editors and the reviewers. Any product that may be evaluated in this article, or claim that may be made by its manufacturer, is not guaranteed or endorsed by the publisher.
Supplementary material
The Supplementary Material for this article can be found online at: https://www.frontiersin.org/articles/10.3389/frsen.2024.1436898/full#supplementary-material
Included are movies rendered from the two datasets referenced in this manuscript. The two datasets are 347 referenced as 23-May-2023 17:10:24 China and 10-Mar-2022 21:47:38 Brazil. The 23-May-2023 17:10:24 348 China pass utilized the Nadir camera, and is a downward looking pass. The 10-Mar-2022 21:47:38 Brazil 349 pass utilized the Ram camera, and is a forward looking pass. 350 Two movies are included related to the 23-May-2023 17:10:24 China pass. One movie is motion 351 compensated, and the other is not. For the movie that is not motion compensated, the raw data from 352 the camera is rendered in 0.04 second intervals to produce frames 0.04 seconds in length. Each frame is 353 presented in a histogram that is 240×180 pixels in dimension, and the movie is played at 25 frames per 354 second to display a rendering of what the Nadir camera actually saw during the pass. The second movie is 355 motion compensated. To perform the motion compensation, objects were observed crossing the FOV of the 356 Nadir camera. The x and y rate of change of these objects was calculated. Then, frames of 0.04 seconds are 357 once again produced, but each frames x and y coordinates are offset by the x and y rate of change relative 358 to time. This produces a tall and wide frame, where events that occur in the same place are stationary in Frontiers 13 In review McHarg et al. Running Title 359 the frame. As lightning flashes occur in the motion compensated movie, red numbers appear in the frame. 360 These numbers correspond to the time and location of the strikes detected concurrently by GLD360 in the 361 same manner as figure 2. 362 Similarly to the uncompensated image, the 10-Mar-2022 21:47:38 Brazil pass was rendered in 0.04 363 second long frames, and then played back at 25 frames per second. There is no motion compensation 364 applied to the 10-Mar-2022 21:47:38 Brazil pass. 365 We also include a CSV file with the event data for each pass; 23-May-2023 17:10:24 China.csv and 366 10-Mar-2022 21:47:38 Brazil.csv. The CSV files are in AER format (row,column,polarity,time) where 367 row and column are integers representing the row and column pixel number for the event. Polarity is 1 368 (increasing) and 0 (decreasing) while the time is a running time in seconds from the beginning of the 369 recording.
References
Brandli, C., Berner, R., Yang, M., Liu, S.-C., and Delbruck, T. (2014). A 240×180 130 db 3 μ s latency global shutter spatiotemporal vision sensor. IEEE J. Solid-State Circuits 49, 2333–2341.
Gallego, G., Delbrück, T., Orchard, G., Bartolozzi, C., Taba, B., Censi, A., et al. (2020). Event-based vision: a survey. IEEE Trans. Pattern Analysis Mach. Intell. 44, 154–180. doi:10.1109/tpami.2020.3008413
Goodman, S. J., Blakeslee, R. J., Koshak, W. J., Mach, D., Bailey, J., Buechler, D., et al. (2013). The goes-r geostationary lightning mapper (glm). Atmos. Res. 125, 34–49. doi:10.1016/j.atmosres.2013.01.006
Jensen, D. P., Shao, X.-M., and Sonnenfeld, R. G. (2023). Insights into lightning k-leader initiation and development from three dimensional broadband interferometric observations. J. Geophys. Res. Atmos. 128, e2023JD039104. doi:10.1029/2023jd039104
Lichtsteiner, P., Posch, C., and Delbruck, T. (2008). A 128$\times$128 120 dB 15 $\mu$s latency asynchronous temporal contrast vision sensor. IEEE J. solid-state circuits 43, 566–576. doi:10.1109/jssc.2007.914337
Ma, M., Tao, S., Zhu, B., and Lü, W. (2005). Climatological distribution of lightning density observed by satellites in China and its circumjacent regions. Sci. China Ser. D Earth Sci. 48, 219–229. doi:10.1360/03yd0204
Mach, D. M., Christian, H. J., Blakeslee, R. J., Boccippio, D. J., Goodman, S. J., and Boeck, W. L. (2007). Performance assessment of the optical transient detector and lightning imaging sensor. J. Geophys. Res. Atmos. 112. doi:10.1029/2006jd007787
McHarg, M. G., Balthazor, R. L., McReynolds, B. J., Howe, D. H., Maloney, C. J., O’Keefe, D., et al. (2022). Falcon neuro: an event-based sensor on the international space station. Opt. Eng. 61, 085105. doi:10.1117/1.oe.61.8.085105
McReynolds, B. J., Graca, R., O’Keefe, D., Oliver, R., Balthazor, R., George, N., et al. (2023). Modeling and decoding event-based sensor lightning response. Unconv. Imaging, Sens. Adapt. Opt. 2023 (SPIE) 12693, 335–352.
Peterson, M. (2019). Research applications for the geostationary lightning mapper operational lightning flash data product. J. Geophys. Res. Atmos. 124, 10205–10231. doi:10.1029/2019jd031054
Rudlosky, S. D., Peterson, M. J., and Kahn, D. T. (2017). Gld360 performance relative to trmm lis. J. Atmos. Ocean. Technol. 34, 1307–1322. doi:10.1175/jtech-d-16-0243.1
Said, R., and Murphy, M. (2016). “Gld360 upgrade: performance analysis and applications,” in 24th international lightning detection conference (international lightning detection conference and international lightning).
Stoffregen, T., Gallego, G., Drummond, T., Kleeman, L., and Scaramuzza, D. (2019). “Event-based motion segmentation by motion compensation,” in Proceedings of the IEEE/CVF international conference on computer vision (ICCV)
Taverni, G., Moeys, D. P., Li, C., Cavaco, C., Motsnyi, V., Bello, D. S. S., et al. (2018). “Front and back illuminated dynamic and active pixel vision sensors comparison,” in IEEE transactions on circuits and systems II: express briefs, 65, 677–681.
Thomas, R. J., Krehbiel, P. R., Rison, W., Hunyady, S. J., Winn, W. P., Hamlin, T., et al. (2004). Accuracy of the lightning mapping array. J. Geophys. Res. Atmos. 109. doi:10.1029/2004jd004549
Xiao, X., Qie, X., Chen, Z., Lu, J., Ji, L., Wang, D., et al. (2021). Evaluating the performance of lightning data assimilation from blnet observations in a 4dvar-based weather nowcasting model for a high-impact weather over Beijing. Remote Sens. 13, 2084. doi:10.3390/rs13112084
Keywords: event based camera, lightning, space, Falcon Neuro, neuromorphic
Citation: McHarg MG, Jones IR, Wilcox Z, Balthazor RL, Marcireau A and Cohen G (2024) Falcon Neuro space-based observations of lightning using event-based sensors. Front. Remote Sens. 5:1436898. doi: 10.3389/frsen.2024.1436898
Received: 22 May 2024; Accepted: 15 August 2024;
Published: 13 September 2024.
Edited by:
Gennadi Milinevsky, Taras Shevchenko National University of Kyiv, UkraineReviewed by:
Oleksandr Koloskov, University of New Brunswick Fredericton, CanadaBoris Zilyaev, National Academy of Sciences of Ukraine (NAN Ukraine), Ukraine
Copyright © 2024 McHarg, Jones, Wilcox, Balthazor, Marcireau and Cohen. This is an open-access article distributed under the terms of the Creative Commons Attribution License (CC BY). The use, distribution or reproduction in other forums is permitted, provided the original author(s) and the copyright owner(s) are credited and that the original publication in this journal is cited, in accordance with accepted academic practice. No use, distribution or reproduction is permitted which does not comply with these terms.
*Correspondence: Matthew G. McHarg, bWF0dGhldy5tY2hhcmdAYWZhY2FkZW15LmFmLmVkdQ==