 Christian Au
 Michel Tsamados
 Petru Manescu1
- 1Department of Computer Science, University College London, London, United Kingdom
- 2Department of Earth Sciences, University College London, London, United Kingdom
Introduction: This research explores the application of generative artificial intelligence, specifically the novel ARISGAN framework, for generating high-resolution synthetic satellite imagery in the challenging arctic environment. Realistic and high-resolution surface imagery in the Arctic is crucial for applications ranging from satellite retrieval systems to the wellbeing and safety of Inuit populations relying on detailed surface observations.
Methods: The ARISGAN framework was designed by combining dense block, multireceptive field, and Pix2Pix architecture. This innovative combination aims to address the need for high-quality imagery and improve upon existing state-of-the-art models. Various tasks and metrics were employed to evaluate the performance of ARISGAN, with particular attention to land-based and sea ice-based imagery.
Results: The results demonstrate that the ARISGAN framework surpasses existing state-of-the-art models across diverse tasks and metrics. Specifically, land-based imagery super-resolution exhibits superior metrics compared to sea ice-based imagery when evaluated across multiple models. These findings confirm the ARISGAN framework’s effectiveness in generating perceptually valid high-resolution arctic surface imagery.
Discussion: This study contributes to the advancement of Earth Observation in polar regions by introducing a framework that combines advanced image processing techniques with a well-designed architecture. The ARISGAN framework’s ability to outperform existing models underscores its potential. Identified limitations include challenges in temporal synchronicity, multi-spectral image analysis, preprocessing, and quality metrics. The discussion also highlights potential avenues for future research, encouraging further refinement of the ARISGAN framework to enhance the quality and availability of high-resolution satellite imagery in the Arctic.
1 Introduction
This research explores the application of artificial intelligence in generating high-resolution (HR, here consider to be sub-10 m) satellite imagery of arctic surfaces from low-resolution images. The Arctic landscapes and sea ice rely heavily on satellite Earth Observations (EO) for regular monitoring because of its remote nature and harsh conditions. Resolving features in this HR range is important for modelling developments and validations as several sea ice parameterizations aim to represent features such as melt ponds, leads, floe size, and sea ice ridges that span those length scales (Tsamados et al., 2015). HR imagery is also critical for operational activities ranging from shipping (Wagner et al., 2020), and iceberg detection (Soldal et al., 2019), to safe travel on sea ice for local communities (Segal et al., 2020). Acquiring arctic surface imagery encompassing detailed surface characteristics at those scales is possible from optical sensors such as Copernicus Sentinel-2 (10 m resolution) but sampling is limited by the size of the images (50 km tiles), the cloud coverage or the lack of sunlight. Coarser optical images such as Sentinel-3 (300 m resolution) significantly increase the sampling frequency and spatial coverage but are missing HR features. In short, even with new satellite missions and better sensors, finding the optimal compromise between coverage and resolution is likely to remain an issue (Pope et al., 2014; Gabarró et al., 2023) and the role of innovative machine learning algorithms to generate realistic HR data as proposed in this paper or to interpolate existing satellite data (Gregory et al., 2021) will remain important.
The objective of this study is to evaluate the ability of deep learning models to generate super-resolved (SR) arctic surface images from low spatial resolution remote sensing (RS) images. Recent research on the super-resolution of satellite imagery has focused on a precise reconstruction of high-resolution imagery based on lower-resolution input data up to a factor of approximately a 3.3-fold resolution increase. Geographically, recent research has focused on data of landscapes in more moderate climates or urban, built-up environments. In contrast, we focus on arctic environments and the generation of perceptually valid HR images with an up to 30-fold resolution increase. This setting intends to represent and enable real-life applications in which extremely coarse imagery, e.g., from Sentinel-3 satellites, can be super-resolved into images of sufficient realism that can inform model development and operational needs. As such, we focus on reconstructing the RGB bands of satellite images to generate perceptually valid and relevant imagery.
We propose the Arctic Remote Imagery Synthesis using a Generative Adversarial Network (ARISGAN) to generate highly detailed SR images of the arctic environment, both land and sea surfaces, with their respective characteristics. The remainder of this work is organized as follows. Section 2 introduces related work on the super-resolution of satellite imagery through various state-of-the-art techniques. Section 3 provides a detailed description of the ARISGAN framework and the experimental setup in terms of the dataset, loss function, and training environment. Section 4 presents and discusses the experimental results. Conclusions are summarized in section 5, and recommendations for future work are provided in section 6. The companion source code for this project is provided at https://github.com/ucabcbo/ARISGAN.
2 Related works/background
2.1 State of the art super-resolving models
Satellite imagery has become essential in various applications, from environmental monitoring and resource management to disaster response, military surveillance, or a plethora of further applications (Liu P. et al., 2022). Super-resolution can be based on single satellite images, multiple images of the same satellite taken at different revisits, i.e., multi-temporal images, or various images of the same patch of land obtained from multiple satellites. Each satellite image thereby consists of multiple wavelength bands, which may deviate in their spatial resolution, dependent on the respective satellite’s imaging instruments, referred to as multi-spectral images. Different goals and techniques are used to approach a super-resolution task. One common approach is to super-resolve a low-resolution band out of a multi-spectral image to the highest-available resolution band of the same image. This is useful when the highest resolution band contains essential information that cannot be obtained from the other bands. Another objective is to super-resolve an image to a resolution beyond the native resolution of the respective sensor. This is useful for applications requiring fine details, such as object detection or identifying and analyzing surface properties (e.g., (Fernandez et al., 2021a; Lei et al., 2022; Tarasiewicz et al., 2023)). Traditional super-resolution techniques are Component Substitution (CS), Multi-Resolution Analysis (MRA), or Variational Optimization (VO). CS is a simple and widely used method for SR, where the high-frequency details of the HR image are transferred to the LR image. Conversely, MRA uses wavelet transform to decompose the images into multiple scales and fuse them in the wavelet domain. VO is a more advanced technique that formulates SR as an optimization problem. The objective is to find the best estimation of the LR image that matches the HR image (Liu et al., 2021; Lei et al., 2022).
However, with recent advancements in deep learning, convolutional neural networks (CNNs) and generative adversarial networks (GANs) have emerged as promising tools for SR, including RS imagery. These approaches do not require explicitly modelling the statistical or spatial relationships between the HR and LR images and instead learn the mappings between the images directly from the data. Fundamental work on using CNN and GAN models for image super-resolution has been performed by Dong, et al. (Dong et al., 2015) with the SRCNN model and Ledig, et al. (Ledig et al.) with the SR-GAN model. Most current state-of-the-art models refer to these works, adding modular blocks of network elements to improve performance under given circumstances. Due to their relatively low complexity and availability of datasets for machine learning research, single-image-based models are among the most widely researched. Their unique advantage is that the complex task of co-locating, and co-registering multiple images is not required and thus provides a more appealing starting point for machine learning research. Masi, et al. (Masi et al., 2016) developed the first use of SRCNN specifically for single image pansharpening of RS images, followed by an extension by Scarpa, et al. (Scarpa et al., 2018), focusing on feature identification and extraction. It builds the basis for current CNN models like the ones by Fernandez, et al. (Fernandez et al., 2021a; Fernandez et al., 2021b). SR-GAN was enhanced to ESRGAN (Wang et al., 2018) and builds the basis for several GAN models developed for the RS context, such as MARSGAN (Tao et al., 2021a) and RS-ESRGAN (Romero et al., 2020). MARSGAN was developed to super-resolve images of Mars. However, it represents the basis for TARSGAN (Tao et al., 2021b) on Earth satellite imagery, thus displaying the transferability of models across various types of RS imagery. S2GAN (Zhang et al., 2020) represents an application of SR-GAN specifically to Sentinel-2 imagery and has been further developed, based on additional research on the DSen2 (Lanaras et al., 2018) model, to a Wasserstein-GAN (Arjovsky et al., 2017) named DSen2-WGAN (Latif et al., 2022). DSen2 also inspired other current Sentinel-2-based models like S2Sharp (Ulfarsson et al., 2019), DeepSent (Tarasiewicz et al., 2023) and SRS3 (Fernandez et al., 2021a). Further, PSGAN was developed as a specifically pansharpening-focused GAN model (Liu et al., 2018a) and is the basis for other current models like the one by Liu, et al. (Liu et al., 2021). CNN and GAN-based models are equally frequently used across the given applications in current research. Table 1 provides an overview of investigated state-of-the-art models.
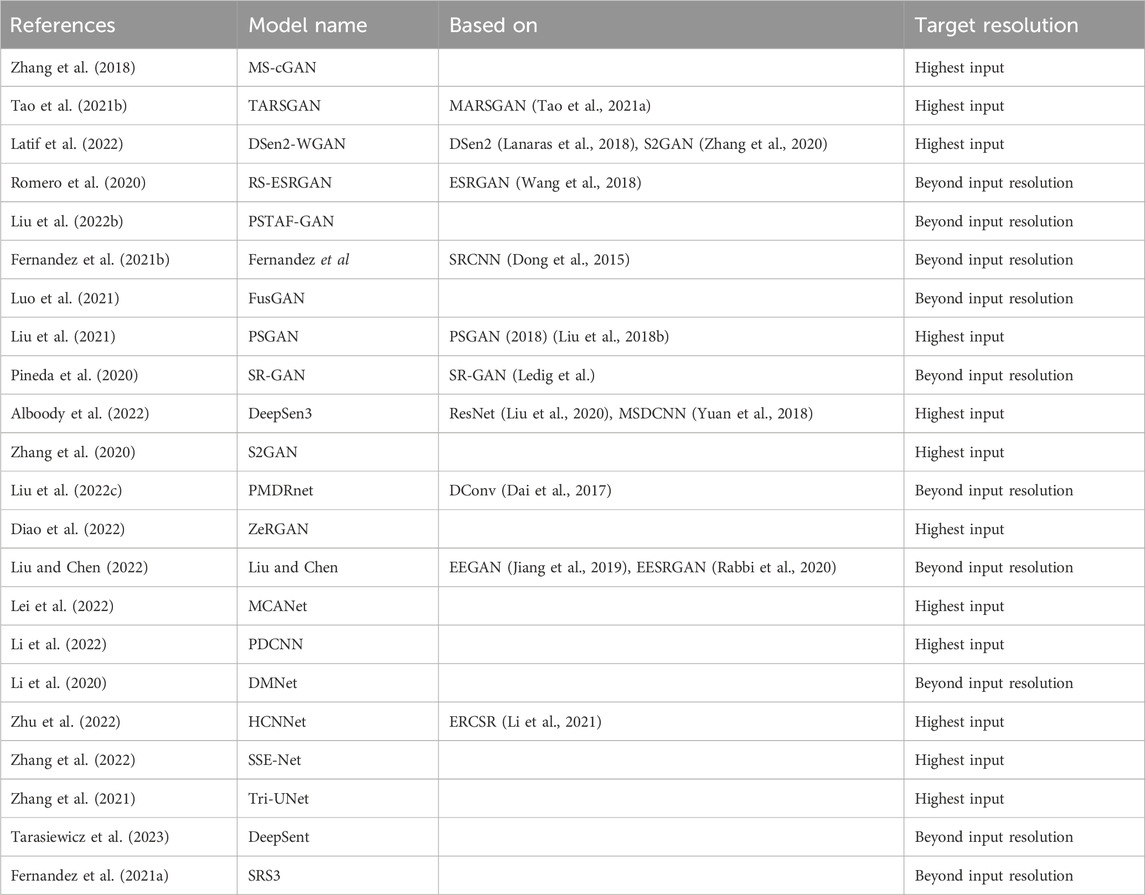
Table 1. Overview of state-of-the-art SR models.
2.2 Application in the arctic context
The state-of-the-art models listed in the previous section could in principle be adapted to the arctic landscapes. However, a range of considerations are to be accounted for due to the specific challenges in these environments (Liu X. et al., 2022; Webster et al., 2022). The arctic environment is, to some degree depending on the season, covered by snow and ice. This results in a shallow contrast in RS imagery, making identifying edges particularly challenging. Further, as land and water are covered by ice and snow for most of the year, there is a risk of an unbalanced dataset, as the direct view of the underlying darker land or ocean surfaces may be underrepresented. Snow, ice, and cloud cover are perceptually similar when viewed on satellite imagery. While Sentinel-2 data include cloud information, this data is unreliable in arctic environments, which currently makes manual cloud identification necessary. An ice surface can have a complex texture, particularly on flat surfaces like the sea. Sea ice can have cracks, leads, and ridges, making distinguishing the ice edge from other features difficult. The reflectance of sea ice can vary significantly depending on factors such as snow cover, surface melt, and impurities, making it challenging to estimate ice surface properties accurately (Perovich et al., 2002).
Sea ice is a dynamic system that can move and change rapidly over short time scales, making it challenging to track between satellite images. Ice and snow characteristics may also vary rapidly on land but in contrast to sea ice the underlying terrain is fixed. Due to its reflectance properties, sun position and light incidence at the time of the image may significantly change the coloring of the image. Further, specifically on mountainous land, due to the northern geography, mountains or snow dunes may cast vast shadows, impeding a direct view of the surface. Consequently, considering current research findings, specific focus areas to observe in the study include the following. Edge detection and sharpness of edges and scene transitions are proposed areas for further research by Tao, et al. (Tao et al., 2021b) regarding TARSGAN. Observation on the inclusion of artefacts and repetitive patterns, as recommended for further research by multiple studies, e.g., Tarasiewicz, et al. (Tarasiewicz et al., 2023) and Tao, et al. (Tao et al., 2021b) regarding DeepSent and TARSGAN, respectively. Embed quality management in image pre-processing to ensure high-quality input data relevant to the scene under research, as suggested by, e.g., Liu, et al. (Liu et al., 2021), Pineda, et al. (Pineda et al., 2020) and Alboody, et al. (Alboody et al., 2022) in the studies on PSGAN, SR-GAN, and DeepSen3, respectively. As Liu, et al. (Liu X. et al., 2022), in the context of PMDRnet propose to ensure temporal synchronicity between multiple satellite imagery, this study observes and discusses the impact of images with lower synchronicity and higher rates of change.
The research objective to super-resolve Sentinel-2 and Sentinel-3 images to synthetic and realistic high-resolution arctic imagery is therefore a novel and challenging application of remote sensing super-resolution techniques. The resolution difference we are exploring is more extensive than in the typical SR use cases, while the researched geographic area poses unique properties dissimilar to more frequently studied landscapes or urban environments.
3 Data and methods
3.1 Dataset
To attempt super-resolution up to a factor of 30, this study conducted two main experiments: 1) Super-resolving Sentinel-3 images to the resolution of the RGB bands of Sentinel-2 images, and 2) super-resolving the downsampled RGB bands of Sentinel-2 images back to their original resolution. Sentinel-3 pixels have a spatial resolution of 300 m, while Sentinel-2 pixels in the RGB bands B2, B3 and B4 have a spatial resolution of 10 m, thus representing a 30x higher resolution. For the additional experiment, Sentinel-2 images were downsampled by a factor of 12. Thus, their reconstruction represents a 12x super-resolution. Sentinel-2 refers to a single image as a granule. Granule codes define image locations, each spanning an area of approximately 100 by 100 km. For Sentinel-2 imagery, a perpetually fixed set of granule codes is defined, ensuring each code represents a precise location on the planet’s surface (European Space Agency, 2023b).
All satellite products are downloaded form the Copernicus Dataspace portal https://dataspace.copernicus.eu/. For this study, six granule codes surrounding the area of Pond Inlet were used: 17XNB, 17XNA, 18XVG, 18XVF, 18XWG, and 18XWF, covering an area of approximately 60,000 square kilometers. We chose Mittimatalik (Pond Inlet) as the wider region of interest for developing and testing the ARISGAN algorithm. This is motivated by ongoing collaborations with the local communities as part of the separately funded research project Sikuttiaq (https://www.cinuk.org/projects/sikuttiaq/). We downloaded all available Sentinel-2 and Sentinel-3 imagery since 2017 for the region defined by the coordinates (min longitude = 83W, max longitude = 74W, min latitude = 71, max latitude = 74) and we find that focusing our work on a smaller region of the Arctic reduces the data burden while remaining sufficient for training ARISGAN. Figure 1 visualizes the geographic location of the selected granule codes, and we describe next our data collocation approach.
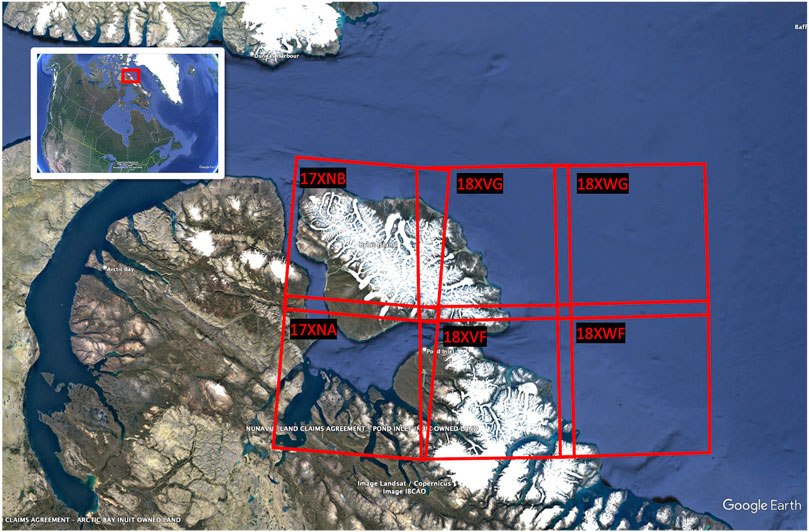
Figure 1. Location of selected Sentinel-2 granule codes.
The goal was to obtain a set of Sentinel-2 images with the corresponding Sentinel-3 images covering the same area, taken within a short timeframe, to ensure similar environmental conditions for accurate super-resolution. The first step in the process was to conduct a comprehensive search for Sentinel-2 images that covered the Pond Inlet area. The search criteria were set to identify images acquired within 60 min of a corresponding Sentinel-3 image to ensure temporal synchronicity and minimize variations in lighting, ice and snow conditions, and cloud cover between the two images. The 60-min interval was chosen to identify a sufficiently large dataset. This search identified 1,691 Sentinel-2 granules with their respective Sentinel-3 counterparts. The images covered various times of day, dates and months from 2017 to 2023, in order to provide a diverse representation of the surface conditions in this region. We note that in the case of mobile sea ice (in contrast to land ice or fast ice), ice movement may already be noticeable even within 60 min between these images and might reduce the quality of the training data.
As Sentinel-2 data cannot accurately predict the cloudiness of the images in this region, a manual review was conducted to identify only those images essentially free from cloud coverage, leading to a final set of 177 Sentinel-2 granules and their Sentinel-3 counterparts, balanced across the selected six granule codes. The selected Sentinel-2 and their corresponding Sentinel-3 images were processed using the ESA SNAP software in version 9.0.0 (European Space Agency, 2023a). SNAP provides tools for Sentinel satellite image processing and co-registration. Sentinel-2 images were reduced to only bands B2, B3 and B4, representing the RGB bands. All of these are available in 10-m resolution; thus, no further resampling was required. The Sentinel-3 images were reduced to bands Oa01_radiance through Oa21_radiance, and any auxiliary bands were removed, resulting in 21 remaining channels, all available in 300 m-resolution.
The Sentinel-2 and -3 images were collocated using the raster collocation within SNAP and Sentinel-2 as master images, as the area covered by a Sentinel-2 image is vastly smaller than those of Sentinel-3 images. The Sentinel-3 bands were upsampled to 10-m resolution using nearest neighbor resampling, ensuring that the spatial structure of the original pixels remained intact (Ruescas and Peters, 2023). After the collocation process, the paired Sentinel-2 and Sentinel-3 images were further processed to create a diverse and comprehensive dataset for training the super-resolution model. The images were randomly cropped into 200 tiles per granule, each measuring 256 × 256 pixels and thus an area of 2,560 by 2,560 m. The random cropping ensured that various regions within the Sentinel-2 and Sentinel-3 images were captured, providing a more representative dataset for training. Additionally, the cropped tiles were randomly rotated by 0, 90, 180, or 270° to introduce further variability and minimize the risk of overfitting.
The image size of 256 × 256 Sentinel-2 pixels represents approximately 32 × 32 pixels of a corresponding Sentinel-3 image. Thus, this tile size was chosen to balance computational efficiency and the amount of input information available, paired with the typical image sizes used in the reviewed state-of-the-art models. See Supplementary Table S1 for details on resulting computational efficiency. Due to the way Sentinel-2 granules are provided by ESA, not necessarily covering the full area of a defined granule code, all tiles not fully within a visible image were disregarded. Likewise, if the collocation with Sentinel-3 resulted in only a partial overlap, those tiles that did not have full Sentinel-3 coverage were also excluded. These data processing steps finally resulted in a dataset comprising 26,844 image pairs. Each pair consisted of a cropped Sentinel-2 tile and its corresponding Sentinel-3 tile, each aligned in spatial and temporal dimensions as closely as possible. A large dataset was essential to provide sufficient training data for the super-resolution model to learn and generalize effectively. At the same time, it enabled a balance between sufficiently focused images representing distinct characteristics of the ground surface under research while representing sufficient diversity within that domain by covering multiple times of day, multiple months, and a large Earth surface area.
Throughout the pre-processing steps, quality assurance was performed to ensure the accuracy and consistency of the dataset. Visual inspection was carried out after each step, e.g., to review image quality and verify that the collocated image pairs represented the same area and exhibited similar environmental conditions. Cloudy and otherwise low-quality images were deselected from the ground truth.
Due to the significant differences between land- and sea-focused surfaces in the Arctic region, the dataset was split between land and sea images using a mask differentiating the two surface types by geographic location. The mask was applied to all images, creating two separate datasets for training. See Figure 2 as an example of Sentinel-2 granules with a land- and sea-focus in granules 17XNB and 18XWG, respectively. The final land dataset contained 13,662 image pairs, and the sea dataset contained 13,182 pairs. These were randomly split between training and test dataset each, resulting in overall 25,457 training and 1,387 test image pairs. By creating separate datasets for sea and land regions, the super-resolution model could be trained on targeted data, allowing it to specialize in enhancing specific areas of interest. This segmentation also facilitated a more focused analysis and evaluation of the model’s performance in sea and land areas.
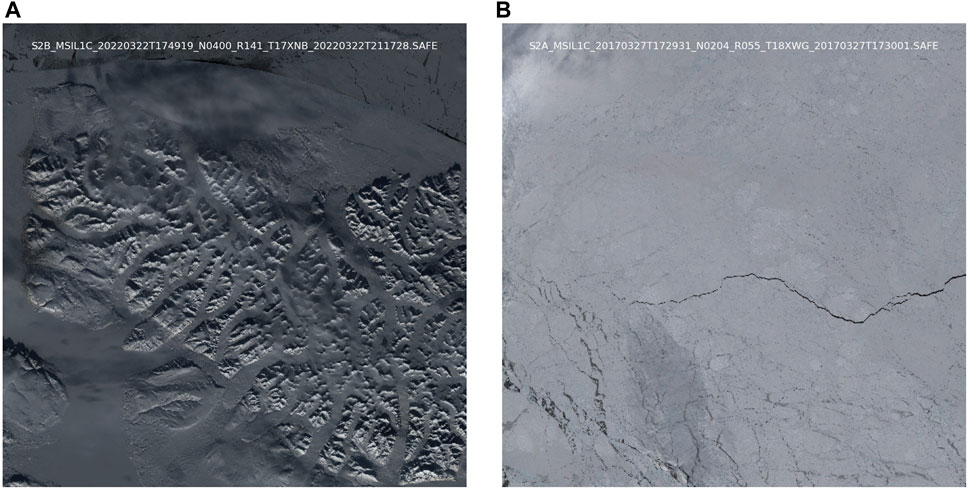
Figure 2. (A, B) Sample Sentinel-2 granules 17XNB and 18XWG.
After this step, all location and other auxiliary data except pixel values across all channels were removed from the image files to ensure those did not interfere or impact the training task. Next to the Sentinel-3 input data, a separate set of input data was prepared by downsampling the Sentinel-2 images by factor 12. For this task, average Resampling of the rasterio library was used, ensuring that the resulting downsampled Sentinel-2 images maintained a balanced representation of the original data using weighted average pixel representations (Mapbox Inc, 2023). By employing this approach, the training process effectively accommodated the distinctive characteristics of the downsampled Sentinel-2 input while ensuring seamless integration into the overall super-resolution task. In summary, for all experiments, four datasets were made available. Sea-focused imagery and land-focused imagery, each with input data consisting of either 12x downsampled Sentinel-2 images, or Sentinel-3 images with 30x lower spatial resolution. This setup was chosen to enable a broad basis for analyzing and identifying the behavioral strengths and limitations of the models under research. Each architecture was set up to allow both 3-channel Sentinel-2 images and 21-channel Sentinel-3 images in its input layer.
3.2 Network architecture
3.2.1 Generative adversarial networks
CNNs and GANs have been employed in recent research in almost equal split. The main differentiation factors between the models are their concrete network architectures, included modules, and the applied loss functions. A broad range of modules has been applied to the baseline models in different studies and achieved superior results in their specific context compared to other state-of-the-art models (see overview in Table 2). A common challenge for the super-resolution task, independent of the technical implementation, is the availability of ground truth data. As a typical approach, available high-resolution data is downsampled to a lower resolution using either Wald’s Protocol (Wald et al., 1997) or Bicubic Interpolation (Keys, 1981). However, using real-world data is assumed to deliver more realistic results and is thus preferred. Especially for the super-resolution task beyond the input resolution, imagery from other satellites or available datasets with higher resolution is used instead (Garzelli, 2016; Cai et al., 2019).
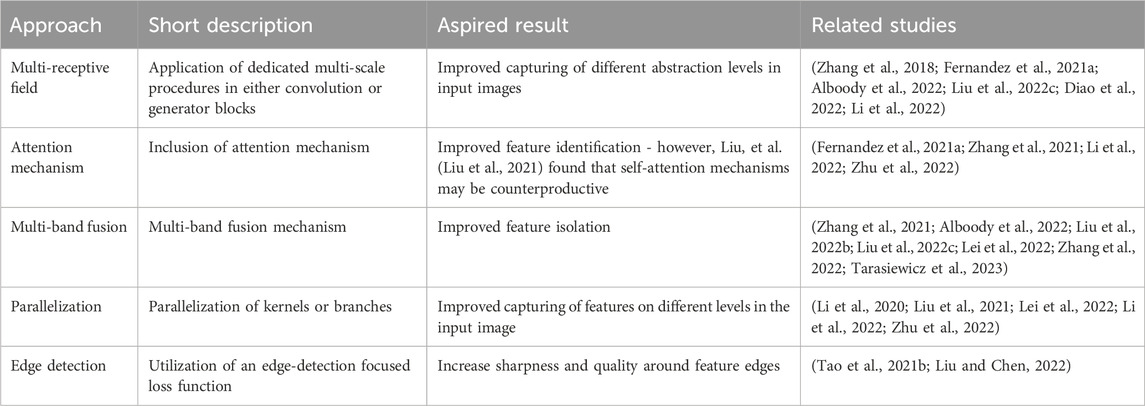
Table 2. Modules included in studies or suggested for further research.
In recent years, the efficacy of Generative Adversarial Networks (GANs) in super-resolution tasks has been widely recognized, owing to their capacity to produce high-quality outputs enriched with intricate textures. In his foundational work, Goodfellow, et al. (Goodfellow et al., 2014) proposed a framework where two neural networks, Generator G) and Discriminator D), are concurrently trained. The primary objective of the Generator network is to create new data samples by capturing the underlying distribution present in the training data. Meanwhile, the Discriminator network assesses the generated samples’ authenticity. It evaluates the likelihood of the generated data corresponding to the actual training distribution rather than being synthesized by G. This training process entails a dual optimization process: minimizing the error between generated and real samples while simultaneously maximizing the ability to distinguish real from generated (fake) samples. This optimization objective involves both networks, G and D, thus creating a symbiotic learning dynamic.
Figure 3 illustrates the interconnectedness of these networks. Notably, the Generator solely interacts with input data, whereas the Discriminator accesses real and generated data (Creswell et al., 2018).
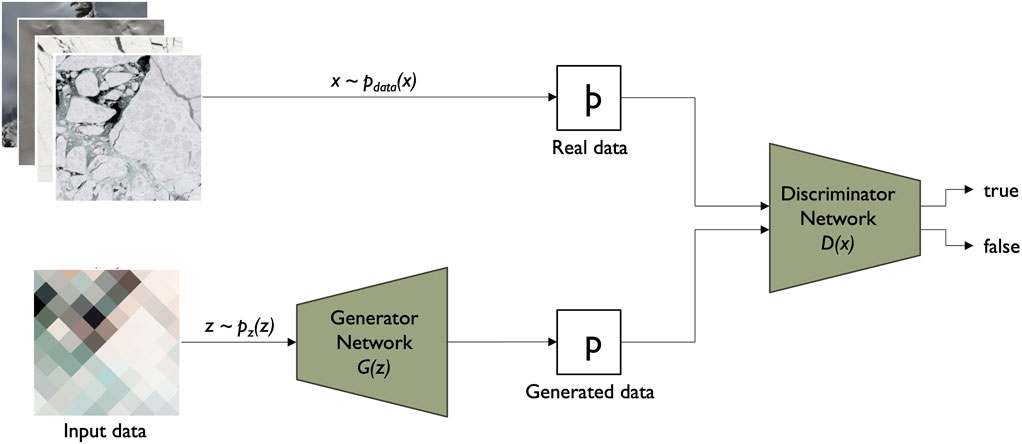
Figure 3. Principal GAN architecture.
3.2.2 Deep network modules
In addition to reviewing recent research findings, several models with promising properties for the research at hand have been identified and set up to assess their performance in the specific context of arctic imagery. The models under evaluation included TARSGAN, SRS3, DMNet, Pix2Pix, SR-GAN, PSGAN, and DSen2-WGAN. Each model was subjected to a series of experiments, focusing on their performance in capturing fine details, preserving edge information, and handling the monotonous coloration often present in arctic images.
We propose a new architecture, ARISGAN which combines different modules from the above-mentioned architecture in an effective way. These selected modules aim to address the specific challenges of edge detection, fine detail preservation on the plain ice surface, and the monotonous image coloring in ice and snow imagery. The following components are incorporated into the ARISGAN architecture and visualized in Figures 4–6.
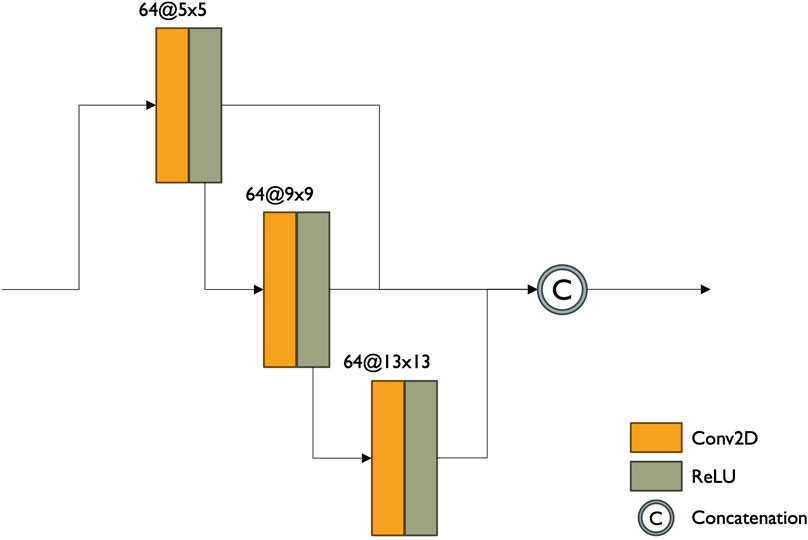
Figure 4. Serialized dense multireceptive field architecture.
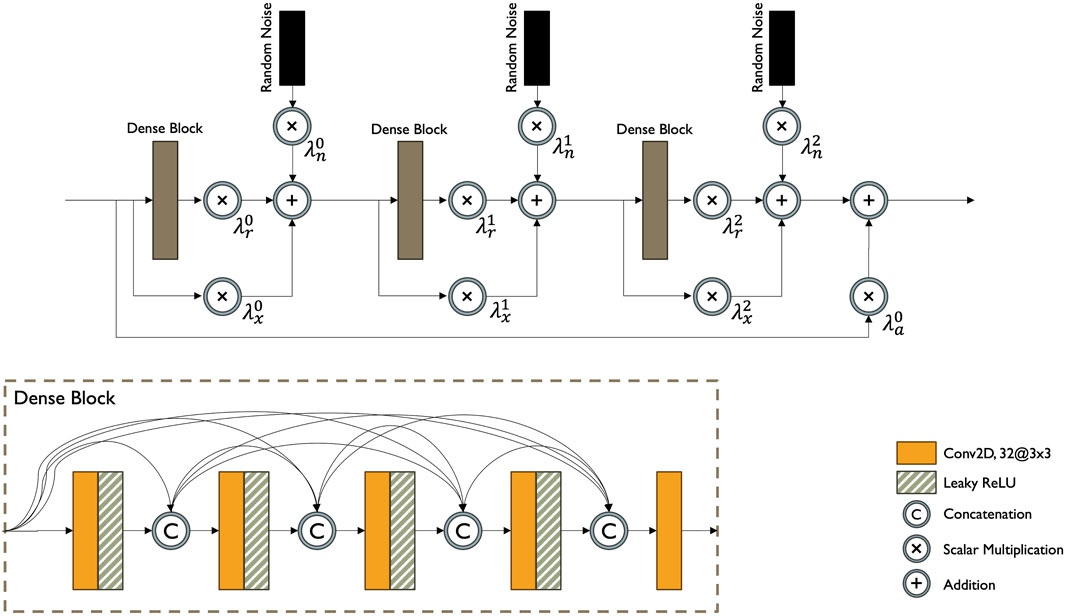
Figure 5. Attention-based wavelet residual dense block architecture.
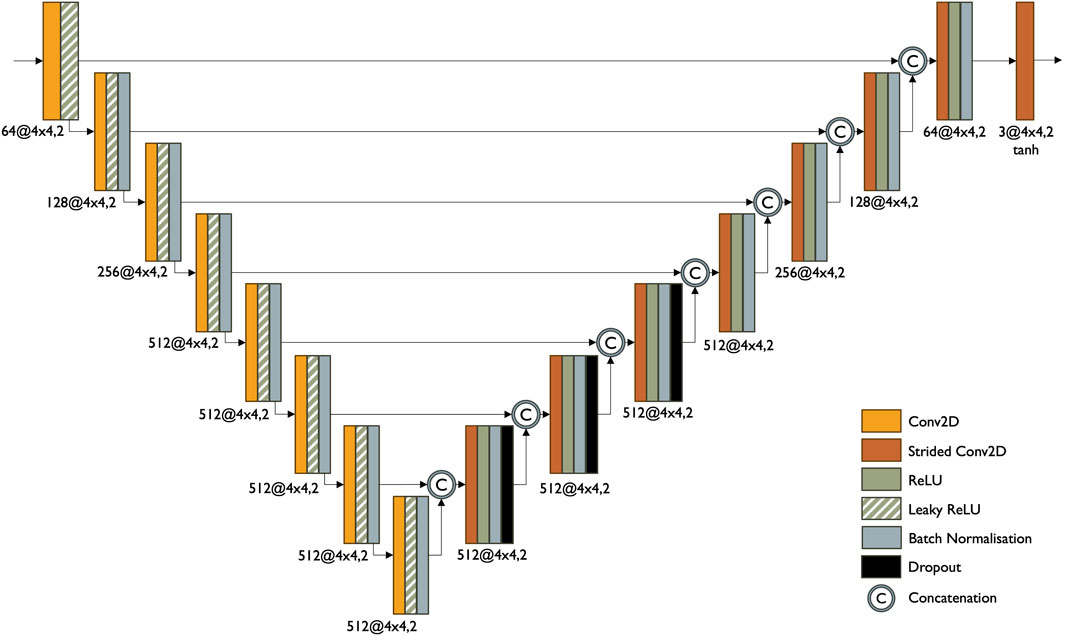
Figure 6. Principal GAN architecture.
3.2.2.1 Dense Multireceptive Field (DMF)
The Dense Multireceptive Field in the SRS3 model by Fernandez, et al. (Fernandez et al., 2021a), similar to the Dense Multireceptive Network (DMNet) proposed by Li, et al. (Li et al., 2020), has shown promising results in capturing various abstraction levels in input images. This characteristic may be particularly beneficial for handling the coarse resolution of foreseen input images and effectively capturing edges and transitions between individual pixels.
By incorporating the DMF, the ARISGAN architecture is intended to accurately represent the complex variations present in arctic imagery despite a large resolution variance. The module has shown capable of capturing diverse feature representations with varying receptive fields and levels of abstraction, enabling comprehensive data characterization in the two previous studies.
The module consists of seven layers, namely, three convolution/ReLU combinations with varying kernel sizes, each utilizing 64 filters, and one concatenation layer. The convolution layers are either serialized as in SRS3 or parallelized as in DMNet. ARISGAN employs the serialized approach.
The convolutional layers progressively increase their kernel size from 5 × 5 to 9 × 9 and 13 × 13, respectively. The DMF module fosters dense connections through the concatenation layer, facilitating the extraction of feature maps with different receptive fields. By expanding the initial small receptive field hierarchically, the module generates multiple representations at various levels of abstraction, encompassing broader spatial contexts and features. This ability proves particularly beneficial in addressing the low spatial resolution challenges posed by Sentinel-3’s Ocean and Land Color Instrument (OLCI) sensor.
3.2.2.2 Dense block (DB)
TARSGAN by Tao, et al. (Tao et al., 2021b) incorporates an Attention-Based Wavelet Residual in Residual Dense Block (AWRRDB). The AWRRDB enhances the more traditional Residual Dense Block (RDB) as used by Romero, et al. (Romero et al., 2020) and the Residual in Residual Dense Block as proposed by Liu and Chen (Liu and Chen, 2022) with attention mechanisms and wavelet transforms. These are intended to help the model to focus on relevant features in the underlying imagery, particularly for preserving details and patterns that may otherwise be lost in the low-resolution input images.
Inspired by the promising ESRGAN (Wang et al., 2018) and AWSRN (Wang et al., 2019) models, AWRRDB introduces two essential modifications. Firstly, the concept of Adaptive Weighted Residual Units (AWRU) is applied, where instead of using a fixed residual scaling value, AWRRDB employs eleven independent weights for each RDB in the structure. These adaptive weights are learned during training, allowing for more effective information flow and improved gradient propagation throughout the network. The second modification introduces Gaussian noise inputs after each RDB, adding stochastic variation to the generator while maintaining localized effects without altering the global image perception.
Together, these enhancements are intended to enable ARISGAN to efficiently capture and model complex relationships between the input and output in the generator, contributing to improved super-resolution performance for arctic imagery.
The block has shown promising results in capturing the relationship between the different output channels of the generated image in initial experiments while not being able to reach the resolution of the ground truth images. However, experiments using the entire AWRRDB block in combination with other modules were prone to mode collapse, which resulted in only the dense block (DB) itself being adapted for the final generator architecture, as outlined in Section 3.2.3 below.
3.2.2.3 Pix2Pix
Pix2Pix, as proposed by Isola, et al. (Isola et al., 2018), is a conditional GAN that has successfully generated high-quality images at the correct target resolution.
It employs a U-Net structure with skip connections, allowing it to capture fine-grained details and maintain contextual information during image translation. The skip connections facilitate the fusion of high and low-level features, generating realistic and visually appealing outputs. Dropout layers are included to enhance generalization and mitigate overfitting. These elements are intended to assist in preserving fine details and sharp edges in the super-resolved arctic images.
While Pix2Pix has not been explicitly developed for super-resolution but merely for image translation purposes, its features are intended to aid the generation of perceptually well-defined output images in line with the variability of input images.
Pix2Pix’s discriminator network assesses the realism of the generated images compared to the ground truth, enhancing the adversarial training process. The conditional GAN framework enables Pix2Pix to learn mappings between input and output domains. As such, the discriminator architecture will also serve as the basis for ARISGAN’s discriminator.
By combining the selected modules, the final architecture is intended to address the specific challenges associated with the super-resolution of arctic imagery. The Pix2Pix model’s ability to generate high-quality images at the target resolution is complemented by the DB block’s capability to focus on relevant features and output channel coherence. At the same time, the DMF’s capacity to capture different abstraction levels supports the manifold super-resolution. The integration of these components is intended to ensure that the model can produce super-resolved sea ice imagery with enhanced edge detection, preserve fine details, and provide appropriate perceptual quality and channel cohesiveness.
3.2.3 Generator architecture
This study explores the effectiveness of three generator configurations, each comprising the modules identified above. The goal is to evaluate the performance of these configurations, denoted as ARISGAN-A, ARISGAN-B, and ARISGAN-C, by investigating how the arrangement of these building blocks impacts the quality of the super-resolved images. An element shared across all configurations includes an extra skip connection after the DMF layer, extending through the Pix2Pix module. Figure 7 shows the schematics for all three architectures.
Configuration ARISGAN-A: DMF-Pix2Pix-DB. In this setup, the Dense Multireceptive Field is placed at the beginning, followed by the Pix2Pix model, and finally, the Dense Block. The skip connection after DMF spans the Pix2Pix module, allowing for integrating features learned from the DMF into the subsequent DB module.
Configuration ARISGAN-B: DB-DMF-Pix2Pix. The architecture starts with the Dense Block, followed by the Dense Multireceptive Field, and finally, the Pix2Pix module. Like the previous configuration, a skip connection after the DMF ensures the propagation of relevant features into the final convolution layer post the Pix2Pix module.
Configuration ARISGAN-C: DMF-DB-Pix2Pix. The Dense Multireceptive Field starts in this setup, followed by the Dense Block and the Pix2Pix module. In this case, the skip connection spans both DB and Pix2Pix, ensuring the flow of features from DMF to the final convolution layer, allowing the model to leverage the advantages of both DMF and DB in the super-resolution process.
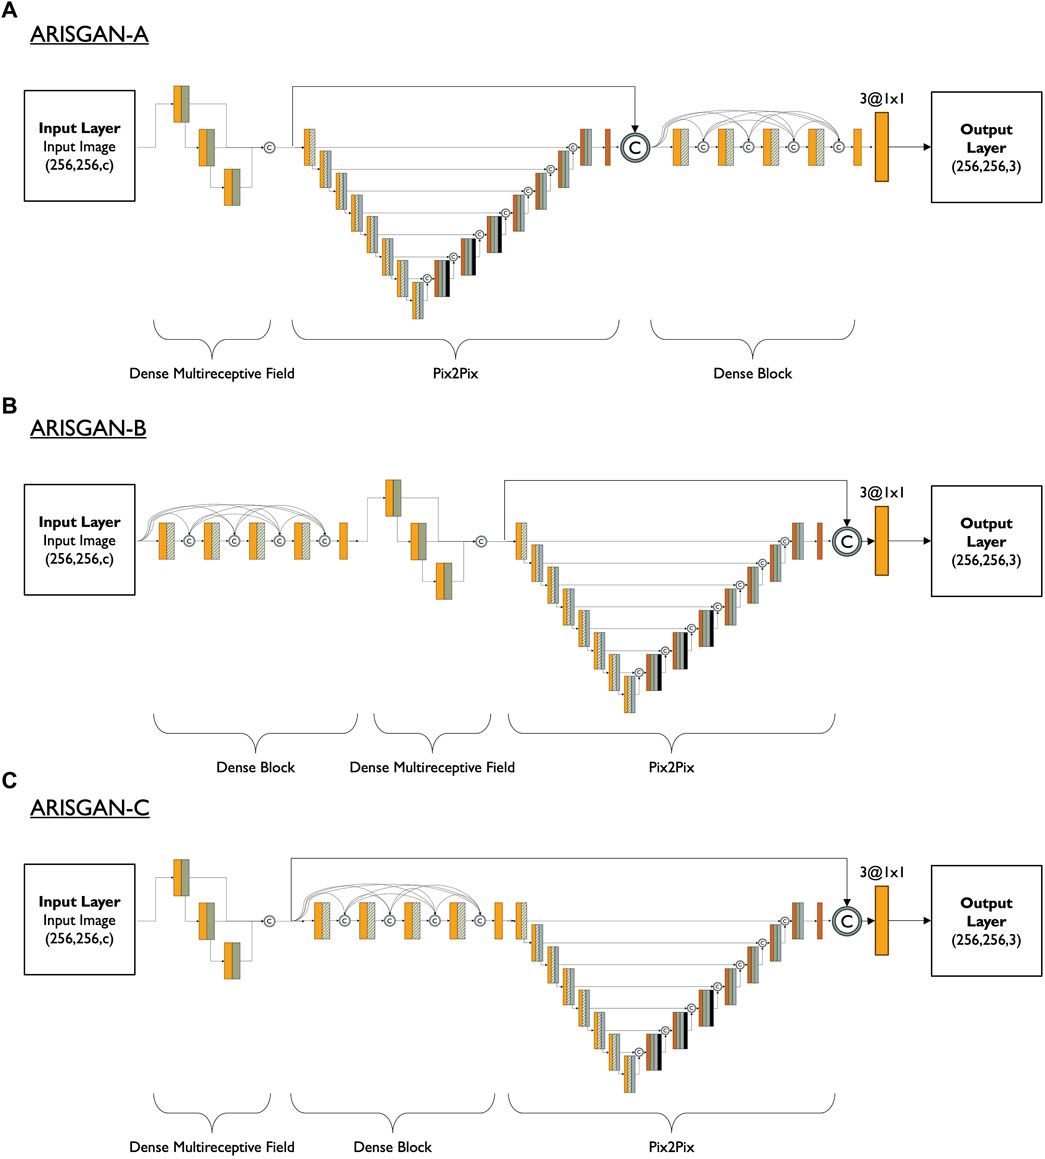
Figure 7. (A–C) Generator architectures for ARISGAN-A, -B and -C.
All three configurations utilize the same discriminator and loss functions.
The training process for all configurations employs an Adam optimizer with a learning rate 2e-4 and a beta value of 0.5 for both Generator and Discriminator. This optimization scheme ensures effective updates, contributing to the convergence and enhancement of the model’s performance during the training iterations.
3.2.4 Discriminator Architecture
The Pix2Pix discriminator has promising applications in super-resolving arctic satellite imagery. Arctic satellite imagery, especially in regions like sea ice, often requires preserving fine details to capture essential features accurately. The Pix2Pix discriminator can evaluate the local structural coherence of images, ensuring that the super-resolved images retain fine details like cracks, ridges, and surface texture on the ice.
Arctic satellite images may have poor spatial alignment, especially with multi-temporal data or images from different sensors. The Pix2Pix discriminator, by focusing on local structures, aids in aligning the generated high-resolution images with the ground truth, ensuring that features like ice edge or melt patterns are accurately represented in the super-resolved images.
The discriminator’s ability to adapt to specific domain characteristics makes it suitable for addressing the unique properties of arctic satellite imagery. It can learn to capture the distinctive features of arctic regions, such as the low contrast between ice and open water, variations in reflectance due to different surface snow and ice conditions, and the dynamic nature of sea ice, enabling the generation of super-resolved images that match the visual and structural attributes of high-quality arctic imagery.
The Pix2Pix discriminator may be prone to mode collapse or unstable training in case of unbalanced training datasets or inadequate choice of loss function, which is why this study focuses on preparing a balanced, focused dataset and selection of loss function.
Figure 8 shows the discriminator architecture schematic.
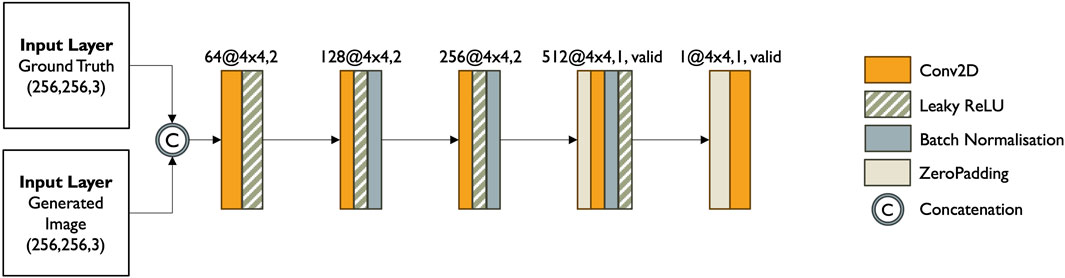
Figure 8. Discriminator architecture.
3.3 Loss functions
3.3.1 Generator loss
Loss functions guide the training process by quantifying the difference between the generated super-resolved images and the ground truth high-resolution images. This study uses a combination of L1 Loss, Wasserstein Loss, and Structural Similarity Index (SSIM) Loss to create a balanced loss function between reproducing the original ground truth image, an image with structural similarity and following the training dataset’s overall distribution.
The L1 loss, also known as Mean Absolute Error (MAE), is a straightforward and widely used loss function that computes the absolute pixel-wise difference between the generated image and the ground truth image. The mathematical formulation of L1 loss is given as follows.
The Wasserstein loss, also known as Earth Mover’s Distance (EMD), is a distance metric used in GANs to measure the discrepancy between two probability distributions. In the context of GANs, it encourages the generator to produce more realistic images following the training data distribution. The mathematical formulation of Wasserstein loss is expressed as:
where E denotes the expectation, and Discriminator(x) and Discriminator(y) represent the discriminator’s output for the generated image and ground truth image, respectively. Arjovsky, et al. (Arjovsky et al., 2017) identify increased stability and a reduction in mode collapse in Wasserstein GANs.
Structural Similarity Index (SSIM) Loss is a perceptual metric that quantifies the structural similarity between the generated and ground truth images. It considers luminance, contrast, and structure information, making it a valuable loss function for image quality assessment. The following formula gives the mathematical formulation of SSIM loss.
By combining these loss functions with respective weighting factors, the model optimization process prioritizes the preservation of fine details through the L1 loss, the realism of the generated images through the Wasserstein loss, and the structural similarity to the ground truth images using the SSIM loss. To account for the focus on generating perceptually realistic images over reconstructing the ground truth image precisely, L1 Loss is weighted at 50%, while Wasserstein and SSIM Loss are weighted at 100% each.
The resulting cumulative loss function focuses on perceptual quality, as Tao, et al. (Tao et al., 2021a) identified that SR models driven by perceptual considerations tend to generate images characterized by sharper edges and more intricate textures, resulting in visually appealing outcomes. However, given the inherently ill-posed nature of SR, the presence of sharper and richer details in the SR results introduces a higher degree of stochasticity into the solutions, also increasing the likelihood of generating artefacts and synthetic textures.
This phenomenon was also discussed in previous studies (Ledig et al.; Sajjadi et al., 2017), which showcased that Peak Signal-to-Noise ratio (PSNR)-driven solutions encourage models to seek pixel-wise averages among the array of potential solutions characterized by high-quality and sharply defined texture details. Consequently, these averaged solutions demonstrate smoother characteristics while exhibiting reduced synthetic attributes.
For the study at hand, perceptual quality is of greater importance than possible artefacts or textures. At the same time, the existence of these phenomena will be reviewed and discussed in the results section below.
3.3.2 Discriminator loss
The loss function leverages a combination of real loss, generated loss, and binary cross-entropy (BCE) loss to enable the discriminator to differentiate between real high-resolution images and the super-resolved images produced by the generator.
The real loss term assesses how effectively the discriminator classifies real high-resolution images as genuine. It calculates the difference between the discriminator’s output when presented with real images and a tensor of ones with the same shape. This loss encourages the discriminator to assign high values to real images and is essential for grounding the adversarial training process.
The generated loss term is concerned with how the discriminator responds to the super-resolved images generated by the generator. It computes the difference between the discriminator’s output for the generated images and a tensor of zeros with the same shape. This loss encourages the discriminator to classify the generated images as fake, pushing the generator to produce more realistic and authentic-looking images.
The BCE loss is a commonly used loss function in binary classification tasks. It combines the real and generated losses to form a comprehensive loss term for the discriminator. By summing the real and generated losses, the BCE loss provides an overall measure of how well the discriminator distinguishes between real and generated images.
4 Results
4.1 Model training
The training process was carefully split, focusing on two distinct subsets: land and sea images, which allowed the models to discern the unique characteristics of these environments. This partition facilitated the production of contextually relevant super-resolved imagery. Additionally, recognizing the intrinsic differences in input data, the training was conducted separately with Sentinel-3 images with 21 channels and Sentinel-2 images with only three channels as input data. This partition accounted for the variance in spectral information and resolution between the two sources, empowering the models to adapt efficiently to the specific attributes of each input type.
Each configuration was trained over a comprehensive dataset of approximately 12,500 images. These images were divided into batches of 16 images each, with batch shuffling to ensure a diverse and balanced training process. Throughout the training, all three configurations undergo 40,000 iterations. Regarding epochs, dataset and batch size must be considered. Since there are 12,500 images in total and each batch contains 16 images, one epoch encompasses 12,500/16 ≈ 781.25 batches. Thus, over 40,000 iterations, the number of epochs covered is approximately 40,000/781.25 ≈ 51.2 epochs. This comprehensive training approach, spanning approximately 50 epochs, aims to ensure that each configuration fully adapts to the data distribution, enabling the models to learn the concrete features of the arctic satellite imagery.
Figure 9 shows a comprehensive summary of the training performed, training all three architectures, differentiated by land- or sea-focused imagery, on both 12x downsampled Sentinel-2 and Sentinel-3 images, leading to a total of twelve combinations.
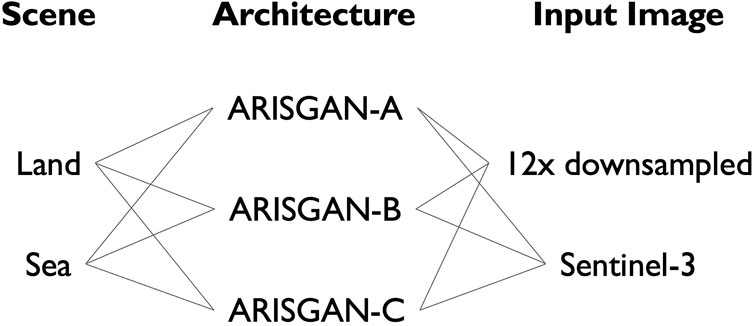
Figure 9. Architecture, Input Data, Scene combination overview.
The following sections will show and discuss the results of the previously described experiments by both qualitative and quantitative means. In this first subsection, the perceptual quality of the resulting images will be discussed by visual inspection, while the following subsections will introduce and discuss the models’ performance along quantitative metrics.
4.2 Qualitative evaluation
Figures 10, 11 show exemplary super-resolution results by the ARISGAN-A, -B, and -C models for super-resolution of both 12x downsampled Sentinel-2 images and Sentinel-3 images. Each of the figures shows the original high-resolution Sentinel-2 image as ground truth on top, followed by one row related to 12x downsampled images as input and one row related to Sentinel-3 images as input data. Each row shows the respective input image in its left column, followed by the generated images of the three models to the right.
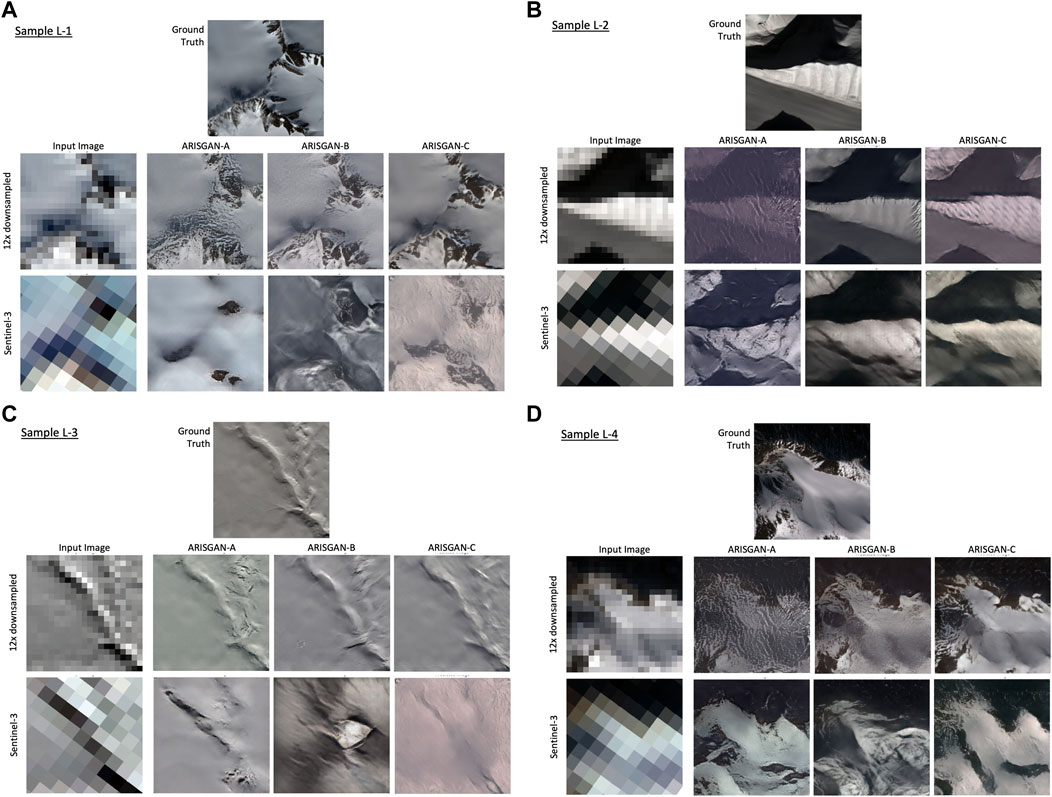
Figure 10. (A–D) Land-focused image samples L-1 through L-4.
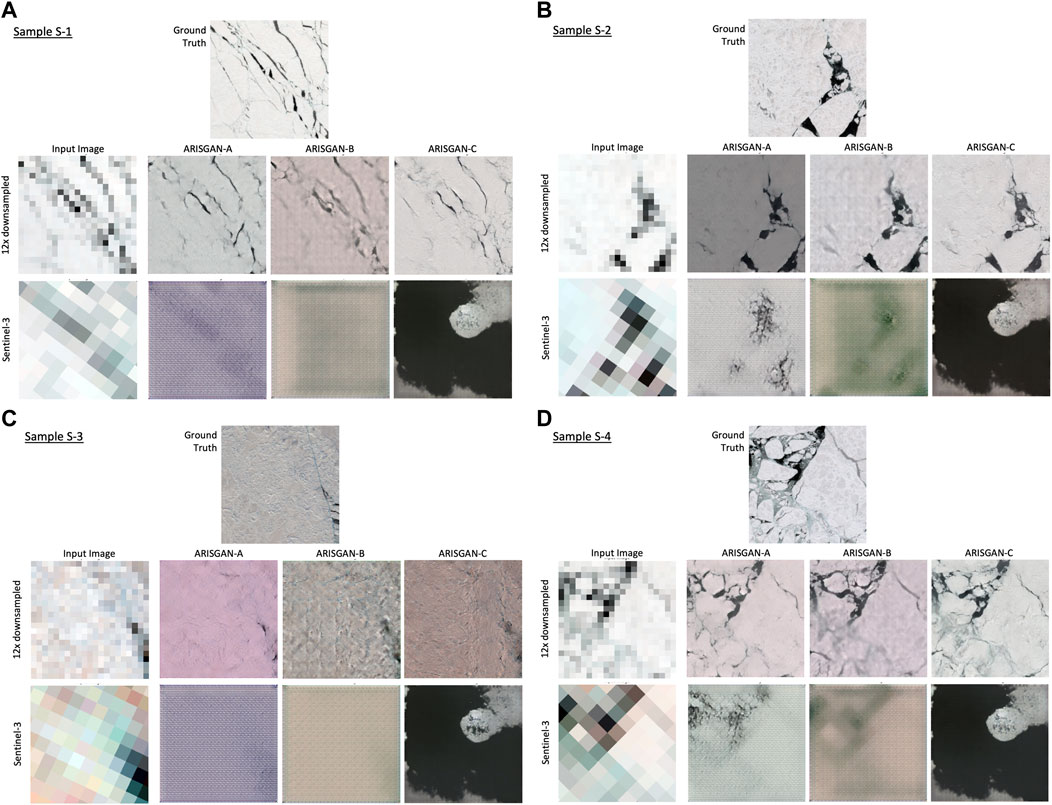
Figure 11. (A–D) Sea-focused image samples S-1 through S-4.
Eight 256 × 256px sample tiles have been randomly down selected and manually chosen to represent samples of various sceneries in the respective dataset. Four of which with a land focus (Figure 10), and four with a sea focus (Figure 11). Overall, visually, while most of the land-focused generated images appear very similar to actual Sentinel-2 images, most of the sea-focused generated images seem blurry and lack any meaningful sea ice content.
4.2.1 Land-focused imagery, 12x downsampled and Sentinel-3 input data
For land-focused imagery, all models generate qualitatively sound images in most cases but perform worse in areas lacking in significant structures. For example, mountainous areas with sharper edges and contrasts, as in samples L-1 and L-4, appear to be reconstructed in more clarity and perceptual detail, compared to flat or relatively homogenous areas in samples L-2 and L-3.
This seems especially true for Sentinel-3 super-resolution, where the models are required to reconstruct an area without large-scale features from a very coarse resolution.
ARISGAN-B tends to hallucinate in those situations across all four images and create more features and edges than there are, especially in samples L-1, L-3 and L-4. Specifically in sample L-3, it appears to create a large-scale artefact not available in the input data. As DB is assumed to produce fewer artefacts, chaining the DB before the DMF might void this effect and indeed tend to produce hallucinations.
ARISGAN-A appears to create solid, perceptually valid high-resolution images for both 12x downsampled and Sentinel-3 SR; however, in two instances, the results are overlayed by a spurious repetitive pattern. This is visible in 12x downsampled SR samples L-2 and L-4. This could indicate its attempt to reproduce the fine granularity of flat ice surface covers, though inappropriate at the given locations. Further investigation may uncover the root cause for this behavior.
ARISGAN-C appears to generalize well and create meaningful patterns in most situations, with a tendency for tinting images towards false colors, which is also the case for ARISGAN-A. In both cases, the dense block follows the multireceptive-field, which might imply that the DB being best suited to capture the relationship between the input channels if placed first in the network.
Further, ARISGAN-C appears to recreate perceptually valid, smooth surfaces, except for some spurious repetitive patterns on the side of the hill in sample L-2. On the contrary, an understated texture and depth in sample L-4. However, this may point at its general ability to generalize well across a multitude of landscapes, and more specific training on even more focused landscape patterns could further improve its performance.
4.2.2 Sea-focused imagery, 12x downsampled input data
On sea-focused imagery, all models perform similarly well on reconstructing 12x downsampled images. However, it becomes apparent that in contrast to land-focused imagery, the models struggle to reproduce the fine details of sea ice imagery, both in the cracks in the ice surface and the roughness and textures on the ice surface itself. Both details are too delicate for the downsampled input image to provide any input data that represent them, leaving it up to the models’ generalization capabilities to assess whether, and if so, which types of fine-granular details are generated.
Visibly, all models reconstruct darker pixels into fine cracks. However, these are less sharply defined than in the ground truth. The models also struggle with situation where one grey input pixel might contain multiple cracks, as is the case in the left section of image S-4; ARISGAN-A and -B appear to prefer leaving this section rather blurred with a low number of cracks only, while ARISGAN-C is able to create a scene with a higher number of different and more sharply defined features.
Related to the ice surface structure, in samples S-2 through S-4, both ARISGAN-B and -C appear to have captured correctly that a certain structure is required. ARISGAN-C produces a perceptually valid and multi-faceted surface structure, while ARISGAN-B appears to resort to repetitive patterns. This corresponds to the land-focused observation on the DMF following the DB being at risk of creating unwanted artefacts or hallucinations.
All models struggle with the relationship between the three output channels and produce mostly slightly red tinted images. As for the sea-based training set, there is almost no color other than various shades of grey in the ground truth, which leads to the situation that only one color channel being not aligned to the other two will lead to tinted results. It will be an area for further research to explore the origins and prevention of the tinting.
4.2.3 Sea-focused imagery, Sentinel-3 input data
As expected, reconstructing sea-focused high-resolution images from Sentinel-3 data delivers the least promising results. While ARISGAN-A and -B generate images preserving a visible relationship to the input image, ARISGAN-C suffers mode collapse and produces an almost identical image, regardless of input: “Mode collapse […] is a problem that occurs when the generator learns to map several different input z values to the same output point” (Goodfellow, 2017). A possible reason may be the mode-collapse prone Pix2Pix module being chained last in this model.
ARISGAN-A and -B produce the most meaningful output for samples S-2 and S-4, which are the most feature-rich images in this selection. Specifically, ARISGAN-A generates a relatively appropriate channel relationship in this scenario and relative sharpness. Both are, however not sustained in the other two samples.
Two specific differences between sea- and land-based Sentinel-3 input images might impact this behavior. First, sea-based Sentinel-3 images visually appear more distant from the ground truth compared to the land-based counterpart. For example, the pixel colors appear to not match the respective features in the ground truth images. Notably, the Sentinel-3 images consist of 21 channels, of which only three are included in the sample representations below. However, this perceptual difference may require further investigation.
Second, while land-based features are steadfast, sea ice and its cracks and fine-granular surface details are mobile. As there is a time difference of up to 60 min between the ground truth image and the respective Sentinel-3 image, the scene may not overlap sufficiently for ARISGAN to map input features to corresponding features in the ground truth. For verification, the experiment can be repeated by narrowing the time window between both images while including a higher number of Sentinel-2 granule codes into the experiment to ensure a still sufficiently high number of training image pairs.
4.3 Quantitative evaluation
In this section, a comprehensive evaluation of the performance metrics of the proposed models is presented. Table 3 lists the metrics used for evaluation, which are described in Supplementary Data Sheet S1. Tables 4–7 offer a detailed comparison of the different models with state-of-the-art models along these performance metrics. Thereby, the analysis is split between land- and sea-focused imagery, as well as super-resolving downsampled Sentinel-2 images and Sentinel-3 images.
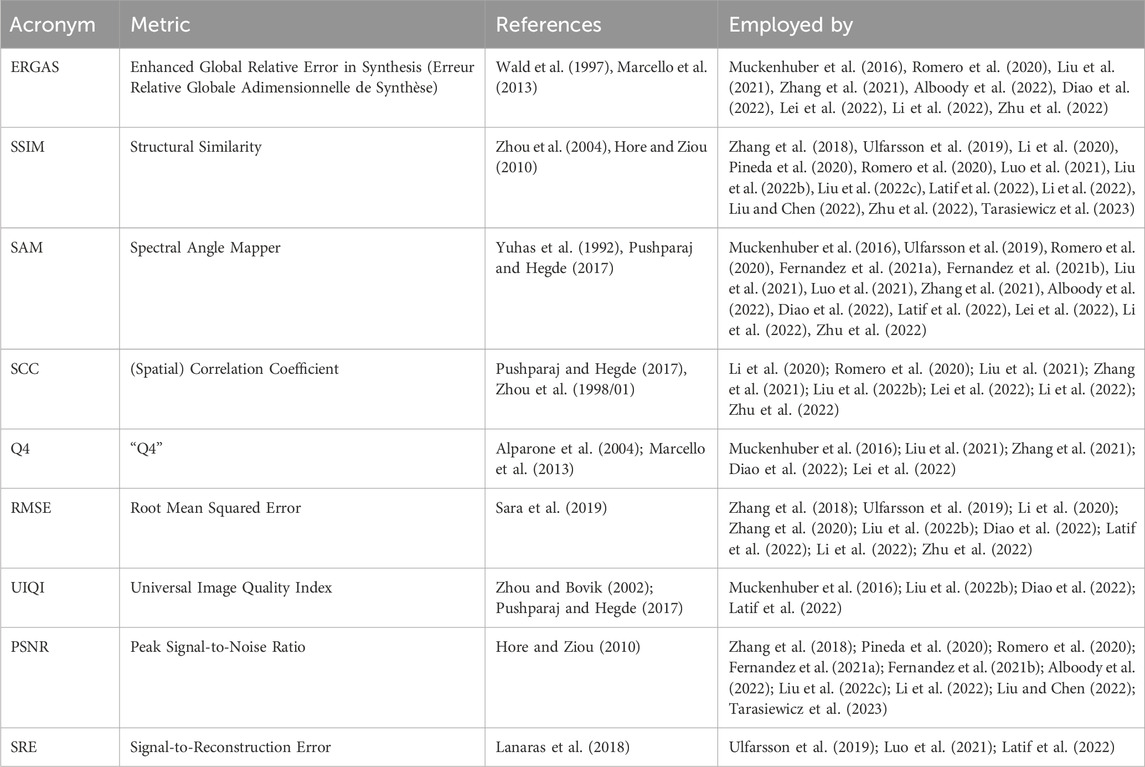
Table 3. Overview of frequently used image quality metrics.
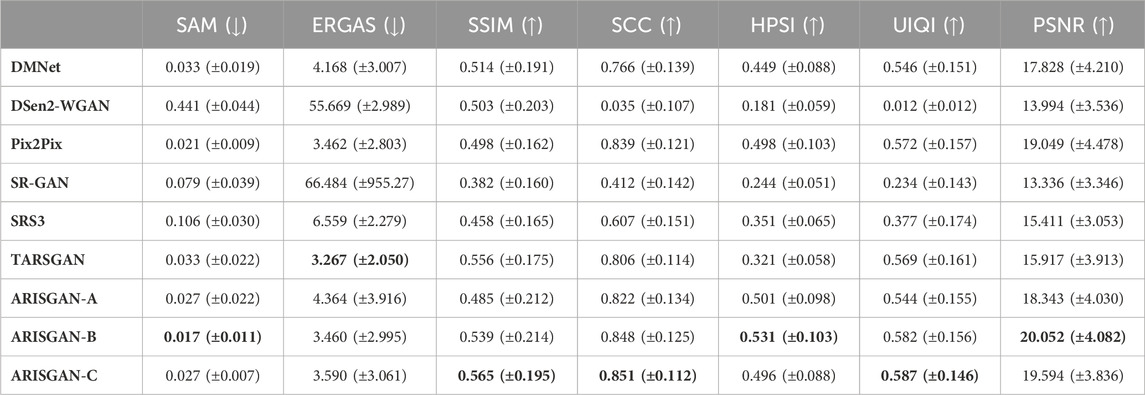
Table 4. Performance Metrics for Land/12x downsampled images.
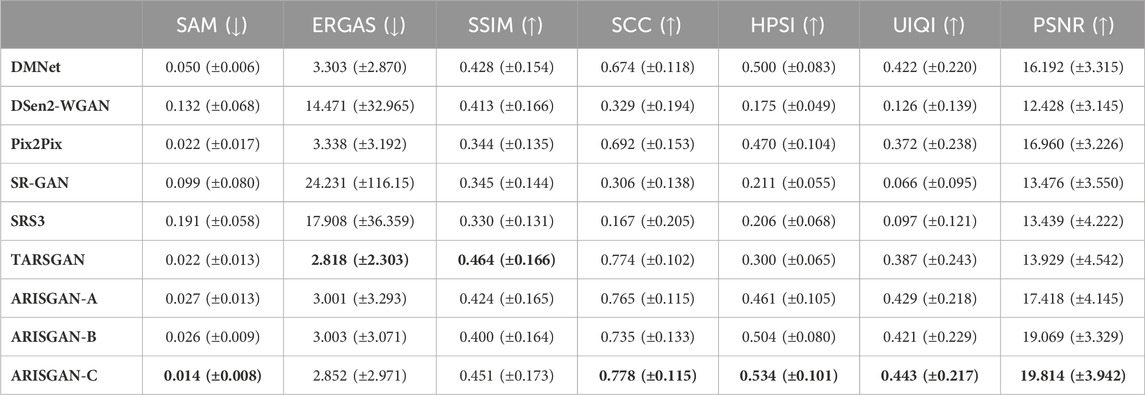
Table 5. Performance Metrics for Sea/12x downsampled images.
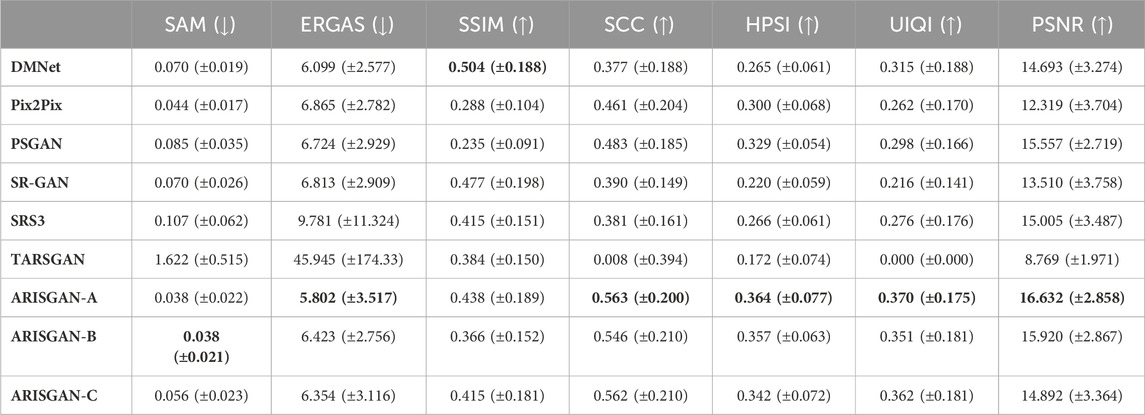
Table 6. Performance Metrics for Land/Sentinel-3 images.
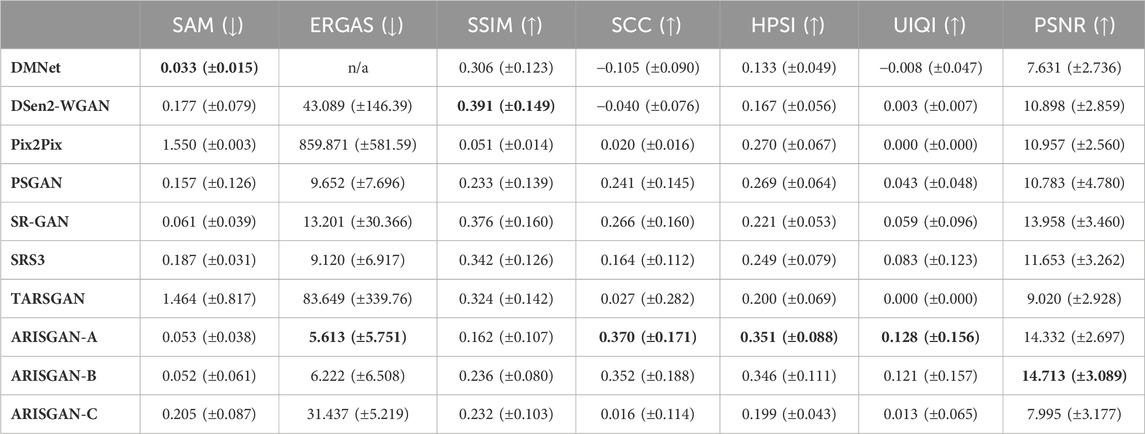
Table 7. Performance Metrics for Sea/Sentinel-3 images.
The tables list metrics as columns, and the analyzed models as rows. For better readability, the respective best value in each column has been highlighted in bold print. All metrics have been provided with mean and standard deviation.
As expected, 12x downsampled image super-resolution generally leads to significantly better performance across all metrics and models, than super-resolving Sentinel-3 imagery. Further, land-based imagery super-resolution achieves better metrics than sea-based imagery in most models and metrics.
On a more detailed level, ARISGAN-C leads to overall best performance on 12x downsampled images across most metrics, while ARISGAN-A leads to generally best results on Sentinel-3 image super-resolution. ARISGAN-B achieves promising results in both domains, exceeding the performance of state-of-the-art models across multiple metrics, however trailing behind one of the other sub-models.
Overall, the results appear to support the hypothesis that by combining the dense block, multi-receptive field and Pix2Pix architecture, current state-of-the-art model performance can be exceeded across all tasks, while certain models show strengths in specific disciplines.
On 12x downsampled super-resolution, TARSGAN achieved good results especially in ERGAS and SSIM, less so in SAM and SCC, further underlining its assumed superiority in capturing spatial and spectral similarity between the input and ground truth, respectively generated image. However, TARSGAN achieved relatively low scores for HPSI and PSNR, indicating its weakness in reconstructing perceptually similar images of high image quality.
TARSGAN achieved far lower metric values in Sentinel-3 super-resolution, as it is not constructed to capture the significant resolution disparity between Sentinel-3 and Sentinel-2 images by solely consisting of stride-1 convolutions.
Pix2Pix, while not specifically built for a super-resolution task, achieves remarkably good results for land-based 12x downsampled image reconstruction across almost all metrics. This might indicate that the land/12x downsampled reconstruction task could be understood as an image translation, rather than an actual super-resolution task. In all other tasks, including sea-based/12x downsampled reconstruction, Pix2Pix achieves far lower performance.
For the super-resolution of 12x downsampled images, ARISGAN-B and -C outperform ARISGAN-A and the state-of-the-art models across most metrics. This indicates that the Pix2Pix image translation module being sequenced after the multi-receptive field and dense block performs this image translation best, once the feature abstractions have been adequately processed by the DMF and the DB has adequately captured the channel relationships. In this case, the land- and sea-based imagery appear super-resolvable by a mere image translation through the Pix2Pix module.
Conversely, considering the promising performance of Pix2Pix on land-based images, it remains challenging for DMF and DB to pre-process sea-based images in a way ingestible for Pix2Pix to reconstruct a perceptually valid image. Further research would be needed to identify the difference in land- and sea-based imagery leading to a pre-processing requirement in one case but less in the other case.
For Sentinel-3 super resolution, ARISGAN-A achieves the best results in almost all metrics across land- and sea-based imagery. A notable exception is SSIM, for which DMNet and DSen2-WGAN, respectively, among others, achieve better performance. This is particularly surprising as all models have been trained with SSIM-loss as part of the generator loss function. Thus, this could imply that other models more strongly isolate the concrete objective at the expense of other quality metrics. However, while ERGAS is the metric most closely related to the L1 loss, ARISGAN-A in this case achieves superior performance.
As a further metric, ARISGAN-A does not outperform all models in SAM, indicating that other models are able to reconstruct the spectral similarity between individual channels better.
ARISGAN-B shows slightly lower performance. However, it still outperforms many state-of-the-art models in the Sentinel-3 SR discipline. As both ARISGAN-A and -B share the direct link between multi-receptive field and the Pix2Pix model, this implies that this setup is best, out of the tested architectures, to capture the coarse 21-channel input image in its different abstraction levels and immediately translate the result into a higher-resolution image, and performing any channel corrections either before (ARISGAN-A) or after (ARISGAN-B) this translation.
ARISGAN-A outperforms ARISGAN-B, thus indicating that a channel alignment using the dense block is advantageous if performed before translating the result into the target resolution.
The additional HPSI metric corresponds to the majority of other metrics in most cases, and its outcome is in line with the visual evaluation performed in section 4.2 above. As such, it may be a valuable addition or replacement for other metrics, while assessing human perceptual quality reliably. However, due to the low amount of comparison values in this study, further research should be conducted before applying this metric comprehensively for remote sensing SR tasks.
5 Conclusion
This study conducted a novel exploration of the application of artificial intelligence for generating high-resolution synthetic satellite imagery in the challenging context of the arctic environment. The research addressed the need for realistic and high-resolution arctic surface imagery for various applications, from satellite retrieval systems to the wellbeing and safety of Inuit populations relying on high-resolution surface observations.
The designed framework, ARISGAN, combined the advantageous properties of the dense block, multireceptive field, and Pix2Pix architecture. This innovative approach showcased promising results, outperforming state-of-the-art models across various tasks and metrics. The experiments demonstrated the advantages of leveraging a combination of techniques to enhance super-resolution, edge detection, and image reconstruction, particularly in challenging arctic environments.
The key findings from the experiments is that ARISGAN has the potential to enhance the resolution of satellite images up to a factor of 12. More experiments and analysis is needed for super-resolving Sentinel-3 imagery. Furthermore, land-based imagery super-resolution exhibited superior metrics to sea-based imagery across most models and evaluation metrics. ARISGAN outperforming existing state-of-the-art models in super-resolving 12x downsampled images highlights the approach’s effectiveness, which combines advanced image processing techniques and a well-designed architecture.
Among the sub-models, ARISGAN-C performed best on 12x downsampled images, while ARISGAN-A excelled in Sentinel-3 image super-resolution. ARISGAN-B demonstrated promising results in both domains, although it fell slightly behind the other sub-models. The evaluation underscored the strengths of the ARISGAN framework in capturing the unique characteristics of arctic imagery and improving super-resolution performance. In conclusion, our proposed ARISGAN framework has demonstrated superior performance in generating perceptually valid high-resolution arctic surface imagery. This research contributes to the advancement of Earth Observation in polar regions. The findings encourage further research and refinement of the ARISGAN framework to address the challenges the arctic environment poses, ultimately advancing the quality and availability of high-resolution satellite imagery.
6 Future work
While the findings showcase promising advancements, it is essential to acknowledge some limitations and avenues for future research. The study showed that certain aspects of input images strongly impact model performance. Foremost, high temporal synchronicity was required to reach adequate SR results, which was not given in the Sentinel-3 super-resolution of sea-focused images due to the rapid changes in images of these surfaces. Techniques should be developed to tolerate unavoidable changes like sea ice motion in super-resolution models. In ad interim, dataset compilation should ensure very high temporal synchronicity between input and target images. Tolerances are larger for steadfast surfaces.
Visually inspecting multi-spectral images like Sentinel-3 data showed that input image and ground truth are not necessarily aligning, even for a human observer, e.g., due to color mismatches. Moreover, with Sentinel-3 consisting of 21 channels, visualization always requires reducing these to RGB information. The impact of multi-channel inputs on lower-channel outputs should be investigated, along with a consideration to analyze those multi-channel input impacts on relevance for the super-resolution task. For the study at hand, as the relevance of each Sentinel-3 channel for reconstructing the ground truth was not known, all 21 channels were used as input to the ARISGAN model.
Related to pre-processing, analysis and the ability to identify cloudy or otherwise images with diminished quality should be available to avoid models being trained on such data. This study identified a tinting problem, predominantly on sea-based and thus relatively plain imagery. The root cause should be investigated, and avoidance mechanisms explored. HPSI showed promising results as a relevant metric for measuring the human-perceptual quality of super-resolved satellite imagery. Its application in this domain should be further investigated.
Finally, ARISGAN opens many exciting future applications in remote sensing and modeling. It is too early to use super-resolved images generated by ARISGAN for operational purposes such as safe travel on fast ice (Segal et al., 2020) or to help with routing (Soldal et al., 2019) as the images currently do not faithfully represent the exact reality on the ground. Nevertheless, the ARISGAN super-resolved images can be helpful to generate statistically representative surfaces at enhanced spatial and temporal resolution that can inform model parameterizations of unresolved sub-grid processes such as melt ponds (Driscoll et al., 2024a; Driscoll et al., 2024b).
While super-resolution in a sea ice context is a niche field of study, the wider field of RS is under active and dynamic research and significant advancements are being made, which may have promising applications in the sea ice context, potentially in combination with ARISGAN. These include transformer-based models like SpectralGPT (Hong et al., 2023a), multimodal model as proposed by (Hong et al., 2024), or self-supervised models like DC-Net (Hong et al., 2023b), which show promising performance above other state-of-the-art models. Further, integrating architectures as proposed with the RSMamba framework (Chen et al., 2024), namely, a global receptive field, would be an area for further research to increase computational efficiency while enabling a wholistic image representation.
More work is needed in ensuring that the statistics of the super-resolved images are consistent with the ground truth. The field of ML enabled model parameterizations and emulators is in its early days and ARISGAN can play an important role in generating realistic input satellite data for such model components in the future.
Data availability statement
The datasets presented in this study can be found in online repositories. The names of the repository/repositories and accession number(s) can be found below: https://github.com/ucabcbo/ARISGAN, https://www.cpom.ucl.ac.uk/group/ in addition to the GitHub repository.
Author contributions
CA: Conceptualization, Data curation, Formal Analysis, Investigation, Methodology, Software, Validation, Visualization, Writing–original draft, Writing–review and editing. MT: Conceptualization, Data curation, Formal Analysis, Funding acquisition, Investigation, Methodology, Project administration, Resources, Supervision, Writing–original draft, Writing–review and editing. PM: Conceptualization, Formal Analysis, Investigation, Methodology, Project administration, Software, Supervision, Validation, Visualization, Writing–original draft, Writing–review and editing. ST: Conceptualization, Formal Analysis, Investigation, Methodology, Project administration, Supervision, Validation, Visualization, Writing–original draft, Writing–review and editing.
Funding
The author(s) declare that financial support was received for the research, authorship, and/or publication of this article. MT acknowledge support from ESA (Clev2er: CRISTAL LEVel-2 procEssor prototype and R&D); MT acknowledges support from (\#ESA/AO/1-9132/17/NL/MP, \#ESA/AO/1-10061/19/I-EF, SIN'XS: Sea Ice and Iceberg and Sea-ice Thickness Products Inter-comparison Exercise) and NERC (\#NE/T000546/1 761 \& \#NE/X004643/1). ST acknowledges support from a Department of Defense Vannevar Bush Faculty Fellowship held by Prof. Andrew Stuart, and by the SciAI Center, funded by the Office of Naval Research (ONR), under Grant Number N00014-23-1-2729.
Conflict of interest
The authors declare that the research was conducted in the absence of any commercial or financial relationships that could be construed as a potential conflict of interest.
Publisher’s note
All claims expressed in this article are solely those of the authors and do not necessarily represent those of their affiliated organizations, or those of the publisher, the editors and the reviewers. Any product that may be evaluated in this article, or claim that may be made by its manufacturer, is not guaranteed or endorsed by the publisher.
Supplementary material
The Supplementary Material for this article can be found online at: https://www.frontiersin.org/articles/10.3389/frsen.2024.1417417/full#supplementary-material
References
Alboody, A., Puigt, M., Roussel, G., Vantrepotte, V., Jamet, C., and Tran, T.-K. (2022). “Deepsen3: deep multi-scale learning model for spatial-spectral fusion of sentinel-2 and sentinel-3 remote sensing images,” in 2022 12th workshop on hyperspectral imaging and signal processing: evolution in remote sensing (WHISPERS) (IEEE). doi:10.1109/whispers56178.2022.9955139
Alparone, L., Baronti, S., Garzelli, A., and Nencini, F. (2004). A global quality measurement of pan-sharpened multispectral imagery. IEEE Geoscience Remote Sens. Lett. 1 (4), 313–317. doi:10.1109/lgrs.2004.836784
Cai, J., Zeng, H., Yong, H., Cao, Z., and Zhang, L. (2019). Toward real-world single image super-resolution: a new benchmark and A new model. arXiv pre-print Serv. arxiv:1904.00523. doi:10.48550/arXiv.1904.00523
Carbon Footprint Ltd (2023). Country specific electricity factors. Available at: https://www.carbonfootprint.com/docs/2023_07_international_factors_release_10.xlsx (Accessed August 11, 2023).
Chen, K., Chen, B., Liu, C., Li, W., Zou, Z., and Shi, Z. (2024). RSMamba: remote sensing image classification with state Space model. arXiv 21, 1–5. doi:10.1109/lgrs.2024.3407111
Creswell, A., White, T., Dumoulin, V., Arulkumaran, K., Sengupta, B., and Bharath, A. A. (2018). Generative adversarial networks: an overview. IEEE Signal Process. Mag. 35 (1), 53–65. doi:10.1109/msp.2017.2765202
Dai, J., Qi, H., Xiong, Y., Li, Y., Zhang, G., Hu, H., et al. (2017). Deformable convolutional networks. arxiv:1703.06211. doi:10.48550/arXiv.1703.06211
Diao, W., Zhang, F., Sun, J., Xing, Y., Zhang, K., and Bruzzone, L. (2022). ZeRGAN: zero-reference GAN for fusion of multispectral and panchromatic images. IEEE Trans. Neural Netw. Learn. Syst. 34, 8195–8209. doi:10.1109/tnnls.2021.3137373
Dong, C., He, K., and Tang, X. (2015). Image super-resolution using deep convolutional networks. arxiv:1501.00092.
Driscoll, S., Carrassi, A., Brajard, J., Bertino, L., Bocquet, M., Olason, E., et al. (2024b). Replacing parametrisations of melt ponds on sea ice with machine learning emulators (No. EGU24-10749). Copernic. Meet. doi:10.5194/egusphere-egu24-10749
Driscoll, S., Carrassi, A., Brajard, J., Bertino, L., Bocquet, M., and Ólason, E. Ö. (2024a). Parameter sensitivity analysis of a sea ice melt pond parametrisation and its emulation using neural networks. J. Comput. Sci. 79, 102231. doi:10.1016/j.jocs.2024.102231
European Space Agency (2023a). Science toolbox exploitation platform. Available at: https://step.esa.int/main/toolboxes/snap/(Accessed August 13, 2023).
European Space Agency (2023b). Sentinel-2 tiling grid. Available at: https://sentinels.copernicus.eu/web/sentinel/missions/sentinel-2/data-products (Accessed August 12, 2023).
Fernandez, R., Fernandez-Beltran, R., Kang, J., and Pla, F. (2021a). Sentinel-3 super-resolution based on dense multireceptive channel attention. IEEE J. Sel. Top. Appl. Earth Observations Remote Sens. 14, 7359–7372. doi:10.1109/jstars.2021.3097410
Fernandez, R., Fernandez-Beltran, R., and Pla, F. (2021b). “Sentinel-3 image super-resolution using data fusion and convolutional neural networks,” in 2021 IEEE international geoscience and remote sensing symposium IGARSS (IEEE). doi:10.1109/igarss47720.2021.9554826
Gabarró, C., Hughes, N., Wilkinson, J., Bertino, L., Bracher, A., Diehl, T., et al. (2023). Improving satellite-based monitoring of the polar regions: identification of research and capacity gaps. Front. Remote Sens. 4, 952091. doi:10.3389/frsen.2023.952091
Garzelli, A. (2016). A review of image fusion algorithms based on the super-resolution paradigm. Remote Sens. 8 (10), 797. doi:10.3390/rs8100797
Goodfellow, I. (2017). NIPS 2016 tutorial: generative adversarial networks. arXiv. doi:10.48550/arXiv.1701.00160
Goodfellow, I. J., Pouget-Abadie, J., Mirza, M., Xu, B., Warde-Farley, D., Ozair, S., et al. (2014). Generative adversarial networks. doi:10.48550/arXiv.1406.2661
Gregory, W., Lawrence, I. R., and Tsamados, M. (2021). A Bayesian approach towards daily pan-Arctic sea ice freeboard estimates from combined CryoSat-2 and Sentinel-3 satellite observations. Cryosphere 15 (6), 2857–2871. doi:10.5194/tc-15-2857-2021
Hong, D., Zhang, B., Li, X., Li, Y., Li, C., Yao, J., et al. (2023a). “SpectralGPT: spectral remote sensing foundation model,” in IEEE transactions on pattern analysis and machine intelligence. doi:10.1109/TPAMI.2024.3362475
Hong, D., Li, C., Zhang, B., Yokoya, N., Benediktsson, J. A., and Chanussot, J. (2024). Multimodal artificial intelligence foundation models: unleashing the power of remote sensing big data in earth observation. Innovation Geoscience 2 (1), 100055. doi:10.59717/j.xinn-geo.2024.100055
Hong, D., Yao, J., Li, C., Meng, D., Yokoya, N., and Chanussot, J. (2023b). Decoupled-and-Coupled networks: self-supervised hyperspectral image super-resolution with subpixel fusion. IEEE Trans. Geoscience Remote Sens. 61, 1–12. Art no. 5527812. doi:10.1109/TGRS.2023.3324497
Hore, A., and Ziou, D. (2010). “Image quality metrics: PSNR vs. SSIM,” in 2010 20th international conference on pattern recognition, 2010 (IEEE). doi:10.1109/icpr.2010.579
Isola, P., Zhu, J.-Y., Zhou, T., and Efros, A. A. (2018). Image-to-Image translation with conditional adversarial networks.
Jiang, K., Wang, Z., Yi, P., Wang, G., Lu, T., and Jiang, J. (2019). Edge-enhanced GAN for remote sensing image superresolution. IEEE Trans. Geoscience Remote Sens. 57 (8), 5799–5812. doi:10.1109/tgrs.2019.2902431
Keys, R. (1981). Cubic convolution interpolation for digital image processing. IEEE Trans. Acoust. Speech, Signal Process. 29 (6), 1153–1160. doi:10.1109/tassp.1981.1163711
Lanaras, C., Bioucas-Dias, J., Galliani, S., Baltsavias, E., and Schindler, K. (2018). Super-resolution of Sentinel-2 images: learning a globally applicable deep neural network. ISPRS J. Photogrammetry Remote Sens. 146, 305–319. doi:10.1016/j.isprsjprs.2018.09.018
Latif, H., Ghuffar, S., and Ahmad, H. M. (2022). Super-resolution of sentinel-2 images using Wasserstein GAN. Remote Sens. Lett. 13 (12), 1194–1202. doi:10.1080/2150704x.2022.2136019
Ledig, C., Theis, L., Huszar, F., Caballero, J., Cunningham, A., Acosta, A., et al. (2017). Photo-realistic single image super-resolution using a generative adversarial network. arXiv pre-print server. doi:10.48550/arXiv.1609.04802
Lei, D., Chen, P., Zhang, L., and Li, W. (2022). MCANet: a multidimensional channel attention residual neural network for pansharpening. IEEE Trans. Geoscience Remote Sens. 60, 1–16. doi:10.1109/TGRS.2022.3205626
Li, Q., Wang, Q., and Li, X. (2021). Exploring the relationship between 2D/3D convolution for hyperspectral image super-resolution. IEEE Trans. Geoscience Remote Sens. 59 (10), 8693–8703. doi:10.1109/tgrs.2020.3047363
Li, W., Yang, C., Peng, Y., and Du, J. (2022). A pseudo-siamese deep convolutional neural network for spatiotemporal satellite image fusion. IEEE J. Sel. Top. Appl. Earth Observations Remote Sens. 15, 1205–1220. doi:10.1109/jstars.2022.3143464
Li, W., Zhang, X., Peng, Y., and Dong, M. (2020). DMNet: a network architecture using dilated convolution and multiscale mechanisms for spatiotemporal fusion of remote sensing images. IEEE Sensors J. 20 (20), 12190–12202. doi:10.1109/jsen.2020.3000249
Liu, P., Li, J., Wang, L., and He, G. (2022a). Remote sensing data fusion with generative adversarial networks: state-of-the-art methods and future research directions. IEEE Geoscience Remote Sens. Mag. 10 (2), 295–328. doi:10.1109/MGRS.2022.3165967
Liu, Q., Meng, X., Shao, F., and Li, S. (2022b). PSTAF-GAN: progressive spatio-temporal attention fusion method based on generative adversarial network. IEEE Trans. Geoscience Remote Sens. 60, 1–13. doi:10.1109/TGRS.2022.3161563
Liu, Q., Zhou, H., Xu, Q., Liu, X., and Wang, Y. (2021). PSGAN: a generative adversarial network for remote sensing image pan-sharpening. IEEE Trans. Geoscience Remote Sens. 59 (12), 10227–10242. doi:10.1109/TGRS.2020.3042974
Liu, T.-J., and Chen, Y.-Z. (2022). Satellite image super-resolution by 2D RRDB and edge-enhanced generative adversarial network. Appl. Sci. 12 (23), 12311. doi:10.3390/app122312311
Liu, X., Feng, T., Shen, X., and Li, R. (2022c). PMDRnet: a progressive multiscale deformable residual network for multi-image super-resolution of AMSR2 arctic Sea Ice images. IEEE Trans. Geoscience Remote Sens. 60, 1–18. doi:10.1109/tgrs.2022.3151623
Liu, X., Liu, Q., and Wang, Y. (2020). Remote sensing image fusion based on two-stream fusion network. Inf. Fusion 55, 1–15. doi:10.1016/j.inffus.2019.07.010
Liu, X., Wang, Y., and Liu, Q. (2018a). “Psgan: a generative adversarial network for remote sensing image pan-sharpening,” in 2018 25th IEEE international conference on image processing (ICIP), 2018 (IEEE). doi:10.1109/icip.2018.8451049
Liu, X., Wang, Y., and Liu, Q. (2018b). Psgan: a generative adversarial network for remote sensing image pan-sharpening. IEEE. doi:10.1109/icip.2018.8451049
Luo, X., Tong, X., and Hu, Z. (2021). Improving satellite image fusion via generative adversarial training. IEEE Trans. Geoscience Remote Sens. 59 (8), 6969–6982. doi:10.1109/tgrs.2020.3025821
Mapbox Inc (2023). Rasterio Documentation. Adv. Top. Resampling. Available at: https://rasterio.readthedocs.io/en/stable/topics/resampling.html (Accessed August 12, 2023).
Marcello, J., Medina, A., and Eugenio, F. (2013). Evaluation of spatial and spectral effectiveness of pixel-level fusion techniques. IEEE Geoscience Remote Sens. Lett. 10 (3), 432–436. doi:10.1109/lgrs.2012.2207944
Masi, G., Cozzolino, D., Verdoliva, L., and Scarpa, G. (2016). Pansharpening by convolutional neural networks. Remote Sens. 8 (7), 594. doi:10.3390/rs8070594
Muckenhuber, S., Nilsen, F., Korosov, A., and Sandven, S. (2016). Sea ice cover in Isfjorden and Hornsund, Svalbard (2000–2014) from remote sensing data. Cryosphere 10 (1), 149–158.
Perovich, D. K., Grenfell, T. C., Light, B., and Hobbs, P. V. (2002). Seasonal evolution of the albedo of multiyear Arctic sea ice. J. Geophys. Res. Oceans 107 (C10), SHE–20. doi:10.1029/2000jc000438
Pineda, F., Ayma, V., Aduviri, R., and Beltran, C. (2020). Super resolution approach using generative adversarial network models for improving satellite image resolution. Springer International Publishing, 291–298.
Pope, A., Rees, W. G., Fox, A. J., and Fleming, A. (2014). Open access data in polar and cryospheric remote sensing. Remote Sens. 6 (7), 6183–6220. doi:10.3390/rs6076183
Pushparaj, J., and Hegde, A. V. (2017). Evaluation of pan-sharpening methods for spatial and spectral quality. Appl. Geomatics 9 (1), 1–12. doi:10.1007/s12518-016-0179-2
Rabbi, J., Ray, N., Schubert, M., Chowdhury, S., and Chao, D. (2020). Small-object detection in remote sensing images with end-to-end edge-enhanced GAN and object detector network. Remote Sens. 12 (9), 1432. doi:10.3390/rs12091432
Reisenhofer, R., Bosse, S., Kutyniok, G., and Wiegand, T. (2018). A Haar wavelet-based perceptual similarity index for image quality assessment. Signal Process. Image Commun. 61, 33–43. doi:10.1016/j.image.2017.11.001
Romero, L. S., Marcello, J., and Vilaplana, V. (2020). Super-resolution of sentinel-2 imagery using generative adversarial networks. Remote Sens. 12 (15), 2424. doi:10.3390/rs12152424
Ruescas, A. B., and Peters, M. (2023). Snap – S3TBX collocation tutorial. Hamburg, Germany: Brockmann Consult GmbH. Available at: https://step.esa.int/docs/tutorials/Collocation_S3TBX_Tutorial_v1_rev6.pdf (Accessed August 5, 2023).
Sajjadi, M. S. M., Scholkopf, B., and Hirsch, M. (2017). “EnhanceNet: single image super-resolution through automated texture Synthesis,” in 2017 IEEE international conference on computer vision (ICCV) (IEEE). doi:10.1109/iccv.2017.481
Sara, U., Akter, M., and Uddin, M. S. (2019). Image quality assessment through FSIM, SSIM, MSE and PSNR—a comparative study. J. Comput. Commun. 07 (03), 8–18. doi:10.4236/jcc.2019.73002
Scarpa, G., Gargiulo, M., Mazza, A., and Gaetano, R. (2018). A CNN-based fusion method for feature extraction from Sentinel data. Remote Sens. 10 (2), 236. doi:10.3390/rs10020236
Schmidt, V., Luccioni, A., Lacoste, A., and Dandres, T. (2023). Machine learning emissions calculator. Available at: https://mlco2.github.io/impact/#compute (Accessed August 11, 2023).
Segal, R. A., Scharien, R. K., Cafarella, S., and Tedstone, A. (2020). Characterizing winter landfast sea-ice surface roughness in the Canadian Arctic Archipelago using Sentinel-1 synthetic aperture radar and the Multi-angle Imaging SpectroRadiometer. Ann. Glaciol. 61 (83), 284–298. doi:10.1017/aog.2020.48
Soldal, I. H., Dierking, W., Korosov, A., and Marino, A. (2019). Automatic detection of small icebergs in fast ice using satellite wide-swath SAR images. Remote Sens. 11 (7), 806. doi:10.3390/rs11070806
Tao, Y., Conway, S. J., Muller, J.-P., Putri, A. R. D., Thomas, N., and Cremonese, G. (2021a). Single image super-resolution restoration of TGO CaSSIS colour images: demonstration with perseverance rover landing site and Mars science targets. Remote Sens. 13 (9), 1777. doi:10.3390/rs13091777
Tao, Y., Xiong, S., Song, R., and Muller, J.-P. (2021b). Towards streamlined single-image super-resolution: demonstration with 10 m sentinel-2 colour and 10–60 m multi-spectral VNIR and SWIR bands. Remote Sens. 13 (13), 2614. doi:10.3390/rs13132614
Tarasiewicz, T., Nalepa, J., Farrugia, R. A., Valentino, G., Chen, M., Briffa, J. A., et al. (2023). Multitemporal and multispectral data fusion for super-resolution of Sentinel-2 images. ArXiv 61, 1–19. abs/2301.11154. doi:10.1109/tgrs.2023.3311622
Tsamados, M., Feltham, D., Petty, A., Schroeder, D., and Flocco, D. (2015). Processes controlling surface, bottom and lateral melt of Arctic sea ice in a state of the art sea ice model. Philosophical Trans. R. Soc. A Math. Phys. Eng. Sci. 373 (2052), 20140167. doi:10.1098/rsta.2014.0167
Ulfarsson, M. O., Palsson, F., Dalla Mura, M., and Sveinsson, J. R. (2019). Sentinel-2 sharpening using a reduced-rank method. IEEE Trans. Geoscience Remote Sens. 57 (9), 6408–6420. doi:10.1109/tgrs.2019.2906048
Wagner, P. M., Hughes, N., Bourbonnais, P., Stroeve, J., Rabenstein, L., Bhatt, U., et al. (2020). Sea-ice information and forecast needs for industry maritime stakeholders. Polar Geogr. 43 (2-3), 160–187. doi:10.1080/1088937x.2020.1766592
Wald, L., Ranchin, T., and Mangolini, M. (1997). Fusion of satellite images of different spatial resolutions: assessing the quality of resulting images. Photogrammetric Eng. remote Sens. 63 (6), 691–699.
Wang, C., Li, Z., and Shi, J. (2019). Lightweight image super-resolution with adaptive weighted learning network.
Wang, X., Yu, K., Wu, S., Gu, J., Liu, Y., Dong, C., et al. (2018). ESRGAN: enhanced super-resolution generative adversarial networks. arxiv:1809.00219. doi:10.48550/arXiv.1809.00219
Webster, M. A., Rigor, I., and Wright, N. C. (2022). Observing arctic Sea Ice. Oceanography 35 (3/4), 29–37. doi:10.5670/oceanog.2022.115
Yuan, Q., Wei, Y., Meng, X., Shen, H., and Zhang, L. (2018). A multiscale and multidepth convolutional neural network for remote sensing imagery pan-sharpening. IEEE J. Sel. Top. Appl. Earth Observations Remote Sens. 11 (3), 978–989. doi:10.1109/jstars.2018.2794888
Yuhas, R. H., Goetz, A. F. H., and Boardman, J. W. (1992). Discrimination among semi-arid landscape endmembers using the Spectral Angle Mapper (SAM) algorithm.
Zhang, J., Shamsolmoali, P., Zhang, P., Feng, D., and Yang, J. (2018). Multispectral image fusion using super-resolution conditional generative adversarial networks. J. Appl. Remote Sens. 13 (2), 1. Available:. doi:10.1117/1.JRS.13.022002
Zhang, K., Sumbul, G., and Demir, B. (2020). “An approach to super-resolution of sentinel-2 images based on generative adversarial networks,” in 2020 mediterranean and middle-east geoscience and remote sensing symposium (M2GARSS) (IEEE). doi:10.1109/m2garss47143.2020.9105165
Zhang, K., Wang, A., Zhang, F., Diao, W., Sun, J., and Bruzzone, L. (2022). Spatial and spectral extraction network with adaptive feature fusion for pansharpening. IEEE Trans. Geoscience Remote Sens. 60, 1–14. doi:10.1109/tgrs.2022.3187025
Zhang, W., Li, J., and Hua, Z. (2021). Attention-based tri-UNet for remote sensing image pan-sharpening. IEEE J. Sel. Top. Appl. Earth Observations Remote Sens. 14, 3719–3732. doi:10.1109/jstars.2021.3068274
Zhou, J., Civco, D. L., and Silander, J. A. (1998/01/01 1998). A wavelet transform method to merge Landsat TM and SPOT panchromatic data. Int. J. Remote Sens. 19 (4), 743–757. doi:10.1080/014311698215973
Zhou, W., and Bovik, A. C. (2002). A universal image quality index. IEEE Signal Process. Lett. 9 (3), 81–84. doi:10.1109/97.995823
Zhou, W., Bovik, A. C., Sheikh, H. R., and Simoncelli, E. P. (2004). Image quality assessment: from error visibility to structural similarity. IEEE Trans. Image Process. 13 (4), 600–612. doi:10.1109/TIP.2003.819861
Keywords: super-resolution, remote sensing, computer vision, synthetic satellite imagery, arctic environment, sea ice, generative adversarial networks
Citation: Au C, Tsamados M, Manescu P and Takao S (2024) ARISGAN: Extreme super-resolution of arctic surface imagery using generative adversarial networks. Front. Remote Sens. 5:1417417. doi: 10.3389/frsen.2024.1417417
Received: 14 April 2024; Accepted: 27 June 2024;
Published: 06 August 2024.
Edited by:
Linlin Xu, University of Waterloo, CanadaReviewed by:
Jing Yao, Chinese Academy of Sciences (CAS), ChinaXin Wu, Beijing University of Posts and Telecommunications (BUPT), China
Copyright © 2024 Au, Tsamados, Manescu and Takao. This is an open-access article distributed under the terms of the Creative Commons Attribution License (CC BY). The use, distribution or reproduction in other forums is permitted, provided the original author(s) and the copyright owner(s) are credited and that the original publication in this journal is cited, in accordance with accepted academic practice. No use, distribution or reproduction is permitted which does not comply with these terms.
*Correspondence: Michel Tsamados, bS50c2FtYWRvc0B1Y2wuYWMudWs=
†Present address: So Takao,Department of Computing and Mathematical Sciences, California Institute of Technology, Pasadena, CA, United States