 Bertrand Ygorra1,2*†
 Frédéric Frappart1
 Jean-Pierre Wigneron1
 Thibault Catry3
 Benjamin Pillot3
 Antoine Pfefer3Jonas Courtalon1Serge Riazanoff2
- 1INRAE, UMR 1391 ISPA, Villenave d’Ornon, France
- 2VisioTerra, Champs-sur-Marne, France
- 3ESPACE-DEV, Univ Montpellier, IRD, Univ Antilles, Univ Guyane, Univ Réunion, Montpellier, France
Tropical forests are currently under pressure from increasing threats. These threats are mostly related to human activities. Earth observations (EO) are increasingly used for monitoring forest cover, especially synthetic aperture radar (SAR), that is less affected than optical sensors by atmospheric conditions. Since the launch of the Sentinel-1 satellites, numerous methods for forest disturbance monitoring have been developed, including near real-time (NRT) operational algorithms as systems providing early warnings on deforestation. These systems include Radar for Detecting Deforestation (RADD), Global Land Analysis and Discovery (GLAD), Real Time Deforestation Detection System (DETER), and Jica-Jaxa Forest Early Warning System (JJ-FAST). These algorithms provide online disturbance maps and are applied at continental/global scales with a Minimum Mapping Unit (MMU) ranging from 0.1 ha to 6.25 ha. For local operators, these algorithms are hard to customize to meet users’ specific needs. Recently, the Cumulative sum change detection (CuSum) method has been developed for the monitoring of forest disturbances from long time series of Sentinel-1 images. Here, we present the development of a NRT version of CuSum with a MMU of 0.03 ha. The values of the different parameters of this NRT CuSum algorithm were determined to optimize the detection of changes using the F1-score. In the best configuration, 68% precision, 72% recall, 93% accuracy and 0.71 F1-score were obtained.
1 Introduction
The world’s tropical forests, which recycle between ∼2.1 and 7.0 Gt of CO2 per year (Federici et al., 2015; Harris et al., 2021) are in sharp decline. Climate change and increasing anthropogenic pressure are responsible for this decline (Creese et al., 2019; Gatti et al., 2021). Wet and dry rainforests were recently identified as a small carbon source (Fan et al., 2019; Yang et al., 2023). The rate of deforestation has not diminished despite greater public awareness about climate change and the destruction of tropical forests. The annual loss of tree cover has steadily risen since Hansen et al. (Hansen et al., 2013) began their monitoring in the year 2000. Focusing on tropical primary forests, the loss increased from 2.65 Mha in 2002 to 4.03 Mha in 2022, reaching an exceptional maximum of 6.13 Mha in 2016, according to the Global Forest Review published by the World Resources Institute (WRI) in 2023. In the Brazilian semiarid region (BSAR), a 26.96% loss was observed (60,769.39 km2) between 2000 and 2018 (Santos et al., 2020). Multiple factors, such as legal or illegal selective logging creating degradations or cuts to meet the agricultural demands of the local population, are responsible for the Amazonian forests’ depletion in carbon reserve (Lescuyer et al., 2011; Creese et al., 2019; Kleinschroth et al., 2019; Umunay et al., 2019; Qin et al., 2021).
Remote sensing has been identified as a prominent technique for monitoring changes in forest cover (Lynch et al., 2013). A few functional frameworks working in Near-Real-Time (NRT) were created to monitor deforestation in tropical regions. In the Brazilian Amazon, Near-Real-Time Deforestation Detection System (DETER) has been issuing alarms since around 2004. PRODES has also issued warnings since about 1988. (Assunção et al., 2017). These monitoring systems are still in operation and have been improved over time. They are based on the use of optical images which suffer from drawbacks caused by the cloud cover over the Brazilian Amazon regions (Weisse et al., 2019). The annual cloud cover in the Brazilian Amazon can reach up to 74% in some areas (Weisse et al., 2019; Doblas et al., 2020), which delays the detections achieved by monitoring systems using optical sensors and is thus very detrimental to NRT detections.
Synthetic Aperture Radar (SAR) has a strong potential for NRT deforestation monitoring since active sensors are less sensitive to the presence of water in the atmosphere and are almost insensitive to clouds (Joshi et al., 2015). Recently, several automated NRT forest monitoring systems were developed, such as Jica-Jaxa Forest Early Warning System (JJ-FAST, Watanabe et al., 2021; Watanabe et al., 2018; Watanabe et al., 2017) that uses L-band SAR data from Phased-Array L-band Synthetic Aperture Radar 2 (PALSAR-2, Arikawa et al., 2014) and RAdar for Detecting Deforestation (RADD alerts, Reiche et al., 2021) that uses C-band SAR images acquired by the Sentinel-1 mission (Torres et al., 2012). Sentinel-1 images are now being also used by Brazil’s National Institute for Space Research (INPE) in a new version of the Real Time Deforestation Detection System (DETER) system called DETER-R, to identify changes in forest cover (Doblas et al., 2022). The TropiSCO product also uses Sentinel-1 to recognize the shadow effect created by tree cuts in the SAR images and to detect the edges of the deforested areas (Bouvet et al., 2018; Ballère et al., 2021; Mermoz et al., 2021). However, the minimum mapping unit of NRT-monitoring systems are high compared to that of precise studies showing the importance of very small (<0.1 ha) deforestations (Asner et al., 2003; Hosonuma et al., 2012; Ryan et al., 2012; Joshi et al., 2015). Therefore, there is a need to develop a NRT monitoring system with a very small detection threshold (<0.1 ha).
A few studies have highlighted that the Cumulative Sum (CuSum (Manogaran and Lopez, 2018; Kellndorfer, 2019; Ruiz-Ramos et al., 2020; Mistry et al., 2021; Ygorra et al., 2021; Ygorra et al., 2021; Pfefer et al., 2024; Ygorra et al., 2024), applied to Sentinel-1 image timeseries is an effective tool for monitoring deforestation. This method, recently applied to deforestation, may be used in the OFVi framework as a method complementary to artificial intelligence for detection. The CuSum cross-thresholds has been developed by (Ygorra et al., 2024) and applied to long time-series. It consists in computing the CuSum with two different critical thresholds (Tc) and performing a filter on the lower Tc based on the higher Tc spatial features. This method is particularly customizable and has a very small Minimum Mapping Unit (MMU) of 0.03 ha. Currently available NRT forest monitoring systems have higher MMU and are less customizable and may not be used for specific purposes, such as the payment program for environmental services (Pfefer et al., 2024). However, the CuSum may not fit the purpose of rapid alerts of deforestation as it was not developed yet as an NRT monitoring system. The present study examines the possibility to develop an effective NRT deforestation technique based on the CuSum cross-Tc approach. In the first part, the small test-study region located in the Brazilian Amazon and the different datasets used here are presented. The second part presents the methodology including a reminder about the principle of the CuSum. A sensitivity analysis was performed to determine the optimum number of images 1) before the date, 2) after the date of change, 3) the High and 4) the Low Tc values. The results were analysed in terms of F1-score as it is less impacted by the imbalance between the classes “change” and “non-change,” compared to the accuracy, precision or recall. Unchanged forest is the dominant class in this study.
2 General problem and proposed approach
CuSum-based algorithms allow the monitoring of the main forest disturbances in tropical areas from long radar backscatter time series. The first developments of such approaches by (Kellndorfer, 2019; Ruiz-Ramos et al., 2020; Ygorra et al., 2021) were devoted to the detection of one single change in long time series (offline algorithm). To solve the specific issue of successive disturbances starting with degradation leading to a clear-cut, a recursive CuSum cross-Tc, called ReCuSum, was developed (Ygorra et al., 2024). The length of the time series was identified as an important parameter for the stability of the results: a longer time series resulted in less false positives. In its present form, ReCuSum does not allow for fine temporal resolution and rapid detection. As the demand for operational-ready forest disturbance detection algorithm increases, there is a growing need for NRT forest disturbance monitoring. Even if existing algorithms, such as RADD (Reiche et al., 2021), GLAD (Hansen et al., 2013), DETER (Doblas et al., 2022), or JJ-FAST (Watanabe et al., 2017; Watanabe et al., 2018; Watanabe et al., 2021), freely provide alerts world-wide, their outputs are not necessarily suited for all types of needs. They were mostly developed to detect small to large patches of deforestation (with a minimum mapping unit of 0.1 ha up to 6.25 ha) and are not easily customized, hence, less likely to be effectively used for specific purposes, as showed in Pfefer et al. (2024).
In this study, we developed a NRT version of CuSum cross-Tc that is able to detect changes larger than about 0.03 ha (corresponding to 3 pixels of 10 m × 10 m) to complete the existing offer of early warning deforestation methods. To evaluate our NRT CuSum approach, we decided to compare it to a more complex, offline version (ReCuSum) of CuSum. Both versions can be entirely customized by the user. By NRT, we considered the maximum confirmation delay of standard RADD warnings (up to 90 days) as the “maximum delay limit.”
3 Study area and datasets
3.1 Study area
The study area, the same as in Ygorra et al. (2024), is located in the Brazilian Amazon rainforest, in the State of Parà (Figure 1A) has an area of 97.2 km2. It is characterized by large clear-cuts combined with smaller scale forest disturbances. The area is complex with different soil covers, ranging from bare soils to agriculture and primary forests with streams underneath the canopy (Figure 1B).
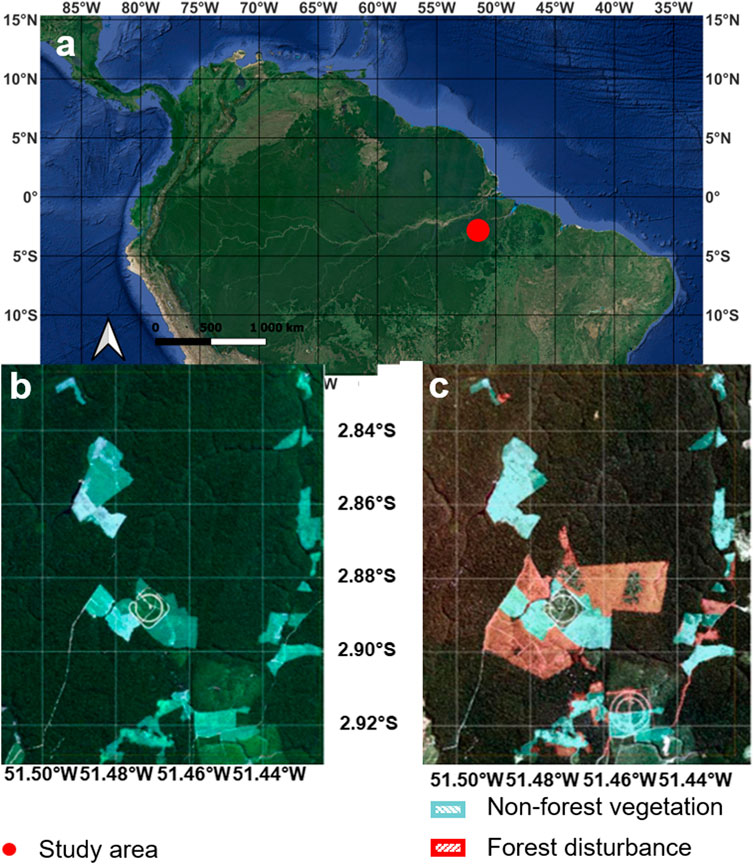
Figure 1. The study area is located in the Parà State, Brazil [(A), orange polygon]. Over the study area, forest cover changes (red hatches) were identified between 2017/08/01 (B) and 2019/07/01 (C) through visual inspection.
3.2 Data
3.2.1 Sentinel-1
Time series of Sentinel-1 C-band SAR images are used as inputs of the CuSum NRT algorithm. The Sentinel-1 mission is composed of two satellites (S1A and S1B), launched in 2014 and 2016, respectively. Since December 2021, only S1A images are available after the failure of S1B. It acquires images at C-band (f = 5.2 GHz, Torres et al., 2012). The study area, is covered by descending orbit Sentinel-1A images. CuSum NRT was applied to the Ground-Range Detected (GRD) images. They were collected at VV and VH polarisations in the Interferometric Wide-Swath (IW) mode. The generated pixels have a 5 m by 20 m resolution. The images are available from the European Space Agency (ESA) at https://scihub.copernicus.eu. They were downloaded using VtWeb (https://visioterra.org/VtWeb/). Pre-processing of the downloaded images included orbit correction, terrain correction, thermal noise reduction, speckle removal, and removal of images tainted by raincells (Ygorra et al., 2021). The output pixels have a spatial resolution of 9.55 m.
In the study area, 82 images were used between 2016/09/29 and 2019/07/01. There were two time periods assigned to these images.
- Between 2016/09/29 and 2017/08/01, 26 images were used to generate a non-forest mask using CuSum cross-Tc.
- Between 2017/08/01 and 2019/07/01, a total 56 images were used to produce a forest disturbance map in a near-real-time way.
3.2.2 Data used for validation
3.2.2.1 Sentinel-2
The two satellites composing the Sentinel-2 constellation were launched in April 2015 and March 2016, respectively. The MultiSpectral Instrument (MSI) sensor, with a 20.6-degree field of view and 13 operational wavelengths (from 2,190 nm to 443 nm, Drusch et al., 2012), was part of their payload. In this study, visual inspection was conducted on the red, green and blue level-2 top of canopy (TOC) reflectance at 10-m pixel resolution on an image, acquired on 2017/07/28. This image was selected because it was free of clouds in a dense cloud cover area, and was taken at the end of a month. This image was made available by ESA at https://scihub.copernicus.eu and downloaded as Web Map Tile Service (WMTS) using VtWeb (https://visioterra.org/VtWeb/).
3.2.2.2 PlanetScope monthly mosaic
Monthly mosaics of PlanetScope images were accessed using the NICFI program (https://www.planet.com/nicfi/). The images were created by the level 3B products from PlanetScope Ortho-Scene that were obtained from the multi-spectral images acquired by the CubeSat constellation. They are composed of orthorectified, scaled, 4-band Surface Reflectance (SR) image with a 4.77 m pixel resolution (Red: 605–695 nm, Green: 515–595 nm, Blue: 450–515 nm, Near-InfraRed: 740–900 nm). One PlanetScope monthly mosaic was accessed on the research region, in June of 2019 as it was free of clouds.
4 Methods
4.1 CuSum cross-Tc, ReCuSum and CuSum NRT: a common base for different applications
4.1.1 Cumulative Sum algorithm
The Cumulative Sum algorithm or CuSum is a change point detection method used to analyse time series. It is based on the sum of the difference between the time series and its mean:
where:
with γ0ij the backscatter value pixel of the pixel j belonging to the image i and
The CuSum considers the time when the sum of the residues reaches its maximum to be the result of a change in the time series (Figure 2A). However, to increase the confidence in the validity of the detected change, a bootstrap analysis is performed in a similar way to the establishment of a null model. The bootstrap analysis consists in two steps: 1) randomizing the time series, resulting in the removal of the potential effect of the temporal dimension and 2) comparing the residuals amplitude obtained with the original time series residual amplitude. This step is achieved n times, with n greater than 500. Figure 2B shows the amplitude of the residuals of the original time series compared to two different bootstrap iterations. This step calculates the Confidence Level (CL):
where Y is the number of bootstrap iterations in which the amplitude of the original time series is higher than that of the randomized time series. The Critical Threshold (Tc) is a variable set by the user. It is the sensitivity input parameter, i.e., the CL value over which a change is considered “valid” by the user. Tc can be considered as a robustness index: a higher Tc has a reduced sensitivity to changes and randomness, whereas a lower Tc will be less robust and more potent with a higher sensitivity to changes of any kind.
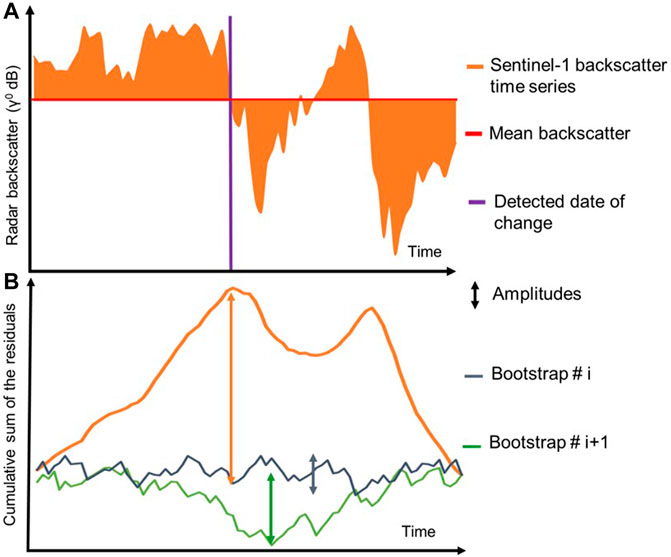
Figure 2. Principle of the CuSum (A) Sentinel-1 radar backscatter time series (orange line) is analysed: the mean (red line) is determined, and the residual is the orange area between the orange and the red lines. A change is detected at a certain time (purple line), (B) Cumulative sum of the residuals at the time of the change (orange) and at the bootstraps i (blue) and i+1 (green) iteration. In this figure, bootstrap #i and #i+1 result in an increase of Y, hence of CL.
4.1.2 CuSum cross-Tc method
CuSum cross-Tc method has been developed by Ygorra et al. (2021). It consists in computing CuSum on a long time series (more than 25 images) for two different degrees of sensitivity (critical threshold, or Tc), one being of high sensitivity (detects many disturbances with many false positives) and the other of a lower sensitivity (detects less disturbances with more false negatives). Then, the map is vectorized to obtain polygons of change detected at each Tc (one with a high value, the other with a lower value). By combining the results of each Tc, it is possible to obtain an output with fewer false negatives and false positives than their single Tc counterparts. The spatial recombination consists in removing all Low Tc polygons not containing a high Tc polygon.
This method allows to detect cover changes that occur in a vegetated area, forest or non-forest. Therefore, it is important to remove all non-forest vegetation by either applying CuSum cross-Tc on a past period continuous with the monitoring period as described in Ygorra et al. (2024) or to remove these areas using other forest/non-forest masks. This step is called rm_past.
4.1.3 ReCuSum
In this study, deforestation was also estimated in the study area and the considered time period using the ReCuSum method (Ygorra et al., 2024). It consists in applying CuSum cross-Tc iteratively, transforming CuSum’s “single breakpoint” functionality to “multiple breakpoints”. ReCuSum consists first in applying CuSum cross-Tc on the backscatter time series to find a valid date of change (breakpoint). Then, the time series is divided into two separate segments at this breakpoint and CuSum cross-Tc is applied independently on each of the segments. If valid breakpoints are found, the segments are once again divided and CuSum cross-Tc is applied again on both new segments (Figure 3). This method allows to detect multiple dates of change (breakpoints) in the time series. A threshold based on the number of changes (Tnbc) can be set to exclude pixels showing a high number of changes, as new changes in forest cover result in a low number of changes detected, in contrast with non-vegetation pixels in which ReCuSum detects multiple changes. The High and Low Tc selected for the comparison are the same as in Ygorra et al. (2024), respectively 100% and 75%.
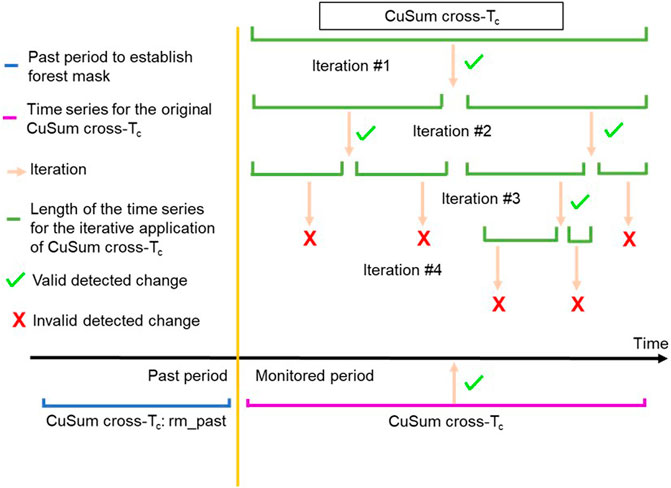
Figure 3. ReCuSum workflow with the removal of past disturbances (rm_past). Green ticks correspond to valid changes, red crosses show changes detected in the time series considered invalid by the bootstrap, blue line show the past period time series used to establish the forest mask based on CuSum cross-Tc and the green lines correspond to the time series on which CuSum cross-Tc is iteratively applied (ReCuSum).
4.1.4 CuSum NRT
4.1.4.1 CuSum NRT workflow
CuSum NRT is based on CuSum cross-Tc presented in Section 3.1. There is one major difference: it is applied on shorter time series of Sentinel-1 SAR images than conventional CuSum cross-Tc. In this study, the goal is to use the shortest possible number of images after a change in any pixel (minimal delay inherent to the methodology applied to SAR data) to produce the alert (based on a validated change) as close as possible of the date of the change while keeping a good trade-off between the capability to detect changes, false alarms and the delay of detection/computing cost. CuSum NRT input parameters also differ from ReCuSum and CuSum cross-Tc. The post-processing cascade is similar to the CuSum cross-Tc cascade with two additional input parameters: the number of images considered before (to better estimate the mean forest radar backscatter value in the historical period) and after the monitored image (to estimate the delay of detection inherent to the method/to the change in radar backscatter). The values from the Low Tc and High Tc parameters included in the spatial recombination (cross-Tc) were also examined. In order to compare with ReCuSum on long monitoring periods, CuSum NRT was applied in an iterative manner as a sliding window, considering each image after the initial time series as a “new image” to be applied on (Figure 4).
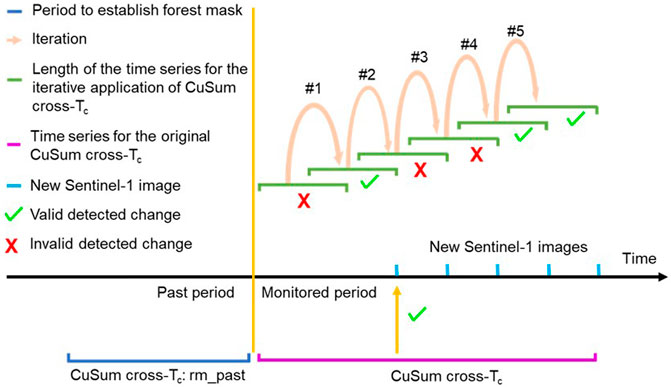
Figure 4. Workflow of CuSum NRT. Blue line corresponds to the period used to establish the forest/non-forest mask based on CuSum cross-Tc. Green lines correspond to the shorter and iterative time series of the monitored period to apply CuSum cross-Tc on. The purple line corresponds to the original timestamp of CuSum cross-Tc.
The later mentioned “delay” will refer to the “delay of detection inherent to the methodology applied to SAR data,” and not an “operational delay” from the date of released image (Ye et al., 2024).
4.1.4.2 CuSum NRT sensitivity analysis
To determine the best cross-Tc thresholds and the optimal number of images to consider before and after the change detection date, a sensitivity analysis was performed. We analysed the space of parameters by exploring all combinations of the parameters within their range of values, to extract information on the sensitivity of CuSum NRT to the following input parameters.
- Value of the critical threshold selected to compute the Low Tc map.
- Value of the critical threshold selected to compute the High Tc map.
- Number of images to be considered before a change to detect it (time series stability).
- Number of images to be considered after a change to detect it (delay).
Maps of changes were then analysed for all possible parameter configurations (Table 1) using the reference map. The best parameter configurations were determined based on the F1-score. This statistical parameter derived from the confusion matrix was chosen as it is less impacted by the imbalance in the population of change and non-change pixels.
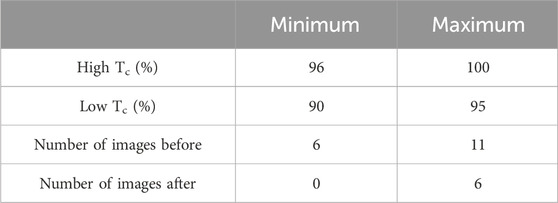
Table 1. Parameters range tested for CuSum NRT.
4.1.5 CuSum cross-Tc, ReCuSum and CuSum NRT: Input parameters and post-processing
Table 2 presents the different input parameters of the three different versions of the CuSum. All the CuSum results presented in this study are based on the cross-Tc recombination. They have the same Minimum Mapping Unit, High Tc and Low Tc input parameters as sensitivity parameters necessary to compute this spatial recombination. Tnbc is the only post-processing step not available for CuSum NRT as it is part only of ReCuSum. CuSum NRT has two exclusive sensitivity parameters called “Number of images before” and “Number of images after.”
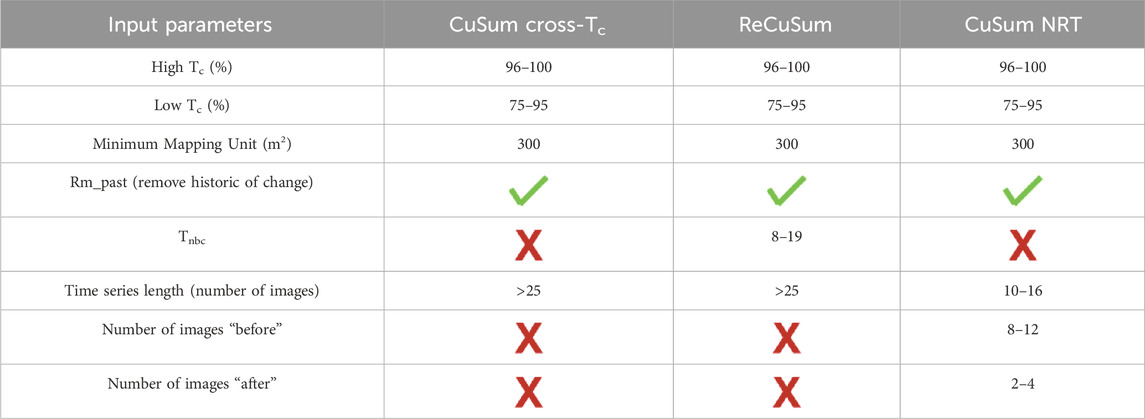
Table 2. Table of the input parameters according to the CuSum version: cross-Tc, ReCuSum or NRT.
4.2 Validation method
4.2.1 Reference map composition
The study site previously used to develop ReCuSum where a validation dataset was available (see Ygorra et al., 2024) was selected. The calibration and validation procedures were completed during two independent time periods. Due to the large cloud cover over the study area, only one Sentinel-2 image and one PlanetScope mosaic were found to be cloud-free to perform the visual interpretation of changes in forest cover. The evaluation of CuSum NRT was carried out between 2017/08/01 and 2019/07/01. The analysis was done based on RGB colour composition, using visual inspection by two independent operators. The intersection of the two operators’ map was selected as the reference map. Around 10.2 km2 (+/− 0.5 km2 according to the comparison between the two independent operators) forested areas showed a cover change throughout the time period, according to this map (Ygorra et al., 2024).
4.2.2 Validation statistics
The reference map for the study site forest cover change was used to compare CuSum NRT and ReCuSum. False Positive (FP), False Negative (FN), True Positive (TP), and True Negative (TN) confusion matrix statistics were produced and analysed.
The kappa coefficient, recall, precision, accuracy, and F1-score were derived from the confusion matrices between the reference dataset and the outputs of the different run of CuSum NRT. The Non-Forest Vegetation class is larger than the Forest Change class. Due to this imbalance, it was necessary to interpret these variables altogether and not separately (Olofsson et al., 2014).
4.3 Comparison between CuSum NRT and ReCuSum
CuSum NRT was iteratively applied over a period to establish a forest disturbance assessment. Over the course of this entire period, a comparable forest disturbance assessment was also made using ReCuSum. In order to generate the aforementioned statistics, the two maps of changes that were produced were compared to the reference map. The spatial distribution of TP, FP and FN was analysed according to this reference map.
5 Results
5.1 Determination of the optimal parameters for CuSum NRT
The sensitivity analysis was performed in two steps. First, the combinations of Low and High Tc were analysed in terms of F1-score. Then, only the sets of parameters (Low Tc, High Tc, Number of images Before, Number of images After) producing a F1-score >0.6 were arbitrarily kept in the analysis to increase the visibility of the result and figure. The optimal number of images before and after a detection in were then analysed in terms of F1-score, independently from the High and Low Tc values.
5.1.1 Low Tc and high Tc combination analysis
The results of CuSum NRT underwent sequential analysis. First, the F1-scores were analysed according to the spatial recombination (cross-Tc) High and Low Tc values (Figure 5). The results obtained at both VV and VH polarisations are systematically lower compared to the detections common to both VV and VH (VV ∩ VH) results. A higher (by 1%) Low Tc value resulted in a 0.05 increase in F1-score for both polarisations. Similarly, a higher (by 1%) High Tc value resulted in a 0.05 decrease in the F1-score.
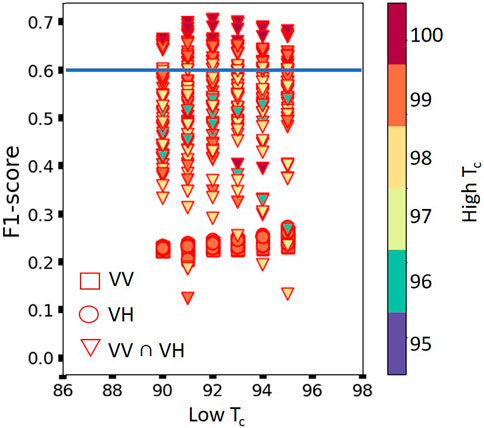
Figure 5. F1-score value obtained as a function of the polarisation, Low Tc and High Tc values ranging within the boundaries presented in Table 1. Only the sets of parameters resulting in F1-scores higher than 0.6 (blue line) are kept for Figure 6.
The higher F1-score value of 0.71 was obtained for the VV ∩ VH configuration. An increased Low Tc value does not systematically result in an increased F1-score. For instance, choosing a Low Tc value higher than 92% results in a lower F1-score value (0.69 for Low Tc = 93%, 0.68 for 94% and 0.67 for 95%). The highest F1-score of each Low Tc value is obtained using a High Tc value of 100%. A higher Tc value does not necessarily induce a higher F1-score value. To perform the analysis of the optimal number of images before/after the changes, for deforestation monitoring purposes, only values with an F1-score greater than 0.60 were retained.
5.1.2 Analysis of the number of dates before/after the targeted S1 image
The aforementioned results were further examined to evaluate the impact of the number of images before and after the date of change in the time series (Figure 6). The number of images used before the monitoring date to build the time series were analysed from 8 to 11 images. The maximum F1-score value (0.71) was obtained for 11 images before.

Figure 6. F1-score value obtained as a function of the number of images considered before a change and after a change ranging within the boundaries presented in Table 1. Only the sets of parameters resulting in a F1-score >0.6 are shown.
The number of images needed “after” the change detection date was also examined.
The best parameters found for the CuSum NRT based on the F1-score over the study area were High Tc = 100%, Low Tc = 92%, number of images considered in the time series before the monitored date = 11 and number of images considered in the time series after the monitored date = 3.
5.2 CuSum inter-comparison: NRT - ReCuSum
CuSum NRT and ReCuSum change detection results were compared in terms of accuracy, recall and precision. Whilst it is true that most disturbances (568 ha) were detected by both algorithms (Figure 7), many differences are located at the western borders of big clusters of forest disturbance. CuSum NRT was able to detect many changes in these locations when ReCuSum missed it. CuSum NRT globally detects more true changes (737 ha) than ReCuSum (701 ha). In addition to the clusters of forest disturbance, newly built roads were well detected using both versions of CuSum. They can be seen on the southwest of the study area.
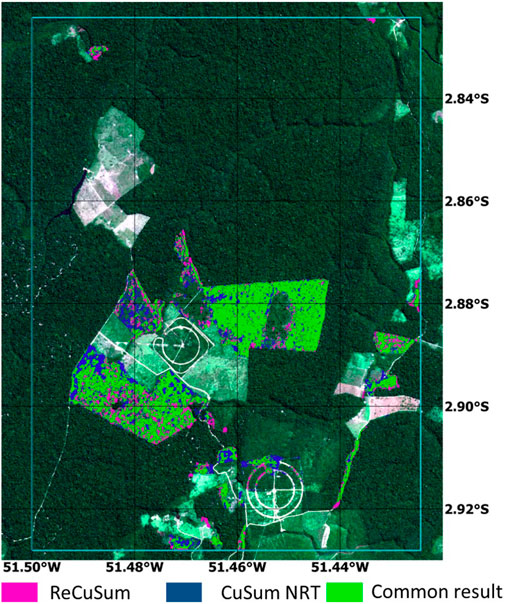
Figure 7. Map of the distribution of true positives (TP) from ReCuSum and CuSum NRT. Green is the TP detected by both. Blue is detected only by CuSum NRT and purple is detected only by ReCuSum.
Figure 8 shows the spatial distribution of the false negatives (FN) for the different versions of the CuSum used. The FN obtained using CuSum NRT reached 284 ha, in which 47.2% are common misdetections with ReCuSum. These FN common to both ReCuSum and CuSum NRT were mostly located within deforested areas. At the borders of smaller clusters of disturbances, both algorithms seemed to miss the changes. CuSum NRT has less false negatives (284 ha) than ReCuSum (320 ha), but does not detect changes obtained using ReCuSum at the eastern borders of the disturbances.
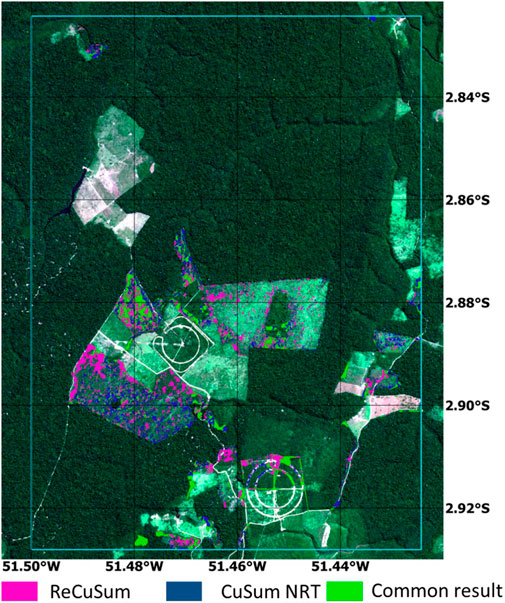
Figure 8. Map of the distribution of false negatives from ReCuSum and CuSum NRT. Green is the FN detected by both, blue is detected only by CuSum NRT and purple is detected only by ReCuSum.
The main difference between CuSum NRT and ReCuSum lies in the false positive (FP) rate (Figure 9). CuSum NRT totals 335 ha of FP compared to 156 ha for ReCuSum, with only 69 ha of common FP values. Most FP seen only with CuSum NRT are found at the borders of disturbed areas. Some clusters of disturbance were detected at the end of the past period, thus not removed because of the delay in detection, leading to higher false positive rates.
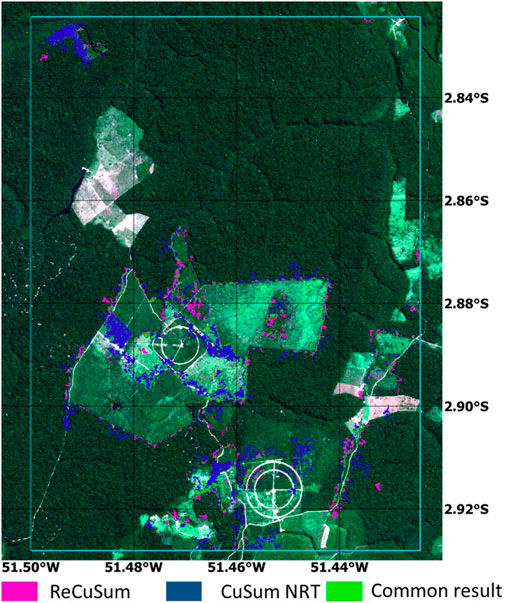
Figure 9. Map of the distribution of false positives from ReCuSum and CuSum NRT. Green is the FP detected by both, blue is detected only by CuSum NRT and purple is detected only by ReCuSum.
Precision, Recall, Accuracy, F1-score and Kappa coefficient values were obtained by comparing both CuSum NRT and ReCuSum to the reference disturbance map (Table 3). Very similar values of accuracy, F1-score and Kappa coefficient were obtained for CuSum NRT and ReCuSum. These statistics were slightly lower for CuSum NRT than those of ReCuSum. On the contrary, recall value is slightly higher for CuSum NRT than for ReCuSum. The highest difference concerns the precision that is of 68% for CuSum NRT and 81% for ReCuSum.
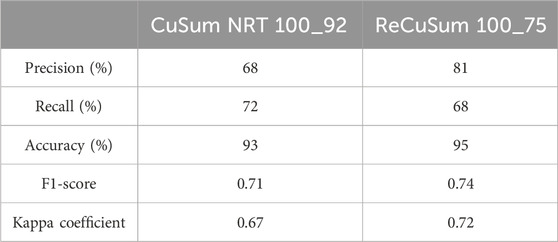
Table 3. Precision, Recall, Accuracy, F1-score and kappa coefficient values obtained by comparing CuSum NRT and ReCuSum to the reference map.
6 Discussion
CuSum cross-Tc NRT (CuSum NRT) was developed and calibrated in this study. The results of the VV, VH polarisations and their intersection VV ∩ VH were analysed and compared. The best F1-score results for CuSum cross-Tc and ReCuSum were obtained using the VV ∩ VH map (Ygorra et al., 2021; Ygorra et al., 2022; Ygorra et al., 2024). The Tc thresholds (Low and High Tc) used in those offline versions were chosen empirically without a detailed study of the parameters. Here, an evaluation of the optimal Tc thresholds were determined for the cross-Tc in NRT version. We found the results obtained in our previous studies on CuSum and ReCuSum to also be valid for CuSum NRT: a higher High Tc value results in an increase in the F1-score. Low Tc analysis is more difficult since lower Tc values result in larger polygons of change and more connections between polygons but a lower total number of polygons (compared to higher Tc values). A lower value decreases the number of False Negatives but raises the proportion of False Positives and True Positives. A higher Low Tc value reduces the polygons area and can lead to split a large polygon into two smaller ones, thus increasing the number of polygons. Therefore, the FN value is higher but the FP and TP values are lower. Starting at Tc = 92%, the number of TP decreases less than the number of FP (proportionally). This criterion was calibrated here over a small study area in the Brazilian Amazon and should not be considered as optimal in all tropical forests, even though it might work to some extent. Changes in forest types, land use or type of degradation are likely to impact the choice of the optimal value of Low Tc for spatial recombination to 90%–94%.
We previously stated that having more than 3 images considered after the monitoring date resulted in a lower F1-score. This result contrasts with previous CuSum cross-Tc and ReCuSum studies in which a longer time series (2 years vs. 1 year) yielded to more accurate results. Several causes could account for the difference between CuSum NRT and ReCuSum/CuSum cross-Tc counterparts. First, the number of images before a change should be evaluated as there seems to be a trade-off between the number of images before and after a change to successfully monitor it. This behaviour has also been observed in other versions of CuSum with difficulty to detect changes around the beginning and end of the time series. Second, regrowth phenomena may have an impact on the time series stability, which is shorter in NRT than in offline versions. This behaviour would result in more false positives and a lower F1-scorevalue. More images obtained a longer time after the monitored change date would result in more regrowth and a worse F1-score.
Finally, CuSum NRT was compared to ReCuSum. The results revealed a slight difference in F1-score between the two versions. CuSum NRT can monitor changes as well as ReCuSum. Transient changes may not be correctly identified by ReCuSum, as opposed to the use of a smaller number of images in the CuSum NRT. Due to the regrowth of the canopy, ReCuSum may overlook minor roads. The reverse situation may also occur, as progressive forest cover change and SAR backscatter alteration can be visible using offline versions but not using the NRT version. The change could be too slow considering the number of images used in the CuSum NRT, and the bootstrap analysis would reject it as a false alarm.
CuSum NRT was compared to ReCuSum as a continuation of the development of alternative CuSum-based versions, easily available NRT methods with user-available customization. With these features, CuSum may be applied in the different tropical forest basins of Africa, South-America and Asia with very high resolution (10 m pixel, 300 m2 (0.03 ha) minimum mapping unit). This approach could be employed to characterize small-scale deforestation and degradation occurring in Equatorial Africa in the framework of the One Forest Vision Initiative (OFVi - https://www.oneforestvision.org/) whose main objective since March 2023 is to build and strengthen scientific cooperation and capacities to protect forest and wetlands in Equatorial Africa in which remote sensing has a major role. However, further testing should be conducted in forests with strong seasonality, as seasonality was not corrected in our approach, as seasonality is generally weak in the Sentinel-1 data over tropical wet forests as already shown, for instance, in Ygorra et al. (2024). A comparison between CuSum NRT and other NRT algorithms such as JJ-FAST and RADD, GLAD and DETER-R warnings would require a larger validation area to be more robust, objective and fair as many different types of disturbances could be detected.
7 Conclusion
The development of CuSum cross-Tc Near-real-time (CuSum NRT) and the determination of the optimal parameters value through a sensitivity analysis were performed. CuSum cross-Tc was created to detect forest cover changes based on the changes in backscatter in time series Sentinel-1 SAR images, even during extended periods of cloud cover in tropical forests, which is the fundamental limitation of optical systems. CuSum NRT was created for the same purpose with a finer temporal resolution with minimum delay of detection. The detection performance of CuSum NRT was then compared to that of ReCuSum. The optimal F1-score value (0.71) was obtained when 11 images are used before the change occurs, 3 images after (36 days delay over our study area using Sentinel-1 images), a Low Tc value of 92% and a High Tc value of 100%. This set of parameters may not be optimal for all deforestation types and other tropical forest areas. It may be customized for other types of deforestation (logging roads, small-scale agriculture, … ) and other continents. This F1-score is 0.03 lower than that of ReCuSum, which can be considered negligible compared to the shorter delay of CuSum NRT. The sensitivity analysis which was performed exploring all combinations within the range of the set of parameters, revealed that CuSum NRT was sensitive to both Low and High Tc parameters. The optimal delay was 36 days (three Sentinel-1 images), with more images considered following a change resulting in a decrease in the F1-score. The number of images taken prior to a change in the time series should be related to the number of images taken after the change. Too few images would result in an unstable time series that is more prone to false positives, whereas too many images would impede the detection of tiny changes while approaching the duration of the offline time series, limiting the scientific and operational interest in the method. Implementing a Bayesian updating system after the first detection with an increasing probability of being a real change would be a substantial upgrade to CuSum NRT.
Data availability statement
The datasets presented in this study can be found in online repositories. The names of the repository/repositories and accession number(s) can be found below: https://forgemia.inra.fr/bertrand.ygorra/cusum-deforestation_monitoring https://github.com/Pfefer/cusum https://visioterra.org/VtWeb/.
Author contributions
BY: Conceptualization, Formal Analysis, Investigation, Methodology, Software, Supervision, Validation, Visualization, Writing–original draft, Writing–review and editing. FF: Conceptualization, Funding acquisition, Methodology, Project administration, Resources, Supervision, Validation, Writing–original draft, Writing–review and editing. J-PW: Project administration, Resources, Supervision, Validation, Writing–original draft, Writing–review and editing. TC: Formal Analysis, Investigation, Software, Validation, Visualization, Writing–original draft, Writing–review and editing. BP: Conceptualization, Formal Analysis, Methodology, Software, Writing–original draft, Writing–review and editing. AP: Methodology, Software, Validation, Visualization, Writing–original draft, Writing–review and editing. JC: Investigation, Validation, Visualization, Writing–original draft, Writing–review and editing. SR: Conceptualization, Data curation, Funding acquisition, Project administration, Resources, Supervision, Writing–original draft, Writing–review and editing.
Funding
The author(s) declare that financial support was received for the research, authorship, and/or publication of this article. BY was funded by a CIFRE doctoral grant from VisioTerra (contract number 2019/0457) and the CNES TOSCA grant FORVACCSS.
Acknowledgments
The authors thank José Darrozes and Eric Mougin (GET) for their valuable comments on the manuscript.
Conflict of interest
The authors declare that the research was conducted in the absence of any commercial or financial relationships that could be construed as a potential conflict of interest.
Publisher’s note
All claims expressed in this article are solely those of the authors and do not necessarily represent those of their affiliated organizations, or those of the publisher, the editors and the reviewers. Any product that may be evaluated in this article, or claim that may be made by its manufacturer, is not guaranteed or endorsed by the publisher.
References
Arikawa, Y., Saruwatari, H., Hatooka, Y., and Suzuki, S. (2014). “ALOS-2 launch and early orbit operation result,” in 2014 IEEE geoscience and remote sensing symposium (IEEE), 3406–3409.
Asner, G. P., Bustamante, M. M., and Townsend, A. R. (2003). Scale dependence of biophysical structure in deforested areas bordering the Tapajos National Forest, Central Amazon. Remote Sens. Environ. 87, 507–520. doi:10.1016/j.rse.2003.03.001
Assunção, J., Gandour, C., and Rocha, R. (2017). DETERring deforestation in the Amazon: environmental monitoring and law enforcement.
Ballère, M., Bouvet, A., Mermoz, S., Le Toan, T., Koleck, T., Bedeau, C., et al. (2021). SAR data for tropical forest disturbance alerts in French Guiana: benefit over optical imagery. Remote Sens. Environ. 252, 112159. doi:10.1016/j.rse.2020.112159
Bouvet, A., Mermoz, S., Ballère, M., Koleck, T., and Le Toan, T. (2018). Use of the SAR shadowing effect for deforestation detection with Sentinel-1 time series. Remote Sens. 10, 1250–1319. doi:10.3390/rs10081250
Creese, A., Washington, R., and Jones, R. (2019). Climate change in the Congo Basin: processes related to wetting in the December–February dry season. Clim. Dyn. 53, 3583–3602. doi:10.1007/s00382-019-04728-x
Doblas, J., Reis, M. S., Belluzzo, A. P., Quadros, C. B., Moraes, D. R. V., Almeida, C. A., et al. (2022). DETER-R: an operational near-real time tropical forest disturbance warning system based on sentinel-1 time series analysis. Remote Sens. 14, 3658. doi:10.3390/rs14153658
Doblas, J., Shimabukuro, Y., Sant’anna, S., Carneiro, A., Aragão, L., and Almeida, C. (2020). Optimizing near real-time detection of deforestation on tropical rainforests using sentinel-1 data. Remote Sens. 12, 3922–3931. doi:10.3390/rs12233922
Drusch, M., Del Bello, U., Carlier, S., Colin, O., Fernandez, V., Gascon, F., et al. (2012). Sentinel-2: ESA’s optical high-resolution mission for GMES operational services. Remote Sens. Environ. Sentinel Missions - New Oppor. Sci. 120, 25–36. doi:10.1016/j.rse.2011.11.026
Fan, L., Wigneron, J.-P., Ciais, P., Chave, J., Brandt, M., Fensholt, R., et al. (2019). Satellite-observed pantropical carbon dynamics. Nat. Plants 5, 944–951. doi:10.1038/s41477-019-0478-9
Federici, S., Tubiello, F. N., Salvatore, M., Jacobs, H., and Schmidhuber, J. (2015). New estimates of CO2 forest emissions and removals: 1990-2015. For. Ecol. Manag. 352, 89–98. doi:10.1016/j.foreco.2015.04.022
Gatti, L. V., Basso, L. S., Miller, J. B., Gloor, M., Gatti Domingues, L., Cassol, H. L., et al. (2021). Amazonia as a carbon source linked to deforestation and climate change. Nature 595, 388–393. doi:10.1038/s41586-021-03629-6
Hansen, M. C., Potapov, P. V., Moore, R., Hancher, M., Turubanova, S. A., Tyukavina, A., et al. (2013). High-resolution global maps of 21st-century forest cover change. Science 342, 850–853. doi:10.1126/science.1244693
Harris, N. L., Gibbs, D. A., Baccini, A., Birdsey, R. A., de Bruin, S., Farina, M., et al. (2021). Global maps of twenty-first century forest carbon fluxes. Nat. Clim. Chang. 11, 234–240. doi:10.1038/s41558-020-00976-6
Hosonuma, N., Herold, M., De Sy, V., De Fries, R. S., Brockhaus, M., Verchot, L., et al. (2012). An assessment of deforestation and forest degradation drivers in developing countries. Environ. Res. Lett. 7, 044009. doi:10.1088/1748-9326/7/4/044009
Joshi, N., Mitchard, E. T. A., Woo, N., Torres, J., Moll-Rocek, J., Ehammer, A., et al. (2015). Mapping dynamics of deforestation and forest degradation in tropical forests using radar satellite data. Environ. Res. Lett. 10, 034014. doi:10.1088/1748-9326/10/3/034014
Kellndorfer, J. (2019). “Using SAR data for mapping deforestation and forest degradation,” in THE SAR HANDBOOK comprehensive methodologies for forest monitoring and biomass estimation (Huntsville, AL: ServirGlobal), 65–79.
Kleinschroth, F., Laporte, N., Laurance, W. F., Goetz, S. J., and Ghazoul, J. (2019). Road expansion and persistence in forests of the Congo Basin. Nat. Sustain. 2, 628–634. doi:10.1038/s41893-019-0310-6
Lescuyer, G., Cerutti, P. O., Manguiengha, S. N., and bi Ndong, L. B. (2011). The domestic market for small-scale chainsaw milling in Gabon: present situation, opportunities and challenges. Bogor, Indonesia: CIFOR.
Lynch, J., Maslin, M., Balzter, H., and Sweeting, M. (2013). Choose satellites to monitor deforestation. Nature 496, 293–294. doi:10.1038/496293a
Manogaran, G., and Lopez, D. (2018). Spatial cumulative sum algorithm with big data analytics for climate change detection. Comput. Electr. Eng. 65, 207–221. doi:10.1016/j.compeleceng.2017.04.006
Mermoz, S., Bouvet, A., Koleck, T., Ballère, M., and Le Toan, T. (2021). Continuous detection of forest loss in vietnam, Laos, and Cambodia using sentinel-1 data. Remote Sens. 13, 4877. doi:10.3390/rs13234877
Mistry, J., Jafferally, D., and Ruiz-Ramos, J. (2021). Covid-19 impacts on Indigenous food sovereignty, livelihoods and biodiversity. Guyana. Report published by.
Olofsson, P., Foody, G. M., Herold, M., Stehman, S. V., Woodcock, C. E., and Wulder, M. A. (2014). Good practices for estimating area and assessing accuracy of land change. Remote Sens. Environ. 148, 42–57. doi:10.1016/j.rse.2014.02.015
Pfefer, A., Ygorra, B., Frappart, F., Demarchi, G., Pillot, B., Subervie, J., et al. (2024). How Sentinel-1 timeseries can improve the implementation of conservation programs in Brazil. Remote Sens. Appl. Soc. Environ. 35, 101241. doi:10.1016/j.rsase.2024.101241
Qin, Y., Xiao, X., Wigneron, J. P., Ciais, P., Brandt, M., Fan, L., et al. (2021). Carbon loss from forest degradation exceeds that from deforestation in the Brazilian Amazon. Nat. Clim. Change 11, 442–448. doi:10.1038/s41558-021-01026-5
Reiche, J., Mullissa, A., Slagter, B., Gou, Y., Tsendbazar, N.-E., Odongo-Braun, C., et al. (2021). Forest disturbance alerts for the Congo Basin using Sentinel-1. Environ. Res. Lett. 16, 024005. doi:10.1088/1748-9326/abd0a8
Ruiz-Ramos, J., Marino, A., Boardman, C., and Suarez, J. (2020). Continuous forest monitoring using cumulative sums of sentinel-1 timeseries. Remote Sens. 12, 3061. doi:10.3390/RS12183061
Ryan, C. M., Hill, T., Woollen, E., Ghee, C., Mitchard, E., Cassells, G., et al. (2012). Quantifying small-scale deforestation and forest degradation in African woodlands using radar imagery. Glob. Change Biol. 18, 243–257. doi:10.1111/j.1365-2486.2011.02551.x
Santos, C. A. G., do Nascimento, T. V. M., and da Silva, R. M. (2020). Analysis of forest cover changes and trends in the Brazilian semiarid region between 2000 and 2018. Environ. Earth Sci. 79, 418. doi:10.1007/s12665-020-09158-1
Torres, R., Snoeij, P., Geudtner, D., Bibby, D., Davidson, M., Attema, E., et al. (2012). GMES Sentinel-1 mission. Remote Sens. Environ. 120, 9–24. doi:10.1016/j.rse.2011.05.028
Umunay, P. M., Gregoire, T. G., Gopalakrishna, T., Ellis, P. W., and Putz, F. E. (2019). Selective logging emissions and potential emission reductions from reduced-impact logging in the Congo Basin. For. Ecol. Manag. 437, 360–371. doi:10.1016/j.foreco.2019.01.049
Watanabe, M., Koyama, C., Hayashi, M., Kaneko, Y., and Shimada, M. (2017). “Development of early-stage deforestation detection algorithm (advanced) with PALSAR-2/ScanSAR for JICA-JAXA program (JJ-FAST),” in 2017 IEEE International Geoscience and Remote Sensing Symposium (IGARSS), 2446–2449. doi:10.1109/IGARSS.2017.8127487
Watanabe, M., Koyama, C. N., Hayashi, M., Nagatani, I., and Shimada, M. (2018). Early-stage deforestation detection in the tropics with L-band SAR. IEEE J. Sel. Top. Appl. Earth Observations Remote Sens. 11, 2127–2133. doi:10.1109/JSTARS.2018.2810857
Watanabe, M., Koyama, C. N., Hayashi, M., Nagatani, I., Tadono, T., and Shimada, M. (2021). Refined algorithm for forest early warning system with ALOS-2/PALSAR-2 ScanSAR data in tropical forest regions. Remote Sens. Environ. 265, 112643. doi:10.1016/j.rse.2021.112643
Weisse, M., Nogueron, R., Vicencio, R. E. V., and Soto, D. A. C. (2019). Use of near-real-time deforestation alerts.
Yang, H., Ciais, P., Frappart, F., Li, X., Brandt, M., Fensholt, R., et al. (2023). Global increase in biomass carbon stock dominated by growth of northern young forests over past decade. Nat. Geosci. 16, 886–892. doi:10.1038/s41561-023-01274-4
Ye, S., Zhu, Z., and Suh, J. W. (2024). Leveraging past information and machine learning to accelerate land disturbance monitoring. Remote Sens. Environ. 305, 114071. doi:10.1016/j.rse.2024.114071
Ygorra, B., Frappart, F., Wigneron, J., Moisy, C., Catry, T., Baup, F., et al. (2021). “Deforestation monitoring using sentinel-1 SAR images in humid tropical areas,” in 2021 IEEE international geoscience and remote sensing symposium IGARSS, 5957–5960. doi:10.1109/IGARSS47720.2021.9554698
Ygorra, B., Frappart, F., Wigneron, J., Moisy, C., Pillot, B., Puiseux, J., et al. (2022). “Classification and deforestation monitoring using sentinel-1 C-SAR images in a temperate exploited pine forest,” in IGARSS 2022-2022 IEEE international geoscience and remote sensing symposium (IEEE), 691–694.
Ygorra, B., Frappart, F., Wigneron, J. P., Moisy, C., Catry, T., Baup, F., et al. (2021). Monitoring loss of tropical forest cover from Sentinel-1 time-series: a CuSum-based approach. Int. J. Appl. Earth Observation Geoinformation 103, 102532. doi:10.1016/j.jag.2021.102532
Ygorra, B., Frappart, F., Wigneron, J.-P., Moisy, C., Catry, T., Pillot, B., et al. (2024). Corrigendum to “ReCuSum: a polyvalent method to monitor tropical forest disturbances” [ISPRS J. Photogramm. Rem. Sens. 203 (2023) 358–372]. ISPRS J. Photogramm. Rem. Sens. 211, 298. doi:10.1016/j.isprsjprs.2024.04.003
Keywords: SAR remote sensing, time-series analysis, tropical forest monitoring, deforestation, near-real-time monitoring
Citation: Ygorra B, Frappart F, Wigneron J-P, Catry T, Pillot B, Pfefer A, Courtalon J and Riazanoff S (2024) A near-real-time tropical deforestation monitoring algorithm based on the CuSum change detection method. Front. Remote Sens. 5:1416550. doi: 10.3389/frsen.2024.1416550
Received: 12 April 2024; Accepted: 03 July 2024;
Published: 26 July 2024.
Edited by:
Shengli Tao, Peking University, ChinaCopyright © 2024 Ygorra, Frappart, Wigneron, Catry, Pillot, Pfefer, Courtalon and Riazanoff. This is an open-access article distributed under the terms of the Creative Commons Attribution License (CC BY). The use, distribution or reproduction in other forums is permitted, provided the original author(s) and the copyright owner(s) are credited and that the original publication in this journal is cited, in accordance with accepted academic practice. No use, distribution or reproduction is permitted which does not comply with these terms.
*Correspondence: Bertrand Ygorra, YmVydHJhbmQueWdvcnJhQGlucmFlLmZy
†Present address: Bertrand Ygorra, INRIA, GEOSTAT Team, Talence, France