
94% of researchers rate our articles as excellent or good
Learn more about the work of our research integrity team to safeguard the quality of each article we publish.
Find out more
ORIGINAL RESEARCH article
Front. Remote Sens., 24 July 2024
Sec. Microwave Remote Sensing
Volume 5 - 2024 | https://doi.org/10.3389/frsen.2024.1399839
 Bing Lin1*
 Matthew Walker Mclinden2Xia Cai1
 Gerald M. Heymsfield2Nikki Privé2,3Steven Harrah1Lihua Li2
Sea surface air pressure observations are a significant gap in the current Earth observing systems. This study addresses retrieval algorithm development and the evaluation of the potential impact of instrumental and environmental uncertainties on sea level pressure retrievals for the measurements of O2 differential absorption radar systems operating at three spectrally evenly spaced close-frequency bands (65.5, 67.75, and 70.0 GHz). A simulated northern hemispheric summer case is used to simulate retrieval uncertainties. To avoid high attenuation and a low signal-to-noise ratio, radar measurements from weather conditions with a rain rate ≥1 mm/h are not used in the retrieval. This study finds that a retrieval algorithm combining all three channels, i.e., the 3-channel approach, can effectively mitigate major atmospheric and sea surface influences on sea surface air pressure retrieval. The major uncertainty of sea surface pressure retrieval is due to the standard deviation in radar power returns. Analysis and simulation demonstrate the potential of global sea surface pressure observations with errors of about 1∼2 mb, which is urgently needed for the improvement of numerical weather prediction models. Future work will emphasize instrument development and field experiments. It is anticipated that an O2 differential absorption radar system will be available for meteorological applications in a few years.
Global meteorological observations inject millions of in-situ and remotely sensed data into numerical weather prediction (NWP) models every day. These data are essential in the initialization, adjustment, assimilation, and prediction of models that influence the daily activities of people and society. Many key weather variables such as temperature, humidity, and winds can be relatively well observed by both in-situ and remote sensing techniques from surface, suborbital, and orbital platforms. However, surface air pressure cannot be well-sampled by existing remote sensing techniques. There is no operational remote sensing method available for the crucial climate and weather variable. Over open oceans, the pressure can only be observed by very limited buoys, ships, and oceanic platforms. More than 70% of the global ocean is 150 km or more away from the nearest in situ surface pressure observation site, with 25% of the ocean surface even being more than 500 km away (Prive et al., 2023).
Surface air pressure is a measure of the gravity force of the column total mass of the atmosphere over a unit area. Thus, air pressure is a combined effect of atmospheric dry air, water vapor, cloud water, and potentially rainwater, along with gravitational acceleration that is basically a function of latitude and altitude. Atmospheric surface pressure can have sharp gradients and subtle features. These pressure and pressure gradient fields are the primary driving force for atmospheric motions that transport mass, moisture, and momentum (Holton, 1979). Within the planetary boundary layer (PBL), the balance of pressure gradient, Coriolis, and viscosity forces could produce considerable atmospheric transport because of Ekman pumping. Above the PBL, large-scale horizontal motions at middle and high latitudes are dominantly decided by geostrophic wind fields resulting from the balance of atmospheric pressure gradient and Coriolis forces. Over the tropics, hurricane winds and vortexes can be expressed by sea level pressure (SLP) of the hurricane center and surrounding pressure gradients (Xiao et al., 2000).
For a variety of important dynamic reasons, NWP models are critically dependent on accurate analyses of the pressure field. Surface pressure is the most important in situ observed quantity for large-scale forecasting of modern weather forecasts over land (Haiden et al., 2018). They provide important information about three-dimensional (3D) atmospheric structures and influence all other meteorological variables within the troposphere in assimilation systems (Mass and Madaus, 2014). Studies found that even with only limited global and regional surface pressure observations, a highly realistic twentieth-century reanalysis and synoptic-scale upper-air patterns over western North America and the eastern Pacific, respectively, could be produced (Whitaker et al., 2004; Dirren et al., 2007). Without thousands of surface meteorological stations, the 5–10-day weather forecasts relied upon daily by the public and commerce would be considerably compromised (Radnóti et al., 2012; Ingleby and Isaksen, 2018). Over oceans, denial of buoy surface pressure observations in the European Centre for Medium-Range Weather Forecast (ECMWF) system has been shown to have a large and significant detrimental impact on pressure, temperature, and wind fields globally and locally up to 2–3 forecast days. The impact could be detectable not only near the surface but also up to about 10 km altitude (Horanyi et al., 2017). Unfortunately, the pressure over oceans is mainly observed by sparse buoys and ships. These observations have very limited coverage, especially away from shipping lanes or coasts (Prive et al., 2023). Even for buoys, approximately half do not report surface pressures, and funding for drifting buoys is limited (Centurion et al., 2017).
The lack of global sea surface pressure observations is a significant gap in current Earth observing systems. Filling this gap will provide great potential for weather forecast improvements. A recent observing system simulation experiment (OSSE) study (Prive et al., 2023) suggested that sea surface barometry with a space-based oxygen (O2) differential absorption radar (DAR) could significantly improve global weather forecasts, especially over Southern Oceans and other remote areas, due to currently limited pressure observation capability over these regions. The study also revealed that a DAR barometric sensor would be among the most important instruments of Earth observing systems for models and has one of the highest observation beneficial impacts on NWP. The pressure data injected into NWP models would not only improve model dynamic fields but also influence PBL temperature structures, providing invaluable PBL insight.
Besides NWP model improvements in normal operational weather forecasts, surface pressure observations can have a significant impact on severe weather, especially tropical cyclone, predictions. Tropical storms have a very low SLP center and surrounding strong surface pressure gradient fields, which dominantly determine hurricane ambient flows and steering winds and regulate hurricane movements (Camargo et al., 2007; Radnóti et al., 2012). Many studies have demonstrated that proper knowledge of those surface-level pressure fields can substantially improve hurricane forecasts (Barker et al., 2003; Barker et al., 2004; Xiao et al., 2000; Xiao et al., 2009; Lawrence et al., 2012; Min et al., 2015a; Min et al., 2015b). For extratropical frontal systems, drifting buoy observations of sea surface pressure near areas of active baroclinic development can have a considerable beneficial impact on global atmospheric data assimilation and forecast systems (Reynolds et al., 2023).
For general global weather forecasts and severe weather, including hurricanes, predictions, global or large-scale regional pressure observations are urgently needed. They can only be achieved through remote sensing techniques. Recent studies in space and airborne DAR remote sensing technologies provide a great potential to fill the SLP observational gap of Earth observing systems (Lin and Hu, 2005; Lawrence et al., 2011; Lawrence et al., 2012; Millan et al., 2014; Lin and Min, 2017; Lin et al., 2021; Lin et al., 2023; Prive et al., 2023).
The DAR systems are designed to operate at atmospheric O2 absorption bands for column O2 mass amount measurements. The DAR frequencies are chosen to be closely spaced such that atmospheric attenuation other than O2 and surface reflection are similar but the difference in O2 absorption is substantial. Thus, when DAR sea surface returns are measured, the effects of the attenuation and reflection are significantly reduced and the differential loss due to atmospheric O2 is dominant and can be measured by the ratio of frequency-paired DAR signals. Since oxygen is well mixed in the atmosphere, the column dry air mass can be obtained from the measured O2 amounts. Additionally, atmospheric moisture amount is mainly decided by column water vapor with some contributions from cloud water and rainwater in non-rain or light rain weather conditions (rain rate <1 mm/h). Therefore, sea surface air pressure can be obtained from a combination of DAR retrievals of dry air mass and the column water vapor and cloud water that have been well observed by passive microwave, visible, and infrared remote sensing techniques for decades over oceans.
A key technique requirement for DAR instrumentation is its precise SLP measurements. The standard errors in in-situ buoy and ship observations are generally around 0.9 and >1.5 mb, respectively (Kent and Berry, 2005; Ingleby, 2010). These accurate in-situ SLP measurements have positive impacts on NWP models, though the amount of data is limited (Ingleby and Isaksen, 2018). Recent OSSE studies (Prive et al., 2023) also demonstrated the high precision needs. In this study, a precision similar to in-situ measurements of 1 to 2 mb of SLP retrievals from spaceborne DAR barometry was assumed, which had a significant impact on forecasted meteorological states over oceans. Thus, the objective is to achieve a 1 to 2 mb precision with the SLP retrieval of considered DAR systems. Though challenging, this analysis shows that this precision can be achieved with certain spatiotemporal averages as indicated in various instrumentation assessments (Lin and Hu, 2005; Lawrence et al., 2011; Millan et al., 2014; Prive et al., 2023). Since surface air pressure is about 1,000 mb, 1 to 2 mb standard error would be equivalent to about 0.1%∼0.2% precision. This study will use this precision as a key measure to evaluate the impacts of all crucial elements, such as environments, retrieval algorithms, and system conditions, on DAR pressure retrievals. The purpose is to minimize those impacts and leave the major factor affecting the retrieval to the instrument measurement uncertainty.
For DAR remote sensing of sea surface air pressure, uncertainties in radar power returns could cause major errors in the retrieval. Besides this primary DAR retrieval error source, other uncertainties from the instrument such as errors in antenna pointing and scanning angles could potentially introduce retrieval uncertainties. Furthermore, atmospheric water vapor, cloud water, rain, and other environmental conditions could be potential sources of retrieval errors. Even Earth’s acceleration of gravity used could introduce considerable differences in calculated pressure values if its variations in latitude and altitude are not considered. Accurate accounting for these environmental variables and their associated microwave attenuation impacts on DAR signals is needed.
Another environmental factor that can have a significant influence on radar return power and its derived SLP retrieval is sea surface reflection. Sea surface wind, sea surface water temperature, sensor pointing, incidence, and reflection angles, and sea surface salinity all play important roles in determining the reflection and/or normalized radar cross-section (NRCS) of the surface. Sea surface NRCS dependence on these geophysical variables has been studied for a long time. These fundamental studies provide not only observational insights but also the theoretical basis of sea surface microwave reflection and NRCS and are widely used in existing mono-static or bi-static Earth observing radar systems such as those at L, C, X, Ka, Ku, and W bands (e.g., Masuko et al., 1986; Donelan and Pierson, 1987; Lin et al., 1999; Stiles et al., 2002; Li et al., 2005; Contreras and Plant, 2006; Tanelli et al., 2008; Foti et al., 2015; Karaev et al., 2015; Hossan and Jones, 2021). However, at our O2 absorption wavelengths of interest (i.e., V-band) it is only recently that sea surface reflection at the band has been thoroughly studied by this research team (Lin et al., 2023). The influences of all major geophysical variables are considered in the study. Quantitative relations among sea surface reflectance, NRCS, and those geophysical variables are obtained based on the pioneering work of Cox and Munk (1954), Cox and Munk (1955), and Cox and Munk (1956) with the latest minor adjustment on some parameters obtained from space observations (Breon and Henriot, 2006). The sea state for SLP retrieval using DAR systems is limited to a sea surface wind speed below 15 m/s as discussed in Lin et al. (2023). Extreme winds with considerable sea sprays could cause significant extra attenuation for radar signals and impact SLP retrieval.
This study discusses algorithm development and applies the algorithm in SLP retrieval simulations for spaceborne and airborne DAR measurements. It focuses on the impacts of instrument measurement uncertainties and environmental conditions on SLP retrieval as mentioned previously. Since sea surface reflection and NRCS data are directly obtained from the study of Lin et al. (2023), general and/or detailed discussions on this topic can be found in the study. Key results related to the current study are as follows: the reflectance ratio of DAR frequency pairs shows small variations in terms of considered geophysical variables, while the ratio of two ratios of frequency pairs is very close to unity, and calibration or compensation for the reflectance ratios may not be needed for sea level pressure retrievals. This significantly mitigates the impact of those geophysical variables on SLP retrieval.
Section 2 briefly describes the SLP remote sensing method and its related retrieval processes. Other basic information about DAR instrumentation such as wavelengths, power, and meteorological data used in analysis are also discussed. Section 3 analyzes the influences of major elements from the instrument and environment on SLP retrieval. Potential uncertainties are estimated. Simulations of spaceborne and airborne SLP retrievals for a simulated global weather case are discussed in Section 4. Potential SLP errors for the proposed DAR system are estimated. Finally, Section 5 summarizes the findings of this study and points out future research directions.
The basic principle of radar barometry is to select two or more closely spaced frequency channels at O2 absorption bands so that the differences in atmospheric O2 absorption on received radar powers of the two channels are significant. When DAR returns are measured, the effects of the attenuation and reflection of other environmental variables are, thus, substantially reduced due to the spectral closeness of these channels, and the O2 differential loss is dominant and can be measured by the ratio of frequency-paired DAR signals. A DAR system, then, is designed as a scatterometer radar, except it operates at the selected closely spaced frequency channels. The fundamental requirements of system designs are 1) to obtain radar power returns with uncertainty potentially producing SLP retrieval errors around 1∼2 mb and 2) to mitigate the influence of all environmental and system conditions other than O2 absorptions to a tolerance level so that their SLP retrieval uncertainties are significantly less than 0.1%, preferably less than 0.05%. The SLP retrieval errors from the designed DAR system would thus be dominantly decided by return power uncertainties. The retrieval algorithm development is targeted at this goal.
The theoretical basis of SLP retrieval using the DAR system is that environmental conditions, especially atmospheric O2, have significant impacts on radar signals. The basic relation between the radar signals and environments, as demonstrated originally by Lin and Hu (2005) and later in many other studies (Lawrence et al., 2011; Lawrence et al., 2012; Millan et al., 2014; Lin and Min, 2017; Lin et al., 2021), can be approximately expressed as
where Pt(f) and Pr(f) are radar transmitted and receive signal powers at frequency f, respectively. A(f) is a two-way system gain constant, mainly for the antenna, while σ0(f) and R are the wavelength-dependent sea surface reflectance and the range from radar to the surface, respectively. T(f) is one-way atmospheric transmittance at the radar frequency. It critically depends on atmospheric absorption from O2, water vapor, cloud water, and potentially rainwater. Here, we only consider non-rain or light rain (rain rate <1 mm/h) weather conditions. A recent OSSE study (Previ et al., 2024) found that sea surface pressure retrievals of spaceborne DAR instruments provide significant weather forecast impacts even with a light rain threshold of 1 mm/h. For moderate to heavy rain cases, absorption and scattering from precipitation-sized large hydrometeors and their related large column total water amounts could increase atmospheric attenuation considerably (Lin and Rossow, 1997), which would reduce the signal-to-noise ratio (SNR) of the radar measurements by an unacceptable amount. Thus, this study avoids significant atmospheric scattering (or substantial rain) cases to maintain high SNR and retrieval precision. Note that large hydrometeor scattering situations could be used for atmospheric pressure profiling by measuring radar returns at backscattering layers such as bright bands of rain. Since accurate range capability, besides regular DAR needs for SLP retrieval, is also required for the profiling, this kind of DAR system is beyond the scope of this study and left for future studies.
The atmospheric transmittance term in Eq. 1 is the key to relating radar returns with atmospheric agents. For an absorption-dominated atmosphere, the transmittance T equals
Here, μ is the cosine of radar viewing angle, and τm represents the absorption optical depth of atmospheric agent m (m = O2, vapor, dry air continuum, cloud liquid water, and rainwater or O, V, c, L, and r for short, respectively) at frequency f. Cloud ice water is not considered in this transmittance because, for non-rain or light-rain conditions, ice particulars are very small compared to considered wavelengths and have no significant absorption at microwave wavelengths. The extinction effects of both scattering and absorption from these particulars are thus negligible (Lin and Rossow, 1994; Lin and Rossow, 1997; Lin et al., 1998a; Lin et al., 1998b). Similarly, because of the small particle sizes of light rain droplets, scattering effects can be ignored, which leaves only rain absorption effects in the transmittance term.
After calibration and normalization for the system gain A and transmitted power Pt, the ratio, γ, of two return powers with closely spaced frequencies f1 and f2 becomes
In this equation, k values are normalization constants that mean the DAR system has the same gain for all frequencies and can be obtained from ground system tests before flight observations or be estimated with vicarious calibration. Similarly, C1 and C2 are radar power calibration and normalization coefficients at frequencies f1 and f2, respectively. They are used to achieve a uniform radar transmitted power across all frequencies. Unlike constant k values, these power calibration coefficients are measured instantaneously from an internal calibration loop of the DAR system in monitoring potential radar power drafts at all wavelengths. For simplicity, hereafter we assume all DAR powers transmitted are calibrated; thus, all calibration coefficients are no longer shown in equations.
Further simplifying Eqs 2, 3 shows that
where Δτm(f1, f2) means the optical depth difference between frequencies 1 and 2 for the m agent. Since the dry air continuum absorption (absorption not related to the O2 absorption) is very weak, its differential absorption would be even smaller and could be potentially ignored. The first term in this equation is assumed to be positive (i.e., channel 1 has much stronger O2 absorption than channel 2) and can be calculated as:
Here and hereafter, the numbers 1 and 2 represent f1 and f2, respectively. Z is the flight altitude for an airborne system, and for spaceborne systems, Z is the top-of-atmosphere (TOA) height. no(z) is the O2 molecular number density at z altitude, while α is the gas absorption cross-section at the given frequency. δO1,2 and NO, respectively, are vertically weighted O2 differential absorption cross-sections of the two frequencies and total O2 molecular number in the column, or
and
Equations 6–8 for O2 can also be applied to atmospheric water vapor, cloud water, and rainwater as in the calculations of this study. However, vapor generally concentrates in the lower troposphere, and cloud water and rainwater exist in certain atmospheric layers. Thus, very similar to Eq. 6, their absorption optical depth is usually expressed as a simple product of their absorption coefficient, a, and their corresponding water amount such as column water vapor (CWV). For cloud water and rainwater, they can be combined as a liquid water path (LWP) because of the same nature of liquid water absorption (e.g., Lin and Rossow, 1994; Lin et al., 1998a; Lin et al., 1998b; Wentz, 1997; Wentz, 2015). Thus, these integrated values are expressed as
Since these agents show only continuum absorption at the current spectral band, linear or quasi-linear variations of the coefficients with frequency are expected. That is, this expression clearly illustrates that the differential absorption optical depth (DAOD) values of these agents should linearly vary with frequency differences.
Since surface dry air pressure is a measure of the total dry air mass of the entire atmospheric column, it could be derived from a combination of the dry air pressure at flight altitude PZ with the pressure caused by the dry air mass of the DAR measurement column. For space observations, PZ = 0. Furthermore, the partial dry air pressure of the measurement column would be the product of the measured column dry air molecular number Nd and molecular mass Md along with Earth’s acceleration of gravity g, which can be estimated based on latitude with altitude adjustment (Wenzel, 1989; van Dam et al., 2010; Campbell et al., 2020). Since O2 is well mixed in the dry air with a constant mixing ratio χO, the dry air partial pressure, Pdp, can be derived from the O2 amount or its directly related ΔτO measurement:
Thus, SLP can be obtained from Pdp and PZ, along with the atmospheric column water amount Mw, that is
These Eqs 9–11, combined with Eqs 4, 5, provide the theoretical foundation for SLP retrieval using DAR techniques. Note that the water amount is mainly decided by atmospheric column water vapor with small (at least an order of magnitude smaller) contributions from cloud water and rainwater in non-rain or light rain conditions. Additionally, the atmospheric column total ice water amount or ice water path (IWP) for these weather conditions is usually <0.15 kg/m2 (Lin and Rossow, 1996; Minnis et al., 2007). With such a small amount of ice, it would produce pressure much less than 0.1 mb. Furthermore, these moisture components, including the IWP, have been observed over oceans for decades (e.g., Lin and Rossow, 1996; Lin and Rossow, 1997; Minnis et al., 2007). The water mass uncertainties would be only about 0.3 kg/m2 (Mears et al., 2015), which is well within 1 kg/m2 or equivalently the air pressure uncertainty within 0.1 mb.
The analysis here clearly shows that besides O2, other environmental variables such as humidity, cloud, rain, and sea surface could have potential impacts on the measured power ratio, though the spectral space between the two channels is very small. Theoretically, even the dry air continuum absorption could potentially affect retrieval because of the high precision required. However, it is very small and basically linearly varies with frequency, particularly for the differential absorption. Thus, the impact of dry air continuum absorption on SLP retrieval is negligible, i.e., only brief discussions are given here. The sea surface reflection term in Eq. 5 should be close to one for normal sea surface wind conditions (Lin et al., 2023). The impact of sea surface water temperature, salinity, and incidence angle was found to be similar. Thus, this term could be removed after certain calibrations. In other terms, an advantage of the differential absorption technique is that the absorption cross-section and optical depth of these variables would not only exert small changes but also near linearly vary with frequency in those closely spaced spectra. This leads to the consideration of adding a third channel with even weaker O2 absorption than channel 2 in the DAR system design. If the spectral space between this channel and channel 2 would be the same as that of channels 1 and 2, the grand ratio, G, of the power ratios of γ1,2 and γ2,3 would be:
From this grand ratio, the difference of the differential absorption optical depth (DAOD) values, also called the DAOD of the 3-channel approach, Δτ3C, is derived:
As found from a previous sea surface reflection study (Lin et al., 2023), the sea surface reflection term in this equation can be considered as zero with sufficient accuracy. Because of the spectrally evenly spaced channels and quasi-linear absorption coefficients with a frequency of moisture agents and dry air continuum absorptions, all differential absorption terms, except O2 in Eq. 13, are effectively removed. Thus, O2 DAOD from the 3-channel approach, ΔτO3C, can be derived from the grand ratio:
with the proportionality of sea surface dry air partial pressure and O2 DAOD, sea surface dry air pressure and SLP can be retrieved based on the DAOD values, ΔτO3C, of the 3-channel approach. Eqs 13, 14 show no adjustment or compensation for environmental variables is required for this 3-channel approach.
This study addresses the SLP retrieval algorithm development and assesses the impacts of measurement and environmental uncertainties on retrievals. The instrument design, structure, operation procedure, and system performance of studied DAR systems are beyond the scope of this study. The system character introduced here is to provide a basic DAR system overview for algorithm developments, assuming the systems can reach their hardware development and measurement objectives. Thus, the analysis and simulation discussed later focus on retrievals and not on instrument operation and performance.
The current design of the DAR instrument will have three channels: the first one is at a substantial O2 absorption frequency, the second has a frequency very close to the first but with weak O2 absorption, and the third is at the same spaced wavelength as the second to the first and has even weaker absorption. These channels are selected at the central frequencies of 65.5, 67.75, and 70 GHz, respectively, with a spectral bandwidth of 100 MHz for each channel. Unlike using frequencies at the lower sideband of the 50–75 GHz O2-absorption complex in the original work (e.g., Lin and Hu, 2005; Lawrence et al., 2011), these upper sideband frequencies are considered to eliminate the possibility of active instruments interfering with passive microwave sensors such as Advanced Technology Microwave Sounding (ATMS), which has the same lower sideband for atmospheric temperature profiling. With these three channels, two ratios of DAR sea surface power returns, one for the pair at frequencies 65.5 and 67.75 GHz and another at 67.75 and 70.0 GHz, can be measured. As previously discussed, the key reason to have the second pair is to eliminate the impact of environment variables other than O2 for pressure retrieval.
Figure 1 shows the spectral character of gas absorption optical depth (OD) around the selected frequency bands for climatological tropical (black curves) and midlatitude winter (blue curves) atmospheric vertical profiles (McClatchey et al., 1972). The OD values of total gases (solid curves), O2 (dashed curves), and water vapor (dashdot curves) from the top-of-atmosphere (TOA) to the surface are plotted. As indicated, the total and O2 gas absorption curves for the tropical profile are shifted up by 0.5 to avoid overlapping with winter ones. Similarly, the water vapor OD values are enlarged 20 times to show them clearly because they are too small compared to others. The stars in the figure represent the three channels used in current instrument. These channels are all selected at relatively smooth spectral places, which minimizes retrieval uncertainties caused by unknown spectral changes.
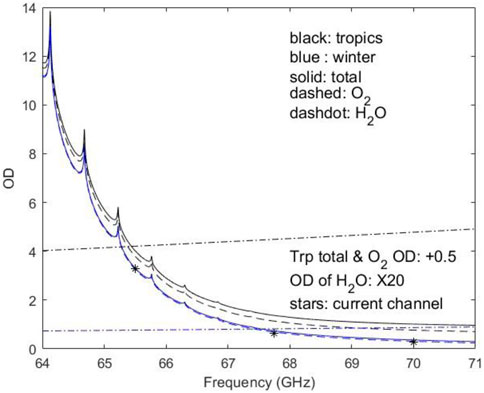
Figure 1. Spectral characteristics of atmospheric gas absorption optical depth (OD) from the top-of atmosphere (TOA) to surface at the O2 absorption V-band of 64–71 GHz. The OD values calculated are for climatological tropical (black curves) and midlatitude winter (blue curves) atmospheric profiles of McClatchey et al. (1972). The solid, dashed, and dashdot curves are for total gases, O2 and water vapor, respectively. The stars show the frequencies of current instrument. As indicated in the figure, the total and O2 gas absorption curves for the tropical profile are shifted up by +0.5 to avoid overlapping with winter ones. Similarly, the water vapor OD values are enlarged 20 times for visibility.
The dominant part of total gas absorption OD values is from O2, especially at strong absorption wavelengths (lower frequency side of the figure). The third channel has weaker O2 absorption compared to channel 2 and generates limited O2 DAOD because the purpose of selecting this channel is not to achieve significant DAOD values but instead the removal of environmental impacts other than O2. Influenced by the O2 absorption line shapes, certain asymmetries in O2 absorption ODs occur around individual center frequencies, particularly for channel 1. This O2 absorption feature also leads to uneven total gas OD values around channel center frequencies. Thus, OD values at center frequencies may not represent spectral characteristics of entire channels even if the bandwidth is only 0.1 GHz or only about 0.15% of the center frequency.
Within the selected closely spaced spectral range, the other environment variables practically linearly vary with frequencies as indicated by the water vapor optical depth τV. Requiring enlargement to be visible in the scale, even extremely abundant water vapor, the tropical τV values (black dashdot line) are small compared to the O2 optical depth. When the difference of the differential absorption at channels 1 and 2 and channels 2 and 3 is calculated or the 3-channel approach is applied, the vapor DAOD for the 3-channel approach, ΔτV3C, is expected to be very close to zero, i.e., ΔτV3C = τV1 + τV3− 2τV2 ≈ 0 (see Figure 1). Similar DAOD results can also be obtained for cloud water and rainwater.
Figure 2 shows the absorption spectral characteristics of rain and cloud water calculated at 15°C water temperature. Precipitation-sized droplets are calculated based on classical Marshall-Parmer (1948); black lines) rain and Joss-Waldvogel (1969); magenta lines) drizzle size distributions with 1 km precipitation depth. The two size distributions are considered to account for the potential range of size spectral and total mass variations of large and/or small precipitation-sized particles under various weather conditions. The absorption and extinction of these light rains are estimated based on Mie scattering. The dashdot, dashed, and solid curves are for 0.5, 1, and 3 mm/h rain rates, respectively, which covers the rain screen need upon retrieval. For a light rain of about 3 mm/h and ∼1 km rain thickness, the extinction optical depth could reach values of 0.6 or larger, which would produce about 5 dB attenuation for DAR return signals. Thicker rain layers with weaker rains (e.g., 3 km thick rain with 1 mm/h rate) would have similar attenuation. Cloud OD (blue line) is estimated with a cloud liquid water path of 0.2 kg/m2. The stars show the frequencies of the current instrument. These OD values practically vary linearly with frequency in this V-band. The near linear variations of cloud water and rain absorption with frequency cancel their DAOD values in a 3-channel approach. Additionally, this 3-channel approach removes sea surface reflection impact as shown in Lin et al. (2023). All these illustrate the crucial advantage of the 3-channel approach.
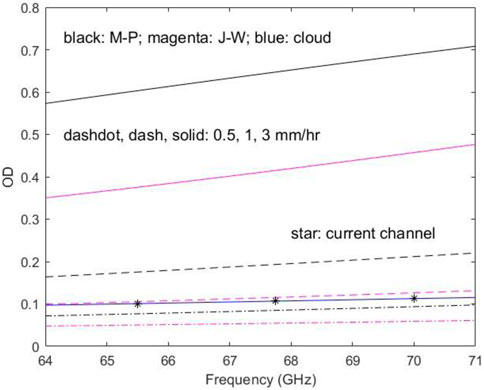
Figure 2. Similar as Figure 1, except for rain and cloud water OD values. Precipitation-sized droplets are calculated based on Marshall-Parmer (black lines) rain and Joss-Waldvogel (magenta lines) drizzle size distributions with 1 km precipitation depth. The dashdot, dashed, and solid curves are for 0.5, 1 and 3 mm/h rain rates, respectively. Cloud OD (blue line) is estimated with cloud liquid water path 0.2 kg/m2. The stars show the frequencies of current instrument. These OD values practically linearly vary with frequency in this V-band.
The designed DAR instruments will have transmitted powers ranging from 1 W to 10 W. The high-end power is for space applications and others for systems onboard aircraft, particularly ER-2. With these strong power levels, the instruments potentially gain the ability to scan Earth’s surface along a cross-track direction with ±15° viewing angles. The uncertainty of the viewing angle or attitude knowledge for airborne systems is within 0.01°, while that for space systems will be even smaller. Since SLP is a measure of column air mass, an adjustment of slant path DAR scanning measurement to nadir direction is required as indicated in previous equations, e.g., Eqs. 5, 13, 14. Thus, attitude uncertainty should be controlled to a reasonable level for precise SLP retrieval.
Both airborne and spaceborne systems would integrate received signals to reduce the uncertainty in partial column dry air mass pressure retrievals or the relative error ε of ΔτO3C: ε(ΔτO3C)/ΔτO3C within about 0.1%–0.2%. Since the signal S for pressure retrieval is exp(−2ΔτO3C) or SdB = −20ΔτO3C log10(e) when using decibels, the error of the signal is
Calculations show that ΔτO3C is about 2.3 (see Figure 1), thus, ε(SdB) in Eq. 15 is about 0.020 dB for 0.1% retrieval uncertainty. This requires the uncertainty in the retrieval signal or in the DAR case the grand ratio to be about 0.02–0.04 dB, which sets a target in the DAR development for an SLP retrieval error of about 1–2 mb. In this simulation, noise levels with these uncertainties are added to the signals. Note that for the pair of channels 1 and 2, the ΔτO1,2 is about 2.7 (see Figure 1) and its corresponding 0.1% error about 0.023 dB.
For received signal powers and considering the basic nadir viewing situation, based on the first-order error propagation theory (Ehret et al., 2008; Lin and Liu, 2021), the expected standard error in DAOD values of the 3-channel approach, ε(ΔτO3C), due to standard errors (STD) in individual signal power quantities in Eq. 14 can be estimated as
The 3-channel approach could have very different retrieval errors for various signal integration schemes used during DAR operation. One scenario is the weakest channel, channel 1, has considerably lower received signal powers or bigger standard errors than the other two channels even when it reaches the targeted 0.02 dB or 100.002 − 1 = 0.46% precision requirement through DAR signal integration. In this case, the retrieval precision for the 3-channel approach would be ε(ΔτO3C)/ΔτO3C = ε(P1)/(2P1)/ΔτO3C ≈ 0.46%/2/2.3 ≈ 0.1% or about 1 mb SLP retrieval error, as expected. However, this may require a long integration time because of the likelihood of the high requirement for all channels. An effective way would provide more time or independent samples for weak channels. In this case, channels 1 and 3 could be assumed to be weaker than channel 2. This may be realistic since channel 2 is located at the spectral center of the DAR amplifier, resulting in higher gain. Thus, the retrieval uncertainty would be ε(ΔτO3C)/ΔτO3C = ε(P1)/(
This discussion shows that the key to achieving precise SLP retrieval is signal integration during DAR operation. For the designed DAR instruments, the integration periods will produce spatial resolutions or effective field-of-views (EFOVs) of 50 km and 4 km for spaceborne and airborne platforms, respectively. The antenna for space systems is assumed to be similar to those onboard CloudSat and GPM with a size of 1–2 m in diameter, while that for airborne DAR systems is 0.3 m in diameter.
In addition to transmitting regular tones for O2 sounding, DAR sensors can also send another 70 GHz chirped tone with longer and increased pulse energy for rain monitoring. The sensitivity of this tone for rain detection should be between regular operational meteorological radar systems at the Ka-band and W-band. If a 3–5 dB reduction in DAR received signals is tolerable, the light rain would be within about 3 mm/h for ∼1 km rain thickness (see Figure 2). Thicker rain layers, such as those 2 km–3 km thick, with about a 1 mm/h rain rate would produce a similar impact. Thus, a threshold of 1 mm/h was used as the cutoff threshold for this analysis. This conservative threshold is also consistent with the OSSE study of Prive et al. (2024) and could result in good retrievals for NWP models as mentioned previously.
One advanced feature in SLP retrieval with designed DAR instruments is its associated microwave radiometer, which operates at the same upper sideband of the O2 absorption complex for temperature profiling. This temperature sounder has a total of eight channels with frequencies from 63.90 to 69.80 GHz. With this temperature profiling capability, the weak temperature dependency of O2 differential absorption will be accounted for and the potential SLP retrieval uncertainty due to temperature uncertainties will be mitigated. Furthermore, this capability will provide atmospheric pressure vertical profile retrieval based on the barometric formula with an anchor of SLP retrieved. This pressure profiling capability will be analyzed in future studies.
Table 1 shows the basic information of the assumed DAR Systems. Since the DAR systems are still in the development stage and supported under the NASA Instrument Incubator Program, detailed specifics of the instruments and flight environments are not available at present, especially for spaceborne systems. Full DAR system descriptions, component/subsystem performances, and hardware simulations will be given in future reports. The simulations of this study focus on SLP retrievals based on the system described in the table.
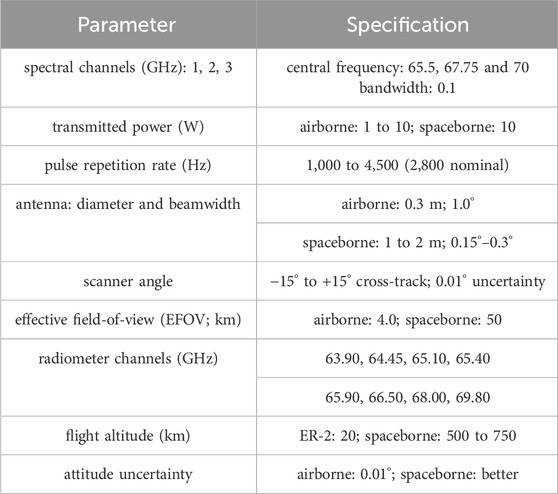
Table 1. Basic information of DAR systems.
The microwave radiative transfer (MWRT) model used for atmospheric absorption and attenuation calculations in current simulations is the same as that of our previous studies for DAR concepts (Lin and Hu, 2005; Lawrence et al., 2012; Lin et al., 2021). This model has been used in various environmental applications like precipitation, clouds, water vapor, and land surface for satellite microwave measurements (Lin and Rossow, 1994; Lin et al., 1997; Lin et al., 1998a; Lin et al., 1998b; Ho et al., 2003; Huang et al., 2005; Min et al., 2010). To maintain sufficient SNR for SLP retrieval, rain rates higher than 1 mm/h were not considered, which avoids excessive microwave scattering and attenuation caused by large precipitating hydrometeors (Lin et al., 1997). Thus, the transmission, absorption, and weak light rain scattering of radar signals within individual atmospheric layers were the major radiative transfer processes for forward model calculations. For the absorption process, this MWRT model carefully accounted for the temperature and pressure dependences of cloud water and atmospheric gas absorptions (Lin et al., 2001). The gas absorption was calculated based on Liebe et al. (1993), except water vapor continuum absorption has been treated separately (Rosenkranz, 1998). For liquid water absorption, the liquid water refractive index model of Turner et al. (2016) was used as it accounted for water absorption across a broad temperature range, especially for conditions below 0°C. The sea surface reflection was obtained with the V-band sea surface reflection model developed by Lin et al. (2023).
During DAR retrieval simulations, environmental data from the Goddard Earth Observing System Model version 5 (GEOS-5) of the NASA Goddard Modeling and Assimilation Office were used. The GEOS-5 model is a weather-and-climate-capable model used for atmospheric analyses, weather forecasts, uncoupled and coupled climate simulations and predictions, and coupled chemistry-climate simulations (Rienecker et al., 2008). The model simulates all necessary meteorological conditions, such as sea surface wind, sea surface temperature (SST), precipitation, and atmospheric temperature, pressure, and humidity (T/p/q) profiles. Key integrated or averaged variables such as CWV, LWP, and rain rate were also obtained. The weather case used in the global spaceborne DAR retrieval simulations was obtained from the GEOS-5 nature run (G5NR; Gelaro et al., 2015). The time of the globally simulated case was 10 July in the second year of G5NR, at 0000Z. The horizontal resolution of this simulated data was 50 km. Vertically, this nature run reported its simulated results at 48 specific pressure levels, reduced from the actual 72 modeling levels, from the surface up to a 0.01 mb level. For retrieval simulations of aircraft ER-2 flights, the horizontal resolution was interpolated to 4 km around the ER-2 flight tracks.
Besides the GEOS-5 simulated global data, climatological profiles from McClatchey et al. (1972) were also used in this study. Previous studies on MWRT modeling and retrieving of atmospheric, oceanic, and land properties had used these profiles extensively (Lin and Rossow, 1997; Lin et al., 1998a; Lin et al., 1998b; Lin and Minnis, 2000; Li et al., 2009; Min et al., 2010). In this study, four specific climatological profiles—the tropics, midlatitude summer, midlatitude winter, and US standard atmosphere of McClatchey et al. (1972)—were used. The tropical and midlatitude winter profiles with surface temperatures about 300 K and 272 K, respectively, may represent the two extreme weather conditions of warm and cold over open oceans. The midlatitude summer profile is commonly used during summer field campaigns, and the US standard atmosphere is more or less a global mean. Generally, these profiles are used in the assessment of retrieval impacts caused by differential absorption residuals of environmental variables other than O2.
The retrieval of partial column dry air pressure or Pdp in Eq. 11 using DAR systems was based on the direct comparison of the O2 DAOD measurement ΔτO3C_measured with the modeled O2 DAOD value ΔτO3C_modelled obtained from the meteorological profile of simulation models like GEOS-5:
SLP, then, is retrieved from the combined dry and moist air pressures (see Eq. 11).
Uncertainty in SLP retrievals using the DAR technique depends on the accuracy of O2 DAOD or attenuation measured. Atmospheric agents (such as water vapor, cloud liquid water, and light rain) other than O2 could affect this attenuation and the retrieval if the residuals in their differential absorptions are not practically eliminated. Furthermore, uncertainty in atmospheric temperature profiles used in forward MWRT calculations could introduce differences in modeled O2 DAOD values, which may propagate to SLP retrievals. This is a reason that DAR systems have temperature-sounding capabilities. Virtually, dry air continuum absorption is an additional factor from the atmosphere. There is less discussion of it in this report, however, as it is very weak and its DAOD is much smaller compared to those of O2 and water vapor. Other factors such as scanning angle uncertainties and numerical errors in MWRT spectral calculations could potentially cause some retrieval errors if they are not well controlled or accounted for. An assessment of these environmental and instrumental issues is needed.
The spectral variability of sea surface reflectance is another important environmental factor that has been discussed extensively in previous studies (Lin et al., 2023). The key conclusion of one of these studies was that the 3-channel approach could significantly reduce the sea surface impact, and retrieval uncertainties caused by sea surface reflection would be negligible (less than 0.01% or 0.1 mb). Thus, no detailed discussion of this factor is given here.
As mentioned in the previous section, there are small uncertainties in an instrument’s attitude. Since the attitude effect (or the cosine of radar viewing angle, μ, in Eq. 5) is directly proportional to DAOD, the relative errors of μ could cause the same amounts of relative errors in DAOD. The goal of controlling the attitude uncertainty would be to make it negligible for SLP retrieval. To analyze the impact of the attitude uncertainties on SLP or DAOD retrievals, Euler rotations (or, equivalently, Tait-Bryan rotations for engineering) are used in the adjustment of the slant viewing (or scanning) angle to nadir. This adjustment is to calculate the vertical component of the DAR viewing vector in the Earth coordinate, which can be obtained by an Euler angle transformation that considers the orientation of the instrument with respect to the inertial measurement unit (IMU) and the rotation order of the IMU. A typical case involves no installation offsets in attitude angles. For this condition, μ is equal to cosβcosγ, where γ and β are roll and pitch angles, respectively. This result shows that when the IMU uncertainty is the same for individual roll and pitch conditions, larger potential errors could occur for larger roll and pitch angles and the nadir view would have higher (about 2°) tolerance for attitude errors. Usually, the pitch angle is small for space platforms and cannot cause significant mechanical errors for SLP retrieval. However, a few degrees of pitch angle off the nadir could introduce a Doppler frequency shift of a few hundred KHz for spaceborne systems. Though the small shift in this case may not produce considerable retrieval errors (see spectral discussions next), changes and/or variations in pitch angle for space applications should be monitored well, and potential spectral errors introduced by Doppler shift should be accounted for when needed. The Doppler shift may not be an issue for airborne systems due to a much slower aircraft speed.
For aircraft such as the ER-2, the pitch angle is generally small (within a few degrees). The roll angle depends usually on the scanning, which can be 15° for the current DAR design. At a roll angle of 15°, potential errors in μ could be about 0.05% or 0.5 mb for 0.1° incidence angle uncertainty, which is significant. However, SLP retrieval errors introduced by currently designed instruments with an incidence uncertainty of 0.01° will be negligible. Current DAR systems may have sufficient attitude knowledge for scanning applications. For space applications, the attitude uncertainty may not produce significant retrieval errors either. Anyway, attitude angle uncertainties need to be considered in system mechanical design for precise DAR observations.
For precise SLP retrieval, spectral characteristics within individual channels need to be accurately accounted for in MWRT model calculations. To achieve the required number of independent samples of surface NRCS, multiple tones are transmitted at each channel using frequency diversity (McLinden et al., 2021). While the overall bandwidth of each channel is only 0.1 GHz and very narrow compared to its center frequency, there is potentially considerable non-linear variation in O2 absorptions within the bandwidth, particularly for Ch.1 (65.5 GHz channel) as seen in Figure 1. Calculation of column absorption optical depths of O2 and total gases using only center frequencies for the climatological profiles of tropics, midlatitude summer, midlatitude winter, and US standard atmosphere of McClatchey et al. (1972) results in errors that must be accounted for. This is particularly the case for Ch.1 where the error of assuming only the center frequency is close to 0.1%, compared to those calculated from entire spectra within the bandwidths. The DAOD errors for the 3-channel approach could be even greater than 0.1%, which clearly demonstrates that center frequency only is not sufficient in O2 and total gas MWRT calculations. Tests of radiative transfer calculation for the four atmospheric profiles suggest that five frequency points with each one at the quarter position of spectral bandwidth would provide good results and reduce the calculation error to a negligible level for individual channels, channel pairs, and the 3-channel approach. For other atmospheric agents such as water vapor, cloud water, and light rain absorption and attenuation, calculations using only the center frequency give very good results with errors of less than 0.01% due to the quasi-linearity of absorption with frequency in the selected narrow band for these agents. Hereafter, this study uses the five spectral point approach in MWRT calculations for O2 and total gases except for only center frequency for other atmospheric agents.
Another spectral characteristic that needs to be accounted for is spectral stability. During typical radar system operation, the potential drifting of channel frequencies is one of the key considerations in instrument design. The drifting issue is particularly important for DAR systems where differential absorptions of atmospheric agents such as O2 depend on the channel frequencies actually used. Accurate knowledge of the channel frequencies is required.
As discussed previously, the sensitivity of O2 absorption OD values on frequency variations varies largely at the considered DAR V-band, partially around O2 absorption line centers. Figure 3 plots the relative OD change per MHz frequency drift for radar signals that have a 100 MHz bandwidth as a considered system (see Table 1). The solid and dashed curves are for climatological profiles of midlatitude winter and tropics, respectively. The stars show the channels of the current DAR instrument. For current DAR channels, OD changes are non-negligible for 1 MHz spectral drift. The potential error of channel 1 is the biggest and could reach about 0.09%. To limit the retrieval error caused by spectral uncertainties, the current DAR design targets a frequency stability of less than 0.1 MHz for short-term variations and 0.01 MHz for long-term drifting with temperature control. This means that the DAR spectral stability will be at least one magnitude smaller than those for 1 MHz frequency changes shown in the figure, which will satisfy SLP retrieval objectives in spectral characterization.
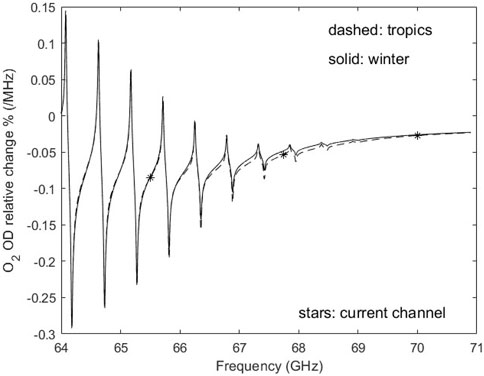
Figure 3. Sensitivity of O2 absorption OD values on frequency variations. Plotted is the relative OD change of 1 MHz frequency drift for radar signals with 100 MHz bandwidth at considered DAR V-band. The solid and dashed curves are for climatological profiles of midlatitude winter and tropics, respectively. The stars show the channels of current DAR instrument.
Atmospheric water, including water vapor, cloud liquid water, and precipitation-sized hydrometeors of light rain, is among the most important environmental factors that potentially affect O2 differential absorption measurements for SLP retrieval.
The selection of DAR channels purposely in a narrow spectral band with evenly spaced frequencies may have great potential to remove the impacts of atmospheric water on O2 DAOD due to the quasi-linear variability of its absorption and extinction with frequency as qualitatively explained in previous sections (Figures 1, 2 and their related discussions). A quantitative study is provided here. Since the extinction and/or attenuation of light rain at the selected DAR wavelengths is dominantly decided by absorption, the effect of light rain on O2 DAOD can be estimated from the absorption of rainwater as that of cloud water (Eq. 9b and its related discussions). So, cloud water and rainwater are combined, and their absorption impacts are assessed with cloud liquid water. It is emphasized that the actual effect of clouds and light rain is not limited to their DAOD residuals on O2 DAOD measurements but also DAR signal attenuations and atmospheric moisture. For example, 1 mm/h light rain with 2 km thickness would have an OD of about 0.4, which would produce about 3.5 dB extra attenuation in DAR power returns on top of regular O2 and other atmospheric attenuation. This could reduce the SNR of the returns and significantly affect the accuracy of SLP retrieval. Thus, for DAR SLP retrieval products, 1 mm/h or higher rain rates should be removed and the retrievals for other light rain rates should be flagged. Similarly, cases with a sea surface wind speed higher than 15 m/s are not considered. The calculations in this study are mainly for the assessment of the relative effects of DAOD values of water vapor and cloud liquid water on O2 DAOD measurements for SLP retrievals. Note that for rainwater mass impact on pressure retrieval, this rain rate threshold also limits the pressure error considerably due to small rainwater mass (ref., discussions on Eq. 11; Figure 2).
Figure 4 shows the relative errors of O2 DAOD caused by DAOD residuals of (a) atmospheric water vapor and (b) cloud liquid water in the DAR DAOD estimates (see Eqs 5, 14). The water vapor impact is calculated for the four climatological profiles mentioned previously (Figure 4A). As expected, tropical weather conditions would cause larger O2 DOAD errors due to high vapor content compared to colder winter weather situations. For channels 1 and 2, water vapor DAOD could introduce about −0.5% residual compared to O2 DAOD in a differential absorption estimation (corresponding to approximately −5 mb). The negative sign means that the vapor DAOD decreases with decreasing frequencies while that for O2 is the opposite (see Figure 1). For other climatological conditions, the relative errors could be still considerable (about a few 10ths of a percent). Thus, when this pair of two channels is directly used to retrieve SLP, the water vapor DAOD has to be compensated by modeling its value from either measured or simulated meteorological profiles with humidity observations. Channels 2 and 3 have very large relative errors because the O2 DAOD of the pair is small. The reason for plotting the results of this pair is to demonstrate that this pair (or channel 3) is not used for retrieving O2 amounts directly but is instead used for the removal of environmental contributions including water vapor, cloud water, rain, sea surface, etc. on O2 DAOD. The results of the 3-channel approach exactly exhibit this effect. Errors of all four climatological profiles from the 3-channel approach are reduced to within a few ten thousandths—about 0.023% and 0.011% for the tropical and winter profiles, respectively, which is below the preferable level (0.05%). Besides the DAOD impact, errors in column water vapor are also an error source in moisture air pressure estimation and then, SLP retrieval (ref. Eq. 11). However, the uncertainties in water vapor amount over oceans are small and cannot produce significant SLP retrieval error as mentioned previously.
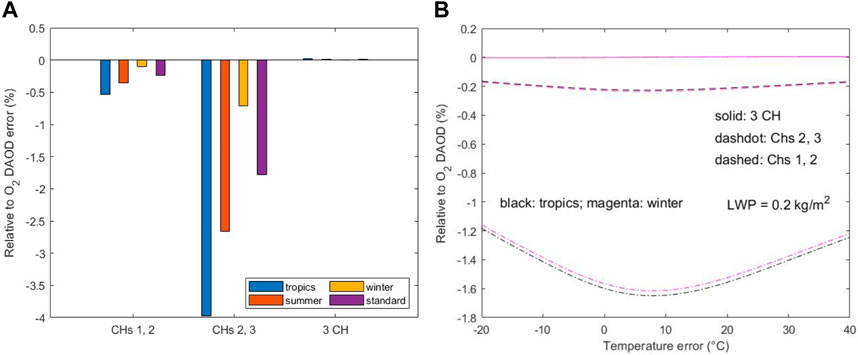
Figure 4. Impacts of atmospheric water on O2 DAOD. (A) Error of uncorrected atmospheric water vapor for channel pairs 1&2 and 2&3 and the 3-channel algorithm. (B) Error of cloud liquid water in the DAR DAOD estimate for the two channel pairs and the 3-channel algorithm.
The impact of cloud liquid water DAOD on O2 DAOD (Figure 4B) is estimated for a cloud with 0.2 kg/m2 LWP, which is very thick for non-precipitating clouds. Different cloud temperatures in the tropical (black curves) and midlatitude winter (magenta curves) profiles are considered because of certain variations of cloud water absorption with temperature at studied wavelengths. The channel 1 and 2 pair (the two very close dashed curves) could produce about −0.2% uncertainties in O2 DAOD estimates if the cloud water impact on DAR return attenuation was not removed, which is significant for SLP retrieval. For similar reasons to water vapor, cloud liquid water DAOD for the channel 2 and 3 pair (dashdot curves) could cause large relative uncertainties in O2 DAOD estimation. However, this cloud DAOD residual is used directly to cancel the cloud water DAOD of the channel 1 and 2 pair in the 3-channel approach (solid lines). Thus, the impact of cloud DAOD for the approach is negligible, resulting in an overlap of the relative errors of the two climatological profiles plotted in the figure. Although cloud DAOD may not have a substantial influence on SLP retrieval, the attenuation of cloud water and rainwater could reduce radar SNR significantly (ref., Figure 2). For example, with 0.5 kg/m2 cloud LWP, DAR returns would experience an extra more than 2 dB attenuation compared to clear or regular cloudy conditions. Furthermore, at this LWP, light rain is likely (Lin and Rossow, 1994), which would introduce even higher attenuation as discussed previously. Thus, the light rain screen and flag of high cloud LWP are required during retrieval data processing.
Atmospheric temperature is crucial priori information needed for forward MWRT calculations similar to estimating modeled O2 optical depth for retrievals. Errors in temperature profiles could potentially produce non-negligible errors in retrievals due to the dependence of the O2 absorption cross-section on temperature. This is one of the key reasons that temperature-sounding capability has been implemented in the current DAR instrument design and would be beneficial for a spaceborne instrument (ref. Table 1). This study focuses on the impact of temperature bias on O2 DAOD calculations. The influence of random errors in temperature profiles could be reduced by vertical and horizontal averages of both the temperature and the calculated O2 absorption cross-section profiles.
Figure 5 illustrates the temperature impact on O2 DAOD estimates, including (a) normalized weighting function, (b) relative sensitivity of the weighting function for 1K temperature increases in vertical profiles, and (c) O2 DAOD changes on temperature errors. The first two panels provide basic characteristics of O2 absorption with meteorological conditions, and the last one gives a quantitative estimate of potential O2 DAOD errors introduced by temperature bias. Two extreme climatological conditions of tropical and midlatitude winter profiles are analyzed. As expected, the lower atmosphere weighs significantly more in O2 differential absorption compared to the upper atmosphere, providing a strong ability in surface air pressure retrieval (Figure 5A). The weighting functions of the high-frequency channel pair (dashdot curves) more or less linearly increase with pressure, while those of the low-frequency channel pair (dashed curves) show a certain non-linear effect. The lowest frequency channel is within the wings of strong O2 absorption lines (ref. Figure 1), and its absorption cross-section could be affected by line broadening depending on atmospheric states. This non-linear feature of the low-frequency channel pair propagates to the 3-channel approach (solid curves). Although the differential absorption cross-sections of this approach are strongly affected by those of low-frequency channel pair, they are the combined results of the two pairs and, thus, have the largest deviation from linearity among the three. This also yields the highest weighting function sensitivity of the 3-channel approach on temperature.
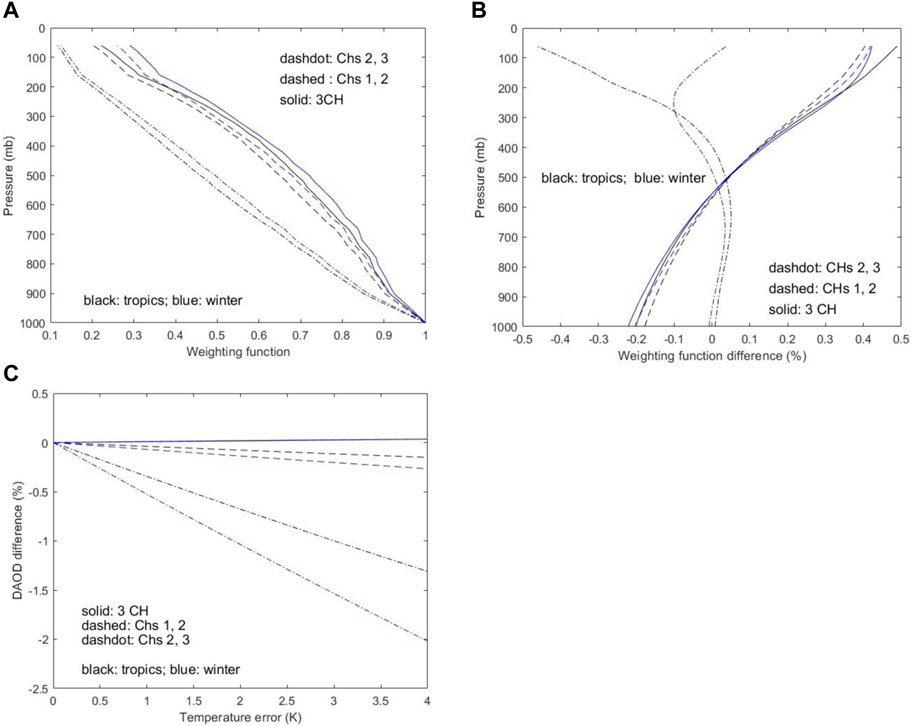
Figure 5. Illustration of the temperature impact on O2 DAOD estimates. The three panels are: (A) normalized weighting function, (B) relative sensitivity of the weighting function for 1 K temperature increases in vertical profiles, and (C) O2 DAOD changes on temperature errors, calculated from tropical and midlatitude winter profiles as indicated in each panel. The legends also list the results for different channel pairs and the 3-channel approach with different color and/or curve styles.
Figure 5B shows the relative weighting function change or the sensitivity of the 3-channel approach (solid curves with black for tropics and blue for midlatitude winter), along with those from the two pairs, on 1 K temperature bias. The weighting function of this approach generally has a consistent temperature influence for various meteorological conditions as seen from the closeness of tropical (black curves) and winter (blue curves) results, particularly within the middle atmosphere. This is basically inherited from that of the channel 1 and 2 pair (dashed curves). The separation of tropical and winter profiles in the upper atmosphere is caused by the large relative change in the channel 2 and 3 pair (dashdot curves). For upper layers, the weighting function of this approach could change by as much as close to 0.5%, and at lower layers, a change of −0.2% would be possible. The opposite sign in the sensitivity of these weighting functions on potential temperature bias errors creates certain error cancellations on the vertically integrated weights and DAOD values. This character can also be seen in the other two pairs, except the direction of the change for the high-frequency channel pair is switched. This error cancellation benefits differential absorption measurements of O2 DAR. The switched direction on the temperature sensitivity of the two pairs makes the 3-channel approach have slightly higher temperature sensitivity than the channel 1 and 2 pair, though the differences are small, as mentioned previously, due to the very small differential absorption of the pair of channels 2 and 3.
Figure 5C shows the relative errors of O2 DAOD caused by temperature bias errors for the two pairs and the 3-channel approach. The maximum temperature bias considered is 4 K, which is very large for a marine environment. SST errors are generally very small. For infrared and microwave observations, SST uncertainty is within 0.5 K (Emery et al., 2001; Chelton and Wentz, 2005; Gentemann et al., 2010). With certain averages, the error could be even smaller. These SST observations are key inputs for numerical weather prediction and climate models that well control SST error within 0.3 K (Minnett et al., 2019). Thus, atmospheric temperature profiles simulated from models such as GEOS-5 over open oceans would not have large errors as they are anchored to accurate SSTs. The relative errors for the 3-channel approach (solid lines) for different climatological profiles are very close and overlap each other. For 4 K temperature error, the maximum DAOD errors would be within about 0.035%, which is within the preferable level. Furthermore, the synergy of assimilated model meteorological profiles with DAR temperature-sounding results will further mitigate the impact of temperature errors on SLP retrieval. This analysis indicates that the impact of temperature uncertainty can be controlled within a negligible level. To illustrate the advantage of the 3-channel approach, the relative DAOD errors introduced by temperature bias for the DAOD values of the two pairs are also plotted in the figure. The relative errors of the channel 2 and 3 pair (dashdot curves) could be large (about absolute 2.0%) because of their small DAOD values, while those of the channel 1 and 2 pair (dashed curves) are significantly larger than for the 3-channel approach, though considerably smaller than those of the channel 2 and 3 pair, because of a similar weighting function but less cancellation. Winter cases have larger temperature sensitivity than tropical cases due to the relatively larger temperature errors for the same temperature biases under low winter temperatures. These errors can be reduced by the temperature synergy as well, strongly supporting the temperature-sounding capability of DAR systems.
The simulation of retrieval techniques uses the GEOS-5 global simulated weather data of 10 July in the second year of G5NR, at 0000Z. Figure 6 shows the basic meteorological condition. This is a northern hemispheric summer case where the intertropical convergence zone (ITCZ) was located slightly north of the equator as shown in the plots of sea surface or cloud top temperature (Figure 6A) and cloud cover (Figure 6B). There are some indications of the South Pacific convergence zone (SPCZ) located southeast of Papua New Guinea as seen from cloud cover, cloud LWP (Figure 6C), and rain (Figure 6D) plots. Generally, the northern Atlantic and Pacific oceans were quiet with dominantly clear skies and warm clouds. Clouds with high LWP values occurred mainly at higher latitudes associated with rains, where cloud cover was also significantly higher. Southern oceans, however, were very active. Several planetary waves can be seen from cold cloud top temperatures, high cloud cover, high LWP values, and high rainfall rates in frontal systems. These global meteorological features were also obviously reflected on sea surface pressure fields (Figure 7). Generally, small SLP gradients are found over tropical and mid-latitude summer oceans. High-pressure gradients occurred mainly in southern oceans and high latitudes, where significant observational gaps, particularly for surface air pressure fields, exist. The lowest SLP is found in Southern Ocean troughs with values slightly lower than 960 mb.
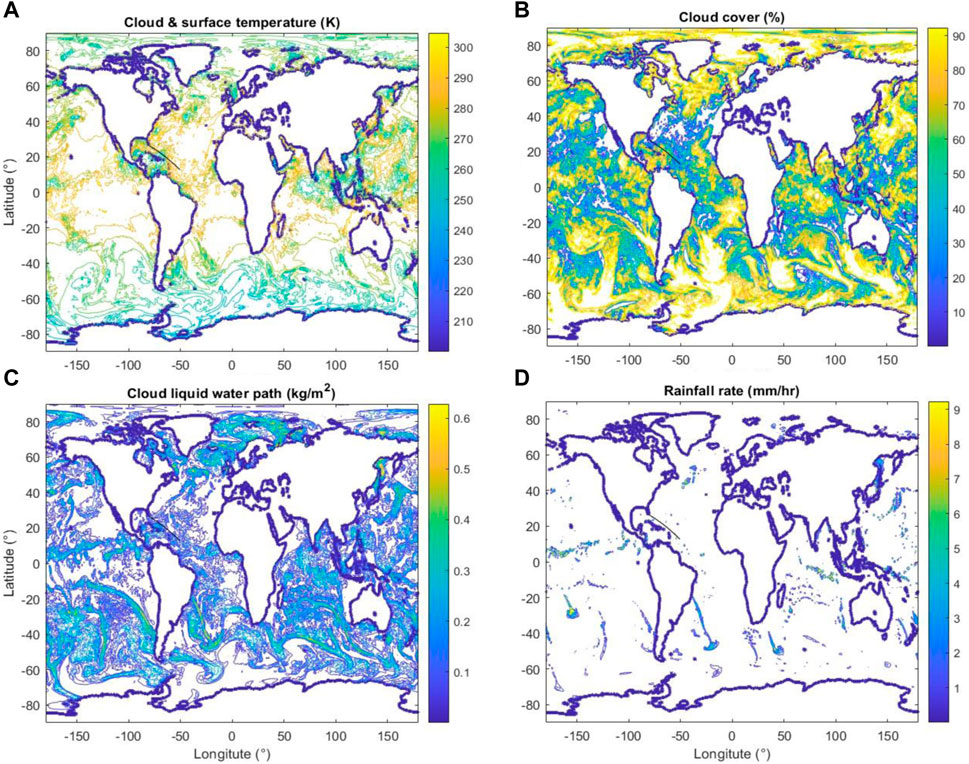
Figure 6. The basic meteorological conditions of the GEOS-5 case on 10 July in the second year of G5NR. The panels of (A–D) are for global sea surface or cloud top temperature, cloud cover, cloud LWP, and rain rate, respectively. The line from Florida to tropical Atlantic Ocean east of Caribbean Sea in each panel is the assumed ER-2 flight track for airborne system retrieval simulation. The units for individual panels are given in their titles.
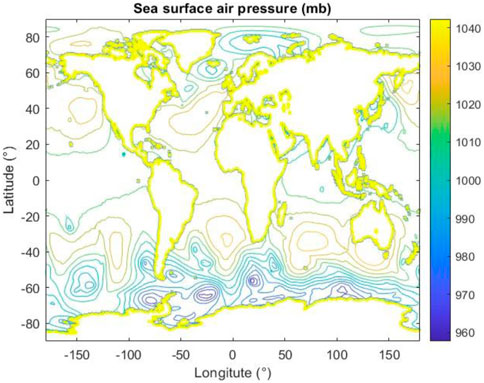
Figure 7. GEOS-5 simulated sea surface pressure fields for the case of 10 July in the second year of G5NR.
The retrieval simulation starts using a rainfall screen over oceans for the GEOS-5 data discussed previously. All GEOS-5 data points (or EFOVs) with ≥1 mm/h rains or sea surface wind speeds above 15 m/s are flagged without retrieval. Also, cases with any light rain rates and LWP ≥0.4 kg/m2 are flagged with warnings. For retrieval points, the attenuation of atmospheric agents on DAR transmitted powers is calculated using the MWRT model. Sea surface reflection is considered for received radar powers. Then, random noise is added to the received radar signals based on two typical scenarios as discussed: 1) two weak signal channels and 2) the same relative standard errors for all three channels. After obtaining these simulated DAR returns, the simulated measurements of O2 DAOD for the 3-channel approach are calculated based on the grand ratio (ref., Eqs 12–14).
To simulate modeled O2 DAOD, basic knowledge of meteorological state variables at individual measurement points is assumed to be available. These state variables are sea surface temperature, sea surface wind speed, column water vapor, and cloud liquid water path, which all can be well measured from satellite observations. Random errors associated with these variables are added with assigned standard errors of 0.3 K, 0.8 m/s, 2.0 kg/m2, and 0.05 kg/m2, respectively, which are conservative compared to current observational errors (Mears et al., 2015). Using these priori state variables, a GEOS-5 profile around the measurement point that has the closest meteorological state to the assumed priori meteorological state is selected as the simulated profile during the DAR operation, and the modeled O2 DAOD for the 3-channel approach is calculated. Finally, a comparison between the “measured” and “modeled” O2 DAOD values for the approach is made and SLP is retrieved (ref. Eq. 17). Satellite retrievals are simulated globally for the two scenarios mentioned above. Besides space flight simulations, this study also simulated an ER-2 flight with the scenario of two weak signal channels. The flight track (see the black lines in individual panels of Figure 6) is about 3500 km one way, and the flight could take about 10 h from Florida, United States to the tropical Atlantic Ocean east of the Caribbean Sea and back. For this ER-2 flight, all meteorological profiles along and cross tracks are interpolated from the original 50 km spatial resolution to the 4 km resolution of airborne EFOV.
SLP retrievals are closely related to “true” SLP values for both spaceborne global scenarios (Figures 8A, B) and airborne ER-2 flight case (Figure 8C). The standard error for the global scenario of two weak signal channels (Figure 8A) is about 1.52 mb, much smaller than that (2.68 mb) of the same relative standard errors for all channels (Figure 8B). The ratio of these two retrieval standard errors is about 1.76, which is consistent with the analytic solution of
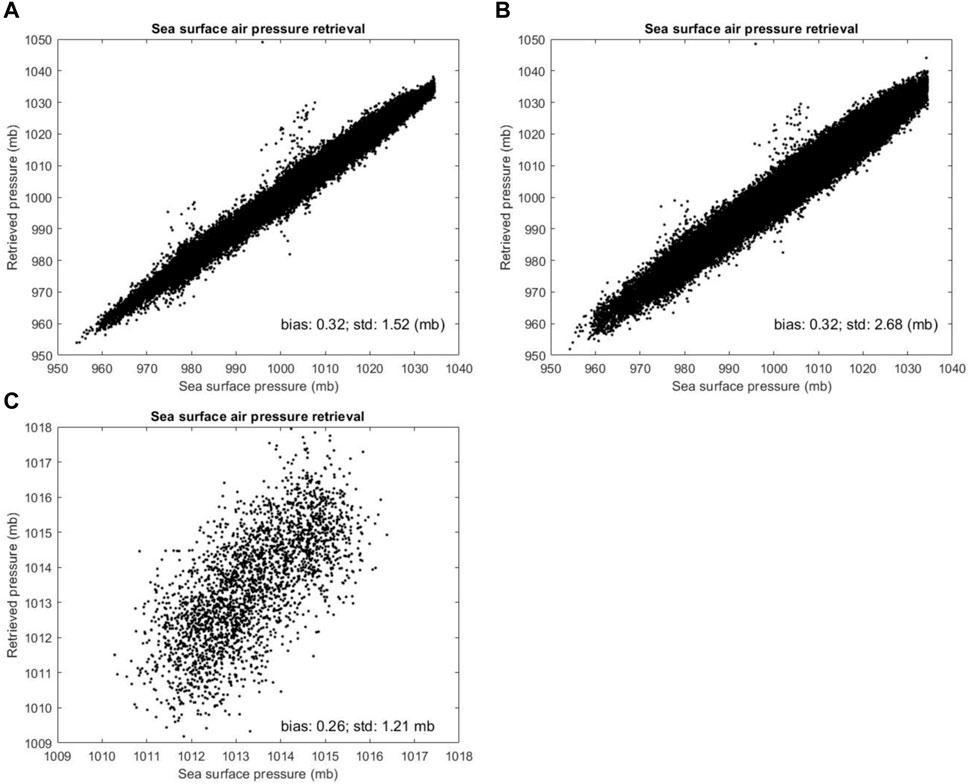
Figure 8. Comparison of the original GEOS-5 sea level pressures with the simulated retrievals of O2 differential absorption radar measurements. Panel (A) is for the global scenario of two weak signal channels, and Panel (B) is for the global scenario of same standard errors for all channels. Panel (C) is for the ER-2 flight.
Figure 9 shows the retrieved global SLP fields for (a) the two weak signal channels and (b) the same error scenarios. Both look like the true SLP fields (Figure 7), except the results for the scenario of two weak signal channels are smoother. The roughness along the contour lines reflects the uncertainties associated with retrievals. The key features of low-pressure gradients over the tropics and midlatitude summer oceans, planetary waves over Southern Oceans, and some storms in the north were all retrieved well, showing the potential global SLP retrieval capability of DAR systems.
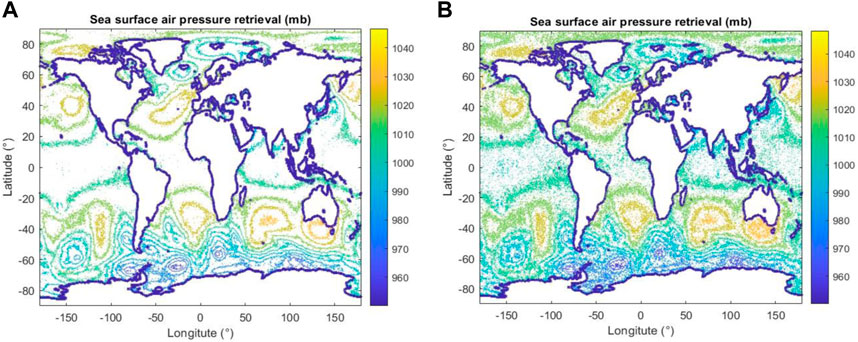
Figure 9. Contour plots of the retrieved global sea level pressure fields for scenarios of (A) the two weak signal channels and (B) the same standard errors for all channels.
This study emphasizes the analysis and simulation of potential impacts of instrumental and environmental uncertainties on sea level pressure retrievals using O2 differential absorption radar operating at V-band. A northern hemispheric summer case simulated by the GEOS-5 model is used for global retrieval simulations. The radar channels are selected at the upper wings of the V-band O2 absorption complex with three spectrally even-spaced frequencies. To avoid extra attenuation and low SNR compared to normal non-precipitating and light rain cases, radar data measured under weather conditions of a rain rate ≥1 mm/h are not included in retrieval. Precise knowledge of instrument attitude, including radar scanning, in our current design would result in negligible uncertainties for retrieval caused by mechanical uncertainties. Generally, a Doppler shift caused by instrument attitude would introduce negligible spectral errors. The 3-channel approach effectively mitigates all major atmospheric and sea surface influences on SLP retrieval. Retrieval errors introduced by water vapor on an O2 differential absorption optical depth could be reduced to about 0.025%, well within 0.05% (or 0.5 mb) the preferable level for the approach. Cloud impact on O2 differential absorption optical depth is generally negligible for the 3-channel approach. However, thick clouds and light rain would introduce extra attenuation of radar power returns and could significantly reduce radar SNR for measurements. Furthermore, environmental temperature is another factor affecting retrieval. For the 3-channel approach, the retrieval error could be about 0.035% for a 4 K temperature bias error across the entire vertical temperature profile. Even with this large temperature bias error, retrieval errors would still be small, though meaningful, and within the preferable level. To reduce this temperature impact on pressure retrieval, O2 differential absorption radar systems have included a temperature sounder at the same V-band, which could further mitigate the uncertainty of temperature on air pressure retrieval.
The major uncertainty for sea surface air pressure retrieval is the noise of radar power returns. Different averaging and operational modes could result in a range of uncertainties in the pressure retrievals. For the typical operation scenarios of two weak signal channels and the same errors for all channels, the retrieval errors are understandably small, particularly for the former with a standard error of about 1.52 mb. Additionally, major global meteorological characteristics such as planetary waves, low-pressure gradients over warm tropical oceans, Southern Ocean frontal systems, northern hemispheric summer storms, and weather characters in Artic Ocean and other polar areas could be well observed from the retrieval of the O2 differential absorption radar. This study further demonstrates the feasibility of O2 differential absorption radar systems for global sea surface pressure observations with errors ∼1-2 mb, which is urgently needed for the improvement of numerical weather prediction models. Long-term observations of sea surface air pressure will also improve climate predictions.
It is anticipated that in the next few years, an O2 differential absorption radar system will be made available for meteorological science applications. This study prepares for the DAR SLP retrievals. Future work will emphasize on detailed analysis of actual radar system performance and retrieval of sea surface pressure based on data from radar field flight campaigns. Additional assessment of this O2 differential absorption radar concept for sea surface pressure observations, especially for space applications, will be conducted. Future sea level pressure observations from single wide swath scanners or multiple nadir viewing systems of spaceborne O2 differential absorption radars will significantly improve weather forecasts, especially for severe storms, for numerical weather prediction models.
The original contributions presented in the study are included in the article/Supplementary Material, further inquiries can be directed to the corresponding author.
BL: Conceptualization, Formal Analysis, Methodology, Writing–original draft, Writing–review and editing. MM: Conceptualization, Investigation, Writing–review and editing. XC: Software, Writing–review and editing. GH: Investigation, Writing–review and editing, NP: Data curation, Investigation, Writing–review and editing. SH: Investigation, Writing–review and editing. LL: Formal Analysis, Investigation, Writing–review and editing.
The author(s) declare that financial support was received for the research, authorship, and/or publication of this article. All efforts of this study were supported by NASA Earth Science Technology Office (ESTO) Instrument Incubator Program (IIP) for the Microwave Barometric Radar and Sounder (MBARS) project.
The authors would like to thank the Instrument Incubator Program of the NASA Earth Science Technology Office for its financial support of this study. The management of NASA Langley Research Center and Goddard Space Flight Center have provided valuable manpower for this research.
The authors declare that the research was conducted in the absence of any commercial or financial relationships that could be construed as a potential conflict of interest.
The author(s) declared that they were an editorial board member of Frontiers, at the time of submission. This had no impact on the peer review process and the final decision.
All claims expressed in this article are solely those of the authors and do not necessarily represent those of their affiliated organizations, or those of the publisher, the editors and the reviewers. Any product that may be evaluated in this article, or claim that may be made by its manufacturer, is not guaranteed or endorsed by the publisher.
Barker, D., Huang, W., Guo, Y.-R., Bourgeois, A., and Xiao, Q. (2004). A three-dimensional variational data assimilation system for MM5: implementation and initial results. Mon. Wea. Rev. 132, 897–914. doi:10.1175/1520-0493(2004)132<0897:atvdas>2.0.co;2
Barker, D. M., Huang, W., Guo, Y.-R., and Bourgeois, A. (2003). A three-dimensional variational (3DVAR) data assimilation system for use with MM5. NCAR Tech. Note, NCAR/TN- 453+STR, 68.
Breon, F., and Henriot, N. (2006). Spaceborne observations of ocean glint reflectance and modeling of wave slope distributions. J. Geophys. Res. 111, C06005. doi:10.1029/2005JC003343
Camargo, S., Robertson, A., Gaffney, S., Smyth, P., and Ghil, M. (2007). Cluster analysis of typhoon tracks. Part II: large-scale circulation and ENSO. J. Clim. 20, 3654–3676. doi:10.1175/jcli4203.1
Campbell, J. F., Lin, B., Dobler, J., Pal, S., Davis, K., Obland, M. D., et al. (2020). Field evaluation of column CO2 retrievals from intensity-modulated continuous-wave differential absorption lidar measurements during the ACT-America campaign. Earth Space Sci. 7, e2019EA000847. doi:10.1029/2019EA000847
Centurion, L., Horányi, A., Cardinali, C., Charpentier, E., and Lumpkin, R. (2017). A global ocean observing system for measuring sea level atmospheric pressure: effects and impacts on numerical weather prediction. Bull. Amer. Met. Soc. 98, 231–238. doi:10.1175/BAMS-D-15-00080.1
Chelton, D., and Wentz, F. (2005). Global microwave satellite observations of sea surface temperature for numerical weather prediction and climate research. Bull. Amer. Met. Soc. 86, 1097–1116. doi:10.1175/bams-86-8-1097
Contreras, R. F., and Plant, W. J. (2006). Surface effect of rain on microwave backscatter from the ocean: measurements and modeling. J. Geophys. Res. 111, C08019. doi:10.1029/2005JC003356
Cox, C., and Munk, W. (1954). Statistics of the sea surface derived from sun glitter. J. Mar. Res. 13, 198–227.
Cox, C., and Munk, W. (1956). “Slopes of the sea surface deducted from photographs of sun glitter,” in Bull. Scripps insti. Of oceanography. Editors C. E. ZoBell, R. A. Arthur, and D. L. Fox (University of California Press), Vol. 6, 401–488. No. 9.
Dirren, S., Torn, R., and Hakim, G. (2007). A data assimilation case study using a limited-area ensemble Kalman filter. Mon. Wea. Rev. 135, 1455–1473. doi:10.1175/MWR3358.1
Donelan, M. A., and Pierson, W. (1987). Radar scattering and equilibrium ranges in wind-generated waves with application to scatterometry. J. Geophys. Res. 92, 4971–5029. doi:10.1029/JC092ic05p04971
Ehret, G., Kiemle, C., Wirth, M., Amediek, A., Fix, A., and Houweling, S. (2008). Satellite-borne remote sensing of CO2, CH4, and N2O by integrated path differential absorption lidar: a sensitivity analysis. Appl. Phys. B 90, 593–608. doi:10.1007/s00340-007-2892-3
Emery, W., Castro, S., Wick, G., Schluessel, P., and Donlon, C. (2001). Estimating sea surface temperature from infrared satellite and in situ temperature data. Bull. Amer. Met. Soc. 82, 2773–2785. doi:10.1175/1520-0477(2001)082<2773:esstfi>2.3.co;2
Foti, G., Gommenginger, C., Jales, P., Unwin, M., Shaw, A., Robertson, C., et al. (2015). Spaceborne GNSS reflectometry for ocean winds: first results from the UK Tech Demo Sat-1 mission. Geophys. Res. Lett. 42, 5435–5441. doi:10.1002/2015GL064204
Gelaro, R., Putman, W., Pawson, S., et al. (2015). Evaluation of the 7-km GEOS-5 nature run. NASA/TM-2014-104606, 36. NASA Technical Report Series on Global Modeling and Data Assimilation, 305. Available at: https://ntrs.nasa.gov/api/citations/20150011486/downloads/20150011486.pdf.
Gentemann, C., Meissner, T., and Wentz, F. (2010). Accuracy of satellite sea surface temperatures at 7 and 11 GHz. IEEE Trans. Geosci. Rem. Sens. 48, 1009–1018. doi:10.1109/tgrs.2009.2030322
Haiden, T., Dahoui, M., Ingleby, B., de Rosnay, P., Prates, C., Kuscu, E., et al. (2018). Use of in situ surface observations at ECMWF. European Centre for Medium Range Weather Forecasts. Technical Memorandum, 834.
Ho, S.-P., Lin, B., Minnis, P., and Fan, T.-F. (2003). Estimates of cloud vertical structure and water amount over tropical oceans using VIRS and TMI data. J. Geophys. Res. 108 (D14), 4419. doi:10.1029/2002JD003298
Holton, J. R. (1979). An introduction to dynamic meteorology. Second Edition. New York: Academic Press, 416.
Horanyi, A., Cardinali, C., and Centurioni, L. (2017). The global numerical weather prediction impact of mean-sea-level pressure observations from drifting buoys. J. Roy. Meteor. Soc. 143, 974–985. doi:10.1002/qj.2981
Hossan, A., and Jones, W. L. (2021). Ku- and ka-band ocean surface radar backscatter model functions at low-incidence angles using full-swath GPM DPR data. Remote Sens. 13, 1569. doi:10.3390/rs13081569
Huang, J., Minnis, P., Lin, B., Yi, Y., Khaiyer, M. M., Arduini, R. F., et al. (2005). Advanced retrievals of multilayered cloud properties using multi-spectral measurements. J. Geophys. Res. 110, D15S18. doi:10.1029/2004JD005101
Ingleby, B. (2010). Factors affecting ship and buoy data quality: a data assimilation perspective. J. Atmos. Ocean. Technol. 27, 1476–1489. doi:10.1175/2010JTECHA1421.1
Ingleby, B., and Isaksen, L. (2018). Drifting buoy pressures: impact on NWP. Atmos. Sci. Lett. 19, e822. doi:10.1002/asl.822
Joss, J., and Waldvogel, A. (1969). Raindrop size distribution and sampling size errors. J. Atmos. Sci. 26, 566–569. doi:10.1175/1520-0469(1969)026<0566:rsdass>2.0.co;2
Karaev, V., Panfilova, M., Titchenko, Y., Meshkov, E., Balandina, G., Kuznetsov, Y., et al. (2015). Russian scatterometer: discussion of the concept and the numerical simulation of wind field retrieval. Intern. J. Rem. Sens. 36, 6056–6084. doi:10.1080/01431161.2015.1110637
Kent, E. C., and Berry, D. I. (2005). Quantifying random measurement errors in voluntary observing ships meteorological observations. Int. J. Climatol. 25, 843–856. doi:10.1002/joc.1167
Lawrence, R., Lin, B., Harrah, S., Hu, Y., Hunt, P., and Lipp, C. (2011). Initial flight test results of differential absorption barometric radar for remote sensing of sea surface air pressure. JQSRT 112, 247–253. doi:10.1016/j.jqsrt.2010.06.001
Lawrence, R., Lin, B., Harrah, S., and Min, Q. (2012). Differential absorption microwave radar measurements for remote sensing of barometric pressure. Remote Sensing - Advanced Techniques and Platforms. Edited by Boris Escalante, InTech.
Li, L., Heymsfield, G. M., Tian, L., and Racette, P. E. (2005). Measurements of ocean surface backscattering using an airborne 94-GHz cloud radar - implication for calibration of airborne and spaceborne W-band radars. J. Atmos. Ocean. Tech. 22, 1033–1045. doi:10.1175/jtech1722.1
Li, R., Min, Q., and Lin, B. (2009). Estimation of evapotranspiration in a mid-latitude forest using the microwave emissivity difference vegetation index (EDVI). Remote Sens. Environ. 113, 2011–2018. doi:10.1016/j.rse.2009.05.007
Liebe, H. J., Hufford, G. H., and Cotton, M. G. (1993). Propagation modeling of moist air and suspended water/ice particles at frequencies below 1000 GHz. Atmospheric propagation effects through natural and man-made obscurants for visible MM-wave radiation. AGARD. Conf. Proc. AGARD-CP-542, NATO, 3-1–3-11.
Lin, B., and Hu, Y. (2005). Numerical simulations of radar surface air pressure measurements at O2 bands. Geosci. Rem. Sens. Lett. 2, 324–328.
Lin, B., Hu, Y., and Min, Q. (2021). Assessing surface air pressure sensing using high frequency O2-absorption radar system. JQSRT 261, 107425. doi:10.1016/j.jqsrt.2020.107425
Lin, B., Katzberg, S., Garrison, J., and Wielicki, B. (1999). Relationship between GPS signals reflected from sea surfaces and surface winds: modeling results and comparisons with aircraft measurements. J. Geophys. Res.-Oceans 104, 20713–20727. doi:10.1029/1999jc900176
Lin, B., and Liu, Z. (2021). Martian atmospheric CO2 and pressure profiling with differential absorption lidar: system consideration and simulation results. Earth Space Sci. 8, e2020EA001600. doi:10.1029/2020EA001600
Lin, B., Mclinden, M., Heymsfield, G., Hu, Y., Privé, N., Li, L., et al. (2023). Simulations of sea surface reflection for V-band O2 differential absorption radar barometry. Front. Remote Sens. 4, 1105627. doi:10.3389/frsen.2023.1105627
Lin, B., and Min, Q. (2017). Optimal frequency selection of multi-channel O2-band differential absorption barometric radar for air pressure measurements. JQSRT 188, 188–191. doi:10.1016/j.jqsrt.2016.06.019
Lin, B., and Minnis, P. (2000). Temporal variations of land surface microwave emissivities over the atmospheric radiation measurement Program southern great plains site. J. App. Meteor. 39, 1103–1116. doi:10.1175/1520-0450(2000)039<1103:tvolsm>2.0.co;2
Lin, B., Minnis, P., Fan, A., Curry, J., and Gerber, H. (2001). Comparison of cloud liquid water paths derived from in situ and microwave radiometer data taken during the SHEBA/FIREACE. Geophys. Res. Lett. 28, 975–978. doi:10.1029/2000gl012386
Lin, B., Minnis, P., Wielicki, B., Doelling, D. R., Palikonda, R., Young, D., et al. (1998b). Estimation of water cloud properties from satellite microwave, infrared and visible measurements in oceanic environments: 2. Results. J. Geophys. Res. 103, 3887–3905. doi:10.1029/97jd02817
Lin, B., and Rossow, W. B. (1994). Observations of cloud liquid water path over oceans: optical and microwave remote sensing methods. J. Geophys. Res. 99, 20907–20927.
Lin, B., and Rossow, W. B. (1996). Seasonal variation of liquid and ice water path in non-precipitating clouds over oceans. J. Clim. 9, 2890–2902. doi:10.1175/1520-0442(1996)009<2890:svolai>2.0.co;2
Lin, B., and Rossow, W. B. (1997). Precipitation water path and rainfall rate estimates over oceans using special sensor microwave imager and International Satellite Cloud Climatology Project data. J. Geophys. Res. 102, 9359–9374. doi:10.1029/96jd03987
Lin, B., Wielicki, B., Minnis, P., and Rossow, W. B. (1998a). Estimation of water cloud properties from satellite microwave, infrared and visible measurements in oceanic environments: 1. Microwave brightness temperature simulations. J. Geophys. Res. 103, 3873–3886. doi:10.1029/97jd02816
Marshall, J., and Parmer, W. (1948). The distribution of raindrops with size. J. Meteor. 5, 165–166. doi:10.1175/1520-0469(1948)005<0165:tdorws>2.0.co;2
Mass, C., and Madaus, L. (2014). Surface pressure observations from smartphones: a potential revolution for high-resolution weather prediction. Bull. Am. Meteorol. Soc. 95, 1343–1349. doi:10.1175/BAMS-D-13-00188.1
Masuko, H., Okamoto, K., Shimada, M., and Niwa, S. (1986). Measurement of microwave backscattering signatures of the ocean surface using X band and Ka band airborne scatterometers. J. Geophys. Res. 91, 13065–13083. doi:10.1029/JC091ic11p13065
McClatchey, R., Fenn, R., Selby, J., Voltz, E., and Garing, J. (1972). Optical properties of the atmospheric. Cambridge, MA: Air Force Cambridge Res. Labs. Environmental Res. Paper AFCRL-72-0497, no. 411, 1972.
Mclinden, M. l.W., Li, L., Heymsfield, G. M., Coon, M., and Emory, A. (2021). The NASA GSFC 94-GHz airborne solid-state cloud radar system (CRS). J. Atmos. Ocean. Tech. 38, 1001–1017. doi:10.1175/JTECH-D-20-0127.1
Mears, C. A., Smith, D. K., and Wentz, F. J. (2015). Estimated errors in retrievals of ocean parameters from SSMIS. J. Geophys. Res. 120, 5816–5830. doi:10.1002/2014JD023049
Millan, L., Lebsock, M., Livesey, N., Tanelli, S., and Stephens, G. (2014). Differential absorption radar techniques: surface pressure. Atmos. Meas. Tech. 7, 3959–3970. doi:10.5194/amt-7-3959-2014
Min, Q., Gong, W., Lin, B., and Hu, Y. (2015a). Application of surface pressure measurements of O2-band differential absorption radar system in three-dimensional data assimilation on hurricane: Part I — an observing system simulation experiments study. JQSRT 150, 148–165. doi:10.1016/j.jqsrt.2014.08.027
Min, Q., Gong, W., Lin, B., and Hu, Y. (2015b). Application of surface pressure measurements of O2-band differential absorption radar system in three-dimensional data assimilation on hurricane: Part II — a study using the observational data. JQSRT 150, 166–174. doi:10.1016/j.jqsrt.2014.08.026
Min, Q., Lin, B., and Li, R. (2010). Remote sensing vegetation hydrological states using passive microwave measurements. IEEE J. Sel. Top. Appl. Earth Observations Remote Sens. (JSTARS) 3, 124–131. doi:10.1109/jstars.2009.2032557
Minnett, P., Alvera-Azcarateb, A., Chinc, T., Corlettd, G., Gentemanne, C., Karagalif, I., et al. (2019). Half a century of satellite remote sensing of sea-surface temperature. Remote Sens. Environ. 233, 111366. doi:10.1016/j.rse.2019.111366
Minnis, P., Huang, J., Lin, B., Yi, Y., Arduini, R. F., Fan, T.-F., et al. (2007). Ice cloud properties in ice-over-water cloud systems using Tropical Rainfall Measuring Mission (TRMM) visible and infrared scanner and TRMM Microwave Imager data. J. Geophys. Res. 112, D06206. doi:10.1029/2006JD007626
Prive, N., Mclinden, M., Lin, B., Heymsfield, G., Harrah, S., Li, L., et al. (2024). “Observing system simulation experiments to determine the impact of spaceborne differential absorption radar measurements of marine surface pressure on numerical weather prediction,” in The AMS 104th Annual Meeting, 28 January to 1 February, 2024, Baltimore, MD, USA.
Prive, N., Mclinden, M., Lin, B., Moradi, I., Sienkiewicz, M., Heymsfield, G., et al. (2023). Impacts of marine surface pressure observations from a spaceborne differential absorption radar investigated with an observing system simulation experiment. J. Atmos. Ocean. Tech. 40, 897–918. doi:10.1175/JTECH-D-22-0088.1
Radnóti, G., Bauer, P., McNally, A., and Horányi, A. (2012). ECMWF study to quantify the interaction between terrestrial and space-based observing systems on numerical weather prediction skill. Tech. Rep. ECMWF Tech. Memo. 679, 98.
Reynolds, C., Stone, R., Doyle, J., Baker, N., Wilson, A., Ralph, F., et al. (2023). Impacts of northeastern pacific buoy surface pressure observations. Mon. Wea. Rev. 151, 211–226. doi:10.1175/MWR-D-22-0124.1
Rienecker, M. M., Suarez, M. J., Todling, R., Bacmeister, J., Takacs, L., Liu, H.-C., et al. (2008). The GEOS-5 data assimilation System−Documentation of versions 5.0.1, 5.1.0, and 5.2.0, 27. Technical Report Series on Global Modeling and Data Assimilation. Available at: http://gmao.gsfc.nasa.gov/pubs/docs/Rienecker369.pdf.
Rosenkranz, P. (1998). Water vapor microwave continuum absorption: a comparison of measurements and models. Radio Sci. 33, 919–928. doi:10.1029/98rs01182
Stiles, B. W., and Yueh, S. H. (2002). Impact of rain on spaceborne Ku-band wind scatterometer data. IEEE Trans. Geosci. Remote Sens. 40, 1973–1983. doi:10.1109/tgrs.2002.803846
Tanelli, S., Durden, S. L., Im, E., Pak, K. S., Reinke, D. G., Partain, P., et al. (2008). CloudSat's cloud profiling radar after two years in orbit: performance, calibration, and processing. IEEE Trans. Geosci. Remote Sens. 46, 3560–3573. doi:10.1109/TGRS.2008.2002030
Turner, D., Kneifel, S., and Cadeddu, M. (2016). An improved liquid water absorption model at microwave frequencies for supercooled liquid water clouds. J. Atmos. Ocean. Tech. 33, 33–44. doi:10.1175/jtech-d-15-0074.1
van Dam, T., Altamimi, Z., Collilieux, X., and Ray, J. (2010). Topographically induced height errors in predicted atmospheric loading effects. J. Geophys. Res. 115, B07415. doi:10.1029/2009JB006810
Wentz, F. (1997). A well calibrated ocean algorithm for Special Sensor Microwave/Imager. J. Geophys. Res. 102, 8703–8718. doi:10.1029/96jc01751
Wentz, F. (2015). A 17-yr climate record of environmental parameters derived from the tropical rainfall measuring mission (TRMM) microwave imager. J. Clim. 28, 6882–6902. doi:10.1175/jcli-d-15-0155.1
Wenzel, H.-G. (1989). “On the definition and numerical computation of free air gravity anomalies,” in Bull d'Information (Toulouse: France: Bureau Gravimetrique Internationale), 64, 23–40.
Whitaker, J., Compo, G., Wei, X., and Hamill, T. (2004). Reanalysis without radiosondes using ensemble data assimilation. Mon. Wea. Rev. 132, 1190–1200. doi:10.1175/1520-0493(2004)132<1190:rwrued>2.0.co;2
Xiao, Q., Chen, L., and Zhang, X. (2009). Evaluations of BDA scheme using the Advanced Research WRF (ARW) model. J. Appl. Meteor. Clim. 48, 680–689. doi:10.1175/2008jamc1994.1
Keywords: O2 differential absorption radar, sea surface air pressure retrieval, environmental impact, uncertainty in pressure retrieval, retrieval simulation
Citation: Lin B, Mclinden MW, Cai X, Heymsfield GM, Privé N, Harrah S and Li L (2024) Sea surface barometry with an O2 differential absorption radar: retrieval algorithm development and simulation. Front. Remote Sens. 5:1399839. doi: 10.3389/frsen.2024.1399839
Received: 12 March 2024; Accepted: 07 June 2024;
Published: 24 July 2024.
Edited by:
Kun-Shan Chen, Nanjing University, ChinaCopyright © 2024 Lin, Mclinden, Cai, Heymsfield, Privé, Harrah and Li. This is an open-access article distributed under the terms of the Creative Commons Attribution License (CC BY). The use, distribution or reproduction in other forums is permitted, provided the original author(s) and the copyright owner(s) are credited and that the original publication in this journal is cited, in accordance with accepted academic practice. No use, distribution or reproduction is permitted which does not comply with these terms.
*Correspondence: Bing Lin, YmluZy5saW5AbmFzYS5nb3Y=
Disclaimer: All claims expressed in this article are solely those of the authors and do not necessarily represent those of their affiliated organizations, or those of the publisher, the editors and the reviewers. Any product that may be evaluated in this article or claim that may be made by its manufacturer is not guaranteed or endorsed by the publisher.
Research integrity at Frontiers
Learn more about the work of our research integrity team to safeguard the quality of each article we publish.