 A. Delgado-Bonal
- 1Earth Sciences Division, NASA Goddard Space Flight Center, Greenbelt, MD, United States
- 2Goddard Earth Sciences Technology and Research II, University of Maryland Baltimore County, Baltimore, MD, United States
When investigating the potential effects of cloud changes on climate, the interday and intraday variabilities should be distinguished. Historically, studies have focused on the long-term cloud changes, and the intraday cycles of cloud properties have been mostly ignored partly owing to the limited availability of global datasets to study higher frequency variabilities. In this regard, DSCOVR’s vantage point at the Lagrange L1 point overcomes the temporal limitations of polar orbiters as well as the limited spatial views of geostationary satellites, allowing characterization of the daytime variability of cloud properties using a single sensor. In previous analyses, we used DSCOVR’s EPIC instrument to characterize the diurnal cycles of cloud height and cloud fraction; here, we expand on previous studies to additionally investigate the variability of cloud optical thickness. We observe a recurring diurnal pattern of cloud optical thicknesses for different latitudinal zones that reaches a maximum around noon regardless of the underlying surface. Once we separate the clouds based on their optical thickness into optically thin (0–3), intermediate (3–10), and thick (10–25), we find that these cloud classes follow different optical thickness diurnal cycles on the global scale. We further explore these differences by combining the evolution of cloud fraction and optical thickness of each group to obtain the diurnal evolution of cloud-fraction-weighted optical depths.
1 Introduction
It is known both empirically and from analyses of cloud observations that cloudiness changes over the course of the day even in the absence of strong dynamic forcing. Over land, low cloud cover tends to increase after a minimum in the early morning, reaching a peak around noon, and then decreasing later in the afternoon. Conversely, low cloud cover over the ocean exhibits an opposite cycle, with the highest cloud fraction during the night (Cairns, 1995) and minimum around noon (Delgado-Bonal et al., 2020a; Delgado-Bonal et al., 2021).
Besides the cloud fraction, diurnal variation is cloud height are crucial for understanding the global energy balance because high and low clouds may have different impacts on trapping thermal infrared radiation. Cloud height exhibits a minimum around midday for low clouds and a steady increase from morning to evening for high clouds. These general characteristics have continental/maritime contrasts, with the amplitudes of the diurnal cycles being weaker over ocean than over land (Yang et al., 2013; Delgado-Bonal et al., 2022).
Sun-synchronous satellites provide fixed-time views of the planet, while geostationary satellite (GEO) systems provide a combination of fixed spatial coverage and high-frequency sampling, addressing some limitations of the sun-synchronous satellites with restricted viewing areas. A middle-ground compromise for this is offered by the Earth Polychromatic Imaging Camera (EPIC) aboard DSCOVR, which provides a unique perspective from a distance of 1.5 million km, with the global and detailed views of the planetary cloud properties of the illuminated part of the planet being resolved in either one (boreal winter) or two hours (boreal summer) (Marshak et al., 2018).
Another approach to studying clouds exploits the combination of different types of satellite observations to achieve broader observational coverage and better temporal sampling rates. Characteristic cloud products of this kind include those obtained from the ISCCP (Rossow and Schiffer, 1991) and CERES project (Wielicki et al., 1996). Cloud property aggregations in these satellite products create almost seamless datasets by combining information from the polar and GEO satellites with measurements acquired at different temporal spans and viewing angles. DSCOVR cloud products, on the other hand, provide lower-resolution views of only the sunlit part of the planet even though they have the advantage of consistency from being based on a single sensor (EPIC); this avoids errors arising from stitching together the views from multiple sensors with different viewing angles, capabilities, and characteristics.
Clouds play a major role in controlling the global radiation budget and influencing climate on a global scale as they cover about two-thirds of the Earth’s surface (Stubenrauch et al., 2013; King et al., 2013). The diurnal variations in cloud properties have important influences on cloud radiative impacts (Bergman and Salby, 1997); through their close association with precipitation, they also influence the hydrological cycle of the planet. Since the diurnal cycles of cloud properties predicted by general circulation models are highly inconsistent (Yin and Porporato, 2017), improving our understanding of these cycles may help improve cloud simulations and their impacts on climate models (Nakajima and King, 1990).
With future clouds being the largest single source of uncertainties in climate analysis and prediction (Stephens, 2005; Baker and Peter, 2008; Boucher et al., 2013), the manner in which cloud optical thickness (COT) may change in the future, including changes in the diurnal cycles, constitutes important aspects of the cloud radiative effect and feedback (Melnikova et al., 2000; Garrett and Zhao, 2006; Zelinka et al., 2016; Chen et al., 2018). Although there is increasing literature on the diurnal variations of clouds (Chen et al., 2018; Yang et al., 2020), these reports mostly focus on the cloud fraction (Cairns, 1995; Burleyson et al., 2013; Burleyson and Yuter, 2015). We have previously studied cloud fraction as well as cloud height diurnal variations based on EPIC data and now focus on the COT, which has not been investigated much (Li et al., 2022).
Regional diurnal cycles of cloud properties have been observed with GEO satellites, such as GOES (Greenwald and Christopher, 1999; Painemal et al., 2013) and Himawari-8 (Shang et al., 2018), but EPIC is the only sensor capable of covering the entire sunlit side of the planet at once. The importance of cloud property diurnal cycles becomes apparent when these results are compared with the fixed times of the polar orbiters. In this regard, Shang et al. (2018) showed that MODIS underestimates the daytime average cloud fraction in China by approximately 4% on an annual scale with respect to the Himawari-8 measurements. Owing to the fixed MODIS overpass times, the difference can increase to up to 21% between the surface-observed and MODIS space-observed cloud fractions over specific regions on the monthly scale (Wang and Zhao, 2017).
The present study aims to provide a global view of the EPIC COT diurnal changes, thus offering a complete view of the diurnal variations of one of the major cloud properties controlling reflected sunlight. The following section provides an overview of the algorithms used and outlines our methodology. The results provide detailed insights into the diurnal cycles of COT from EPIC on the global and regional scales, detailing the behaviors for different cloud types and analyzing the diurnal correlations among different cloud properties.
2 Data and methods
The charge-coupled device (CCD) array of EPIC comprising 2,048 × 2,048 pixels and corresponding to a spatial resolution of ∼8 km at nadir provides the reflectance values across 10 channels spanning from the ultraviolet (318, 325, 340, and 388 nm) and visible (443, 551, 680, and 688 nm) to near-infrared (764 and 780 nm) parts of the spectrum. The cloud product algorithm utilizes a surface-dependent threshold method for cloud masking by employing reflectances at 388, 680, and 780 nm along with the O2 A- and B-band channels. These cloud fraction statistics match closely with those of GEO and low Earth orbit (LEO) systems when collocated, exhibiting global differences of only 1.5% (Yang et al., 2019).
The EPIC cloud mask algorithm includes confidence level flags for the cloud detection outcomes, with fewer than 3% of the pixels marked as low-confidence cloudy. EPIC derives the cloud heights from the O2 A-band (780 and 764 nm) and B-band (680 and 688 nm) observations. Owing to photon penetration of the clouds, the radiance values measured by EPIC’s A and B bands depend on not only the cloud top height but also the cloud extinction profile. Therefore, EPIC’s retrievals represent the “effective” cloud height and pressure, which differ from both the geometrical cloud top heights of active observations such as lidar and effective heights inferred from thermal IR observations (Yang et al., 2013).
The low and high cloud classes are defined by taking into account the apparent predominant cloud thermodynamic phase (liquid or ice) in the Level 2 datasets. EPIC determines the cloud thermodynamic phase from the cloud effective temperature, which is inferred from the aforementioned cloud effective pressure (Yang et al., 2019). If the effective temperature is below 240 K, the cloudy pixels are labeled as ice, and if the temperature is above 260 K, the pixels are labeled as liquid; pixels with temperatures between these values are marked as unknown to prevent potential misclassifications. This methodology has been validated against MODIS (Meyer et al., 2016), showing thermodynamic phase agreement for approximately 77% of the pixels. Around 21% of the pixels are categorized as unknown, and the misclassifications are limited to about 2% compared to MODIS. We classify clouds below 3 km with a thermodynamic cloud phase of liquid as low clouds, and all clouds above 6 km with a thermodynamic phase of ice as high clouds. Although this filtering is not applicable to all the cloudy pixels in our dataset, it helps us avoid distortions of the daytime cycles due to misclassified pixels. About 10% of the EPIC cloud mask is cataloged as high clouds, and the diurnal cycles are studied separately for the low and high clouds.
Because the EPIC channels are not sensitive to particle sizes in the shortwave or midwave infrared range, the EPIC COT retrieval employs a single-channel approach. This method is similar to the approaches used by the International Satellite Cloud Climatology Project (ISCCP) (Rossow and Schiffer, 1991), the Multiangle Imaging SpectroRadiometer (MISR) instrument aboard the Terra satellite (Marchand et al., 2010), and the Geoscience Laser Altimeter System (GLAS) solar background application project (Yang et al., 2008). For retrievals over the ocean and land, the 780 nm and 680 nm channels are employed, respectively. These retrievals assume fixed particle sizes based on the MODIS global cloud effective radius modes of Collection 6 (C6) MODIS cloud products (14 µm for liquid clouds and 30 µm for ice clouds). Analysis of the MODIS data has indicated that the uncertainties for a single-channel retrieval, attributed to assuming a fixed cloud effective radius, are approximately 10% for liquid clouds and 2% for ice clouds (Meyer et al., 2016).
The EPIC COT algorithm utilizes a common code base and adopts the same forward model assumptions as the existing C6/C6.1 MODIS cloud optical/microphysical property retrievals (MOD06) reported by Platnick et al. (2017) after incorporating ancillary data wherever feasible. For every cloudy pixel, the algorithm retrieves and reports two COT values by assuming liquid and ice phases separately. This methodology is similar to the approach employed by Chiu et al. (2010).
In our analysis, the datasets are split into local time zones based on the longitude and UTC acquisition time. The observations are gridded into 1° × 1° grid cells, with the average cloud properties calculated for each cell. The data are further analyzed on the basis of local hourly bins, generating 24 local time maps for each EPIC granule.
EPIC’s location at the Lagrange L1 point provides optimal pixel resolution at nadir. Off nadir, these pixels become elliptical, with the long axis larger by a factor of about 1/cos (SZA) while the short axis remains unaffected. Depending on the orbital position, there are some limitations in the polar regions owing to the Earth’s axial tilt; hence, we limit our study of COT to regions within ±60°. EPIC acquires up to 13 (in boreal winter) and up to 22 (in boreal summer) images per day, with the image center always corresponding to local noon while the left and right edges correspond to sunrise and sunset, respectively. We analyzed 7 years of data from June 2015 to June 2022 (over 22,000 full-disk images). To prevent potential artifacts at the edges of the EPIC images during sunrise and sunset, we focused exclusively on pixels with local times ranging from early morning (8:00) to late afternoon (16:00 for liquid, 15:00 for ice) and containing sufficient amounts of data to provide robust statistics (Li et al., 2022; Delgado-Bonal et al., 2021).
3 Results
3.1 Global diurnal cycle maps
Following our previous investigation of the cloud fraction and cloud height diurnal patterns based on EPIC observations (Delgado-Bonal et al., 2021; Delgado-Bonal et al., 2022) and with the addition of the COT, we are now in a position to visualize the daily progressions of three major low-cloud properties (Figure 1). The panels show three contrasting global views of the mean values of the cloud properties during the early morning, noon, and evening for boreal spring (MAM, March-April-May). A transition from low optical thickness (blue) to higher values (cyan) is observed for the morning-to-noon transition, followed by an afternoon decrease that restores the characteristic deep-blue tones across much of the globe. Unlike the cloud height and cloud fraction, where the diurnal cycles are associated with the underlying surface types, the COT evolves similarly for both the ocean and continental areas, depicting a maximum around midday.
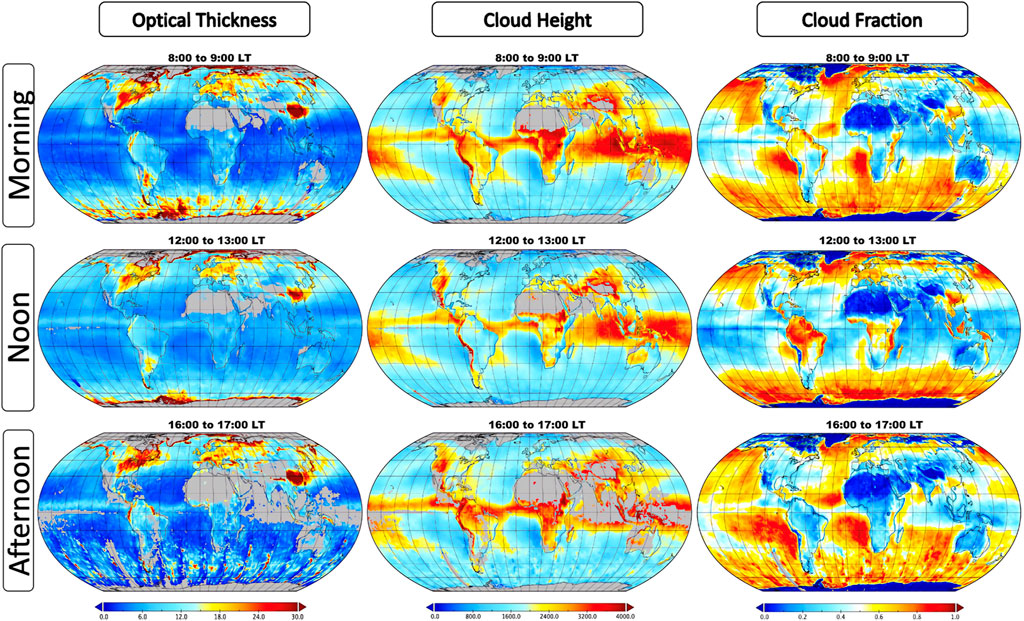
Figure 1. Global low-cloud properties at three different local times for boreal spring. The three columns show the cloud optical thickness (COT), cloud height, and cloud fraction calculated from EPIC L1 cloud products from 2015 to 2022. Regions with cloud fractions below 0.1 are excluded for cloud height and thickness.
Although these cycles generally exhibit a certain degree of global consistency, a careful examination of Figure 1 shows regional variations that are especially noticeable over land. For example, when focusing on the east coast of the United States and other land areas (e.g., Europe), a minimum COT is observed around noon in contrast to the global behavior. These differences underscore the importance of local meteorology in the diurnal cycles of cloud properties. As we will show in the next section, it should be noted that the diurnal cycles undergo small changes throughout the year, but the general features of the maximum values around midday for low clouds is a prevalent trend.
3.2 Integrated cycles
Given the wide range of possible values for the COT, comparisons between the COT values for different seasons are more appropriate based on the median observation. Otherwise, if the mean observation is used, the average of thick and thin clouds could be misrepresented as medium-thickness clouds. Figure 2 shows the diurnal cycle of median COT for different seasons decomposed by the thermodynamic phase, altitude classification, and underlying surface for the integrated area of ±60°. The diurnal evolution of COT for liquid clouds shows a characteristic shape with a maximum around noon and a smaller amplitude over ocean than over land. All seasons share this diurnal evolution with minor differences in the absolute values, revealing the existence of a pattern throughout the year. For high clouds, the underlying surface makes a difference; the high clouds over land show a steady increase from morning to evening, while this behavior is mostly flat over the ocean, with a slight increase around the middle part of the day.
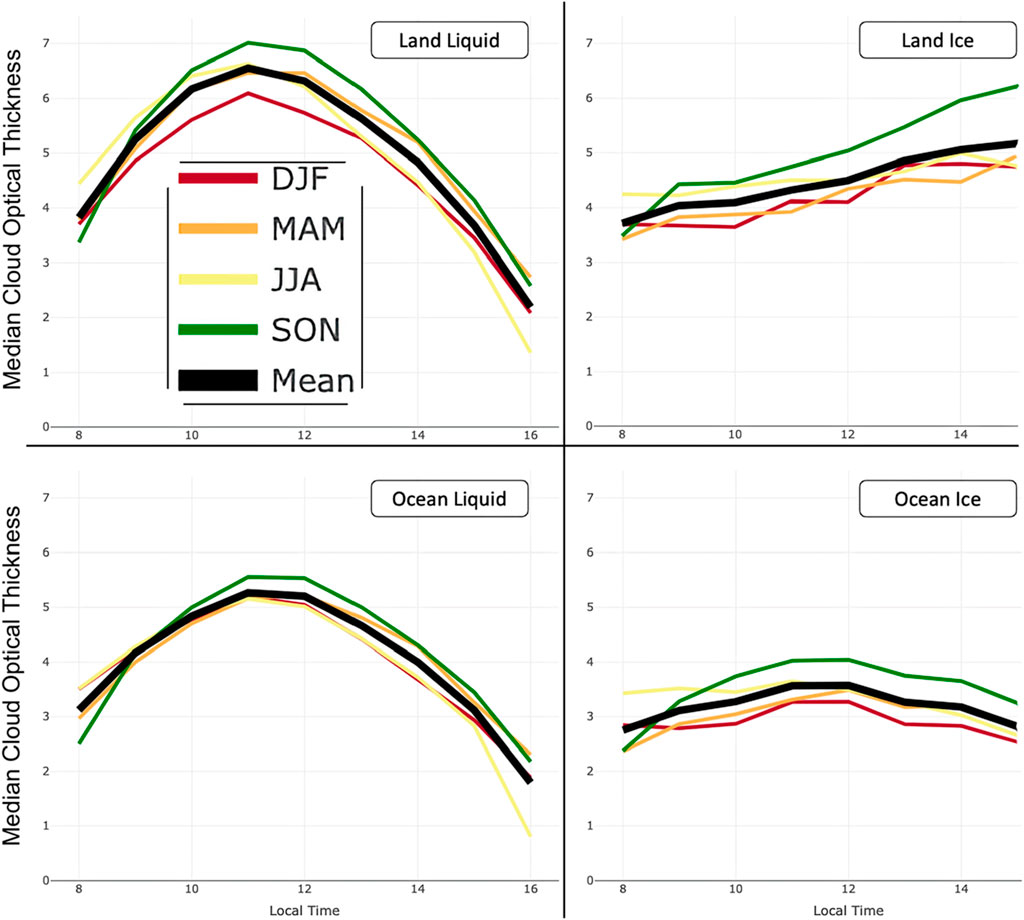
Figure 2. Daytime evolutions of the median COTs for different seasons (December-January-February; March-April-May; June-July-August; September-October-November). The black lines represent the annual average trends. The analysis is separated into land/ocean and low/high clouds.
A rough estimate of the uncertainty of the median COT values in Figure 2 (and Figure 3 thereof) due to the sample size is estimated as follows. We calculate the standard deviations of the COT time series from 2015 to 2022 for each 1° cell using 22,000 granules and average them globally to provide an hourly global standard deviation. We then divide the standard deviation by the square root of the sample size and multiply the result by the Z score of a 95% confidence interval (Z = 1.96), which yields a sampling error of the mean of less than 0.02. Given our large dataset, we compute the sampling error of the median by multiplying this value by 1.253, resulting in an estimate of 0.025. Our sample size is thus sufficiently large for accurate statistical analyses, which is why the error bars are too small to be shown in the images.
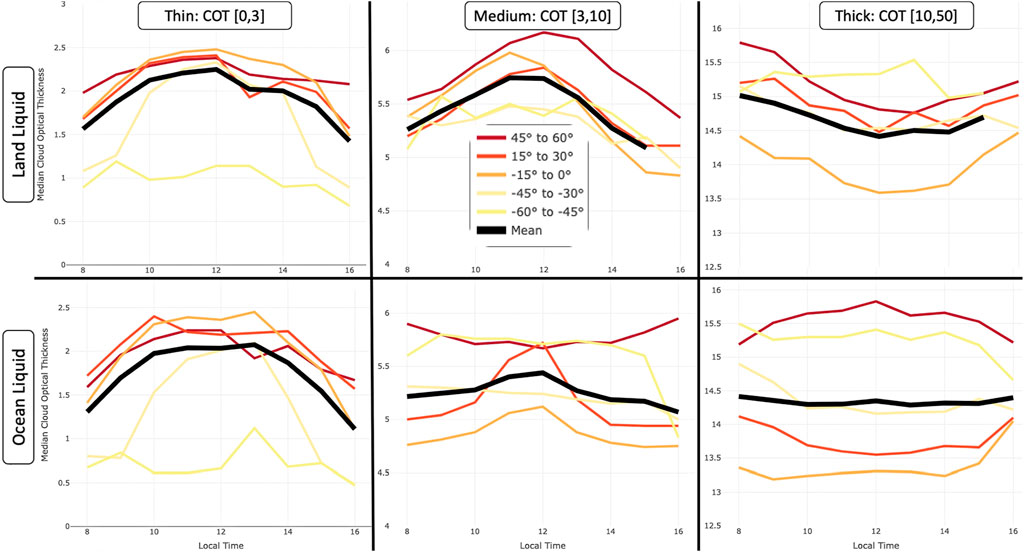
Figure 3. Low-cloud optical thickness cycles based on the median values for clouds grouped into thin (COT between 0 and 3), intermediate (between 3 and 10), and thick (above 10). The different colors indicate latitudinal zones of 15° extent each, and the black lines represent the average trends for latitudes of ±60° for boreal spring.
3.3 Diurnal cycles depending on thickness
To further understand the COT behaviors, we analyzed different kinds of low clouds by grouping them into thin (COT between 0 and 3), intermediate (between 3 and 10), and thick (above 10) clouds. In addition to this categorization, we decomposed the analysis into eight latitudinal zones of 15° each, five of which are shown in Figure 3, to account for the zonal changes in meteorology. We also considered if the underlying surface type was ocean or land. The results for land (top row) and ocean (bottom row) for each of the COT groups are shown in separate columns. Figure 4 shows the diurnal evolution of the corresponding cloud fraction for each group.
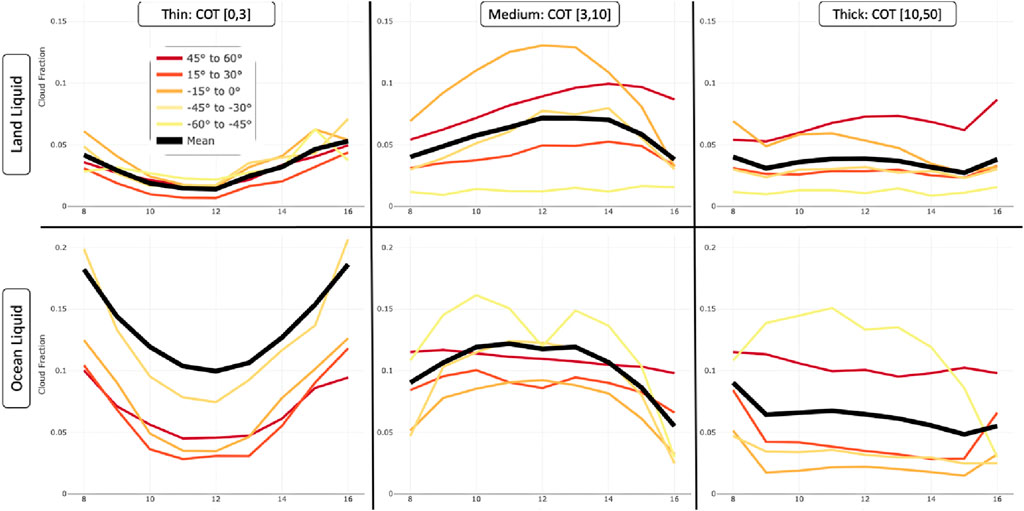
Figure 4. Low-cloud optical thickness cycles, similar to those in Figure 3, for cloud fractions of the different COT groups. The contrasting diurnal cycles of the thin and intermediate clouds are highlighted around noon, while the amount of thick clouds remains mostly constant throughout the day.
For both thin and intermediate clouds, the COT reaches its maximum value around noon for almost all latitudinal zones; this behavior contrasts with that of the thick group, which exhibits a minimum (land) or flat behavior on average (ocean). The maximum peak around noon is more prominent over the tropical regions and is especially noticeable in the intermediate clouds over the ocean. The erratic behaviors of thin clouds over −60° to −40° are likely attributable to the scarcity of data for the corresponding groups around those latitudes during boreal spring, influenced by the viewing angle of the satellite during this season.
Cloud fraction averages for each of the latitudinal zones show differentiable behaviors for each group. While the thin clouds exhibit a minimum during the central hours of the day, the intermediate clouds present a maximum around the same time or an evening peak. Noticeably, the diurnal evolution of the thicker clouds does not display strong variations. The daytime evolution of cloud-fraction-weighted optical depth for each group can be obtained by combining the COT and cloud fraction. Figure 5 shows the results of this estimation for the thin, intermediate, and thick clouds, as well as all clouds combined. In our analysis, approximately 20% of the clouds are in the optical thickness range of [0,3], 40% are in the medium thickness interval [3,10], and 40% are considered optically thick [over 10]. Since the mean of the sum is different from the sum of the means, the shape and value for all clouds combined differ from the sums of the isolated groups.
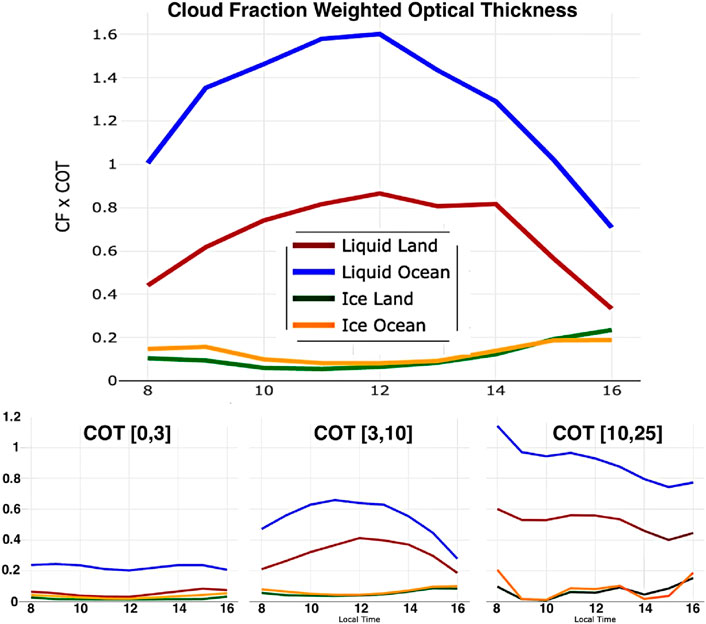
Figure 5. Diurnal variability of the product of low-cloud fraction and COT for boreal spring, depicted as the cloud-fraction-weighted optical depths for all (top), thin (bottom left), intermediate (bottom middle), and thick (bottom right) clouds.
The different behaviors of both the cloud fraction and COT for each of the groups are reflected in their products. While the product remains mostly flat for the thin clouds during the day, the intermediate clouds exhibit a maximum around noon, while the thick clouds display a steady decrease through the day. When analyzing all liquid clouds together regardless of their thickness (top row of Figure 3), their evolution resembles that of the intermediately thick clouds. In our analysis, the weighted optical depths of the liquid and ice clouds differ in both their absolute values and diurnal evolutions. For the liquid clouds, this value is almost twice as much over ocean than over land, while the differences are negligible for the ice clouds.
3.4 Cloud fraction/cloud height correlation
Extant studies examining the coevolution of cloud properties have primarily focused on time-based correlations derived from daily data (Gryspeerdt et al., 2014; Painemal et al., 2013) owing to the limited availability of more frequent time samplings throughout the day. A novel approach to diurnal coevolution was presented by Delgado-Bonal et al. (2020a), where the diurnal correlation between the cloud height and cloud fraction was investigated for EPIC data. Notably, it was found that the cloud fraction over the land reached its peak around noon, in contrast with that over the ocean where the cloud fraction was minimum for the same time of the day. A similar contrasting behavior was found between land and ocean for cloud height, while the COT does not exhibit such behaviors, as shown here.
To quantify these temporal coevolutions, Spearman’s ρ was employed as the non-parametric measure of rank correlation (Myers and Well, 2003, pp. 508), ranging from +1 (indicating positive correlation) to −1 (indicating negative correlation). This statistical measure transcends linear correlations and assesses how well the relationship between two variables can be described using a monotonic function. A positive coefficient indicates that both variables increase or decrease together.
To avoid misrepresentations due to the low number of clouds in regions like the Sahara Desert, we excluded regions with cloud fractions below 0.1 in our analyses. Figure 6 shows the diurnal progressions of COT and cloud fraction (left) as well as cloud height (right). A positive correlation between COT and cloud fraction implies more extensive and thicker clouds, whereas a positive correlation between COT and cloud height indicates thicker and higher clouds.
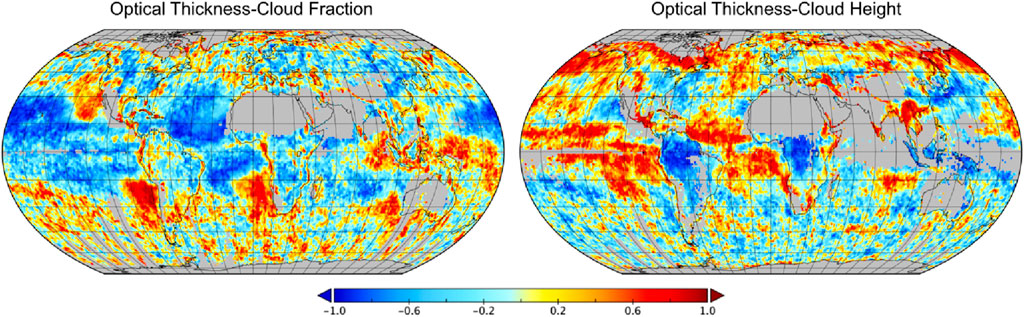
Figure 6. Low-cloud optical thickness diurnal coevolutions with cloud fraction (left) and cloud height (right) based on Spearman’s non-parametric measure of rank correlation ranging from +1 (positive correlation) to −1 (negative correlation).
Joint examination of these two global images reveals that such changes are complementary for a large portion of the globe, such that when the COT and cloud fraction are negatively correlated, the COT and cloud height show a positive correlation. However, regional meteorology has a profound impact on these diurnal correlations, with some regions exhibiting distinct coevolutions (as expressed by the rank correlations) such as in Florida or Mexico, where both diurnal coevolutions are synchronized.
4 Conclusion and discussion
Changing cloud properties are some of the main drivers of climate change; despite their importance, their diurnal variations have been poorly investigated thus far because of dataset limitations. The cloud diurnal contributions to the time-mean Shortwave flux at the surface and Top of the Atmosphere are as large as 20 W/m2 locally, and the contributions to the time-mean Longwave flux at the surface and TOA are typically 1–5 W/m2 (Bergman and Salby, 1997). Even with the recent and future increases in data availability from commercial satellites, the limitations remain since most of the satellites are polar orbiters. To analyze the full range of cloud variability properly, different vantage points in space are required.
Previous efforts to study cloud diurnal properties have used a combination of sensors, such as those included in the ISCCP, to provide a global view (Cairns, 1995) or have limited the research to specific regions using geostationary satellites (Chen et al., 2018; Delgado-Bonal et al., 2022). To this day, the only sensor capable of providing a global (albeit daytime) view is EPIC, whose capabilities are exploited in this and previous works.
In this work, we find that the COT does not exhibit different behaviors over the land and ocean for low clouds, unlike the cloud fraction and cloud height. The general diurnal evolution of the EPIC low-cloud COT is an increase from morning to noon, followed by an almost symmetric decrease in the afternoon. For high clouds, the COT over land exhibits a steady increase from morning to afternoon while that over the ocean shows a maximum around noon. The amplitudes of these cycles are generally smaller than those of the low clouds. Owing to EPIC’s daytime limitation, the nighttime changes in COT are still unknown, and further research with other instruments (including active sensors) will be required to unveil their patterns.
In our analysis of the COT, all seasons exhibit similar diurnal changes. The statistical distribution of the COT corresponds to a lognormal distribution; thus, we used the median values for comparisons between seasons rather than the means. Given their similarity, we have restricted the season to boreal spring (MAM) for this analysis. However, a zonal breakdown shows larger differences in the COT for both the absolute value and diurnal evolution. For example, low intermediate clouds over the ocean exhibit a completely different evolution over the tropics than over other regions of the planet.
We recognize the fact that clouds can be classified into different groups, and we have grouped them into ranges based on the optical thickness. By combining the diurnal cycles of COT and cloud fraction, we obtain the diurnal evolution of the cloud-fraction-weighted optical depths for low clouds, showing their contribution to the average and the distinct diurnal variability of each group.
Data availability statement
Publicly available datasets were analyzed in this study. This data can be found here: https://search.earthdata.nasa.gov/search/granules?p=C1982417666-LARC_ASDC&
Author contributions
AD-B: writing–original draft, writing–review and editing. AM: writing–review and editing. YY: writing–review and editing. LO: writing–review and editing.
Funding
The author(s) declare that financial support was received for the research, authorship, and/or publication of this article. AD-B and AM researchers were supported by the DSCOVR Science Management project. YY would like to acknowledge funding support from the NASA DSCOVR Science Team program. LO gratefully acknowledges support from the NASA MEaSUREs program.
Conflict of interest
The authors declare that the research was conducted in the absence of any commercial or financial relationships that could be construed as a potential conflict of interest.
The author(s) declare that they were an editorial board member of Frontiers at the time of submission. This had no impact on the peer review process and final decision.
Publisher’s note
All claims expressed in this article are solely those of the authors and do not necessarily represent those of their affiliated organizations or those of the publisher, editors, and reviewers. Any product that may be evaluated in this article or claim that may be made by its manufacturer is not guaranteed or endorsed by the publisher.
References
Baker, M. B., and Peter, T., 2008. Small-scale cloud processes and climate. Nature 451, 299–300. doi:10.1038/nature06594
Bergman, J. W., and Salby, M. L. (1997). The role of cloud diurnal variations in the time-mean energy budget. J. Clim. 10, 1114–1124. doi:10.1175/1520-0442(1997)010<1114:TROCDV>2.0.CO;2
Boucher, O., Randall, D., Artaxo, P., Bretherton, C., Feingold, G., Forster, P., et al. (2013). “Clouds and aerosols,” in Climate change 2013: the physical science basis. Contribution of working group I to the fifth assessment report of the intergovernmental panel on climate change. Editors T. F. Stocker, D. Qin, G.-K. Plattner, M. Tignor, S. K. Allen, J. Doschunget al. (Cambridge: Cambridge University Press), 571–657. doi:10.1017/CBO9781107415324.016
Burleyson, C. D., de Szoeke, S. P., Yuter, S. E., Wilbanks, M., and Brewer, W. A. (2013). Ship-based observations of the diurnal cycle of southeast Pacific marine stratocumulus clouds and precipitation. J. Atmos. Sci. 70, 3876–3894. doi:10.1175/JAS-D-13-01.1
Burleyson, C. D., and Yuter, S. E. (2015). Patterns of diurnal marine stratocumulus cloud fraction variability. J. Appl. Meteor. Climatol. 54, 847–866. doi:10.1175/JAMC-D-14-0178.1
Cairns, B., 1995. Diurnal variations of cloud from ISCCP data. Atmos. Res. 37, 133–146. doi:10.1016/0169-8095(94)00074-N
Chen, D., Guo, J., Wang, H., Li, J., Min, M., Zhao, W., et al. (2018). The cloud top distribution and diurnal variation of clouds over East Asia: preliminary results from Advanced Himawari Imager. J. Geophys. Res. Atmos. 123, 3724–3739. doi:10.1002/2017jd028044
Chiu, J. C., Huang, C.-H., Marshak, A., Slutsker, I., Giles, D. M., Holben, B. N., et al. (2010). Cloud optical depth retrievals from the Aerosol Robotic Network (AERONET) cloud mode observations. J. Geophys. Res. 115, D14202. doi:10.1029/2009JD013121
Delgado-Bonal, A., Marshak, A., Yang, Y., and Oreopoulos, L. (2020a). Daytime variability of cloud fraction from DSCOVR/EPIC observations. J. Geophys. Res. Atmos. 125, e2019JD031488. doi:10.1029/2019JD031488
Delgado-Bonal, A., Marshak, A., Yang, Y., and Oreopoulos, L. (2021). Global daytime variability of clouds from DSCOVR/EPIC observations. Geophys. Res. Lett. 48, e2020GL091511. doi:10.1029/2020GL091511
Delgado-Bonal, A., Marshak, A., Yang, Y., and Oreopoulos, L. (2022). Cloud height daytime variability from DSCOVR/EPIC and GOES-R/ABI observations. Front. Remote Sens. 3. doi:10.3389/frsen.2022.780243
Garrett, T. J., and Zhao, C., 2006. Increased Arctic cloud longwave emissivity associated with pollution from mid-latitudes pollution from mid-latitudes. Nature 440, 787–789. doi:10.1038/nature04636
Greenwald, T. J., and Christopher, S. A. (1999). Daytime variation of marine stratocumulus microphysical properties as observed from Geostationary Satellite. Geophys. Res. Lett. 26 (12), 1723–1726. doi:10.1029/1999gl900346
Gryspeerdt, E., Stier, P., and Grandey, B. S. (2014). Cloud fraction mediates the aerosol optical depth-cloud top height relationship. Geophys. Res. Lett. 41, 3622–3627. doi:10.1002/2014GL059524
King, M. D., Platnick, S., Menzel, W. P., Ackerman, S. A., and Hubanks, P. A. (2013). Spatial and temporal distribution of clouds observed by MODIS onboard the terra and aqua satellites. IEEE Trans. Geoscience Remote Sens. 51 (7), 3826–3852. doi:10.1109/TGRS.2012.2227333
Li, Y., Yi, B., and Min, M. (2022). Diurnal variations of cloud optical properties during day-time over China based on Himawari-8 satellite retrievals. Atmos. Environ. 277, 119065. doi:10.1016/j.atmosenv.2022.119065
Marchand, R., Ackerman, T., Smyth, M., and Rossow, W. B. (2010). A review of cloud top height and optical depth histograms from MISR, ISCCP, and MODIS. J. Geophys. Res. 115, D16206. doi:10.1029/2009JD013422
Marshak, A., Herman, J., Adam, S., Karin, B., Carn, S., Cede, A., et al. (2018). Earth observations from DSCOVR EPIC instrument. Bull. Amer. Meteorol. Soc. 99, 1829–1850. doi:10.1175/BAMS-D-17-0223.1
Melnikova, I., Domnin, P., Mikhailov, V., and Radionov, V., 2000. Optical cloud characteristics derived from measurements of reflected or transmitted solar radiation characteristics derived from measurements of reflected or transmitted solar radiation. J. Atmos. Sci. 57, 2135–2143. doi:10.1175/1520-0469(2000)057<2135:occdfm>2.0.co;2
Meyer, K., Yang, Y., and Platnick, S. (2016). Uncertainties in cloud phase and optical thickness retrievals from the Earth Polychromatic Imaging Camera (EPIC). Atmos. Meas. Tech. 9, 1785–1797. doi:10.5194/amt-9-1785-2016
Myers, J. L., and Well, A. D. (2003) Research design and statistical analysis. New York: Lawrence Erlbaum Associates Publishers.
Nakajima, T., and King, M. D. (1990). Determination of the optical thickness and effective particle radius of clouds from reflected solar radiation measurements. Part I: theory. J. Atmos. Sci. 47, 1878–1893. doi:10.1175/1520-0469(1990)047<1878:DOTOTA>2.0.CO;2
Painemal, D., Minnis, P., and O'Neill, L. (2013). The diurnal cycle of cloud-top height and cloud cover over the southeastern pacific as observed by GOES-10. J. Atmos. Sci. 70 (8), 2393–2408. doi:10.1175/JAS-D-12-0325.1
Platnick, S., Meyer, K., King, M. D., Wind, G., Amarasinghe, N., Marchant, B., et al. (2017). The MODIS cloud optical and microphysical products: Collection 6 updates and examples from Terra and Aqua. IEEE T. Geosci. Remote 55, 502–525. doi:10.1109/TGRS.2016.2610522
Rossow, W. B., and Schiffer, R. A. (1991). ISCCP cloud data products. Bull. Am. Meteorological Soc. 72 (1), 2–20. doi:10.1175/1520-0477(1991)072<0002:icdp>2.0.co;2
Shang, H., Letu, H., Nakajima, T. Y., Wang, Z., Ma, R., Wang, T., et al. (2018). Diurnal cycle and seasonal variation of cloud cover over the Tibetan Plateau as determined from Himawari-8 new-generation geostationary satellite data. Sci. Rep. 8, 1105. doi:10.1038/s41598-018-19431-w
Stephens, G. L. (2005). Cloud feedbacks in the climate system: a critical review. J. Clim. 18, 237–273. doi:10.1175/JCLI-3243.1
Stubenrauch, C. J., Rossow, W. B., Kinne, S., Ackerman, S., Cesana, G., Chepfer, H., et al. (2013). Assessment of global cloud datasets from satellites: project and database initiated by the GEWEX Radiation Panel. Bull. Amer. Meteorol. Soc. 94 (7), 1031–1049. doi:10.1175/BAMS-D-12-00117.1
Wang, Y., and Zhao, C., 2017. Can MODIS cloud fraction fully represent the diurnal and seasonal variations at DOE ARM SGP and Manus sites? J. Geophys. Res. 122, 329–343. doi:10.1002/2016JD025954
Wielicki, B. A., Barkstrom, B. R., Harrison, E. F., Lee, R. B., Smith, G. L., Cooper, J. E., et al. (1996). Clouds and the Earth's Radiant Energy System (CERES): An Earth Observing System Experiment. Bull. Amer. Meteor. Soc. 77, 853–868. doi:10.1175/1520-0477
Yang, Y., Marshak, A., Chiu, J. C., Wiscombe, W. J., Palm, S. P., Davis, A. B., et al. (2008). Retrievals of thick cloud optical depth from the geoscience laser altimeter system (GLAS) by calibration of solar background signal. J. Atmos. Sci. 65, 3513–3526. doi:10.1175/2008JAS2744.1
Yang, Y., Marshak, A., Mao, J., Lyapustin, A. I., and Herman, J. R. (2013). A method of retrieving cloud top height and cloud geometrical thickness with oxygen A and B bands for the Deep Space Climate Observatory (DSCOVR) mission: radiative transfer simulations. J. Quantitative Spectrosc. Radiat. Transf. 122, 141–149. doi:10.1016/j.jqsrt.2012.09.017
Yang, Y., Meyer, K., Wind, G., Zhou, Y., Marshak, A., Platnick, S., et al. (2019). Cloud products from the earth polychromatic imaging Camera (EPIC): algorithms and initial evaluation. Eval. Atmos. Meas. Tech. 12 (3), 2019–2031. doi:10.5194/amt-12-2019-2019
Yang, Y., Zhao, C., and Fan, H. 2020. Spatiotemporal distributions of cloud properties over China based on Himawari-8 advanced Himawari imager data. Atmos. Res. 240, 104927. doi:10.1016/j.atmosres.2020.104927
Yin, J., and Porporato, A. (2017). Diurnal cloud cycle biases in climate models. Nat. Commun. 8, 2269. doi:10.1038/s41467-017-02369-4
Keywords: daily variability, cloud diurnal cycle, DSCOVR EPIC, climate change, cloud optical depth (COD)
Citation: Delgado-Bonal A, Marshak A, Yang Y and Oreopoulos L (2024) Global cloud optical depth daily variability based on DSCOVR/ EPIC observations. Front. Remote Sens. 5:1390683. doi: 10.3389/frsen.2024.1390683
Received: 23 February 2024; Accepted: 13 May 2024;
Published: 19 June 2024.
Edited by:
David Painemal, Science Systems and Applications, Inc., United StatesReviewed by:
Li Sun, Liaoning Weather Modification Office, ChinaBing Lin, National Aeronautics and Space Administration, United States
Copyright © 2024 Delgado-Bonal, Marshak, Yang and Oreopoulos. This is an open-access article distributed under the terms of the Creative Commons Attribution License (CC BY). The use, distribution or reproduction in other forums is permitted, provided the original author(s) and the copyright owner(s) are credited and that the original publication in this journal is cited, in accordance with accepted academic practice. No use, distribution or reproduction is permitted which does not comply with these terms.
*Correspondence: A. Delgado-Bonal, alfonso.delgadobonal@nasa.gov