
94% of researchers rate our articles as excellent or good
Learn more about the work of our research integrity team to safeguard the quality of each article we publish.
Find out more
ORIGINAL RESEARCH article
Front. Remote Sens., 28 June 2024
Sec. Multi- and Hyper-Spectral Imaging
Volume 5 - 2024 | https://doi.org/10.3389/frsen.2024.1369769
This article is part of the Research TopicOptical Radiometry and Satellite ValidationView all 22 articles
 Andrew Barnard1*
 Emmanuel Boss2
 Nils Haëntjens2
 Cristina Orrico3
 Robert Frouin4
 Jing Tan4
 Justin Klumpp5Michael Dewey5David Walter3
 Matthew Mazloff4Paul Chamberlain4
Hyperspectral optical observations of the Earth’s surface oceans from space offer a means to improve our understanding of ocean biology and biogeochemistry. NASA’s Plankton, Aerosol, Cloud, ocean Ecosystem (PACE) satellite mission, which includes a hyperspectral ocean color instrument (OCI), will provide radiometric observations of surface ocean with near continuous spectral resolution across the near UV to NIR range. Maintaining sufficient accuracy over the lifetime of satellite ocean color missions requires a robust program for system vicarious calibration (SVC) and product validation. The system vicarious calibration process combines satellite sensor data with in-situ radiometric/optical measurements to remove potential biases due to the combined errors from both satellite radiometric sensor calibration and atmospheric correction. As such, high accuracy, high-spectral resolution in-situ radiometric measurements are required to provide a principal source of truth for the satellite-derived products. To meet the requirements, a novel in-situ radiometric system, called HyperNav, has been developed, rigorously characterized and field tested. Key attributes of HyperNav are dual upwelling radiance heads coupled to individual spectrometers, spectral resolution of ∼2.2 nm (full width, half-maximum) across 320–900 nm, integrated shutter systems for dark measurements, and integrated tilt and pressure sensors. The HyperNav operational modes include traditional profiling and surface modes, as well as integration with an autonomous profiling float for unattended deployment, offering a new capability for a network of autonomous platforms to support the long-term needs for hyperspectral ocean color remote sensing observations. This paper describes the HyperNav design, in-situ operational modes, and field verification results.
The NASA Plankton, Aerosol, Clouds and ocean Ecosystem (PACE) mission builds on past ocean color remote sensing efforts to provide a global observational basis for understanding the living ocean and for improving skill in forecasts and projections of Earth System variability over a wide range of time and space scales (Werdell et al., 2019). The primary instrument of the PACE satellite, the Ocean Color Instrument (OCI), includes significant advances in ocean color remote sensing, namely, a wider spectral range extending into the UV and near-infrared with bandwidth of 5.0 nm spectral resolution (2.5 nm spectral steps). These advancements drive new requirements for in-situ radiometric measurement capabilities to ensure the ocean color satellite is accurately ground-truthed through a process known as system vicarious calibration, SVC (Gordon, 1998; Franz et al., 2007; Frouin, 2013). Relative to existing in-situ ocean radiometer technology, advancements are needed with regard to the extended spectral range into the UV and the increased spectral resolution. For the latter, a desire to create aggregate spectral bands of 5–10 nm imposes a need to sample the ocean remote sensing reflectance spectra at approximately one-half of the spectral resolution of the satellite instrument, and in the case of in-situ upwelling radiance, may require sub-nanometer resolution in the blue spectral region (Zibordi et al., 2017).
Concurrent with the enhanced capabilities of OCI has been a need to evolve ocean color in-situ SVC approaches. Historically, in-situ SVC measurements have been collected from mooring-based radiometric systems such as the Marine Optical BuoY (MOBY) located off Lana’i, Hawaii (Brown et al., 2007) and the Boussole mooring located in the Ligurian Sea (Antoine et al., 2008). While such mooring-based approaches have been successful in providing in-situ SVC data, it is advantageous to collect in-situ SVC observations using a variety of measurement techniques across multiple SVC sites to reduce the time needed to achieve vicarious calibration post-launch (Voss et al., 2010) and to assure accuracy in the SVC coefficients. However, all in-situ SVC systems must meet stringent instrument performance and uncertainty requirements to ensure equivalency in the quality of the radiometric data (Zibordi et al., 2015). Specifically for the NASA PACE mission SVC program, these requirements include a radiometric spectral range spanning 350–890 nm, spectral resolution
A new hyperspectral radiometric sensor, HyperNav, has been developed to finely and accurately resolve the upwelling radiance spectrum to meet the in-situ SVC requirements of the PACE mission OCI. The design of HyperNav focused on providing the most accurate and lowest uncertainty spectral upwelling radiance measurements with emphasis on achieving these measurements as close to the sea surface as possible to meet the needs of in-situ SVC data production. Additionally, design criteria for the radiometric measurement system included a capability to be integrated with an autonomous profiling float. As such, mechanical, electrical and data interfaces were developed to enable onboard data collection and sampling, as well as data transmission to shore when integrated with an autonomous profiling float. As part of HyperNav design criteria, optimal mission operation modalities (frequency of profile trade-off against mission duration, vertical resolution, surface observations for extended periods, etc.; see Claustre (2011)) were considered to ensure cost-effective operations of deployments of the system. In this paper, we describe the HyperNav radiometric system, the modes of operation, the integration of the system with an autonomous float, and the methods and field results used to evaluate the system performance against the stated in-situ SVC requirements.
Our effort resulted in the creation of new radiometers able to collect accurate and precise radiometric measurements of upwelling radiance in the ocean environment at high spectral resolution, 2.2 nm full width at half maximum (FWHM) over the 320–800 nm spectral region. While Zibordi et al. (2015) and Zibordi et al. (2017) recommended a finer spectral resolution requirement, the radiometric spectral resolution of our system does meet the NASA PACE mission SVC stated requirement of
The design objectives for HyperNav focused primarily on providing the most accurate and lowest uncertainty spectral upwelling radiance measurements with emphasis on achieving these measurements as close to the sea surface as possible to reduce the uncertainty in extrapolating upwelled radiance measurements from depth to the air-sea interface. HyperNav includes two independent upwelling radiance sensors, oriented 180° apart from the main body (Figure 1). The purpose of including dual upwelling radiance sensors on the HyperNav system was three-fold: 1) to provide redundancy in the key upwelled radiance measurements in case of failure of one radiance system, 2) to characterize uncertainties in measurements over time by comparing the measurements from the different radiometers, and 3) to reduce the effects of shading by the float and arms on the radiance measurements. With respect to item 1, the design of the HyperNav system includes separate and independent optical paths and spectrometers for each of the upwelled radiance measurement sensors. The only shared elements of the two radiance measurement sensors are the command and control electronic boards and the HyperNav physical body. Thus, the two measurements are independent and provide, by the difference between them and its change over time, a validation of the measurements within their uncertainties. Details of the HyperNav system design, functionality, and characterization methods are provided in the following sections.
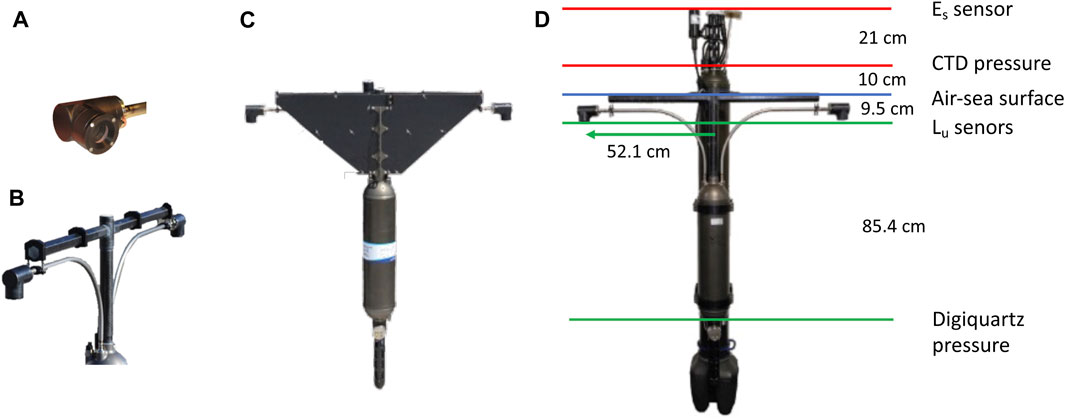
Figure 1. Photos of the HyperNav system. (A) Upwelling radiance sensor fore-optics head, (B) Upper section of the HyperNav radiance system with fiber optic conduits and support structure, (C) HyperNav configured for real-time profiling, and (D) a HyperNav system attached to a Navis float with locations and distances for each sensor system.
Meeting the spectral range and resolution requirements for PACE necessitated the design of new radiometers, as no commercial option for in water upelling radiometers with appropriate specifications was available. In the early stages of our development project a search for commercially available spectrometers was undertaken and three potential spectrometers were selected for further laboratory evaluation. Evaluation was based on radiometer requirements detailed in Mueller (2003). Tests included determining sensitivity, saturation, digital resolution, polarization sensitivity, absolute wavelength accuracy, wavelength resolution, linearity, thermal sensitivity, and stray light rejection.
After extensive laboratory characterization, the Zeiss CGS CCD UV-NIR spectrometer was selected based on the required performance criteria. The Zeiss spectrometer has a stated 190–1,015 nm spectral range, with a spectral resolution (FWHM) of 2.2 nm and 2.5 nm in the UV-VIS and NIR region respectively, high dynamic range obtained from a 16 bit ADC digitization and multiple integration times, with high sensitivity, low stray light perturbations, and low temperature drift. The CCD detector uses 2048 pixels to sample the spectral range, providing ∼0.41 nm sampling interval. Additionally, the compact size, SMA (SubMiniature A connector) optical interface, low stray light characteristics, and a wide range of integration times provided significant advantages in the design of the HyperNav.
The HyperNav design choice was to position the fore-optics of the radiance radiometers at the end of arms extended horizontally outward from the body of the HyperNav using pressured sealed titanium conduits (Figure 1) for strength, weight, and corrosion considerations. The impact of the arm extension and the fore-optics from the main housing with respect to the effects of self shading on the radiance measurements was determined using a Monte Carlo self shading models (SimulO software1, Leymarie et al. (2010)) and was taken into account in the float design. The fore-optics, contained within in a small sealed pressure housing, are located 52 cm from the center-line of the main HyperNav pressure housing (Figure 1). Armored, solarization-resistant (to mitigate the effects of UV degradation), 600 μm core optical fibers are used to couple the light between each spectrometer (located in the main underwater housing) and the fore-optics. A low power bi-stable shutter is integrated into the radiance fore-optics heads (in front of the fore-optics fiber) to enable collection of dark measurements near the time when light data is taken. The use of the fiber optic coupler (via the titanium conduit) necessitated a plane mirror oriented at 45° to make a 90° angle in the direction of the light propagation in the fore optics. This, combined with the optical elements in the HyperNav radiance sensor, presented a potential issue of increased polarization sensitivity. To reduce the polarization sensitivity of the optical train, a liquid crystal polymer depolarizing filter with anti-reflection coating was integrated between the mirror and the pressure window. Inclusion of the depolarizing filter significantly reduced the polarization sensitivity of the optical train over the 350–700 nm range to less than 1%, and increases to 2% from 700 to 800 nm.
The in-water field of view (FOV) of the HyperNav radiance sensor was designed to be 4.5° (half-angle, half-max) in water. To verify, the FOV was measured in a seawater tank, with the radiance head rotated in a beam of collimated light from a FEL lamp into the tank with the face of the radiance head oriented perpendicular to the incident beam. To minimize scattering, the water was filtered and allowed time to settle for bubbles to escape. The field-of-view was determined to be 4.5° (half-angle, half-max) for all wavelengths, with the response dropping to 0.35% of maximum at 10° (half-angle) with no secondary reflections observed.
The main pressure housing of the HyperNav system contains the dual spectrometers, electronic boards, external cable connectors, as well as a pitch and roll sensor and a pressure sensor. Simulations were conducted to ensure that the HyperNav system maintained low tilt due to the drag of the HyperNav system. Drag simulation models predicted a pitching moment of only 0.002 J/rad parallel to the arms. Because the ocean upwelling radiance decreases exponentially with depth their position in the vertical is needed in high accuracy. Thus, the sensors were placed as close to the surface as possible (but below the surface to avoid reflections from air-water interface), and a Paroscientific Digiquartz® pressure sensor was integrated to provide accurate and high-resolution measurements of depth.
The inclusion of the titanium conduits (fore-optics to the main HyperNav body) necessitated a support structure to ensure stability of the fore optics in rough ocean surface conditions. The support structure used is fabricated from carbon fiber tubing filled with castable syntactic foam. Test results showed the design was able to support approximately 200 J/rad of torque while retaining its original shape.
To obtain a pressure rating for the HyperNav system, testing of the main pressure housing and the fore-optics head housing were conducted down to ∼1,200 dbar without failure occurring. Pressure testing of the full HyperNav system was conducted to 825 dbar without failures occurring. Based on these results, we estimated the pressure rating as 1,200 dbar. To date, no destructive pressure testing of the full system has been completed. However, during a recent field deployment of the HyperNav system integrated with an autonomous profiling float, the system was mistakenly commanded to go down to 1700 m but survived and continued to work properly without any effects on the system. Thus we expect the system to be able to reach depths of 1,500 m without failures occurring.
The HyperNav system also supports integration of an external four-channel downwelling irradiance sensor (a Sea-Bird Scientific OCR-504). The OCR-504 is enabled by using an underwater cable connected to an electrical connector on the top of the HyperNav system’s pressure housing. The OCR-504 is mounted to a support structure located at the highest point on the platform to avoid reflections and shadowing effects on the measurement. The purpose of including the OCR-504 sensor on the HyperNav system was to capture potential varying sky conditions during the surface upwelling radiance measurement acquisitions. Recent work by Tan et al. (2024) has shown potential that the full hyperspectral above surface downwelling irradiance can be reconstructed accurately using in-situ irradiance measurements from 4 select spectral bands. Finally, the HyperNav system also includes a combined chlorophyll fluorescence, colored dissolved organic matter fluorescence, and backscattering sensor (Sea-Bird Scientific MCOMS). However, data acquisition integration for this sensor within the HyperNav system is not completed as of yet, but will be pursued in the future. The purpose of including this sensor is to provide an independent method of assessing the water column properties to meet the SVC criteria of spatial/vertical homogeneity.
Due to the number of sensors integrated into the HyperNav system, the large volume of data from the spectrometers, and the real-time requirements, the electronics design required implementation of two microprocessors as well as analog to digital interface electronics to the spectrometers to provide more flexibility and capabilities in optimizing the radiometric signals and control. In the free-fall system (i.e., real time acquisition mode, see HyperNav operation modes section below), this significantly limits the frame rate (one sample every
The HyperNav system’s firmware has an on-board automatic integration time adjustment feature, where the integration time of each spectrometer is controlled based on the nearest neighbor sampled light (unshuttered) and dark (shuttered) measurements. This control algorithm functions as follows: a light measurement is taken, and the maximum count (i.e., highest value as a function of wavelength) value is determined and compared to a user configurable saturation count value. If the maximum light count value exceeds the saturation count level, the firmware automatically switches the integration time of the spectrometer to the next shortest integration time. Conversely, the mean of the spectral dark (with the shutter closed) counts is computed and compared with the most recent light sample. If the light measurement is near the dark count average, the firmware automatically changes the integration time to the next longest integration time. The available spectrometer integration times are 11, 20, 40, 80, 160, 320, 640, 1,280, and 1920 ms, which enable over 7 orders of magnitude of range in radiance.
Ancillary sensors on board the HyperNav sensor, pitch and roll and pressure sensors, are sampled continuously during operation. At the time of a radiance measurement acquisition, the nearest pitch/roll and pressure measurements are collected and integrated into the radiance data output frame, along with the date/time of measurement. Additionally, all measured data are recorded to internal memory, which has a capacity of 4GB, (roughly 1,000 HyperNav profiles) on the HyperNav system which can be downloaded post-deployment.
Each HyperNav system can be configured to operate in one of two modes: 1) a real-time (RT) mode, also known as “freefall”, where a cable is used to connect the HyperNav to an external power source and for data/command transmissions, and, 2) a fully autonomous profiling (AP) mode, where the HyperNav system is coupled to an autonomous profiling float to move the system through the water column, supply power to the HyperNav system and enable remote telemetry of HyperNav data to shore using the Iridium modem of the float. Switching between the two modes requires installation of separate firmware on the HyperNav controller board which can be accomplished using a direct cabled connection to HyperNav prior to deployment by the user. Both modes support the on-board automatic integration time adjustment feature.
The simplest method of operating a HyperNav system is via a short cable to connect an external 12 V DC power supply and a serial (RS-232) interface to the power/communications port of HyperNav. A terminal program, such as Tera Term, can be used to send various commands to the HyperNav, for example, to start/stop sampling, change and store configuration settings, manually change integration times, change the interval of light and dark sampling, and to offload collected data from the internal memory of HyperNav. This is the typical method used for laboratory testing and for calibration of the radiance sensors. HyperNav command, configuration, and data capture and visualization can also be accomplished using the open source software Inlinino2 (Haëntjens and Boss, 2020) which has been updated to include many of the features listed above.
The RT mode of operation also enables using the HyperNav for conducting shallow (
In RT mode, samples are acquired continuously from each radiance sensor as well as from the integrated pressure and pitch/roll sensors. The measurements are used to build a data frame for each radiance sensor, which includes the serial number of the radiance head, date and time of the radiance measurement, pressure, pitch and roll, and the 2048 spectral count values from the radiance sensor. This data frame creation is performed in real-time and is transmitted through the HyperNav power/communications port. The rate of sampling varies, as the integration time of the spectrometer at the time of measurement depends on the in-situ light level, and as well as the processing time needed to create data frames for both radiance sensors in real-time. Typical sampling rates in RT mode vary from 0.25 Hz to 0.5 Hz. Additionally, a hyperspectral surface downwelling irradiance sensor (e.g., a HyperOCR irradiance sensor) can be mounted on a ship/platform near the HyperNav deployment location, to evaluate temporal changes in the downwelling surface irradiance during the period of the HyperNav radiance profiling.
The AP mode, where the HyperNav system is integrated with a buoyancy-driven autonomous profiling float (a Sea-Bird Scientific Navis float), enables fully autonomous operational capabilities for collection of quality radiometric data. The Navis float firmware was modified to enable power, sampling, and data transmission for the HyperNav system during deployments. Two sets of black plastic (Delrin) brackets are used to mount the HyperNav system firmly to the Navis body such that the radiance sensor faces of HyperNav are ∼10 cm below the water when the float is at the surface. A set of small brackets is used to mount the downwelling irradiance sensor (OCR-504) to the CTD guard such that the sensing face is at the highest point of the float. Currently, the downwelling surface irradiance data (i.e., the OCR-504) from the system are used primarily for QA/QC purposes to evaluate the incident light field variability with respect to the observations of near surface upwelling radiance from HyperNav (i.e., the presence/variation of clouds). The integrated HyperNav float system is ballasted at the Sea-Bird Scientific facility before deployment to achieve a nominal ascent rate of 0.08 m s−1 over the profiling range (i.e., park depth to the surface). The system typically performs one profile per day, surfacing ±20 min of the user programmed mission surfacing time, which can be changed through a new mission upload to the Navis system through the Iridium modem.
The HyperNav firmware for AP mode includes user configurable settings that define the radiance sampling interval as a function of depth for three depth ranges. A typical radiance sampling profile is shown in Figure 2. HyperNav uses the integrated pressure sensor to decide when to collect data based on the pre-assigned sampling configuration settings. A maximum of 300 data frames (150 per radiance sensor) of radiance data is collected per vertical profile. When the Navis float reaches the surface, it transmits a message to the HyperNav to complete its sample collection. The Navis controller then establishes an Iridium connection and transmits standard Navis data and control through the Iridium link. Upon completion of this transmission of Navis data, the Navis system transfers modem control to HyperNav, which then initiates transfer of the HyperNav data through the Iridium link. When HyperNav indicates it has completed its transmission, or when a timeout is reached, Navis powers down HyperNav and the system descends to its programmed park depth.
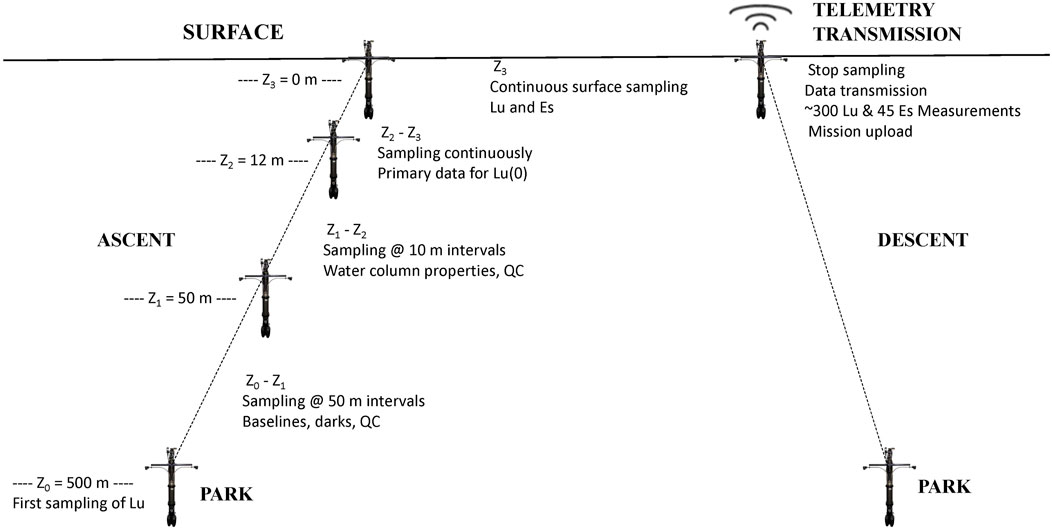
Figure 2. Typical HyperNav float profile mission sequence: Each radiance sensor obtains 8 measurements between 500 and 50 (50 m intervals), 4 measurements between 50 and 12 m (10 m intervals), and 138 measurements between 12 m to the surface including the continuous surface hold sampling.
An expansive series of radiometric characterizations have been conducted on the HyperNav radiance sensors. The results of these characterizations were used to produce a total uncertainty budget for HyperNav radiance measurements. Potential sources of uncertainty included: Calibration, Instrument, and Field uncertainties as described in Zibordi et al. (2015). While the results of these characterization studies and the associated uncertainties are the subject of a companion paper to follow, for convenience, we include Table 1, which summarizes the combined uncertainty (k = 1) estimates for 6 wavelengths of the HyperNav radiance sensors.
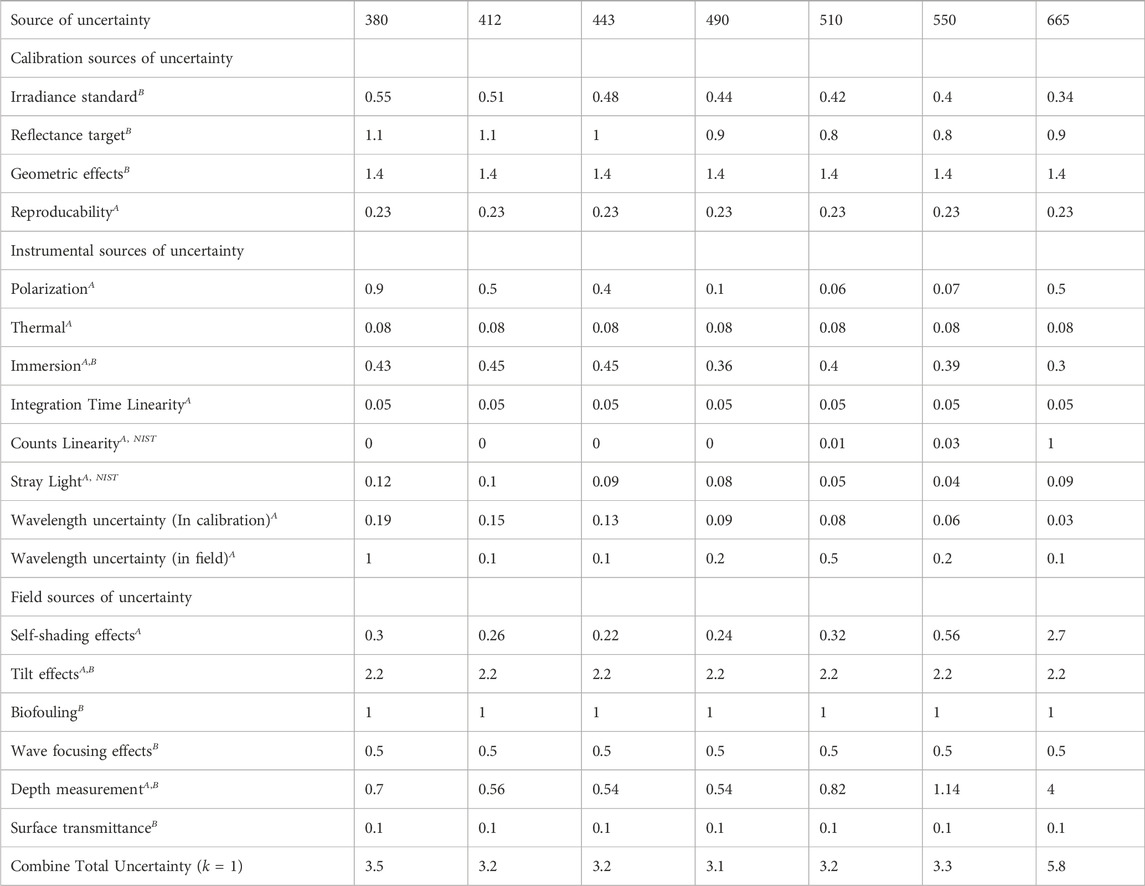
Table 1. HyperNav radiance sensor percent uncertainty at several wavelengths (nm) computed at a k = 1 confidence level. Note that for each source of uncertainty, Type A (i.e., based on statistical analyses of data collected), Type B (i.e., estimated from published literature results), or a combination of both were used to derive the uncertainty values (indicated superscript).
Pre- and post-deployment calibrations are performed on each of the radiance sensors to track potential drift or offsets over the deployment duration. Note that while the spectrometers used in the HyperNav radiance sensor have a broad spectral range (i.e 190-1015 nm), the current calibration process extends a smaller spectral range (320–800 nm) primarily due to the light source (i.e., FEL lamp) used in calibration. All calibrations are logged and tracked as a function of date to evaluate and identify long-term changes for each radiance sensor. Additionally, a pre- and post-deployment wavelength registration characterization process is performed to track any changes over the deployment period.
A field campaign was conducted over 3 weeks in June 2021 near the Hawaiian Islands. Deployments included a) a HyperNav radiometric sensor (in RT mode) at the Mauna Loa Observatory, HI (MLO), b) a HyperNav radiometric system (in RT mode) deployed near the MOBY site, off Lanai, HI, and c) two HyperNav float systems (in AP mode) deployed west of Kona, HI (Figure 3). The purpose of the campaign was to evaluate HyperNav system performance, radiometric quality, and to validate estimates of measurement uncertainty. In this section we present results from a subset of the data collections at MLO and from the HyperNav float deployments west of Kona, HI. The results from the HyperNav deployment near MOBY and further details and results of the deployment at MLO will be presented in forthcoming papers.
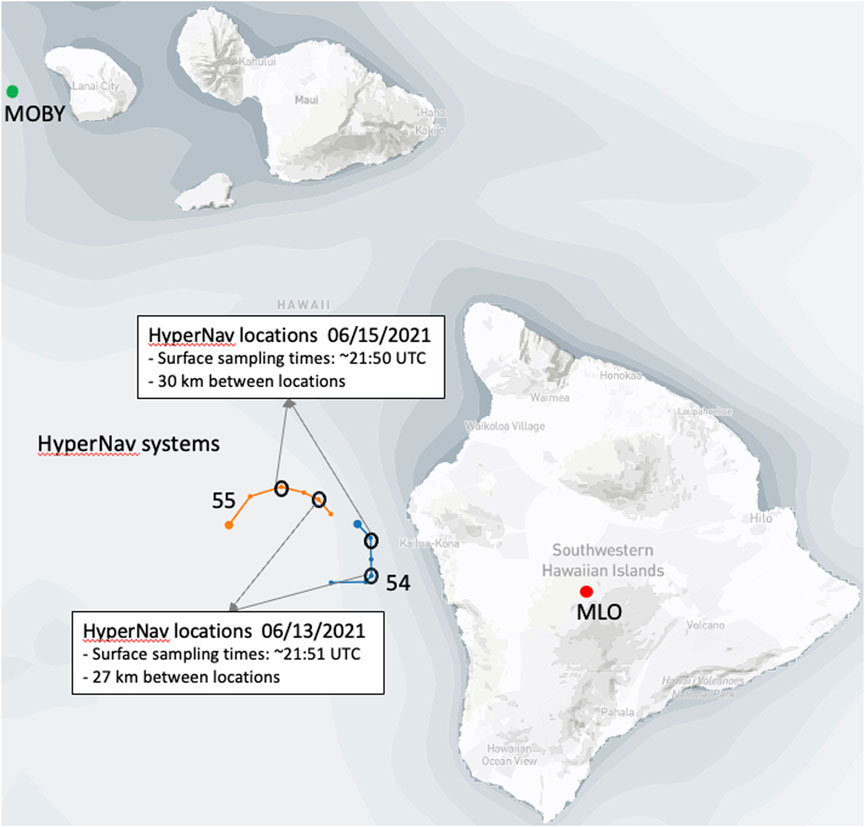
Figure 3. Map of deployment locations during the June 2021 HyperNav field campaign; site of the Marine Optical BuoY, MOBY, (green circle), Mauna Loa Observatory, MLO, (red circle), HyperNav float positions (orange circles/line for HyperNav 55, blue circles/line HyperNav 54). Locations of the HyperNav float systems on 16 June 2021 are also shown.
A HyperNav system operating in RT mode was deployed on an observing platform at the Mauna Loa Observatory, Hawaii on 20 June 2021. The primary objective was to evaluate the accuracy and uncertainty of the laboratory determined spectral wavelength registrations of the HyperNav radiance sensors using the Sun as the light source. A second objective was to develop and test methods for calibrating the HyperNav radiance sensors pre- and post-deployment that can be accomplished in the field. The MLO site offered significant advantages to test this method due to its high altitude, low aerosol content, and low variability in atmospheric properties. Importantly, it also provided a wealth of data on the atmospheric conditions (i.e., irradiance, aerosol concentration and type, relative humidity) to validate the approach. The approach used was based on the solar reflectance calibration technique described in Cattrall et al. (2002) adapted for estimating HyperNav spectral registrations. Briefly, a calibrated reflectance plaque was positioned below a HyperNav radiance sensor normal to the Hypernav radiance and measurements were made to collect the total (i.e., direct plus diffuse) spectral incident radiance. A fixture mounted to the HyperNav radiance face was used to reduce the in-air FOV to ensure the FOV was centered within the reflectance plaque and were constrained within the dimensions of the plaque. This was accomplished by using a lower reflectance material placed on the plague and changing its location until a reduction in the observed radiance was found. While the exact FOV of the sensor in this setup was not determined, every effort was made to ensure the radiance sensor was in the center of the plaque with at least 25% away from the plaque edges. The spectral sampling (∼0.41 nm and spectral resolution ∼2.2 nm) of the HyperNav radiance sensors offer the potential to resolve fine-scale spectral absorption lines (e.g., Fraunhofer lines) in the incident radiance associated with chemical elements in the solarsphere and the Earth’s atmosphere, and thus the spectral accuracy of the HyperNav radiometric sensors.
A series of radiance measurements were collected from 8:45 HST to 10:45 HST, with each set of measurements lasting ∼60 s in duration. Sky conditions on 20 June 2021 clear, with few cirrus clouds near the horizon. The mean total radiance spectrum at 10:16 HST is shown in Figure 4. This data was used to evaluate the spectral wavelength accuracy of the HyperNav radiance sensor by comparing the center wavelengths of eleven Fraunhofer lines (Figure 4) with the center wavelength of HyperNav that had the lowest radiance value near each Fraunhofer line. The mean wavelength difference was 0.23 nm with a standard deviation and standard error of 0.73 nm and 0.07 nm respectively. Considering that the spectral sampling of the HyperNav radiance (∼0.41 nm) is larger than the mean difference derived using the above method, we conclude that uncertainty in HyperNav spectral registration is low and meets the requirements for in-situ SVC measurements.
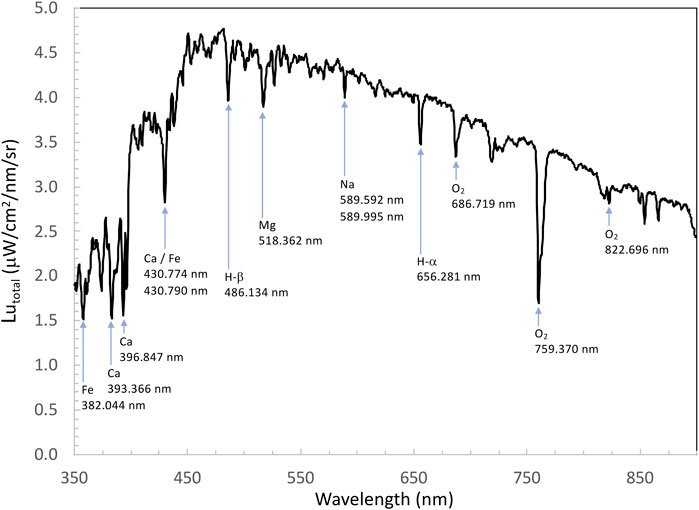
Figure 4. Mean total upwelled radiance spectrum obtained from a HyperNav radiance sensor at Mauna Loa Observatory on 20 June 2021 at 10:16 HST using the method described in section 3.1. Various Fraunhofer lines are also shown.
Two HyperNav float systems (54 and 55) were deployed west of the Island of Hawaii from 9 June 2021 to 20 June 2021. On 17 June 2021, both systems were recovered and were subsequently redeployed on 18 June 2021. The purpose of these deployments was to evaluate the accuracy of the radiance measurements of each system and between systems. Data collected on June 13 and 15, 2021 from the two HyperNav float systems were used to examine the surface upwelling radiance measurements. Recall that each HyperNav system has two independent upwelling radiance sensors, which allows for intra-comparisons of measurements, and as two HyperNav systems, inter-comparisons of HyperNav systems deployed in the same region. Below we present results of the surface upwelling radiance observations from HyperNav float systems 54 and 55 acquired on June 13 and 15, 2021 (Figure 3). Surface radiance measurements from the two floats systems on 13 June 2021 were collected at 21:50 UTC and 21:51 UTC for systems 54 and 55 respectively, with a 27 km distance between the two HyperNav systems sampling locations. Surface radiance measurements from the two floats systems on 15 June 2021 were collected at 21:53 UTC and 21:46 UTC for systems 54 and 55 respectively, with a 30 km distance between the two HyperNav systems sampling locations.
Pre-deployment calibrations for each of the individual radiance sensors (4 radiance sensors, two sensors per HyperNav system) were applied to the raw field data collected. As shown in Figure 2, the HyperNav float based system profiling sequence includes a near surface data acquisition sequence, typically collecting ∼1–2 min of radiance measurements while the system is at the surface. The surface data collected on June 13 and 15, 2021 off Kona, HI (Figure 3) from both HyperNav systems (∼50 samples, 1.5 min) were used to derive the mean upwelling radiance spectrum for each radiance head based on the following criteria: 1) include only Lu observations collected from depths shallower than 0.2 m depth, and 2) include observations with a measured platform tilt angle of
To accommodate spectral comparisons between two radiance sensors, the mean surface spectrum for each of the 4 radiance sensors was binned by wavelength to match the PACE OCI remote sensing reflectance center wavelengths using the OCI spectral weighting functions3. The mean surface upwelling radiance spectra were derived for each radiance sensor on each for the 2 days during the deployments off Kona, HI. We selected the radiance sensor with the highest mean spectra from each of the two HyperNav systems to use in the below comparisons (Figure 5) assuming that the lower values were due to partial shading of the other radiometer. We examined the relative and absolute differences of the mean upwelling radiance spectrum measured from each HyperNav system on each of the 2 days selected is presented in Figure 6. The mean spectral (373–700 nm) absolute relative difference is 2.02% and 0.1%) for June 13 and 15, 2021 respectively. The mean spectral (373–700 nm) absolute difference is 0.0085 μW cm−2 nm−1 sr−1 and 0.0124 μW cm−2 nm−1 sr−1 for June 13 and 15, 2021 respectively.
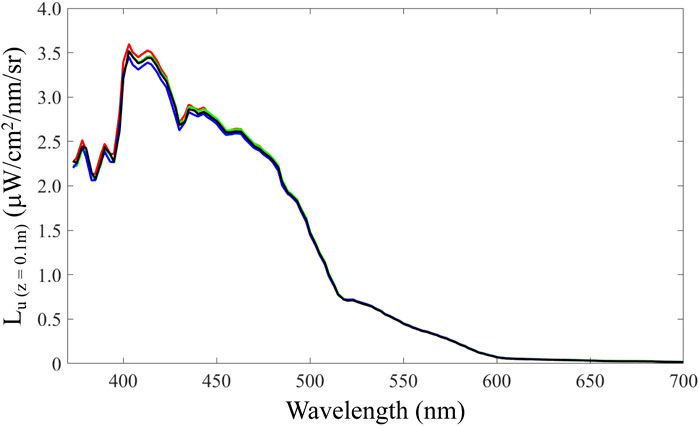
Figure 5. Mean near surface (z = ∼0.1 m) upwelling radiance spectrum obtained on June 13 and 15, 2021 from HyperNav systems 54 and 55 off Kona, HI. Spectral plots are for 13 June 2021 from HyperNav system 54 (red line) and 55 (green line), and 15 June 2021 from HyperNav system 54 (blue line) and 55 (black line) respectively. Data were binned to the NASA PACE OCI wavelengths in this figure.
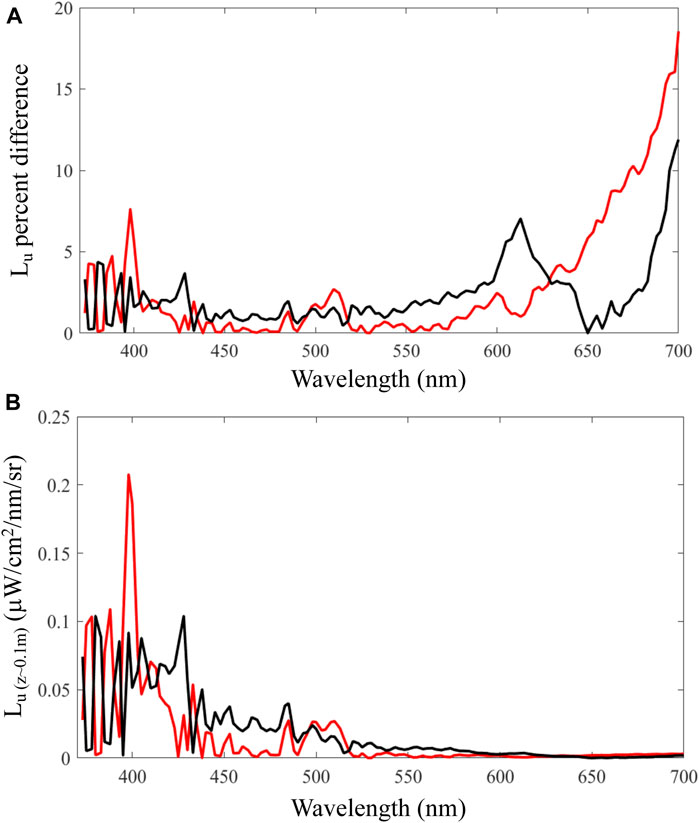
Figure 6. Comparison of the mean near surface (z ∼ 0.1 m) upwelling radiance spectrum obtained on June 13 (red line) and 15 (black line), 2021 from HyperNav systems 54 and 55 off of Kona, HI. (A) Absolute (unsigned) relative difference. (B) Absolute (unsigned) difference.
While the spectral relative and absolute differences shown in Figure 6 are very low, the largest differences are observed in two spectral regions, 370–400 nm and 600–700 nm. In the 370–400 nm region, note that several Fraunhofer absorption lines are very narrow and tightly spaced (see Figure 4), which contributes to the high spectral variability in the upwelling radiance in this region. Note that even with the 0.41 nm channel spacing of the HyperNav, slight errors (
As shown in Figure 5, the upwelling radiance spectra from each of the radiance sensors on each of the 2 days were very similar across both HyperNav systems, and thus, merited a comparison between the 2 days of observations. When comparing the mean spectral upwelling radiances across the 2 days (Figure 7), we find the derived relative and absolute spectral differences (unsigned) are 1.7% and 0.025 μW cm−2 nm−1 sr−1 respectively. We find these results to be highly encouraging in meeting the SVC in-situ criteria given that this comparison includes measurements from four independent upwelling sensors that two HyperNav systems collected on two separate days.

Figure 7. Comparison of the mean near surface (z ∼ 0.1 m) upwelling radiance spectrum between June 13 and 15, 2021 from HyperNav systems 54 and 55 off of Kona, HI. (A) Mean absolute relative difference. (B) Mean absolute difference.
We have accomplished the selection of components, build, and testing of a new hyperspectral field radiometer. The initial results show that HyperNav radiance radiometer has high spectral resolution, is portable, stable, with high accuracy. Field testing results suggest it is ready to be used for in-situ SVC for the PACE OCI sensor. Future work includes improvement to firmware to increase sampling frequency, improved integration with ancillary sensors, and accelerated telemetry.
Operating and maintaining a fleet of HyperNav systems will provide means to vicariously calibrate space-based sensors faster than previously possible by obtaining sufficient match-ups earlier. In conjunction with moored SVC facilities they could reduce the time needed to estimate the Ocean Color sensor gain from 2 years with matchups from a single site Franz et al. (2007) to a few months. While the focus of this paper has been to describe a new radiometric technology for obtaining high spectral resolution and accuracy upwelling radiance measurements for in-situ SVC, we envision these measurements will be useful for various studies that utilize ocean color hyperpectral imagery. Such applications include validation of SVC gain values over the OCI mission, atmospheric correction verification/improvement studies, as well as PACE satellite data product algorithm development and validation that utilize hyperspectral data.
The datasets presented in this study can be found in online repositories. The names of the repository/repositories and accession number(s) can be found below: Data from field deployments of the HyperNav float based system are available at https://misclab.umeoce.maine.edu/HyperNAV/.
AB: Conceptualization, Funding acquisition, Investigation, Methodology, Project administration, Writing–original draft, Writing–review and editing. EB: Conceptualization, Data curation, Investigation, Validation, Writing–review and editing. NH: Data curation, Formal Analysis, Investigation, Methodology, Validation, Writing–review and editing. CO: Conceptualization, Project administration, Writing–original draft. RF: Conceptualization, Investigation, Methodology, Validation, Writing–review and editing. JT: Formal Analysis, Investigation, Validation, Writing–review and editing. JK: Methodology, Software, Writing–original draft. MD: Formal Analysis, Investigation, Methodology, Writing–review and editing. DW: Conceptualization, Methodology, Writing–original draft. MM: Formal Analysis, Investigation, Methodology, Writing–review and editing. PC: Conceptualization, Methodology, Writing–review and editing.
The author(s) declare financial support was received for the research, authorship, and/or publication of this article. Funding for the HyperNav system has been provided by NASA’s Ocean Biology and Biogeochemistry program, from contract numbers 80GSFC20C0101 and 180GSFC22CA050.
The authors gratefully recognize and thank Ronnie Van Dommelen, Keith Brown, Burkhard Plache, Scott Feener, and Marlon Lewis, formerly of Satlantic LP for their many innovative contributions to the project which included the initial design, characterization and field testing of the HyperNav. Their contributions were seminal to successful development of the HyperNav system. We thank the staff of the Mauna Loa Observatory for providing logistic support, access to the site, and technical and scientific support. We thank Eric Rehm, Sea-Bird Scientific for useful comments in preparation and review of this manuscript.
Authors CO and DW were formerly employed by Se-Bird Scientific.
Authors JK and MD are employed by Sea-Bird Scientific.
The remaining authors declare that the research was conducted in the absence of any commercial or financial relationships that could be construed as a potential conflict of interest.
The author(s) declared that they were an editorial board member of Frontiers, at the time of submission. This had no impact on the peer review process and the final decision.
All claims expressed in this article are solely those of the authors and do not necessarily represent those of their affiliated organizations, or those of the publisher, the editors and the reviewers. Any product that may be evaluated in this article, or claim that may be made by its manufacturer, is not guaranteed or endorsed by the publisher.
1http://omtab.obs-vlfr.fr/SimulO
2https://github.com/OceanOptics/Inlinino
3https://oceancolor.gsfc.nasa.gov/data/pace/characterization/
Antoine, D., Guevel, P., Desté, J.-F., Bécu, G., Louis, F., Scott, A. J., et al. (2008). The “boussole” buoy—a new transparent-to-swell taut mooring dedicated to marine optics: design, tests, and performance at sea. J. Atmos. Ocean. Technol. 25, 968–989. doi:10.1175/2007JTECHO563.1
Brown, S. W., Flora, S. J., Feinholz, M. E., Yarbrough, M. A., Houlihan, T., Peters, D., et al. (2007). “The marine optical buoy (MOBY) radiometric calibration and uncertainty budget for ocean color satellite sensor vicarious calibration,” in Sensors, systems, and next-generation satellites XI. Editors S. Habib, R. Meynart, S. P. Neeck, and H. Shimoda (SPIE: International Society for Optics and Photonics), 6744. doi:10.1117/12.737400
Cattrall, C., Carder, K. L., Thome, K. J., and Gordon, H. R. (2002). Solar-reflectance-based calibration of spectral radiometers. Geophys. Res. Lett. 29, 1–4. doi:10.1029/2002GL015130
Franz, B. A., Bailey, S. W., Werdell, P. J., and McClain, C. R. (2007). Sensor-independent approach to the vicarious calibration of satellite ocean color radiometry. Appl. Opt. 46, 5068–5082. doi:10.1364/ao.46.005068
Gordon, H. R. (1998). In-orbit calibration strategy for ocean color sensors. Remote Sens. Environ. 63, 265–278. doi:10.1016/S0034-4257(97)00163-6
Haëntjens, N., and Boss, E. (2020). Inlinino: a modular software data logger for oceanography. Oceanography 33, 80–84. doi:10.5670/oceanog.2020.112
Leymarie, E., Doxaran, D., and Babin, M. (2010). Uncertainties associated to measurements of inherent optical properties in natural waters. Appl. Opt. 49, 5415–5436. doi:10.1364/AO.49.005415
Mueller, J. L. (2003). Ocean optics protocols for satellite ocean color sensor validation, revision 4: instrument specifications, characterization, and calibration. Tech. Rep.
Tan, J., Frouin, R., Häentjens, N., Barnard, A., Boss, E., Chamberlain, P., et al. (2024). Reconstructing hyper-spectral downwelling irradiance from multi-spectral measurements. Front. Remote Sens. 5. doi:10.3389/frsen.2024.1335627
Voss, K. J., McLean, S., Lewis, M., Johnson, C., Flora, S., Feinholz, M., et al. (2010). An example crossover experiment for testing new vicarious calibration techniques for satellite ocean color radiometry. J. Atmos. Ocean. Technol. 27, 1747–1759. doi:10.1175/2010JTECHO737.1
Werdell, P. J., Behrenfeld, M. J., Bontempi, P. S., Boss, E., Cairns, B., Davis, G. T., et al. (2019). The plankton, aerosol, cloud, ocean ecosystem mission: status, science, advances. Bull. Am. Meteorological Soc. 100, 1775–1794. doi:10.1175/BAMS-D-18-0056.1
Zibordi, G., Mélin, F., Voss, K. J., Johnson, B. C., Franz, B. A., Kwiatkowska, E., et al. (2015). System vicarious calibration for ocean color climate change applications: requirements for in situ data. Remote Sens. Environ. 159, 361–369. doi:10.1016/j.rse.2014.12.015
Keywords: ocean color remote sensing, system vicarious calibration, radiometry, hyperspectral, ocean optics, instrumentation
Citation: Barnard A, Boss E, Haëntjens N, Orrico C, Frouin R, Tan J, Klumpp J, Dewey M, Walter D, Mazloff M and Chamberlain P (2024) Design and verification of a highly accurate in-situ hyperspectral radiometric measurement system (HyperNav). Front. Remote Sens. 5:1369769. doi: 10.3389/frsen.2024.1369769
Received: 12 January 2024; Accepted: 07 June 2024;
Published: 28 June 2024.
Edited by:
Agnieszka Bialek, National Physical Laboratory, United KingdomReviewed by:
Giuseppe Zibordi, National Aeronautics and Space Administration (NASA), United StatesCopyright © 2024 Barnard, Boss, Haëntjens, Orrico, Frouin, Tan, Klumpp, Dewey, Walter, Mazloff and Chamberlain. This is an open-access article distributed under the terms of the Creative Commons Attribution License (CC BY). The use, distribution or reproduction in other forums is permitted, provided the original author(s) and the copyright owner(s) are credited and that the original publication in this journal is cited, in accordance with accepted academic practice. No use, distribution or reproduction is permitted which does not comply with these terms.
*Correspondence: Andrew Barnard, YmFybmFyYW5Ab3JlZ29uc3RhdGUuZWR1
Disclaimer: All claims expressed in this article are solely those of the authors and do not necessarily represent those of their affiliated organizations, or those of the publisher, the editors and the reviewers. Any product that may be evaluated in this article or claim that may be made by its manufacturer is not guaranteed or endorsed by the publisher.
Research integrity at Frontiers
Learn more about the work of our research integrity team to safeguard the quality of each article we publish.