 Romy Schlögel
 Karolina Owczarz
 Anne Orban
 Hans-Balder Havenith
- 1Signal Processing Lab, Centre Spatial de Liège, University of Liège, Angleur, Belgium
- 2Georisk and Environment Group, Geology Department, University of Liège, Liège, Belgium
- 3Earth Observation Applications Business Unit, Spacebel sa., Liège, Belgium
- 4Department of Geodesy and Geoinformatics, Faculty of Geoengineering, Mining and Geology, Wrocław University of Science and Technology, Wrocław, Poland
Introduction: This study aims to differentiate local and regional ground uplift, as well as sub-regional subsidence induced by groundwater level drawdown, which are possibly enhanced across fault structures, as monitored by various synthetic aperture radar interferometry (InSAR) processing methods. A buoyant mantle plume under the Eifel may be responsible for the regional ground uplift, including the Weser–Geul (BE) and South Limburg regions (NL), which could negatively affect the area proposed for the future Einstein Telescope.
Methods: Different InSAR processing techniques are compared to evaluate their limits in tracking fault structures on a time series of Copernicus Sentinel-1 images while detecting and measuring ground motion based on their phase signature. The results present an overall stable ground for the Euregio Meuse–Rhine region, especially at the Belgian–Dutch border, while tectonic activity is observed along the German side of the Rhine Graben.
Results: As the current neotectonic activity in the target area was not well known, we performed a spatiotemporal analysis of ground deformation associated with the presence of NW–SE-trending normal faults where karst also develops, as well as along the Variscan NE–SW-trending thrust faults. This work demonstrates that the identification of deformation hazards using satellite remote sensing (and connected seismological) techniques is challenging mainly due to (very) small regional scale deformation, terrain conditions, and SAR properties.
Discussion: Thus, the results mostly indicate ground stability over the area; however, also some agricultural activities were observed, as was deformation along some infrastructure such as railways. Displacements of millimetric order measured along the faults located near the Geul valley (BE) are probably related to old mining activities.
1 Introduction
Tectonic landforms in northeastern Belgium, located in the most seismically active region of stable Europe (Figures 1A, B) northwest of the Alps, are generally modest in stable plate interiors. However, it appears that the major faults marking the western edge of the Roer Valley Graben (RVG)—the Feldbiss and Heerlerheide faults—may extend toward the southeast into the central part of the Stavelot massif as far as the High Fens (Hautes Fagnes in French) ridge (Demoulin, 1988). The graben is bounded by the Peelrand fault to the northeast and the Feldbiss fault zone to the southwest, which are two active normal fault systems trending NNW–SSE (Camelbeeck et al., 2007). Until now, research conducted in the RVG has mainly been based on geophysical investigations, consisting primarily of electrical prospecting and tomography, seismic refraction, and ground-penetrating radar (GPR) (Meghraoui et al., 2000). An additional method that may be used in geophysical prospecting is high-resolution seismic reflection profiles (Demanet et al., 2000). These techniques, in combination with geological and geomorphological investigations, enable approximate positioning of the faults. In addition, remote sensing performed by ground scanning lasers provides additional information about slight ground movements, which are not otherwise detectable.
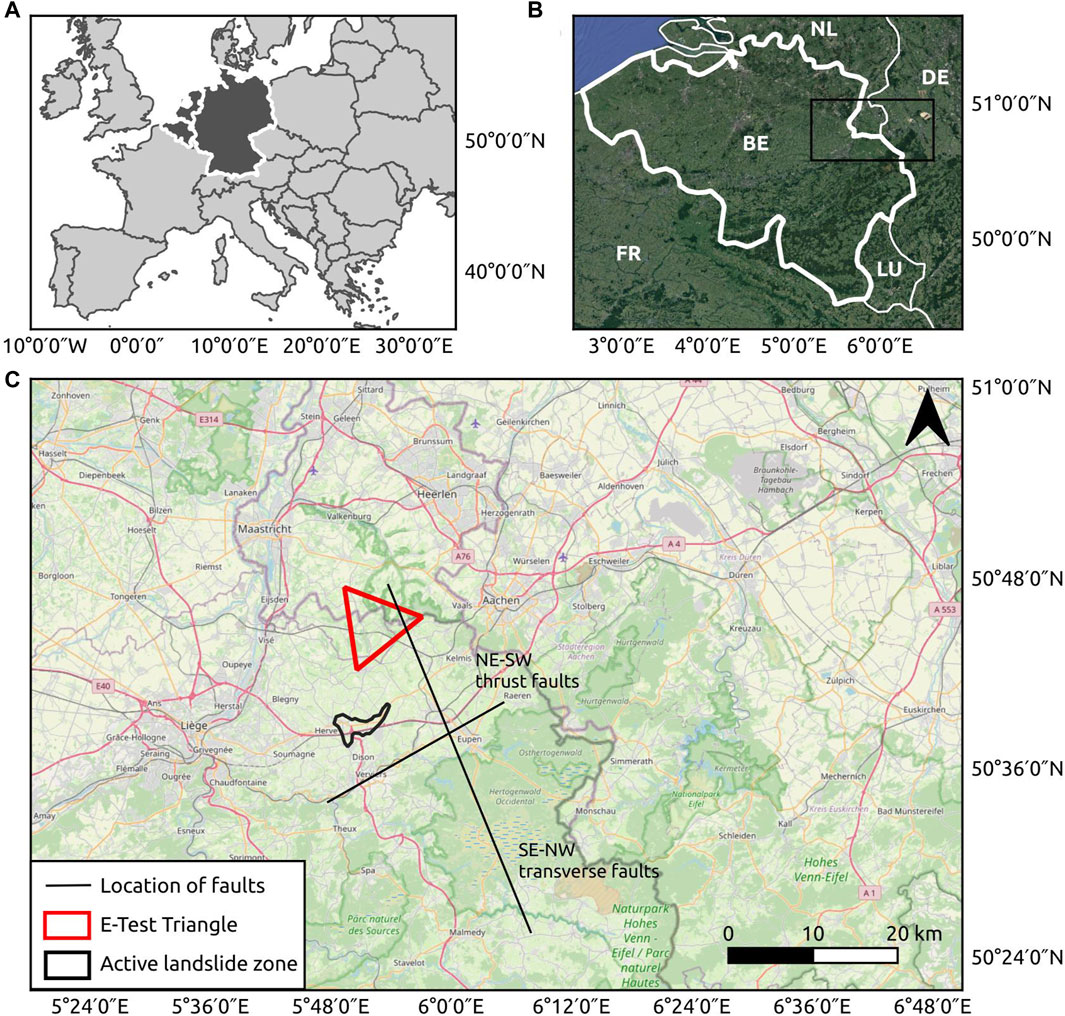
Figure 1. Research area located in Europe (A) on the border of eastern Belgium, western Germany, and southeastern Netherlands (B). Euregio Meuse-Rhine considered as a possible location of the ET Triangle (C).
Synthetic aperture radar (SAR) interferometry (InSAR) has been widely used to analyze Earth surface displacement processes such as landslides, subsidence, and volcanic and seismic phenomena (Gabriel et al., 1989). Modern-generation SAR satellites obtain a spatial resolution of several meters (e.g., Sentinel-1) with a revisit time of some days down to 24 h (e.g., Iceye), allowing the increasingly more reliable detection of differential displacements which can be used for monitoring and assessing the potential critical behavior of single structures or infrastructures (Talledo et al., 2022). Persistent scatterer interferometry (PSI) (Crosetto et al., 2016) and small baseline subset (SBAS) (Li et al., 2022) techniques allow us to estimate the projection of displacements in the line-of-sight direction—that is, the displacement component away or towards the sensor (according to ascending and descending orbits). High-precision (less than 1 cm) deformation monitoring and high accuracy in target georeferencing can be achieved using PSI (Ullo et al., 2019). Devleeschouwer et al. (2008) compared PSI to ENVISAT data between 2003 and 2010 with gravimetry measurements to reveal an uplift over NE Belgium. Recently, the European Gound Motion Service (EGMS) Ortho has provided harmonized information regarding natural and anthropogenic vertical and east–west ground motion phenomena resampled with a 100-m spatial resolution over Europe (Crosetto et al., 2020).
A less populated area in the western part of the RVG has been selected as a candidate to accommodate, at a depth of 250 m, the future triangular Einstein Telescope (ET, with side lengths of 10 km) which will observe gravitational waves. Before an international jury decision in 2025, many criteria must be considered when selecting the site, including geology, hydrogeology, societal aspects, and the lifetime and cost of the ET. Geological conditions are difficult to establish over the large scale of the telescope. Three transverse fault zones are observed in the north of the Pays de Herve (BE), around the potential ET area (Figure 1C): 1) the Eupen faulting zone stretching from the Gueule Valley in the Pays de Herve to the flanks of the Pannensterzkopf on the High Fens crest; 2) the Baelen faulting zone stretching from the Gulp valley in the NW to the western slope of the Botrange peak of Belgium in the southeast; 3) the Hockai fault zone (HFZ), which forms the western boundary of the vast network of transverse Neogene and Quaternary faulting activity (Demoulin, 1988; Camelbeeck et al., 2000). The HFZ in the south of the ET region produced the largest known earthquake in Northwest Europe: the 1692 Verviers earthquake with a magnitude of about 6.3 (Camelbeeck et al., 2000). The NW–SE trending normal–transverse faults could be seismically active while the NE–SW trending thrust faults are old (Variscan) inactive structures. Kreemer et al. (2020) suggested that uplift observed in this region could be related to a buoyant mantle plume under the Eifel. The latter could indeed be responsible for the regional ground uplift, including the Weser–Geul (BE) and South Limburg regions (NL), and thus could also affect the area selected for the future ET installation.
The activity of the HFZ is also marked by the presence of numerous slow-moving landslides in the Battice (Herve) region (Demoulin and Collignon, 2000; Demoulin et al., 2003; Demoulin and Glade, 2004; Demoulin and Chung, 2007) and by a series of aligned but not continuous NW–SE oriented scarps (related to the aforementioned transverse faults) that can be found between the Battice and Malmedy regions—the most pronounced being the 150-m-long and 20-m high Beverce scarp adjacent to an old massive landslide (Mreyen et al., 2018). The seismic activity of faults in the eastern ET area is not well-known, but widespread karst phenomena and the “Calamine-type” (Pb-Zn) mineralization of faults in the Gueule Valley (between La Calamine and Plombières) at least hint at the presence of numerous tectonic structures (Dejonghe and Boni, 2005). North of the area of interest (AOI), fault reactivation induced in 1936 by coal mining caused a 0.34–0.4-m vertical displacement of the base of the plough layer at the Heerlerheide fault, part of the southern boundary fault system of the Roer graben—the Feldbiss fault zone (Van Balen et al., 2021).
This study performed a detailed analysis along the numerous normal (and, partly, also strike-slip) faults crossing the ET area, focused on the Herve–Aubel–Voeren–Geul region in Belgium and in South Limburg, the Netherlands. The main hypothesis assumes that most of these faults are not considered active, which has been confirmed by remote sensing (InSAR techniques) and ground-based observation before the implementation of integrated geodetic reference stations (IGRSs). An IGRS consists of a GNSS receiver and two InSAR corner reflectors (for ascending and descending tracks) installed on the same deeply founded monument (Ketelaar et al., 2020). The advantage of IGRSs is that the accuracy of leveling, GNSS, and InSAR deformation estimates can be directly cross-validated because the measurements refer to the same monument and therefore reflect the same cause of deformation. This scientific contribution also aims to answer these principal research questions. Can both PSI and SBAS techniques differentiate local and regional ground uplift and sub-regional subsidence, possibly enhanced across fault structures? Do old mine activities also influence the observed displacement patterns? According to Vervoort and Declercq (2018), local features such as geological faults can have a secondary effect on the local variation of the uplift. The processes of subsidence and uplift are based on completely different mechanisms: are faults observed in AOI aseismic or SAR sensor resolutions not able to detect such small displacements? In comparison, clearly visible neotectonic deformation will be analyzed and inferences will be made according to the detectability of Earth surface displacements according to their possible origin(s).
2 Materials and methods
This research focused on determining surface deformation using SAR interferometry and geomodeling in the transborder Meuse–Rhine region. The Figure 2 shows the individual stages of workflow. The next subsections describe in detail the data used and their processing, enabling the development of 3D visualization.
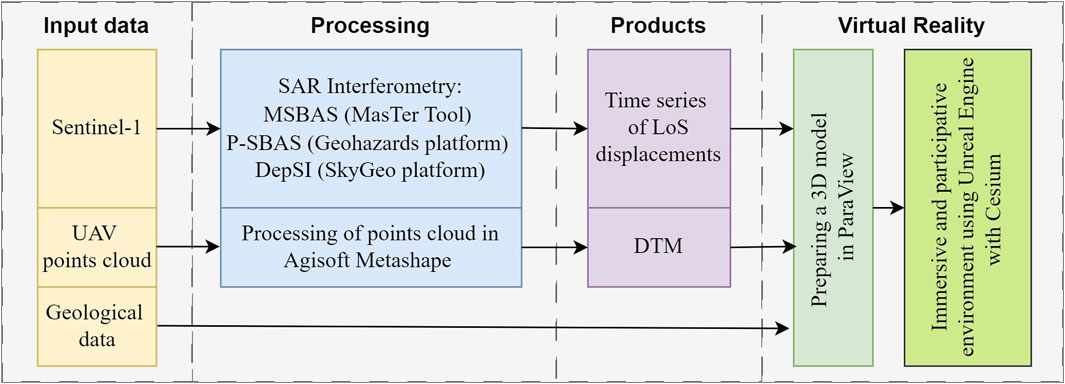
Figure 2. Proposed research workflow.
2.1 Geospatial data
Temporal series of C-band data have been made freely available by the joint ESA/EU Copernicus Program; the Sentinel-1A/B (S1) satellite system, composed of two satellites flying in the same orbit (693 km altitude) with 180° separation, provide a revisit time of 6 days (12 days for a single satellite). Both are equipped with a C-band SAR (5.405 GHz, 5.56 cm wavelength), although Sentinel-1B stopped operating in December 2021. The default acquisition mode over land is the interferometric wide swath (IW) mode which covers a swath of 250 km with a spatial resolution of 5 m × 20 m. Satellite imagery (Single Look Complex product) between 2016 and 2022 was used in this research. Sentinel-1 imagery provides popular satellite data due to its widespread availability. An alternative to this data may be the COSMO-SkyMed mission, which also monitors the entire globe but using X-band.
The initial digital terrain model (DTM) of Wallonia has a 1-m spatial resolution and accuracy of 0.12 m. LIDAR acquisitions were made between 2013 and 2014. LIDAR DTM was then acquired between 2021 and 2022 with 0.5 m spatial resolution and the same accuracy as the earlier DTM. LIDAR DTMs represent the ground elevation of a given area and exclude all features located on the ground surface (buildings, bridges, vegetation, vehicles, etc.). LIDAR DTMs are not characterized by smooth coverage. The DTMs are freely available on Walloon Geoportal (https://geoportail.wallonie.be/).
Geodata (baselines, geological map, fault zones, karst inventory, digital elevation models, etc.) are stored on a geoserver available for the E-Test (https://www.etest-emr.eu/) project, made accessible by Liege University (ULiege). Geophysical and seismological data are collected and processed by colleagues at the Geology Department., ULiege. Orthophotographs covering Belgium in 2021 are available by the Public Service of the Walloon region under license.
2.2 Synthetic aperture interferometry techniques
Algorithms from the two classes of techniques, PSI and SBAS, have been proposed for comparing ground movement monitoring by multi-temporal DInSAR. Ascending and descending S1 data were processed using the InSAR automated Mass Processing Toolbox for Multidimensional Time Series—MasTer (d’Oreye et al., 2019). MasTer was used to produce line of sight (LoS), up-down, and east-west deformation maps. It is based on the combination of CIS (CSL InSAR Suite) and MSBAS SAR interferometry software (Derauw et al., 2019), while the results are derived from complex and unsupervised processing. SAR coherence images were stacked to calculate average values, extract values below 0.3, and apply a mask to discard deformation values for these decorrelated areas (mostly in forested locations). In addition, a double difference approach between the time series of two points was used, which allows noise from common sources such as the atmosphere to be reduced and the influence of the reference region for the time series to be eliminated (Derauw et al., 2020). The main principle of this approach is to subtract the “moving point” from the reference point to better understand and interpret the physical direction of the relative ground displacement. In double difference, what we detect is always a relative displacement of one point with respect to the other. Considering the reference as fixed is only a hypothesis that may, in fact, be completely false. The common noise between the points is subtracted, and thus, the double difference process allows a better interpretation of the results. Eliminating the noise can reveal very useful information about the behavior of the detected deformations. Double difference also allows the detection of the faint displacement of one point with respect to the other. In this study, the double difference was used to determine the ground deformation behavior over time for points located along faults and railways. The data time series for the extracted points were obtained from the MasTer platform.
PSI processed with the Delft PS-InSAR processing package (DePSI) (Van Leijen, 2014; Yang et al., 2017) were exported from the SkyGeo platform (https://maps.skygeo.com). The results of Declercq (2020) obtained from the Stanford Method for Persistent Scatterers—StaMPS (Ferretti et al., 2000) processing chain using ENVISAT and ERS data were compared over the AOI, but too few PSI were obtained to make any clear statement. Both approaches differ in terms of PS density and distribution. These two differences are largely because StaMPS performs well in barren terrain in non-urban areas that are subject to non-linear deformation and do not have man-made structures, whereas DePSI performs better in urbanized, more cohesive areas where there are anthropogenic objects. The Geohazards platform (GEP) allowed us to extract DInSAR results from the P-SBAS (Parallel Small Baseline Subset) algorithm developed by CNR-Irea (Cigna and Tapete, 2021).
Sentinel-1 images in ascending (track #88) and descending (#37) modes from 2016/05 to 2022/08 were considered for MSBAS processing. DepSI ascending and descending LoS velocities were recorded between 2017/10 and 2022/10 on based S1 imagery. P-SBAS results for S1 images are available as continuous feature layers (e.g., heavy.csv files) from GEP. P-SBAS LoS deformation maps from S1 were created for a short period between 2021/01/01 and 2021/07/24 and between 2020/12/29 and 2021/07/03 in ascending (#88) and descending (#37) tracks, respectively.
2.3 3D geomodeling
First, measurements were made over Plombières using a Mavic 2 Enterprise Dual UAV to acquire a dense point cloud. The UAV-based dataset was used to create a smooth high-resolution orthophotograph and digital elevation model in Agisoft Metashape Professional Edition Version 2.0 software. For the surface type, “High field (2.5D)” was chosen, while the parameter “Face Count: Low” was selected to create about 12 million faces. Various tests were then performed to determine the optimal texture for the best visual quality. “Mapping mode: Keep uv” generates a texture atlas using current texture parametrization and is the one that allows the most homogeneous color over the covered area. The “Blending mode: Average” concerns the build of an orthomosaic, uses the weighted average value of all pixels from individual photos, and is the most optimal for maximum color coverage. We also used “Enable hole filling” to avoid a “salt-and-pepper” effect because this mode interpolates surrounding colors in areas where the texture atlas has a hole.
After this, ParaView and Cesium for Unreal enabled us to prepare a 3D geomodel of Plombières (south of ET) which could also be visualized in a virtual environment. While all layers had been previously analyzed in GIS, ParaView 5.11 (https://www.paraview.org) was used to select appropriate features’ symbology and translations, enabling the visualization of InSAR results in a 3D environment. Whilst raster SBAS results were draped over the basemap to provide a geospatial overview of the deformation patterns, PSI-based 1D displacement vectors have been projected into a 3D plan according to the following unit vector:
where θ is the incidence angle (about 36° for descending and 38° and ascending tracks) and α is the azimuthal angle (100,33° for ascending and 260,11° for descending tracks) of our Sentinel-1 data.
We then accessed the Cesium for Unreal plugin, which combines the 3D geospatial capability of Cesium with the high-fidelity rendering power of Unreal Engine, unlocking the 3D geospatial ecosystem with APIs that represent a full-scale high-accuracy WGS84 globe. Formerly, geomodels and projected data with particular symbologies were integrated into Cesium for Unreal to enable a larger (in scale) and smoother (in resolution) visualization, including a high-performance photogrammetry-based geomodel to enable multi-scale result interpretation.
3 Results
3.1 Regional-scale deformation
The multi-temporal InSAR results obtained by the different methods are presented at both regional and local (e.g., fault, infrastructure) scales. MSBAS LoS deformation maps are represented in Figure 3 with ascending and descending tracks.
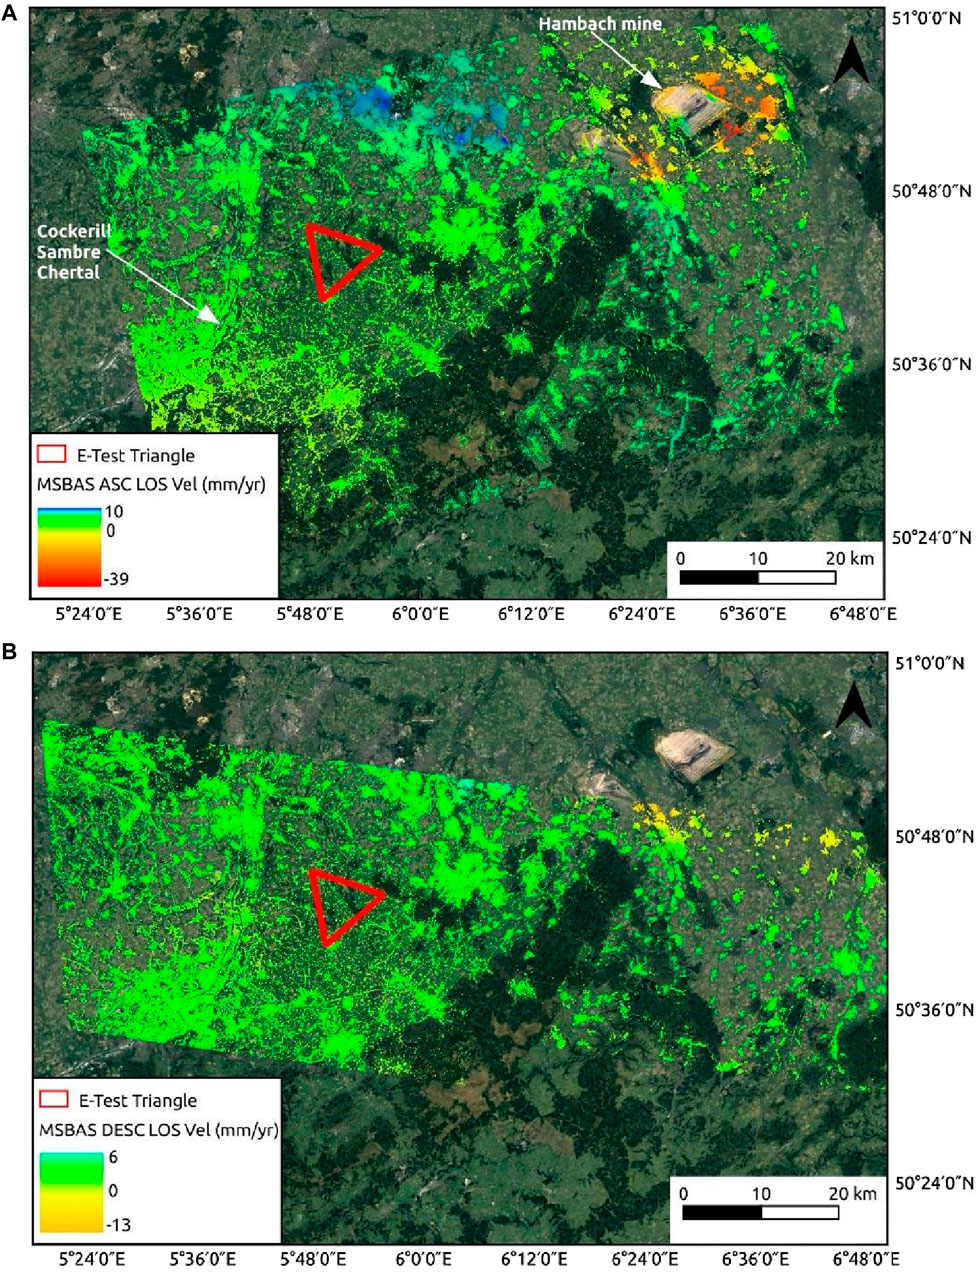
Figure 3. MSBAS results over the entire area according to ascending (#88) (A) and descending (#37) (B) tracks for 2016–2022 with the possible ET location in red.
The results do not consider areas below a coherence threshold of 0.3, mostly located in highly vegetated areas. The coherence threshold was adjusted to the research area by analyzing the coherence values in vegetated areas. It was thus determined that a threshold of 0.3 would enable the separation of places with weak coherence and would allow masking of the InSAR results. MSBAS results in ascending track (Figure 3A) show higher velocities due to the nearly parallel uplift direction in the NW–SE-oriented RVG (∼14 km northwards to the AOI) with LoS changes of 10 mm/year, while descending LoS changes barely reach 6 mm/year in this area (Figure 3B).
In addition, positive LoS values—about 3 mm/year in both ascending and descending tracks—corresponding to backfills are visible at the Cockerill Sambre Chertal, BE (located 12 km westward of the AOI; see local scale analysis later). Obviously, the strongest negative LoS velocities—going away from the satellite—corresponding to subsiding lands are observed around the Hambach mine in Niederzier and Elsdorf, GE (located 42 km north-east of the AOI) with peaks of 42.5 mm/year and 20.3 mm/year in ascending and descending tracks, respectively. MSBAS deformation rates are below 2 mm/year in the AOI and are therefore not significant according to the technique uncertainty.
While P-SBAS results are available as continuous feature layers (e.g., heavy.csv files) from GEP, we reclassified them to enable a clear visualization. P-SBAS LoS deformation maps from S1 taken between 2020/12/26 and 2021/07/24 and between 2020/12/23 and 2021/07/03, in respective ascending (#88) and descending (#37) tracks, are represented in Supplementary Figure SA1. In the ascending results, positive LoS values—representing motion toward the satellite—are observed in the north of the AOI, sparsely in the south, and in the Roer Valley Graben, which could possibly correspond to an uplift (in the north) and a backfill in the Hambach mine. P-SBAS results in the ascending track show high negative velocities—corresponding to movement going away from the satellite—in the south of the mine (east of the AOI) with LoS values of about −50 mm/year. In the descending P-SBAS results, LoS values reach −54 mm/year in this mine area, and positive LoS values of 50–74 mm/year may correspond an uplift in the Pays de Herve region (southwest of the AOI). Velocity ranges are higher than the MSBAS results.
The DepSI results cover a much smaller area than the PSBAS and SBAS results because the SkyGeo platform does not provide measurements for Germany. The maximal positive observed displacement is 38 mm/year and negative 48 mm/yr while average displacement rates in the AOI (considering coherent scatterer of high quality between 0.9 and 1) are around 1–2 mm/year (Supplementary Figure SA2). Displacement rates of more than 2 mm/year occur sporadically both inside and outside the ET triangle. The velocities below 2 mm/year are in the order of magnitude of measurement technique uncertainty (Fattahi and Amelung, 2015) but must be checked by comparing close neighbors and assessing the noise level.
3.2 Local-scale deformation along faults
This section shows the local scale of ground deformations on the faults which cross or are in the vicinity of one possible ET triangle location. Time-series analyses were performed along the Gueule, Gulp, and Heerlerheide faults (Figure 4). Within this research, we assumed that the Gulp fault splits into two branches because the southern branch may be different according to our geophysical surveys. Therefore, we henceforth use the name “Hombourg fault” for this branch.
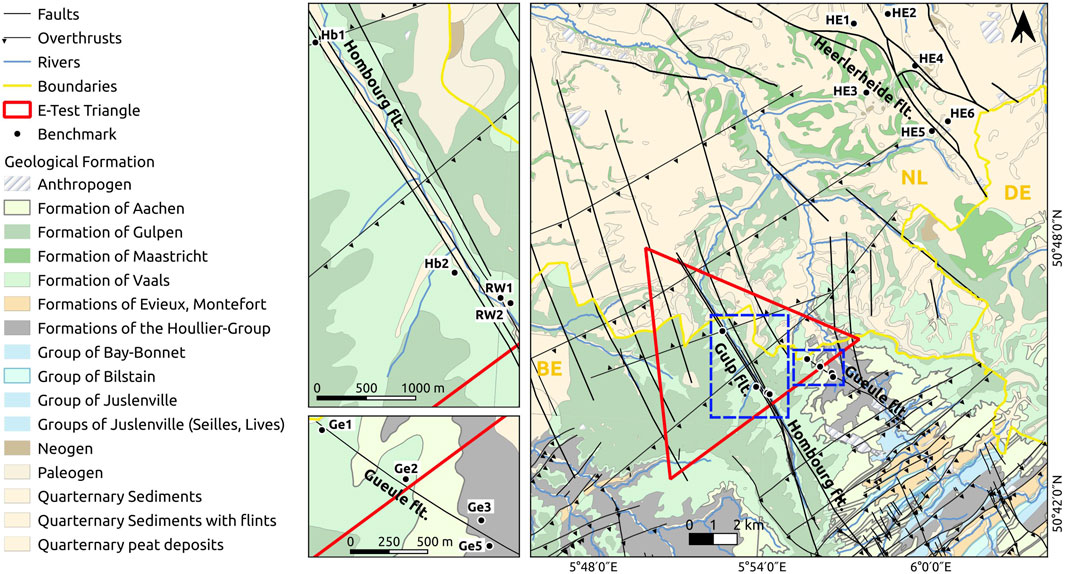
Figure 4. Geological context of the transborder Meuse-Rhine region.
3.2.1 Multi-temporal analysis along faults crossing the ET
As presented in the introduction, the ET location is crossed by two faults named the “Geul” or “Gueule fault” (to the east) and the “Gulp fault” (in the center). Figure 5 presents how the Gulp fault affects the Vaals and Gulpen geological formations as well as the LoS velocity rates according to various InSAR methods. As represented in Figure 4, the fault may be divided into two branches according to geomorphological interpretations, while the national geological map prefers to represent the western branch diverging in Hombourg village. LoS velocity rates were extracted according to these two hypotheses (Figures 5A–D; Table 1). While all the methods record the same order of magnitude with variations due to the different period and reference point considered, positive values are mainly observed to the north and negative values to the south.
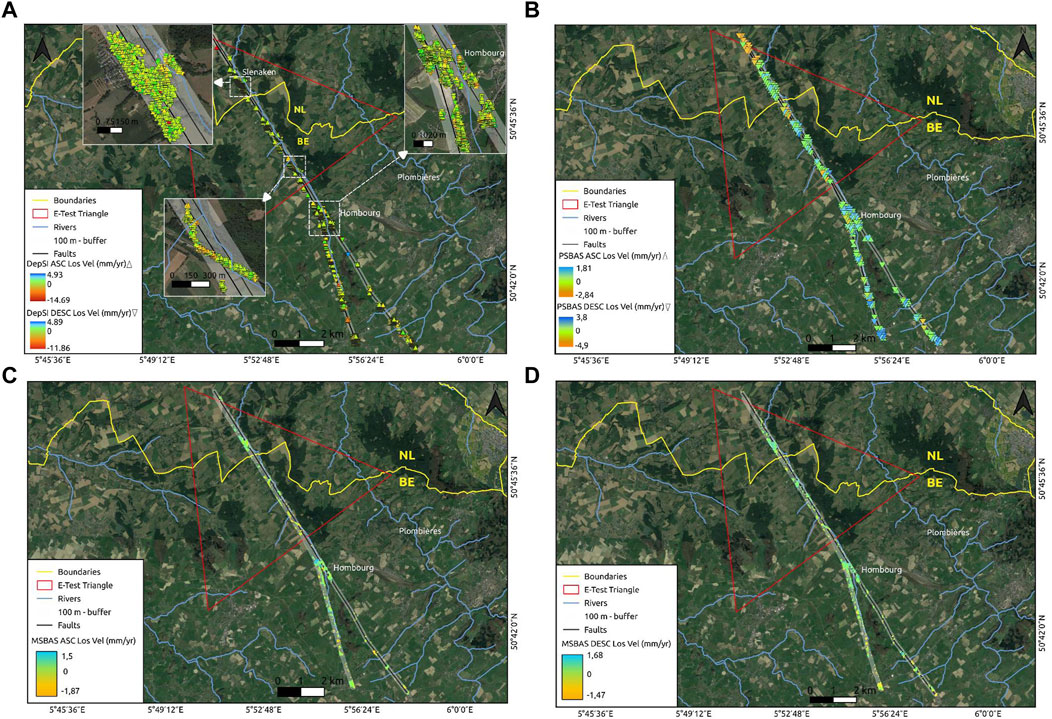
Figure 5. Comparison of InSAR results extracted along Gulp fault with Sentinel-1 (S1) images from 2017/10 to 2022/10 using DepSI (A); S1 images processed in ascending track between 2021/01/01 and 2021/07/24 and descending between 2020/12/29 and 2021/07/03 using P-SBAS (B); S1 reprocessed with MSBAS between 2016/10 and 2022/08 in ascending (C) and descending (D) tracks.
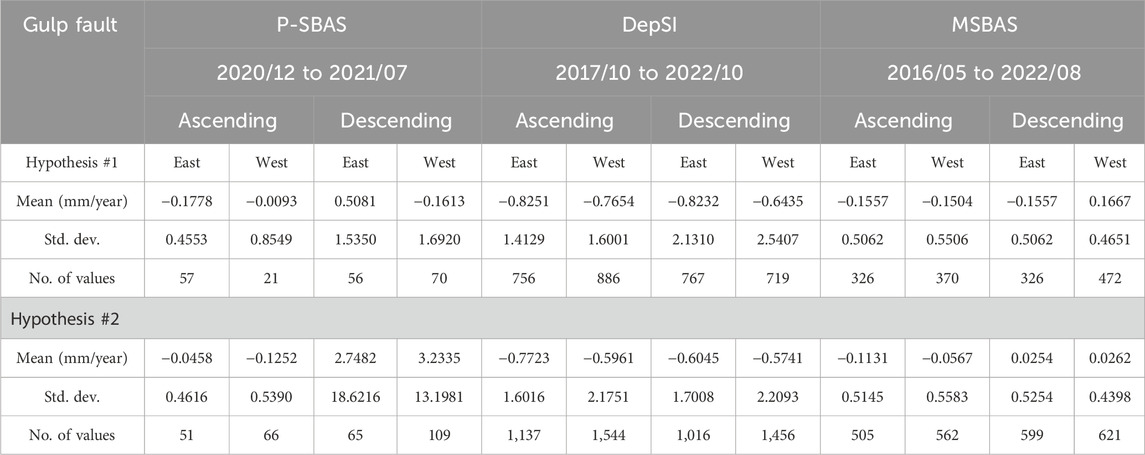
Table 1. Comparison of InSAR results observed on eastern and western sides of possible Gulp faults.
DepSI linear velocities along the Gulp faulting are the highest, with ranges of 4.89 to −14.69 mm/yr (Figure 5A). It is interesting that, even if this normal fault had a sub-vertical dip, the highest positive values corresponding to uplift are observed in the west of the western fault branch—possibly corresponding to a foot wall—while the highest negative values are visible on the eastern side, located to the north (supposing it may refer to the hanging wall if this deformation is not anthropogenic). P-SBAS results reveal more negative values to the south and more positive values to the north (Figure 5B). While MSBAS maps (Figures 5C, D) may also confirm more positive values visible to the western side of the Gulp fault whereas negative values are seen in the eastern side, mean values are very close to 0 according to the descending track which shows more vertical deformation.
Table 1 clearly reveals that the DepSI results count an equivalent number of coherent points to the MSBAS results for the ascending track (considering coherence values above 0.3) but less with respect to the descending track. On the other hand, the PSBSA results are characterized by a much lower number of points than the DepSI and MSBAS methods.
As part of the Eupen faulting zone (Figure 4), the Gueule fault in the Pays de Herve (BE) may also be seismically active (Demoulin and Collignon, 2000). As in Hombourg, some InSAR results (Figures 6A–D) show that highest positive values (corresponding to uplift) are observed in the west of the western fault branch—perhaps corresponding to a foot wall—while the highest negative values are visible on the eastern side, located in Plombières. For instance, DepSI results reveal that negative values between −4 and −7.09 mm/yr are all located in the east of the Gueule fault (Figure 6A), which is confirmed by lower mean values to the east in both the ascending and descending tracks (Table 2).
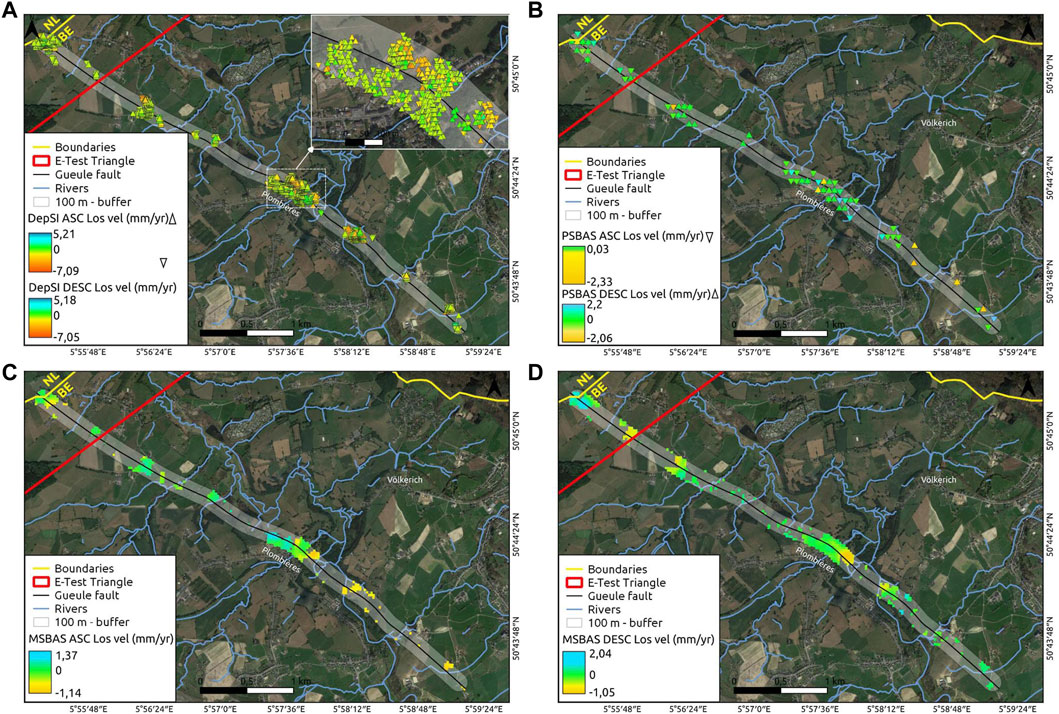
Figure 6. Comparison of InSAR results extracted along the Gueule fault with Sentinel-1 (S1) images from 2017/10 to 2022/10 using DepSI (A); S1 images processed in the ascending track between 2021/01/01 and 2021/07/24 and descending between 2020/12/29 and 2021/07/03 using P-SBAS (B); S1 reprocessed with MSBAS between 2016/05 and 2022/08 in ascending (C) and descending (D) tracks.
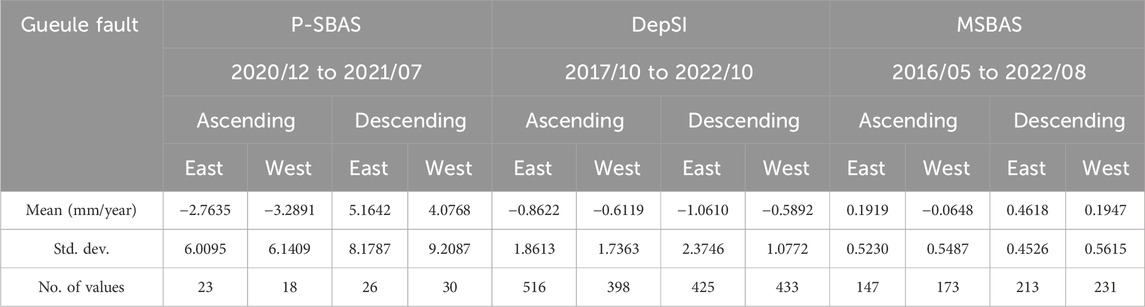
Table 2. Statistical analysis of LoS values extracted within a 100-m buffer along the Gueule Fault.
At this stage, we suggest calculating the relative double difference (RDD) of displacements to estimate relative deformation over two points (e.g., Hb1 and Hb2; RW1 and RW2; Ge1 and Ge3 or Ge5). The location of the extracted points for analysis is shown in Figure 4. Time series of LoS displacement values show different trends over time. Changing regression lines (with a pw_fit piecewise regression) detected with a Bayesian information criterion (BIC) enables selection of the model which better represents the set of data points corresponding to specific InSAR techniques in double difference.
In double difference, what we detect is always a relative displacement of one point with respect to the other. Considering the reference as fixed is only a hypothesis that may, in fact, be completely false. Within the RDD analysis, we assumed that the second benchmark in each pair is the reference benchmark (Hb2, RW2, Ge3, and Ge5). Generally, the RDD plots (Figure 7) show that MSBAS results are more concentrated around the BIC regression line than the DepSI results.
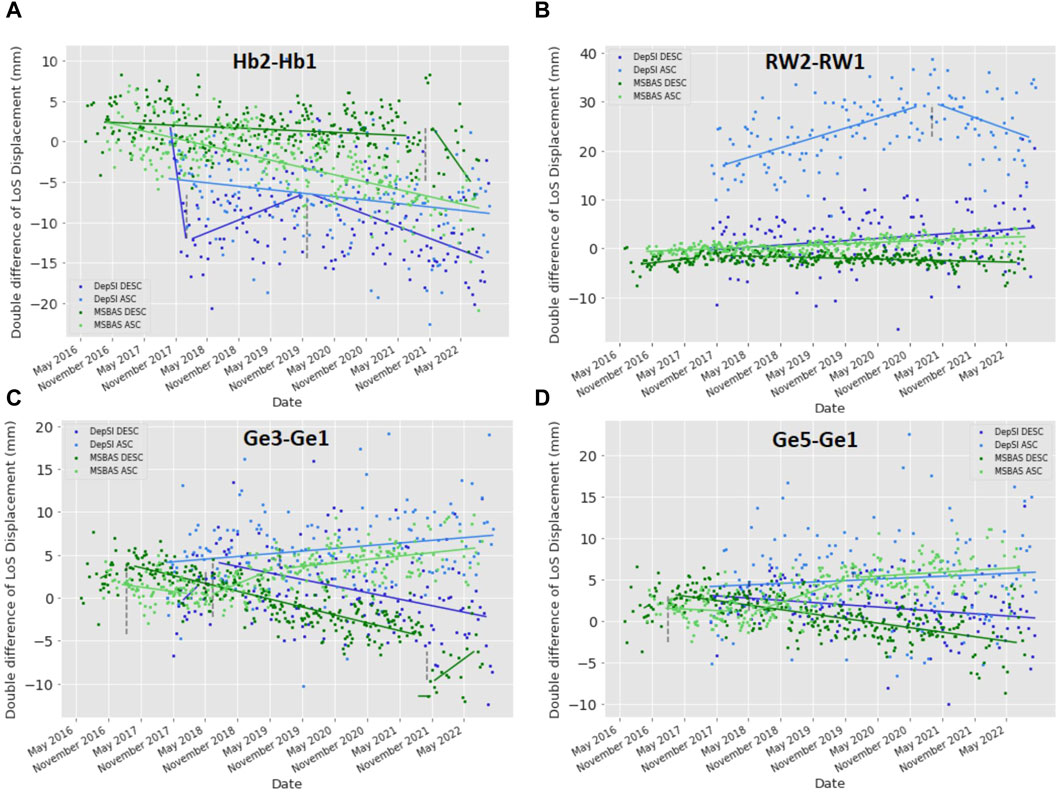
Figure 7. Comparison of LoS time series calculating relative double differences of displacement between benchmarks in the ET AOI: Hb2 and Hb1 located in the south and center of the AOI, respectively (A); RW2 and RW1 in the railway located in the south of the AOI (B); Ge3 and Ge1 located on the Netherlands border and in the south of the AOI in Plombières (C); Ge5 (located in the south of the AOI) and Ge1 (D).
In the case of benchmarks located along the Hombourg fault, the regression line for the MSBAS results and the DepSI ascending path suggest subsidence of the Hb1 relative to the Hb2 benchmark (Figure 7A). The changing trend is characterized by the regression line for the DepSI results: a descending path. The situation is different for benchmarks RW1 and RW2 (Figure 7B). We observe a slight uplift of the RW1 benchmark in relation to the RW2 benchmark. In the regression line for the DepSI results, the ascending path significantly differs from the other methods. The different trends of DePSI descending for Hb2-Hb1 and ascending for RW1-RW2 may be due to the location of the benchmark (vegetation area) that was selected for the analysis. The last two plots refer to benchmarks located in the Gueule fault area. The results of the double difference in both cases look almost the same. The ascending paths are characterized by the uplift of the Ge1 benchmark in relation to the Ge3 (Figure 7C) and Ge5 (Figure 7D). On the other hand, descending paths suggest a subsidence of the Ge1 benchmark in relation to the reference benchmarks Ge3 and Ge5. Based on these plots, it is not possible to identify the main trend of displacements benchmark Ge1.
LoS displacement velocities of the analyzed benchmarks along the Hombourg and Gueule faults are less than −2 mm/year. The Hb1 benchmark has lower velocities than the Hb2 benchmark (−1.95 to −1 mm/yr, DepSI and MSBAS, respectively). The maximum LoS displacement value for RW1 is −3.8 mm/year and for RW2 is −1.92 mm/year, which were calculated using the DePSI method. The values for the Ge1 benchmark range from −0.78 (DepSI) to 1.37 mm/year (MSBAS). On the other hand, the Ge2 benchmark is characterized by smaller velocity fluctuations, from −0.81 mm/year (DepSI) to −0.03 (MSBAS), than the Ge1 benchmark. Ge5, the last benchmark, has positive values of 0.74 to 0.97 mm/yr (MSBAS) and negative values of −0.54 to −0.47 mm/yr (DepSI) depending on the method used.
3.2.2 Multi-temporal analysis along the Roer Valley Graben
As a comparison with the north-east of the ET AOI, the faults observed in the RVG are characterized by seismicity, scarps, and displaced fluvial terraces, revealing that they are active. The RVG includes the Heerlerheide Fault (Figure 4), which is also part of the Feldbiss fault zone (FFZ). Coal mining in this region in the 19th and 20th centuries caused general subsidence, sinkholes, and faults. The occurrence of one of the induced fault scarps at the Heerlerheide fault location suggests that the upper part of the fault was reactivated by exploitation (Van Balen et al., 2021).
We also calculated the double difference for the points along the Heerlerheide fault (Figure 8). The benchmarks HE1, HE3, and HE5 were reference benchmarks within this analysis. In the case of a double difference between HE2 and HE1, MSBAS and DepSI regression lines have shown a similar trend, which remains at almost the same level, but PSBAS results show the opposite trend (Figure 8A). Results for ascending paths reveal larger double difference values and faster growth rates over time. The HE2 benchmark uplifts with respect to the H1 benchmark. The double difference calculated between HE4 and HE3 is characterized by the regression lines in the MSBAS and DepSI (only descending path) methods presenting a similar rate and direction of growth (Figure 8B). The regression trend for the DepSI method–ascending path is comparable to the rest of the results, but the observations reach lower values. On the other hand, the PSBAS results show a trend opposite the other results. However, considering the similarities in the MSBAS and DepSI results, it can be concluded that benchmark HE4 uplifts in respect to HE3. In the last plot, it is not possible to clearly identify the displacement direction of the benchmark HE6 in relation to the benchmark HE5 (Figure 8C). MSBAS results–descending path and PSBAS results show a positive trend for a HE6–HE5 double difference. The ascending paths for both the MSBAS and DePSI methods alternate between uplift and subsidence. On the other hand, the regression line for the DepSI method–descending path is characterized by the same value of velocities over time.
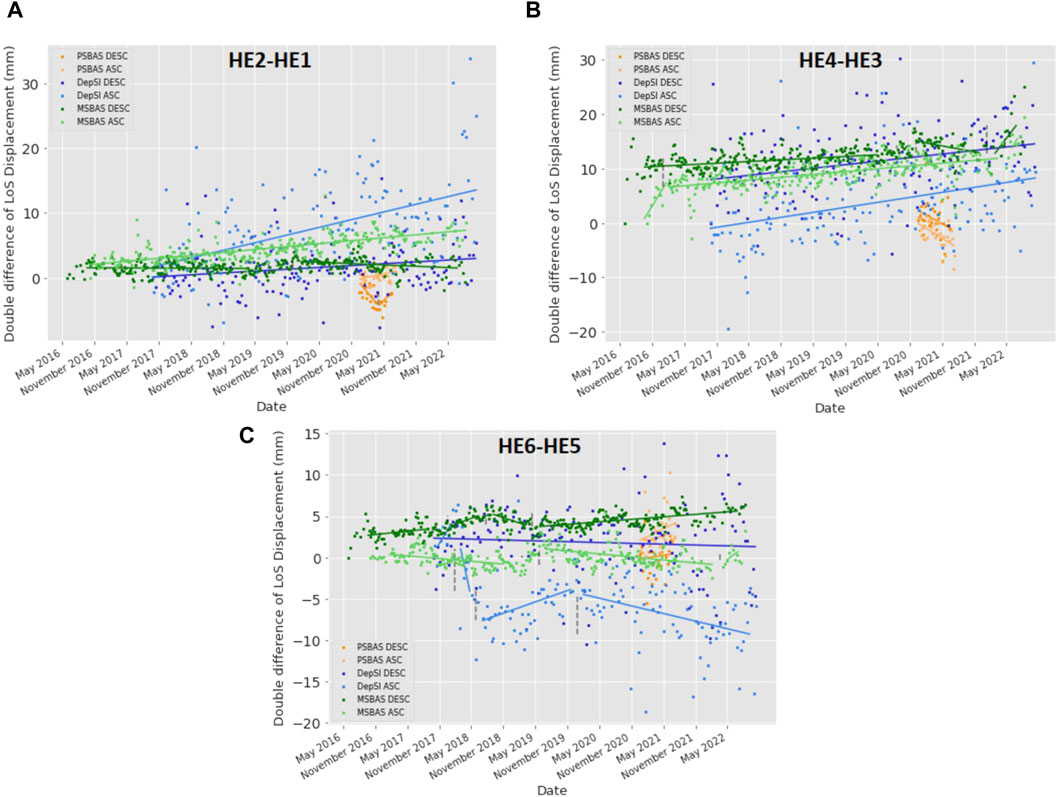
Figure 8. Comparison of LoS time series with relative double differences of displacements between benchmarks along the Heerlerheide fault in the Netherlands. Plots regarding double differences between HE1 and HE2 (A), HE3 and HE4 (B), and HE5 and HE6 (C).
In general, the LoS displacements are characterized by positive values. We observed that the benchmark HE2 (city of Heerlen) has the highest displacement rate of 5 mm/year (MSBAS). Other benchmarks reach velocities in the range of 1 to 4 mm/year. In the case of the DepSI results, the displacement velocities are >3 mm/year. We observed that the footwall with the benchmarks HE2 (8 mm/year, PSBAS), HE4 (5 mm/year, MSBAS), and HE6 (8 mm/year, MSBAS) are clearly uplifted compared to the other benchmarks. The behavior of the points on the hanging wall of the fault is not unambiguous: the HE3 and HE5 benchmarks do not have a dominant displacement trend (the occurrence of uplifts and subsidence). Only for the HE1 benchmark were dominant positive displacement rates observed (6 mm/year, PSBAS).
3.3 Signs of anthropogenic activity
Whilst the C-band sensor may also contribute to an assessment of the potential critical behavior of single structures or infrastructures, railways (Poreh et al., 2016; Nettis et al., 2023) were also analyzed in the AOI (Figure 9A). In the north of Remersdaal (BE), a strong deformation signal has been observed, especially with DepSI results (Figure 9B). In fact, the maximum displacement rates are −11.65 and −14.71 mm/year for the ascending and descending tracks, respectively (Figure 9B; with mean values of −1.01 and −1.31 mm/yr; Table 3), corresponding to a downward deformation and potential critical behavior on this section of the railways. MSBAS results (Figures 9D, E) show an alteration of positive and negative results on this section of the railways, while the mean LoS value is positive in the descending track (Table 3). It is also interesting that P-SBAS results (Figure 9C) barely show any sign of activity over a short time.
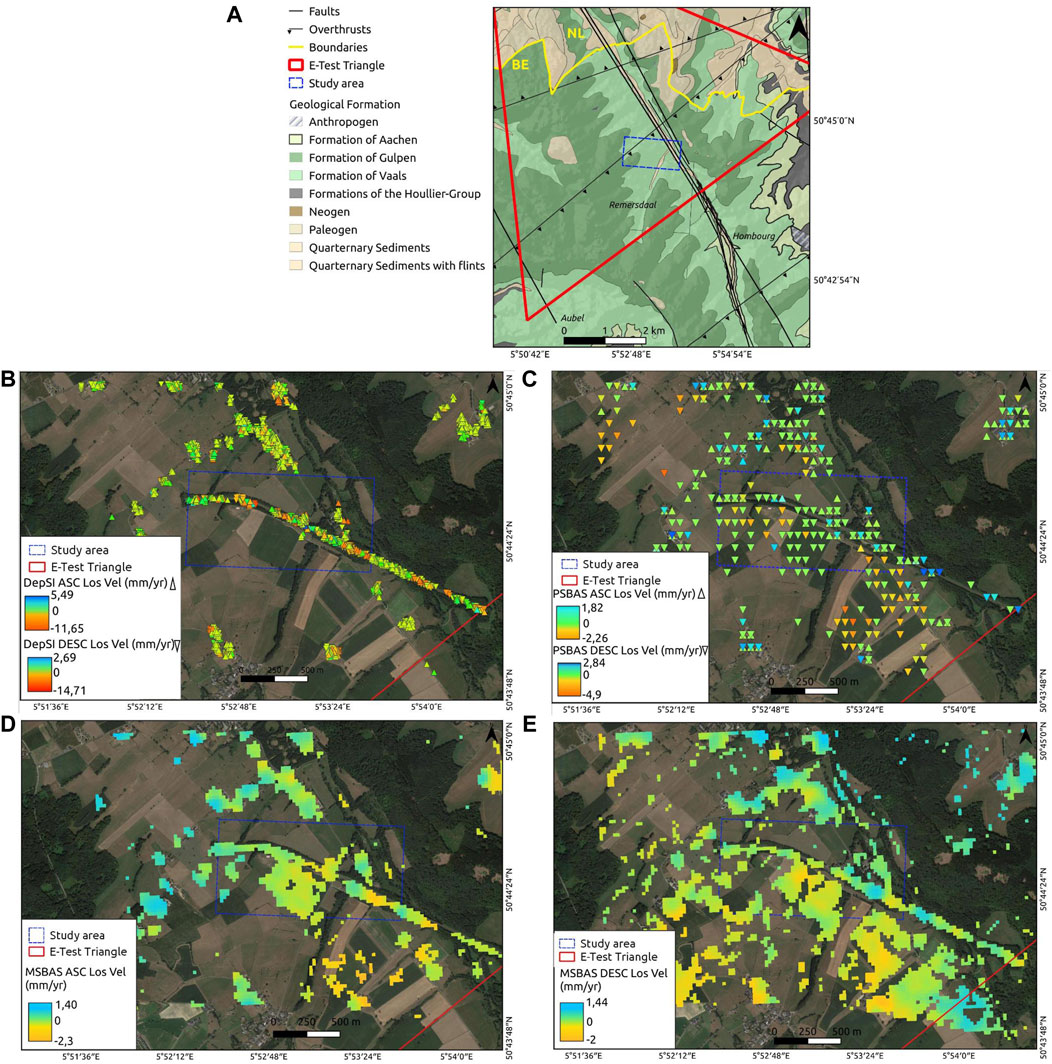
Figure 9. Comparison of InSAR results of railway north of Remersdaal (BE) represented in its geological context (A) with Sentinel-1 (S1) images from 2017/10 to 2022/10 using DepSI (B); S1 images processed in the ascending track between 2021/01/01 and 2021/07/24 and descending between 2020/12/29 and 2021/07/03 using P-SBAS (C); S1 processed with MSBAS between 2016/05 and 2021/08 ascending (D) and descending (E) track.
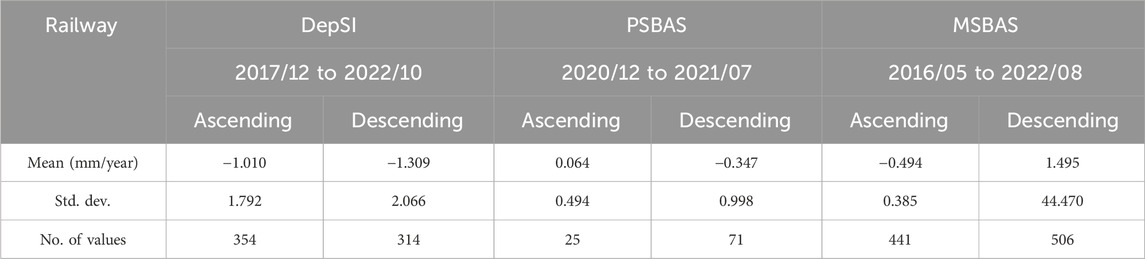
Table 3. Comparison of InSAR results observed on railways in the middle of the potential Einstein Telescope site.
3.4 Landslide hazards
An active landslide zone is located southwest of the Einstein triangle, in the Pays de Herve in the Battice region (Figure 10A), which is intersected by the HFZ in the Rechain fault. This region is located on the Vaals Clay Formation, under which lie the Upper Cretaceous Aachen Sands. The probable date of landslide initiation is about AD 150 in the wettest period of the Holocene. However, the spatial distribution of the deep landslides and their proposed mechanism strongly suggest a strong seismic influence due to the activation of a fault related to the HFZ (see lateral extent of HFZ in Figure 10A) (Demoulin et al., 2003).
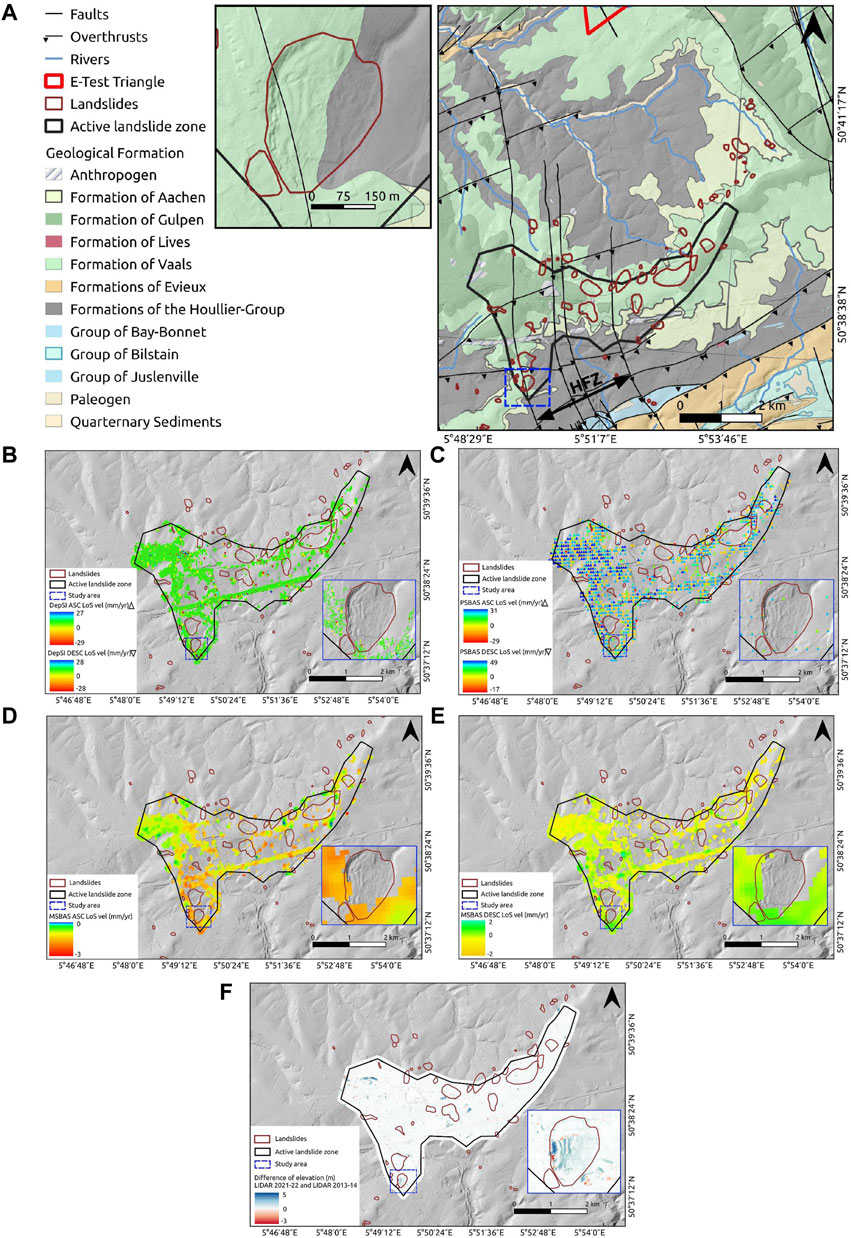
Figure 10. Comparison of InSAR results of active landslide area (see also lateral extent of HFZ) in the Battice region (Belgium) (A) with Sentinel-1 (S1) images from 2017/10 to 2022/10 using DepSI (B), S1 images processed in the ascending track between 2021/01/01 and 2021/07/24 and descending between 2020/12/29 and 2021/07/03 using PSBAS (C); S1 processed with MSBAS between 2016/05 and 2022/08 in ascending and descending (D,E) tracks; difference of elevation LIDAR 2021–2022 and LIDAR 2013–2014 (F). See also insets in (B–F) located by blue rectangle in maps (A–F)] with respective results for the Manaihant landslide zone.
InSAR results are shown in Figures 10B–E. For the MSBAS results on both the ascending and descending tracks, displacement rates of less than 3 mm/year were observed in the period 2016–2022 and are therefore not significant according to the technique uncertainty and high decorrelation terrain properties (covered by changing grassland and bushes) (Figures 10D, E).
The situation is similar for the DepSI results from both tracks for 2017–2022 because the largest number of observations is in the range of −2 to 2 mm/year (Figure 10B). According to this method, the maximum velocity rates were equal to 28 and −29 mm/year (between 2017 and 2022), whereas MSBAS results did not record significant observations. The results of the P-SBAS ascending track are prevailingly displacement rates below 1 mm/year for 2020–2021 (Figure 10C). In the same places, the displacement velocities range from 16 to 32 mm/year but for the descending track. The PSBAS velocity ranges are higher than the MSBAS and DepSI results.
Two LIDAR DTMs were also analyzed in this area: the first for 2013–2014 and the second for 2021–2022. The difference in elevation from these LiDAR DTMs showed significant deformation within the Manaihant landslide (Figure 10F). In the remaining landslides, we observed no changes in height. The western part of the Manaihant landslide shows accumulated materials with a maximum height of 5 m. The material accumulates along parallel lines, meaning that the landslide is moving westward.
In summary, the areas covered by the InSAR results do not indicate increased activity (uplift, subsidence) in the Battice region. The coherence values at the landslide sites were too low (<0.30) to consider these results reliable. The main reason for this may be that landslides are covered by vegetation, which is a limitation of InSAR methods or too-rapid rates of landslide movement. However, the difference in LiDAR DTMs has identified Earth surface deformation of up to 56 cm/year, revealing the activity of the Manaihant landslide and its surroundings.
3.5 Interpretation of ground displacements in a 3D environment
Representing the InSAR deformation in a 3D environment (Figure 11) requires a proper projection of the PSI displacement vectors, while raster SBAS results were draped over the basemap to give a geospatial overview of the deformation patterns.
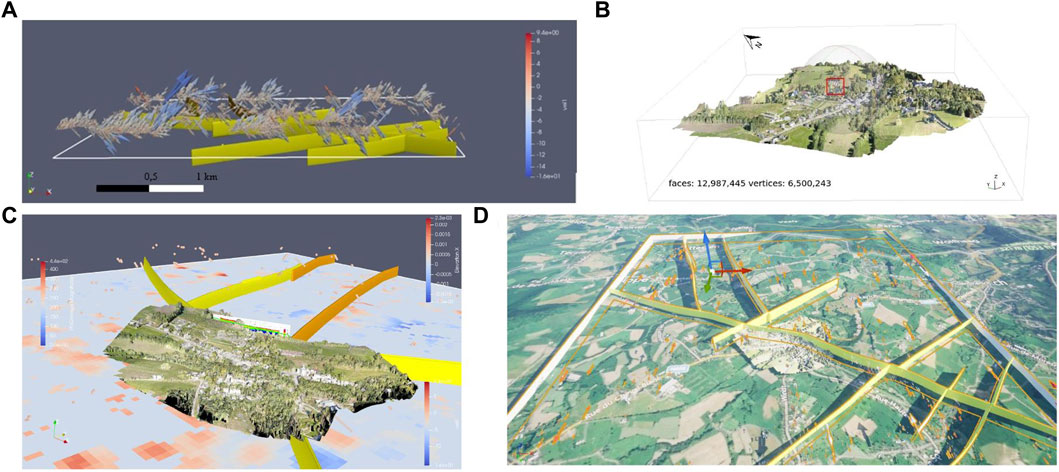
Figure 11. 3D geomodel construction. Projected 1D LoS velocities from InSAR results (e.g., from DepSI) into a 3D geomodel in Paraview (A); UAV-based 3D DEM/ortho (B); 3D geomodel update (C) immersive and participative environment using Virtual Reality—Unreal Engine with Cesium (D).
The geolocated and projected data were then integrated into Cesium for Unreal Engine (UE; Figure 11D). The data in the virtual environment enabled larger-scale and smoother resolution of the visualization, according to which the results were interpreted. Whilst interpreting the deformation field often appears difficult when considering the one-dimension LoS direction, the 3D geomodel and virtual environment prepared with UE seem a good solution to understanding the 3D deformation pattern (Supplementary Figure SB1). We defined symbols for individual vectors and raster layers (Supplementary Figure SB1A). In addition, we prepared a draft menu which included the different layers to be selected for visualization (Supplementary Figure SB1B). The arrows represent LoS displacements, and their color indicates the method by which the ground deformations were calculated. The length of the arrow characterizes the magnitude of the LoS displacement. The up or down direction of the arrow signifies uplift or subsidence, respectively.
Although navigating with a proper headset would be more fluid and quicker for locating points of interest, our keyboard allows us to explore the different tiles showing upward and downward deformation vectors which may go in opposite directions according to the InSAR results considered (Supplementary Figure SB1B). The behavior of LoS displacements indicates that most vectors point east. Preliminary analyses reveal upward LoS vectors near the Gueule fault (Supplementary Figure SB1C).
In addition, we analyzed the horizontal displacement EW component of the deformation based on the MSBAS results for the location of both IGRSs in Plombieres. Ground deformations in a predominantly eastward direction were observed.
4 Discussion
This research conducted a detailed analysis along the numerous normal (and partly also strike-slip) faults crossing the ET area focused on the Herve–Aubel–Voeren–Geul region in Belgium and in South Limburg, the Netherlands. We focused on the following areas: the Gueule and Gulp faults in the Pays de Herve (BE), the Heerlerheide fault (NL) in the RVG, the railway north of Remersdaal (BE), and an active landslide zone in the Battice region (BE). In all areas, ground deformations were studied based on the results of the InSAR technique—particularly the PSI, MSBAS, and PSBAS methods.
Significant positive regional deformations were observed in the RVG area, where the displacement velocities were up to 10 mm/yr. This deformation signal may be related to the numerous geological faults in this area. Cuenca et al. (2013) used SAR data—ERS-1, ERS-2, and Envisat—and the PSI technique and observed most of the graben uplifts with respect to adjacent horsts at velocities of 1 mm/yr in the Roer graben (1992–2010). In addition, they linked the appearance of a larger uplift signal of approximately +4 mm/year in space and time with the cessation of pumping in the Erkelenz coalfield, adjacent to the RVG. Camelbeeck and Meghraoui (1998) concluded that tectonic activity in the RVG appears relatively stable, at least in the last 150 kyr. Within the regional scale deformation, we detected maximum negative LoS displacements in the open-pit area of the Hambach mine of about −40 mm/yr. In comparison, Tang et al. (2020) detected subsidence greater than −500 mm/yr for 1 year (2017/2018) over reclaimed areas based on the SBAS technique and Sentinel-1 and TerraSAR-X images. As the main factor of subsidence, they indicated a process of compaction of waste materials. In the ET triangle, we did not observe significant displacement velocities (i.e., around 2 mm/yr) and the values were similar in all InSAR results.
Analysis of InSAR results along the Gulp fault (which could split in two near the village of Hombourg) showed that points in the north are uplifting while points in the south are subsiding. This was also confirmed by the results obtained in the calculation of the double difference made for the benchmarks Hb1 and Hb2, whereas the highest positive values were observed to the west of the western fault branch, possibly indicating a foot wall (Figure 4). Annual velocity rates of the benchmarks extracted along the Gueule and Gulp faults were less than −2 mm/yr—an insignificant value. However, by comparing the velocity values for the extracted benchmarks along the faults, it can be seen that the Gulp fault (Hb1 and Hb2) near Hombourg is characterized by slightly higher annual velocities than the Gueule fault (Ge1, Ge2, and Ge5) (Table 4).
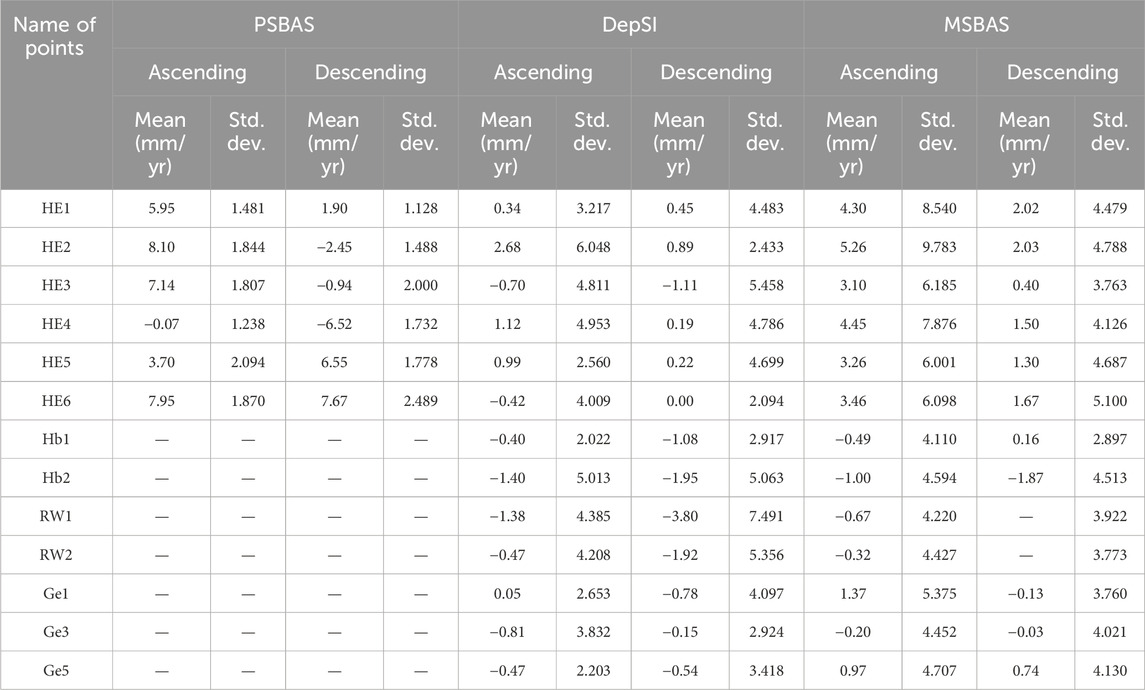
Table 4. Comparison of InSAR results observed on extracted benchmarks inside and outside of the potential Einstein Telescope site.
A railway line passes through the Gulp fault, from which we extracted two points for analysis (RW1 and RW2). The maximum deformation rates were −3.8 mm/yr in the RW1 benchmark, which subsided faster than the RW2 benchmark (Table 4). Our time series analyses based on InSAR results along the Heerlerheide fault indicated that its eastern face is uplifting at a velocity of up to 8 mm/yr (Table 4). In the case of the western wall, the main LoS displacement trend was not identified. Based on the MSBAS results, we concluded that the displacement rates decrease towards the south. According to Van Balen et al. (2021), the vertical coseismic displacement of the youngest event was around ∼0.25 m (17–15 ka), while the estimated moment magnitude is around 6.2. Additionally, the Heerlerheide fault experienced a mining-induced vertical offset of about 0.4 m in 1936 (Heitfeld et al., 2016). In interpreting the results for the Heerlerheide fault, it should be emphasized that, from the end of the 19th century to the first half of the 20th century, coal was mined south of the Feldbiss fault zone. Van Balen et al. (2021) indicated that the upper part of the fault was reactivated by deep exploitation. This phenomenon highlights the fact that a fault is a zone of structural weakness. Moreover, according to Pöttgens (1985), Caro Cuenca et al. (2013), and Vervoort (2016), re-flooding of the mines after their closure caused a regional rebound that continues to the present. The InSAR time series analysis confirmed the presence of uplifts in the studied region. This rebound counters only a fraction of the mining which had induced subsidence, is gradual, and is not confined to the former mining concessions (Heitfeld et al., 2016). It is worth noting that the fault has not been reactivated during the re-flooding of the mines and the resulting surface rebound; however, this could happen because the rebound is still ongoing. Considering individual benchmarks along the faults, we noticed that the Heerlerheide fault is characterized by higher velocity rates than the Gueule and Hombourg faults when considering the MSBAS method (Table 4). However, the DepSI method shows the calculated velocities at a similar level. The InSAR results obtained are very small and could be described as insignificant; therefore, we cannot find increased seismic activity in the analyzed faults, especially Heerlerheide and Gueule as old mining activity may be responsible for the observed deformation.
In the Battice area, displacements of less than 3 mm/yr were observed based on InSAR results for 2016–2022. According to Preuth et al. (2010), some dormant landslides in this region have been reactivated by anthropogenic activities such as highway construction, suburban development, or construction of industrial sewer pipes. Unfortunately, the inability of InSAR to analyze ground deformation hazard may be explained by two reasons. First, it could be due to too-high movement rates, which the InSAR technique cannot detect because visible steady-state displacements are limited until 2.8 cm—half the wavelength of C-band radar wave (Yang et al., 2017). The second reason is the vegetation coverage (combined with the absence of “stable” built-up areas) within the landslides, which induces signal temporal decorrelation.
The first reason is documented by the Manaihant landslide example, which proved to be active over recent years, while no meaningful difference in phase values could be obtained. Moreover, the difference between the LIDAR DTMs indicates a continuous uplift in the upper (western) part of the landslide related to a 5 m high (anthropogenic) deposit accumulated over 9 years (2013–2022), corresponding to a displacement rate of around 56 cm/yr. The Manaihant landslide activity had been studied by researchers such as Demoulin et al. (2003), who had also identified earlier partial landslide reactivation with episodic movements since 1980, at a mean rate of ∼20 cm/yr. Demoulin and Glade (2004) found that most landslides have been inactive for many years in the Battice area. Only the Manaihant landslide had been massively reactivated, by heavy rains on 14 September 1998. This included damage to two buildings, allocated close to the newly formed 1.5-m-high scarp above the old head scarp.
5 Conclusion
InSAR techniques allowed us to detect regional and local ground deformations, revealing trends in the behavior of the LoS velocity rates. During the study period, velocities of approximately 2 mm/yr were observed in the ET Triangle area, which are insignificant due to the measurement uncertainty of the InSAR techniques themselves. Even the faults crossing this area did not show significant displacements, which confirms the initial hypothesis of their low seismotectonic activity. Therefore, we consider the main area of interest as being relatively stable. Nevertheless, the integrated geodetic reference stations (IGRSs) installed in February 2023 in Plombières (province of Liège, Belgium) enabled continuous high-accuracy monitoring of ground deformation to confirm that related signals are anthropogenic. These two stations are located on either side of the Gueule fault—one on the library side (PBLB) and the other on the cemetery side (PBCM). The IGRS was developed and installed within the project “Ground Deformation from Meteorological, Seismic and Anthropogenic Changes Analysed by Remote Sensing, Geomatic Experiments and Extended Reality—GERMANE” (Living Planet Fellowship program). Additionally, constant monitoring here will enable comparison of the IGRS results with other measurement methods such as InSAR. In the case of the RVG–Heerlerheide fault, the detected deformations seem due to the influence of former mining activity, probably combined with seismic activity. It should also be emphasized that, in the Battice area, the main deformation (proven only by comparison between high-resolution DEMs of different recent ages with velocities too large for InSAR methods) is related to the active Manaihant landslide.
Based on our research, we concluded that the main hypothesis regarding the low seismotectonic activity (of recent and present times) of faults located in eastern Belgium has been confirmed using the PSI and SBAS techniques. InSAR techniques do have some limitations: 1-D displacement recorded, computational algorithm and SAR properties, and a lack of results due to the vegetated land cover and in areas where deformation velocities are too fast (e.g., Battice landslide). There are several important aspects to highlight when comparing PSI and SBAS results. PSI and SBAS measure different processes: displacements of coherent points at specific locations vs. spatially distributed deformation, respectively, revealing homogenous patterns that are less sensitive to superficial changes due to ground properties varying through seasons. Permanent (or coherent) scatterers are very rare in the natural environment (due to missing stable natural reflectors); this is why the PSI method is most often used in urban areas in contrast to SBAS. The results of the SBAS method provide a smoother and more detailed displacement time series, leading to better representation of the temporal evolution of ground deformation—also in a natural environment but often less accurate. Nevertheless, it should be emphasized that both methods provide helpful information about ground deformation and can detect small displacements (on a millimeter level) over a relatively long period of time if good coherence values are maintained.
Finally, the prepared virtual environment containing InSAR results and geological data enables a better understanding of the three-dimensional deformation pattern, which may appear very complex in relation to the actual geological context of the area. In addition, our research adds value to the ongoing Interreg E-TEST project (investigating the site for an ET in the area of interest shown here) and may be of use when the final location of the Einstein Telescope is determined.
We formulated answers to the research questions presented at the beginning of the paper.
Can both PSI and SBAS techniques differentiate local and regional ground uplift, and sub-regional subsidence, possibly enhanced across fault structures?
PSI results over long time series of acquisitions have not known any regional ground deformation, only punctual spots (natural or anthropogenic permanent scatters) corresponding to mining. On the other hand, SBAS results give additional information about regional ground deformation observed inside and around the AOI due to the denser coverage of the area with points. We did not observe a significant increase in deformation across fault structures.
Do old mining activities also influence the observed displacement patterns?
No evidence has revealed that old mining activity influences the patterns of the observed displacements. The spatial deformation analysis shows an inhomogeneous subsidence of up to 4 mm/year for the old galleries in the Plombieres region (BE).
Are faults observed in the AOI aseismic or the SAR sensor resolution unable to detect such small displacements?
InSAR results give us good insights for understanding the full deformation picture over the AOI, but limitations in terms of technicality and deformation significance of the displacements are very small.
Data availability statement
The original contributions presented in the study are included in the article/Supplementary Material; further inquiries can be directed to the corresponding author.
Author contributions
RS: conceptualization, data curation, formal analysis, funding acquisition, investigation, methodology, project administration, resources, software, supervision, validation, visualization, writing–original draft, and writing–review and editing. KO: data curation, formal Analysis, investigation, software, validation, visualization, writing–original draft, and writing–review and editing. AO: funding acquisition, project administration, supervision, writing–original draft, and writing–review and editing. H-BH: conceptualization, funding acquisition, project administration, supervision, writing–original draft, and writing–review and editing.
Funding
The authors declare that financial support was received for the research, authorship, and/or publication of this article. RS and KO were supported by an ESA Living Planet Fellowship EISI - Call for Research Proposals 2020 (https://eo4society.esa.int/projects/germane/). The contract number is 4000135910/21/I-DT-lr.
Acknowledgments
The authors acknowledge Nicolas d’Oreye from the European Center for Geodynamics and Seismology (ECGS) for providing the access to the the MasTer InSAR automated mass processing toolbox. They also warmly thank Ramon Hanssen for hosting in TU Delft, supporting PSI results interpretation, as well as Skygeo for giving access to DepSI results available for the Benelux area. In addition, we acknowledge Xavier Devleshouwer and Pierre-Yves Declerq (Geological Survey of Belgium) for their insights regarding former InSAR monitoring, and also Marthe Lefèvre and Aurélia Ferrari (ULiege) for fruitful discussions regarding fault activity over the area of interest. They also thank Hans van der Marel (TU Delft), the Belgian National Geography Institute (especially Martin Vandenbroeck and Jeffrey Verbeurgt), and technicians from the Centre Spatial de Liège for their practical support regarding the installation of the Integrated Geodetic Stations in Plombières. They very much appreciated Philippe Cerfontaine’s (ULiege) involvement in the field and help preparing the 3D geomodel.
Conflict of interest
Author RS was employed by Spacebel sa.
The remaining authors declare that the research was conducted in the absence of any commercial or financial relationships that could be construed as a potential conflict of interest.
Publisher’s note
All claims expressed in this article are solely those of the authors and do not necessarily represent those of their affiliated organizations, or those of the publisher, the editors, and the reviewers. Any product that may be evaluated in this article, or claim that may be made by its manufacturer, is not guaranteed or endorsed by the publisher.
Supplementary material
The Supplementary Material for this article can be found online at: https://www.frontiersin.org/articles/10.3389/frsen.2024.1366944/full#supplementary-material
SUPPLEMENTARY FIGURE SA1 | P-SBAS results for ascending #88 track between 2021/01/01 and 2021/07/24 (A) and descending #37 between 2020/12/29 and 2021/07/03 (B) with a coherence threshold of 0.4. Possible Einstein Telescope location shown in red.
SUPPLEMENTARY FIGURE SA2 | DepSI results for ascending #88 track between 2017/10/04 and 2022/10/26 (A) and descending #37 between 2017/10/01 and 2022/10/29 (B). Possible Einstein Telescope location shown in red.
SUPPLEMENTARY FIGURE SB1 | Preliminary virtual environment including InSAR results presented over Plombières (BE) with Unreal Engine software. Visible layers: fault lines, DepSI, and SNAPPING results in the ascending mode with basemap from Cesium plugin. Symbols for individual layers , (A) representation of selection menu (B), 3D model tiles and vectors (C), and around the Mergelhof street crossed by the Gueule fault (D).
References
Camelbeeck, T., Alexandre, P., Vanneste, K., and Meghraoui, M. (2000). Long-term seismicity in regions of present day low seismic activity: the example of western Europe. Soil Dyn. Earthq. Eng. 20, 405–414. doi:10.1016/S0267-7261(00)00080-4
Camelbeeck, T., and Meghraoui, M. (1998). Geological and geophysical evidence for large palaeo-earthquakes with surface faulting in the Roer Graben (northwest Europe). Geophys. J. Int. 132, 347–362. doi:10.1046/j.1365-246X.1998.00428.x
Camelbeeck, T., Vanneste, K., Alexandre, P., Verbeeck, K., Petermans, T., Rosset, P., et al. (2007). “Relevance of active faulting and seismicity studies to assessments of long-term earthquake activity and maximum magnitude in intraplate northwest Europe, between the Lower Rhine Embayment and the North Sea,” in Continental intraplate earthquakes: science, hazard, and policy issues. Editors S. Stein, and S. Mazzotti (USA: Geological Society of America), 0. doi:10.1130/2007.2425
Caro Cuenca, M., Hooper, A. J., and Hanssen, R. F. (2013). Surface deformation induced by water influx in the abandoned coal mines in Limburg, The Netherlands observed by satellite radar interferometry. J. Appl. Geophys. 88, 1–11. doi:10.1016/j.jappgeo.2012.10.003
Cigna, F., and Tapete, D. (2021). Sentinel-1 big data processing with P-SBAS InSAR in the geohazards exploitation platform: an experiment on coastal land subsidence and landslides in Italy. Remote Sens. 13, 885. doi:10.3390/rs13050885
Crosetto, M., Monserrat, O., Cuevas-González, M., Devanthéry, N., and Crippa, B. (2016). Persistent scatterer interferometry: a review. ISPRS J. Photogrammetry Remote Sens. 115, 78–89. doi:10.1016/j.isprsjprs.2015.10.011
Crosetto, M., Solari, L., Mróz, M., Balasis-Levinsen, J., Casagli, N., Frei, M., et al. (2020). The evolution of wide-area DInSAR: from regional and national services to the European ground motion service. Remote Sens. 12, 2043. doi:10.3390/rs12122043
Cuenca, M. C. (2013).Improving radar interferometry for monitoring fault-related surface deformation. Netherlands: Delft University of Technology. Applications for the Roer Valley Graben and coal mine induced displacements in the southern Netherland (Doctoral thesis).
Declercq, P.-Y. (2020). A study of long term and slow ground movements in Belgium using Multi-Temporal InSAR satellite data (Doctoral thesis). Liege, Belgium: Université de Liège.
Dejonghe, L., and Boni, M. (2005). The calamine-type zinc-lead deposits in Belgium and West Germany: a product of Mesozoic palaeoweathering processes. Geol. Belg. 8/3, 3–14.
Demanet, D., Renardy, F., Vanneste, K., Jongmans, D., Camelbeeck, T., and Meghraoui, M. (2000). The use of geophysical prospecting for imaging active faults in the Roer Graben, Belgium. Geophysics 66, 78–89. doi:10.1190/1.1444925
Demoulin, A. (1988). Cenozoic tectonics on the hautes Fagnes plateau (Belgium). Tectonophysics 145, 31–41. doi:10.1016/0040-1951(88)90313-7
Demoulin, A., and Chung, C.-J. F. (2007). Mapping landslide susceptibility from small datasets: a case study in the Pays de Herve (E Belgium). Geomorphology 89, 391–404. doi:10.1016/j.geomorph.2007.01.008
Demoulin, A., and Collignon, A. (2000). Nature of the recent vertical ground movements inferred from high-precision leveling data in an intraplate setting: NE Ardenne, Belgium. J. Geophys. Res. 105, 693–705. doi:10.1029/1999JB900345
Demoulin, A., and Glade, T. (2004). Recent landslide activity in manaihan, east Belgium. Landslides 1, 305–310. doi:10.1007/s10346-004-0035-z
Demoulin, A., Pissart, A., and Schroeder, C. (2003). On the origin of late Quaternary palaeolandslides in the Li ge (E Belgium) area. Int. J. Earth Sci. Geol. Rundsch 92, 795–805. doi:10.1007/s00531-003-0354-7
Derauw, D., Libert, L., Glaude, Q., Barbier, C., and Orban, A. (2019). “The CSL InSAR Suite processor: specificities of a command line InSAR processing software specifically adapted for automated time series processing,” in Presented at the ESA Living Planet Symposium, Milan, Italy, 13-17 May 2019 (IEEE).
Derauw, D., Nicolas, d’O., Jaspard, M., Caselli, A., and Samsonov, S. (2020). Ongoing automated ground deformation monitoring of Domuyo - laguna del Maule area (Argentina) using Sentinel-1 MSBAS time series: methodology description and first observations for the period 2015–2020. J. S. Am. Earth Sci. 104, 102850. doi:10.1016/j.jsames.2020.102850
Devleeschouwer, X., Declercq, P.-Y., Flamion, B., Jérôme, B., Albert, T., and Julien, V. (2008). Uplift revealed by radar interferometry around Liege (Belgium): a relation with rising mining groundwater. Proc. post-mining, 1–13.
d Oreye, N., Derauw, D., Libert, L., Samsonov, S., Dille, A., Nobile, A., et al. 2019. Automatization of InSAR mass processing using CSL InSAR Suite (CIS) software for Multidimensional Small Baseline Subset (MSBAS) analysis: example combining Sentinel-1 and Cosmo-SkyMed SAR data for landslides monitoring in South Kivu,DR Congo. Abstract. Presented at the ESA Living Planet Symposium 13-17 May 2019, Milan, Italy.
Fattahi, H., and Amelung, F. (2015). InSAR bias and uncertainty due to the systematic and stochastic tropospheric delay. J. Geophys. Res. Solid Earth 120, 8758–8773. doi:10.1002/2015JB012419
Ferretti, A., Prati, C., and Rocca, F. (2000). Nonlinear subsidence rate estimation using permanent scatterers in differential SAR interferometry. IEEE Trans. Geoscience Remote Sens. 38, 2202–2212. doi:10.1109/36.868878
Gabriel, A. K., Goldstein, R. M., and Zebker, H. A. (1989). Mapping small elevation changes over large areas: differential radar interferometry. J. Geophys. Res. Solid Earth 94, 9183–9191. doi:10.1029/JB094iB07p09183
Heitfeld, M., Rosner, P., Pietralla, S., and Rosin, D. (2016). Na-Ijlende gevolgen steenkolenwinning zuid-limburg final report on the results of the working group 5.2.1 – ground movements, parts C and D.
Kreemer, C., Blewitt, G., and Davis, P. M. (2020). Geodetic evidence for a buoyant mantle plume beneath the Eifel volcanic area, NW Europe. Geophys. J. Int. 222, 1316–1332. doi:10.1093/gji/ggaa227
Li, S., Xu, W., and Li, Z. (2022). Review of the SBAS InSAR Time-series algorithms, applications, and challenges. Geodesy Geodyn. 13, 114–126. doi:10.1016/j.geog.2021.09.007
Meghraoui, M., Camelbeeck, T., Vanneste, K., Brondeel, M., and Jongmans, D. (2000). Active faulting and paleoseismology along the Bree fault, lower Rhine graben, Belgium. J. Geophys. Res. Solid Earth 105, 13809–13841. doi:10.1029/1999JB900236
Mreyen, A.-S., Demoulin, A., and Havenith, H.-B. (2018). Seismotectonic activity in East Belgium: relevance of a major scarp and two associated landslides in the region of Malmedy. Geol. Belg 21, 101–110. doi:10.20341/gb.2018.006
Nettis, A., Massimi, V., Nutricato, R., Nitti, D. O., Samarelli, S., and Uva, G. (2023). Satellite-based interferometry for monitoring structural deformations of bridge portfolios. Automation Constr. 147, 104707. doi:10.1016/j.autcon.2022.104707
Poreh, D., Iodice, A., Riccio, D., and Ruello, G. (2016). Railways' stability observed in Campania (Italy) by InSAR data. Eur. J. Remote Sens. 49, 417–431. doi:10.5721/EuJRS20164923
Pöttgens, J. J. E. (1985). Bodenhebung durch ansteigendes Grubenwasser Presented at the The 6th International Congress for Mine Surveying 1985. Harrogate: Great Britain, 928–938.
Preuth, T., Glade, T., and Demoulin, A. (2010). Stability analysis of a human-influenced landslide in eastern Belgium. Geomorphol. Landslide Geomorphol. a changing Environ. 120, 38–47. doi:10.1016/j.geomorph.2009.09.013
Talledo, D. A., Miano, A., Bonano, M., Di Carlo, F., Lanari, R., Manunta, M., et al. (2022). Satellite radar interferometry: potential and limitations for structural assessment and monitoring. J. Build. Eng. 46, 103756. doi:10.1016/j.jobe.2021.103756
Tang, W., Motagh, M., and Zhan, W. (2020). Monitoring active open-pit mine stability in the Rhenish coalfields of Germany using a coherence-based SBAS method. Int. J. Appl. Earth Observation Geoinformation 93, 102217. doi:10.1016/j.jag.2020.102217
Ullo, S. L., Addabbo, P., Martire, D. D., Sica, S., Fiscante, N., Cicala, L., et al. (2019). Application of DInSAR technique to high coherence sentinel-1 images for dam monitoring and result validation through in situ measurements. IEEE J. Sel. Top. Appl. Earth Observations Remote Sens. 12, 875–890. doi:10.1109/JSTARS.2019.2896989
Van Balen, R. T., Kasse, C., Wallinga, J., and Woolderink, H. A. G. (2021). Middle to late pleistocene faulting history of the Heerlerheide fault, Roer Valley rift system, influenced by glacio-isostasy and mining-induced displacement. Quat. Sci. Rev. 268, 107111. doi:10.1016/j.quascirev.2021.107111
Vervoort, A. (2016). Surface movement above an underground coal longwall mine after closure. Nat. Hazards Earth Syst. Sci. 16, 2107–2121. doi:10.5194/nhess-16-2107-2016
Vervoort, A., and Declercq, P.-Y. (2018). Upward surface movement above deep coal mines after closure and flooding of underground workings. Int. J. Min. Sci. Technol. Special issue ground control Min.28, 53–59. doi:10.1016/j.ijmst.2017.11.008
Wasowski, J., and Bovenga, F. (2014). Investigating landslides and unstable slopes with satellite Multi Temporal Interferometry: current issues and future perspectives. Eng. Geol. 174, 103–138. doi:10.1016/j.enggeo.2014.03.003
Yang, Y., Chen, Q., Xu, Q., Zhang, Y., Yong, Q., and Liu, G. (2017). Coseismic surface deformation of the 2014 Napa earthquake mapped by Sentinel-1A SAR and accuracy assessment with COSMO-SkyMed and GPS data as cross validation. Int. J. Digital Earth 10, 1197–1213. doi:10.1080/17538947.2017.1299806
Glossary
Keywords: Einstein telescope, neotectonics, Lower Rhine Embayment, geomodeling, time series analysis, SAR interferometry, ground surface deformation
Citation: Schlögel R, Owczarz K, Orban A and Havenith H-B (2024) Investigating Earth surface deformation with SAR interferometry and geomodeling in the transborder Meuse–Rhine region. Front. Remote Sens. 5:1366944. doi: 10.3389/frsen.2024.1366944
Received: 07 January 2024; Accepted: 01 April 2024;
Published: 01 May 2024.
Edited by:
Shengbiao Wu, The University of Hong Kong, Hong Kong SAR, ChinaReviewed by:
Caglar Bayik, Bülent Ecevit University, TürkiyeYosuke Aoki, The University of Tokyo, Japan
Andrea Nettis, Politecnico di Bari, Italy
Copyright © 2024 Schlögel, Owczarz, Orban and Havenith. This is an open-access article distributed under the terms of the Creative Commons Attribution License (CC BY). The use, distribution or reproduction in other forums is permitted, provided the original author(s) and the copyright owner(s) are credited and that the original publication in this journal is cited, in accordance with accepted academic practice. No use, distribution or reproduction is permitted which does not comply with these terms.
*Correspondence: Romy Schlögel, cm9teS5zY2hsb2dlbEBzcGFjZWJlbC5iZQ==