 Joel Kuusk1*
 Alexandre Corizzi2
 David Doxaran2
 Kim Duong1
 Kenneth Flight1Joosep Kivastik1
 Kaspars Laizans1
 Edouard Leymarie2Silvar Muru1
 Christophe Penkerc’h2
 Kevin Ruddick3
- 1Tartu Observatory, University of Tartu, Tõravere, Estonia
- 2Laboratoire d’Océanographie de Villefranche, UMR7093 CNRS, Sorbonne Université, Villefranche-sur-Mer, France
- 3Royal Belgian Institute of Natural Sciences, Brussels, Belgium
Optical Earth observation satellites provide vast amounts of data on a daily basis. The top-of-atmosphere radiance measured by these satellites is usually converted to bottom-of-atmosphere radiance or reflectance which is then used for deriving numerous higher level products used for monitoring environmental conditions, climate change, stock of natural resources, etc. The increase of available remote sensing data impacts decision-making on both regional and global scales, and demands appropriate quality control and validation procedures. A HYperspectral Pointable System for Terrestrial and Aquatic Radiometry (HYPSTAR®) has been designed to provide automated, in-situ multiangular reflectance measurements of land and water targets. HYPSTAR-SR covers 380–1020 nm spectral range at 3 nm spectral resolution and is used at water sites. For land sites the HYPSTAR-XR variant is used with the spectral range extended to 1680 nm at 10 nm spectral resolution. The spectroradiometer has multiplexed radiance and irradiance entrances, an internal mechanical shutter, and an integrated imaging camera for capturing snapshots of the targets. The spectroradiometer is mounted on a two-axis pointing system with 360° range of free movement in both axes. The system also incorporates a stable light emitting diode as a light source, used for monitoring the stability of the radiometric calibration during the long-term unattended field deployment. Autonomous operation is managed by a host system which handles data acquisition, storage, and transmission to a central WATERHYPERNET or LANDHYPERNET server according to a pre-programmed schedule. The system is remotely accessible over the internet for configuration changes and software updates. The HYPSTAR systems have been deployed at 10 water and 11 land sites for different periods ranging from a few days to a few years. The data are automatically processed at the central servers by the HYPERNETS processor and the derived radiance, irradiance, and reflectance products with associated measurement uncertainties are distributed at the WATERHYPERNET and LANDHYPERNET data portals.
1 Introduction
Data from multispectral spaceborne optical imaging satellites, such as Sentinel-2/MSI, Sentinel-3/OLCI, Landsat-(8/9)/OLI, and Suomi NPP/VIIRS, are used operationally for environmental applications on land and water. Data from a new generation of hyperspectral satellite missions, including PRISMA (Cogliati et al., 2021), ENMAP (Storch et al., 2023), EMIT (Green et al., 2023), and PACE (Gorman et al., 2019) are gaining traction. Commercial “NewSpace” operators are also providing optical imaging data, typically from smaller nanosatellite platforms without on-board calibration devices. The top-of-atmosphere data from all these missions must be calibrated and atmospherically corrected to provide the water and land surface reflectance products from which the higher level end-user products, e.g., chlorophyll a concentration in water and fraction of absorbed photosynthetically active radiation (FAPAR), are derived. The quality and usability of the derived products depends on the quality of the reflectance measurements. Imperfect atmospheric correction often leads to contamination of data reaching end-users making the need for radiometric validation at bottom of atmosphere crucial.
For water reflectance, the AERONET-OC network (Zibordi et al., 2009), based on the multispectral Cimel SeaPRISM radiometer, met this need for ocean colour sensors with narrow bands, but did not cover well the spectral bands required for validation of neither the upcoming hyperspectral sensors, nor the wide and non-square bands of the “land-dedicated” missions such as Sentinel-2/MSI and Landsat-8/OLI. For land surface reflectance, very little data were available outside of the RadCalNet network (Bouvet et al., 2019) of sites optimised for vicarious calibration. It was therefore decided in 2017 to develop the HYPERNETS network of validation sites with automated measurement of water and land surface reflectance, based on a new hyperspectral radiometer and commercial off-the-shelf (COTS) pointing system (Ruddick et al., 2024a).
While some hyperspectral radiometers, such as the TriOS/RAMSES, DALEC (Slivkoff, 2014), Sea-Bird/HyperSAS (Carswell et al., 2017) and Biospherical/OSPREy (Hooker et al., 2012) based on the Zeiss MMS 1 spectrometer, do provide hyperspectral coverage and have been integrated into automated measurement systems, they have only 10 nm full width at half maximum (FWHM) spectral resolution which is not high enough for validation of PACE/OCI that has 5 nm spectral resolution (Gorman et al., 2019). The RoX system (Cesana et al., 2021) and WISPstation (Peters et al., 2018) do provide higher spectral resolutions (1.5 nm and 4.6 nm FWHM, respectively).
The design spectral requirements for the new hyperspectral radiometer are summarised in Goyens et al. (2018) as:
• coverage of the spectral range 380–1020 nm for water applications with typically 5 nm FWHM, or preferably 1 nm FWHM resolution;
• coverage of at least 1000–1700 nm or preferably 1000–2500 nm for land applications with typically 5–10 nm FWHM.
Additionally it was necessary to:
• integrate the radiometer with a COTS pointing system with both pan and tilt capabilities, and suitable controller, power supply, and data transmission;
• achieve a complete automated measurement system suitable for reliable long-term deployments in hostile environments (from polar to desert regions and remotes seas);
• consider the requirements of the IOCCG protocols (Zibordi et al., 2019) as far as possible regarding radiometer specification, calibration, and characterisation.
The tilt capability, not included in some precursor water reflectance systems such as DALEC, HyperSAS, RoX, and WISPstation, is considered important to protect the fore-optics when not measuring and is essential for land reflectance measurements where a range of nadir- and azimuth-viewing geometries are required.
The HYperspectral Pointable System for Terrestrial and Aquatic Radiometry (HYPSTAR®) described in the current paper is intended to be a standalone low-maintenance automated data source for the WATERHYPERNET (Ruddick et al., 2024b) and LANDHYPERNET (De Vis et al., 2024b) networks that provide end-users with processed and calibrated water and land reflectance data and associated measurement uncertainties (De Vis et al., 2024b) akin to the existing AERONET-OC and RadCalNet concepts. Following the recommendations of the FRM4SOC project (Banks et al., 2020), the properties of the HYPSTAR spectroradiometers were thoroughly studied in the laboratory and the results are presented in Section 3. Only a brief description and average values are given for each parameter to illustrate the typical performance of the HYPSTAR spectroradiometers. Detailed analysis would warrant an individual research article for each subsection.
The HYPSTAR systems have been deployed at 10 water and 11 land sites. Some of these were only brief campaigns or technology testing experiments while others have been capturing the in-situ satellite validation data for months or even years (Dogliotti et al., 2024; Doxaran et al., 2024; Morris et al., 2024). The deployments have been made at a wide range of environments from Antarctica to the Gobabeb desert and the North Sea (De Vis et al., 2024a; González Vilas et al., 2024). The infrastructure available at the test sites has varied from grid power and Ethernet to solar power and sneakernet. The data are transmitted to and automatically processed at the central WATERHYPERNET and LANDHYPERNET servers by the HYPERNETS processor to radiance, irradiance, and reflectance products with associated measurement uncertainties (De Vis et al., 2024b).
2 System description
The interconnection among the different components of HYPSTAR system in a typical configuration is shown in Figure 1:
• Measurement unit is the hyperspectral radiometer used for radiance and irradiance measurements and target image acquisition;
• Reference unit is a stabilised light emitting diode (LED) light source for in-situ monitoring the long-term stability of the entire optical path of the spectroradiometer, including the optical windows subject to fouling;
• Pointing unit is an electrical pan-tilt pointing system (PT) which is mounted directly on a site-specific mast and provides full-sphere rotational coverage of the spectroradiometer;
• Junction box is a passive connection box intended for splitting up connections from single cable coming from the controller into localised connections on top of the mast for the reference LED, spectroradiometer, and PT;
• Host unit is the system controller that handles scheduling and all the communications with subsystems as well as with external sources. The heart of the host unit is an industrial grade personal computer (PC) with Linux-based operating system which executes scheduling and acquisition software for control and data acquisition. The host unit also contains a custom-made real time clock (RTC) based control mechanism that supports scheduled power control of the system. This allows a mode of deep sleep to conserve energy between captures. The whole unit is housed in a weatherproof wall-mountable box with sealed external ports for power input and connections to other subsystems;
• Ancillary sensors comprise a rain sensor and a broadband photodiode. The rain sensor is used to save energy by preventing sequences during rain. The photodiode is intended for monitoring the stability of the downwelling irradiance during the hyperspectral radiance measurements;
• Power source is a site-specific source of 12 V direct current (DC) power bus. This can be a solar panel array or wind turbine with battery backup or a generic AC/DC converter capable of supplying at least 4 A of sustained current;
• Data link is a site-specific internet connection for uploading the data to the network server and accessing the system remotely for troubleshooting, configuration changes, and software updates;
• Surveillance cameras are optional components of the system that can be used for diagnostics and monitoring for external influences, such as equipment damage, vandalism, etc.
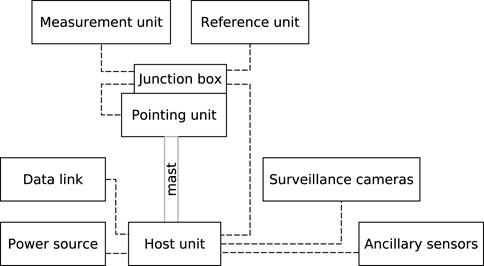
Figure 1. Block diagram of a HYPSTAR system.
The technical specifications of the HYPSTAR systems are listed in Table 1.
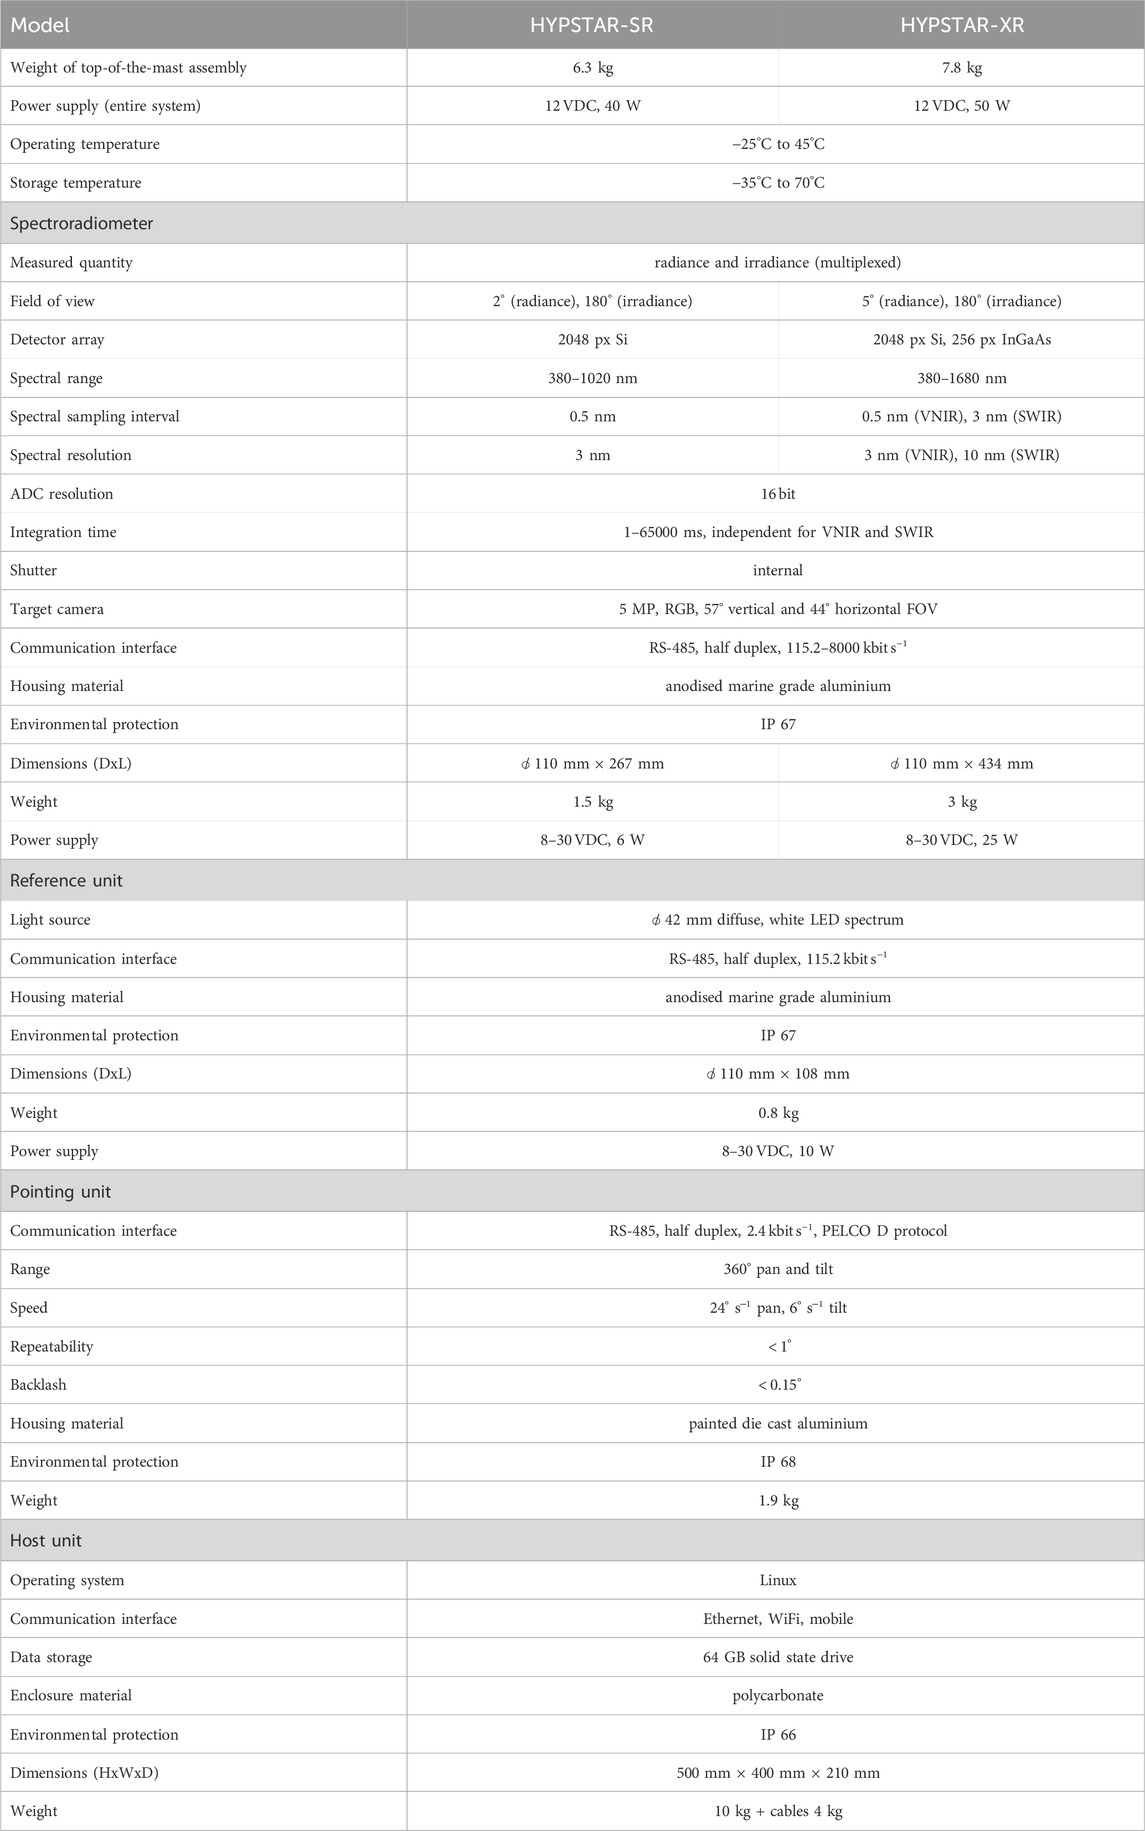
Table 1. Technical specifications of the HYPSTAR.
2.1 Spectroradiometer
The measurement unit in Figure 1 is the hyperspectral radiometer that performs acquisition of radiance and irradiance spectra and target imagery. Two different versions of the radiometer have been developed for various applications:
• HYPSTAR-SR (Standard Range) has a single 2048 pixel Si detector array for visible and near-infrared (VNIR) spectral range and is mainly intended for above-water measurements;
• HYPSTAR-XR (eXtended Range) has an additional thermally stabilised 256 pixel InGaAs array for extending the spectral range into short-wavelength infrared (SWIR) which is useful for measuring land (surface) targets.
In small scale engineering and manufacturing a main cost driver is non-recurring engineering costs, i.e., person-hours used for development and testing. One way of working around this issue is creating systems consisting of generic modules that can be reused for multiple systems. This approach was used in designing the HYPSTAR instruments. The main difference between the SR and XR radiometers is the support for extended spectral range via the inclusion of an additional spectrometer module. Most of the system components (host and pointing systems, internal electronics and optical paths, firmware and supporting software) have been designed to be as modular and interchangeable as possible. Based on this, most of the following text will be about the SR system, but is also applicable to the XR, except where explicitly mentioned.
2.1.1 Optical path
The optical path is based around the idea of multiplexing radiance and irradiance optical entrances into a single spectrometer module, or a set of modules in the case of the XR variant. The benefits compared to parallel acquisition using duplicated signal chains are:
• reduced laboratory characterisation effort;
• correlations between radiance and irradiance measurement reduce the uncertainties (e.g., from laboratory calibration, spectrometer responsivity drift and/or thermal sensitivity) of the calculated reflectance;
• the multiplexer acts as a shutter, providing dark signal when neither entrance is selected;
• reduced cost, size, mass, and power consumption.
The price to pay for the aforementioned benefits is that simultaneous acquisition of radiance and irradiance measurements is not possible. This is not a major issue for satellite validation application, since automated operation enables the collection of large amounts of data. The best data for validating optical satellites are collected in stable atmospheric and illumination conditions when downwelling irradiance changes slowly and in a predictable manner. Another downside of the multiplexed design is the reduced optical throughput due to the losses in the extended optical path.
The Ibsen FREEDOM UV-NIR FSA-101 spectrometer module with the 2048-pixel Hamamatsu S11639-01 CMOS detector array is used for both SR and XR units. The VNIR module has 3 nm FWHM spectral resolution. The spectral sampling interval is 0.5 nm at 800 nm and decreases slightly at longer and shorter wavelengths, reaching 0.46 nm in ultraviolet (UV). Considering the number of pixels and the sampling interval, the spectral range of the VNIR spectrometer module is 165–1145 nm, however, the responsivity is highest around 750 nm and decreases towards longer and shorter wavelengths. In addition, the bottom-of-atmosphere solar irradiance drops rapidly in UV. Thus, the signal-to-noise ratio (SNR) drops at both ends of the spectral range and the nominal VNIR spectral range reported in Table 1 is limited to 380–1020 nm although the signal from all the 2048 sensor pixels are stored.
The XR units are also equipped with the Ibsen Rock NIR RSM-420 spectrometer module having a 256-pixel Hamamatsu G9203-256SA thermoelectrically stabilised InGaAs detector array for covering the SWIR spectral range up to 1680 nm. The spectral resolution in the SWIR is 10 nm, sampling interval varies from 3.6 nm in near-infrared (NIR) to 2.6 nm in SWIR. Integration time can be adjusted in the range of 1–65000 ms for both spectrometer modules separately. Since the Ibsen Rock NIR RSM-420 does not include an order sorting filter, an external filter is used for blocking the VNIR radiation that would cause higher order diffraction pattern on the SWIR detector array. The stabilisation temperature of the SWIR detector array is user configurable. In most cases a 0 °C setpoint is used except for extremely hot locations where ambient temperature exceeding 40°C can be expected (e.g., Gobabeb, Namibia, where the SWIR detector is stabilised to 10°C).
The radiance and irradiance entrances are both connected to the input multiplexer (MUX in Figure 2) using multimode optical fibres. The multiplexer radiance and irradiance channel outputs are simultaneously connected to both VNIR and SWIR spectrometer modules (where the SWIR module is present) using a multi-branch fibre bundle. Single fibres in the bundle are mixed in such a way as to provide both spectrometer modules with signals from both input arms. Since most of the measurements during the sequence are made via the radiance entrance and the targets are often rather dark (e.g., water), 80% of the fibres in the bundle are allocated for the radiance channel to reduce the sequence duration and increase the signal-to-noise ratio of the radiance measurements. The nominal radiance field of view (FOV) is 2° and 5° for the SR and XR unit, respectively. These FOV values were chosen as a compromise between resolving the angular dependence of radiance and averaging over small scale spatial heterogeneities (compared to any satellite pixel). The spatial averaging can be improved by increasing the distance from the target, but there are practical limitations on the height of the mast.
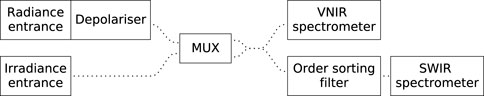
Figure 2. Block diagram of the optical path of the HYPSTAR-XR spectroradiometer. The dotted lines represent optical fibres. The HYPSTAR-SR variant does not have the SWIR spectrometer module, the order sorting filter, and the fibre arm entering the filter. MUX is a multiplexer/shutter.
The radiance and irradiance optical paths passing through the multiplexer are permanently aligned. The active channel is selected by aligning the aperture of a solid rotating disk with a respective channel while the disk blocks the other channel. When the aperture is not aligned with either of the channels, the disk performs as a shutter. The disk with aperture is the only moving part in the multiplexer assembly which makes the design relatively robust and insensitive to small multiplexer positioning errors. The downside is reduced optical throughput due to illuminating only part of the fibres in the bundle at any given time.
All the windows and lenses in the optical path of the HYPSTAR radiometers are made of borosilicate glass. A fused silica diffuser is used for the cosine collector of the irradiance entrance. Fused silica is preferred due to superior thermal properties to another commonly used diffuser material polytetrafluoroethylene (PTFE) (Ylianttila and Schreder, 2005; Vabson et al., 2024). The depolariser of the radiance entrance is made of quartz. The geometry of the cosine collector was optimised with TracePro opto-mechanical design software and further adjusted according to laboratory characterisation on a goniometer setup to provide the lowest cosine error throughout the entire spectral range.
2.1.2 Target camera
Target monitoring is done using an RGB camera that provides compressed JPEG images with resolutions up to 2,560 px
2.1.3 Mechanics
The mechanical design using anodised marine grade ᴓ 110 mm aluminium tubing for the body of the spectroradiometer provides sufficient corrosion resistance in harsh marine conditions (salt spray, biofouling, etc.) and is stable for long-term outdoor deployments (solar UV radiation, variable temperature, ice and snow, etc.). O-ring seals are used to cap off both ends to create an IP-67-rated enclosure. One end cap contains the optical entrances, while the other houses the connection port and heat sink for the XR units. The XR variant is longer and heavier compared to the SR units to accommodate the additional SWIR spectrometer module. CA Bayonet connectors designed to VG95234 specifications ensure appropriate environmental protection and robust mating. The use of a ᴓ 110 mm body also enables creation of ad-hoc test stands and jigs from water supply industry standard clamps.
2.1.4 Ancillary sensors
Internal environment monitoring consists of pressure, relative humidity, 3D acceleration and various temperature sensors, as well as voltage and current monitors. Internal pressure and humidity are used in conjunction with internal temperature to gauge the state of sealing. Leakage increases humidity, which in turn could lead to internal fogging of the fore-optics in low temperature regions or damage to the electronics if the leak is significant. Acceleration data can be used for estimating the pointing precision. Each spectrum captured is provided with 3-axial acceleration data together with statistics for the duration of acquisition. A high standard deviation in accelerometer data can be indicative of excessive swaying during windy conditions. Other uses for acceleration data converted into gravity vector are verification of pointing angle and assistance of instrument levelling during initial setup in poor visibility. It is also useful in challenging conditions, such as the typical setup for land measurements where the system is mounted at the end of a cantilever, to enable nadir reflectance measurements. Internal power bus voltage and current monitoring provides information for troubleshooting purposes. Various internal temperature sensors (on both photodetector arrays, SWIR module body and heat sink, internal ambient) assist with evaluation of the system state and correction for the thermal dependence of the radiometric measurements.
2.1.5 Communication interface
The communications scheme employing the industrial TIA-485 standard (also known as RS-485) and half-duplex physical layer enables system evaluation by using any generic TIA-485 transceiver and a PC. The default baud rate of 115200 with 8N1 frames is supported by most generic devices. The same interface is often used to control various PT units available on the market albeit at lower baud rates. The lack of high baud rate support on PT units means that multi drop communications among the host, pointing, and measurement units are not used. To increase throughput, binary data encoding as well as data rates up to 8 Mbit s−1 can be used (in transceivers that support it). All datasets have cyclic redundancy check (CRC) checksums and are split into packets of up to 1 KiB that each have their own checksum. Communications are handled by an open source Linux driver1 that exposes C/C++ and Python 3 application programming interfaces for integration into custom software. This driver handles all the setting-up, acquisition and data downloads as well as managing any communication issues with minimal user intervention. The end user application developer does not have to worry about specific differences between instrument models or versions, since all the data packets and structures are unified.
2.1.6 Power supply
The power supply circuitry within the spectroradiometer generates all the internal power rails necessary for operation from the provided power input of 8–30 V. Support for off-grid 24 V supply rail during active charging at 27–29 V is present, but currently not used due to constraints from the other parts of the system. Automotive load dump and battery-reverse protection to ISO 16750–2 levels implemented in the design of the power supply protect the most valuable parts of the spectroradiometer.
2.1.7 Firmware
The firmware of the spectroradiometer is remotely upgradeable. This allows not only for bugfixes, but also implementation of some site-specific user requests. As an example, typically automatic integration time adjustments are started from some low-mid range value. For low brightness targets the optimisation algorithm has to extend the integration time for each measurement which increases total sequence time. Per user request, inverted logic was implemented, where the integration time of the previous measurement was used as a starting point, thus reducing the total duration of each sequence.
Graceful degradation is the ability of a system to retain partial functionality even when a portion of the overall system has been rendered inoperative. Damage of non-essential parts (environmental sensors, RGB camera) is reported by the instrument, all the while allowing to perform the other tasks.
2.2 Reference LED
One of the main requirements for the HYPSTAR is low maintenance need during field operations. Performing high quality optical measurements is a difficult task even in laboratory, let alone in field conditions. In order to automatically assess the responsivity of the instrument on regular basis, a stable LED-based reference light source is added to the system. The LED source is not used for absolute radiometric calibration of the instrument but should enable identification of variation of responsivity during a long deployment from processes such as spectrometer ageing or fore-optics contamination. It is considered an unknown but stable source and repeated measurement of that source in identical measurement conditions should give identical results. Detected variations in the measured brightness are used to inform on potential instrument servicing.
LEDs have high radiant efficacy which is relevant for off-grid systems and their vibration and shock tolerance is also much higher than that of any incandescent light source. LEDs exhibit temperature dependence for both emission wavelength and intensity (Eugène and Deswert, 2009; Cengiz et al., 2022), but this can be mitigated with thermal monitoring and stabilisation.
The radiometer is pointed towards the reference LED by tilt axis movement of the PT (see Figures 3, 4). The pointing accuracy is determined by the repeatability and backlash of the pointing system. A quite large ᴓ 42 mm diffuse source is used as a reference, in order to limit the sensitivity to pointing accuracy. A borosilicate glass window protects the fused silica diffuser of the reference LED from the elements.
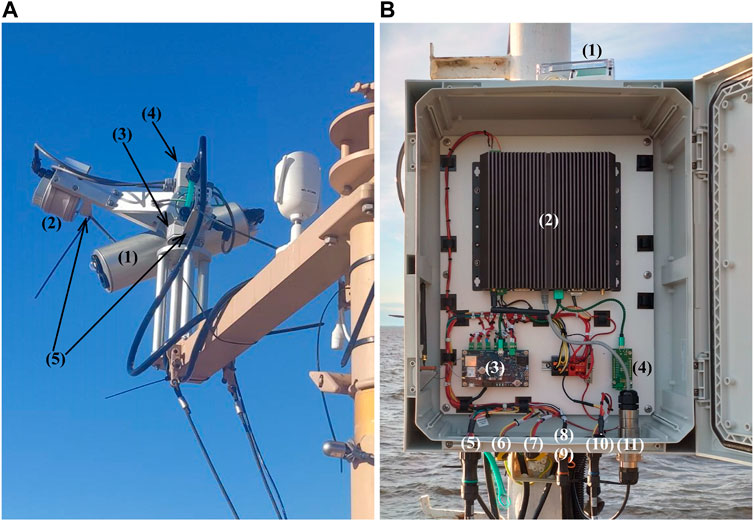
Figure 3. (A) Top-of-the-mast assembly of the HYPSTAR-XR system deployed in Gobabeb, Namibia–spectroradiometer (1), reference LED (2), pointing system (3), junction box (4), and cable supports (5). The vertical axis of the pointing system (3) is fixed to the mast and the entire assembly above (and including) the lower cable support (5) moves when panning. (B) HYPSTAR host unit with the enclosure door open–monitor photodiode and rain sensor (1), PC (2), Yocto-Pictor (3), high speed RS-485 transceiver for the spectroradiometer communications (4), cable to junction box (5), surveillance camera power connectors (6) and (7) (unused in this image), cable to monitor photodiode and rain sensor (8), connector for external GNSS/WiFi/mobile antenna (9) (unused in this image), system power supply input (10), and Ethernet connection (11).
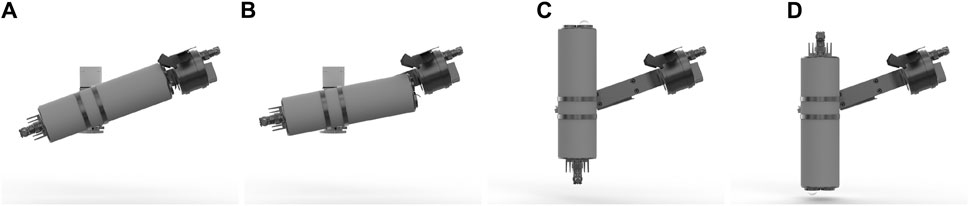
Figure 4. Different tilt positions of the radiometer: measurement of the reference LED using irradiance (A) and radiance (B) entrance; measurement of downwelling irradiance (C); measurement of nadir radiance and parking (D).
A broadband white LED with emissions in the range of 400–800 nm is used for the VNIR range. Due to rather high losses in the optical paths (the source diffuser coupled with the radiometer diffuser in the case of irradiance measurement) a high-power source is required. Excess heat from the power LED is transported to the external aluminium casing which houses a heat sink. The LED temperature is monitored via an adjacent sensor on the circuit board. When the temperature reaches the setpoint the reference unit reports back to the spectroradiometer that the reference measurement can be performed. The setpoint is determined automatically based on the ambient temperature and the user configurable LED current and is typically 30°C or 40°C for mid-latitude summer.
2.3 Pointing unit and instrument mounting
An active pointing system is required due to the single body design and the taking of both irradiance and radiance measurements at various angles. For estimating remote-sensing reflectance of water using above-water instruments (Mobley, 1999; Ruddick et al., 2019), the measurements have to be made in three directions: downwelling irradiance (zenith), sky radiance (tilted upwards), and water radiance (tilted downwards). In addition, the optimal azimuth of sky and water measurements is at a fixed relative angle to the Sun. A PT allows following the diurnal movement of the Sun and switching between positive and negative relative azimuth as necessary to avoid pointing at the superstructure or its shadow. Zenith pointing capability can also be used for more advanced water measurement protocols (Goyens and Ruddick, 2023). The directional effects of surface reflectance for land targets (Kuusk et al., 2014; Gatebe and King, 2016) can be captured with an active pointing system, thus, matching the view geometry of different satellite sensors.
The HYPSTAR system incorporates the Will-Burt Bowler RX dual axis side-mount PT, with 360° range in both axes providing fully spherical coverage. This PT requires 12 V DC power supply and provides rotation speeds of 24° s−1 and 6° s−1 for pan and tilt, respectively, with better than 1° precision.
The top-of-the-mast assembly of a HYPSTAR-XR system deployed in Gobabeb, Namibia, is shown in Figure 3A. The PT serves as an interface between the superstructure and the measurement and reference units, which are mounted on the pointing unit using custom design mounting brackets and a junction box to reduce the number of cables necessary to connect the whole setup to the host unit. Splitting a single cable above the rotation point reduces the load on the PT as well as the possibility of damaging the cabling due to repeated rubbing action while rotating. The mounting brackets incorporate cable supports that elevate cabling to prevent entangling, rubbing, and relieve bending stresses on the electrical connectors.
The reference unit is fixed to the body of the PT and pans together with the radiometer, which ensures that no measurement direction is blocked by the reference unit, but requires over 180
The PT is mounted on the mast with a flange fixed to the end of the pan axis, and a slip-ring fastened with three stainless steel bolts. When the bolts are slightly loosened, the flange still supports the assembly while allowing it to be pointed to the desired position. Since the pan axis is locked to the mast, any pan movement rotates the body of the PT (and everything attached to it) instead.
The reference unit and the spectroradiometer are aligned in the mounting brackets with the help of a 3D-printed alignment tool which allows for aligning laterally, vertically, and rotationally. It also doubles as a physical support during transportation of the top-of-the-mast assembly.
2.4 Host unit
HYPSTAR setups require a control system that deals with scheduling, power and communications management as well as data offloading to network. The host unit is built around the industrial-grade PC Cincoze DE-1000 running a Linux operating system. Either Debian Stable or Manjaro has been used for the prototype systems deployed so far.
As shown in Figure 3B, an IP-66-rated box houses the PC and:
• an RTC that keeps track of the time and power-up schedule;
• six power management relays that are used for turning the other subsystems on and off;
• a global navigation satellite system (GNSS) receiver for location data and time synchronisation;
• a high speed RS-485 transceiver used for communicating with the spectroradiometer;
• intra-system communications ports that are used to connect other external parts of the system: the pointing, measurement, and reference units at the top of the mast, the rain/light sensors, external web cameras, Ethernet port, external WiFi or mobile antenna, and power input.
The RTC, relays, and GNSS are integrated into a bespoke Yocto-Pictor device manufactured by Yoctopuce (Geneva, Switzerland). The six relays provide power to the PC, PT, spectroradiometer and reference LED, heated rain sensor, and independently up to two surveillance cameras. The PC relay is controlled by the RTC; the switching of all other relays is managed by the PC software.
Power management is performed by a dedicated RTC which controls the power relays in a timed fashion. Typically, the measurement sequences are performed at certain time slots (usually every 15–30 min) during daytime, when light conditions are sufficient for obtaining meaningful data. The whole system, with exception of the low-power RTC, shuts down between sequences. The RTC contains also a programmable watchdog timer that powers off all the subsystems if the measurement sequence has not been finished and the system gracefully shut down. The watchdog prevents the system from draining the batteries of off-grid setups or just hanging indefinitely in the case of a software bug.
At the start of a sequence, the RTC powers up the PC which starts execution of open source scheduler software2 written in Python 3. This software first checks the rain sensor to verify that external weather conditions are suitable for performing the measurements. If rain is detected, the PT is requested to point the spectroradiometer towards nadir (in case it was not already parked for some reason, e.g., hard power-off by the watchdog timer at the end of the previous sequence) to protect the entrance optics from contamination and the system is shut down until the next programmed timeslot.
If no rain is detected, a series of basic checks is performed as the units are sequentially powered up. The user-defined sequence containing PT movements, spectroradiometric measurements, and RGB camera captures, is then executed. The broadband photodiode (ROHM Semiconductor BH1751FVI photometric light sensor) signal is recorded at 1 Hz rate during the sequence for monitoring the stability of the downwelling irradiance. Once all the measurements have taken place the system is shut down. For power and time saving reasons the data are uploaded to the network as a background process during the next measurement sequence. Local copies of the data are preserved until they are manually deleted by the operator.
Two 12 V independent power sockets are available to power up the optional surveillance cameras (in our case, commercial-grade ABUS TVIP6256x-series cameras). The data link to the cameras depends on the site infrastructure and can be either wired or wireless. Wireless connection directly to the PC is possible if the PC is configured as a WiFi access point. The cameras can be scheduled to record a snapshot during each measurement sequence.
A GNSS receiver is used as a backup time synchronisation device in case network time is not available. Since these systems are intended for fixed-site installation, the correct time and location data are only used to calculate the Sun angle.
Various external communications and power supply possibilities are available. For sites with grid power an AC/DC converter and, where available, fixed Ethernet connection might provide the best results. For remote and off-shore installations a battery-backed solar panel system is preferred, with WiFi or mobile connection for data transmission.
Each of the host units establishes a reverse-SSH connection to either the WATERHYPERNET or LANDHYPERNET data server for remote access during measurement time. This can be used to connect to the host unit remotely even in environments with dynamic IP address assignment (such as mobile networks). Once connection is established, subsequent scheduled power-down can be prevented allowing time necessary for performing remote maintenance or updates.
The system is designed for automated operation and is not meant to be used as a general purpose radiometer. Hence, the rather minimalistic graphical user interface is provided only to perform basic functional tests on the subsystems.
2.5 Power and data budgets and standard measurement sequences
The power and data budgets of the HYPSTAR setup depend on various parameters and are not very deterministic. The main drivers are the scheduling and sequence configurations which determine how often the system is powered up and which data are acquired. For example, the integration time of the spectroradiometer depends on the downwelling irradiance and target radiance. The power consumption of the SWIR detector thermal stabilisation is driven by the difference between the setpoint and the ambient temperatures. The JPEG compression ratio of the camera images depends on the image content.
The approximate power consumptions of the main system components during operation are:
• host system (PC, Yocto-Pictor, stationary PT): 14 W;
• HYPSTAR-SR spectroradiometer: 4 W;
• HYPSTAR-XR spectroradiometer, SWIR temperature stabilised to 0°C at 20°C ambient: 8 W;
• PT movement: 2 W;
• reference LED at 1 A: 5 W;
• ABUS surveillance camera: 1.5 W.
It should be noted, however, that the instantaneous peak consumptions at the moment of switching on the loads and charging the internal capacitors of the subsystem power supplies or during PT acceleration and deceleration can be substantially higher. If the system is powered from an AC/DC converter, it must have good load regulation capability for handling the load transients, otherwise the voltage may sag temporarily to a level that causes the HYPSTAR system to reboot.
A standard measurement sequence of the HYPSTAR-SR systems integrated into the WATERHYPERNET network contains the following:
•
•
•
•
•
• picture of the Sun (for checking the pointing accuracy);
• park to nadir.
The water sequence is usually executed every 15–30 min for 8–12 h centred around the local noon and takes typically 4–7 min. The daily data budget is usually 25–50 MB for the spectra and target images, and 3–8 MB for the snapshots of the surveillance cameras. Typical daily power consumption is 30–60 W h d−1. More details about the data acquisition protocol and data processing of the WATERHYPERNET systems can be found in (De Vis et al., 2024b; Ruddick et al., 2024b).
The HYPSTAR-XR systems of the LANDHYPERNET measure the multiangular reflectance of the target according to the following standard sequence:
•
• (
•
• park to nadir.
The land sequence takes longer to execute due to the larger number of captured spectra. Typical run time at a vegetated site is 8–12 min. The sequences are executed every 20–30 min. The much larger number of captured spectra compared to the water systems increases the daily data budget to 150–200 MB. Typical daily power consumption is 150–250 W h d−1 for the LANDHYPERNET HYPSTAR-XR systems. More details about the LANDHYPERNET data acquisition protocol are presented in (De Vis et al., 2024b).
3 Calibration and characterisation
The HYPSTAR spectroradiometer prototypes were manufactured in three batches during the H2020/HYPERNETS project. The performance of all the units was thoroughly studied in laboratory and field conditions, and the design refined between batches. The third batch contained nine HYPSTAR-SR and eight HYPSTAR-XR units. The calibration and characterisation results are presented in the following sections as the mean and standard deviation of the parameters of the third batch HYPSTAR instruments.
3.1 Radiometric calibration and noise metrics
The link between the digital number (DN) output of the radiometer and the international system of units (SI) is established by measuring a known source with SI-traceable (ir)radiance. Common setups use the direct illumination of a calibrated quartz-tungsten-halogen (QTH) lamp for the irradiance calibration (Schinke et al., 2020), and a diffusing plaque with calibrated reflectance illuminated by the same (or similar) lamp for the radiance calibration (Białek et al., 2020).
The signal-to-noise ratio (SNR) depends on the measured signal and settings of the measurement device. Many sources of noise can affect photosensors (Konnik and Welsh, 2014). Generally, the overall noise is expressed as the sum of the photon noise, the dark noise, the readout noise, and the digitisation noise (Moses et al., 2012). The photon noise (also known as shot noise or Poisson noise) is related to the quantised nature of light and the random fluctuations in the arrival and detection of the photons (Hasinoff, 2014). The standard deviation of the photon noise increases with the square root of the signal. The dark noise is driven by the shot noise of the thermally generated electrons recorded by the photodetector. Since the dark signal increases with sensor temperature and integration time, so does the dark noise. The readout and digitisation noise are related to reading the signal from the photodetector and analogue-to-digital conversion, respectively, and do not depend on the measured signal.
The highest SNR is achieved when the signal approaches the saturation level at the lowest integration time, thus, minimising the dark noise. This situation is obviously not guaranteed during field measurements as we are limited by the intensity of the natural illumination. The noise level was analysed from the radiometric calibration data which represents more realistic use case in terms of using the dynamic range of the sensor and selecting the integration time.
The radiometric calibration was performed using a 1 kW FEL lamp (and plaque, for radiance) positioned at a distance of 500 mm. The integration time during the radiance (irradiance) calibration was automatically adjusted to 32 ms (512 ms) and 128 ms (2048 ms) for the VNIR and SWIR modules, respectively. The SNR was calculated as in Eq. (1) below:
where
The noise metrics calculated from the radiometric calibration data are presented in Figure 5. The SNR values correlate with the raw signal level peaking at 300 for the VNIR and at 3000 for the SWIR modules. The lower mean SNR of the HYPSTAR-XR irradiance measurements in Figure 5A is due to the lower raw signal level when measuring the irradiance calibration standard. While the mean peak raw signal value before subtracting the dark was between 47000 DN and 49000 DN for the irradiance calibration of the SR and radiance calibration of both the SR and XR units, the average peak signal of the XR irradiance measurements remained below 41000 DN, but still within the target range of the automatic integration time adjustment.
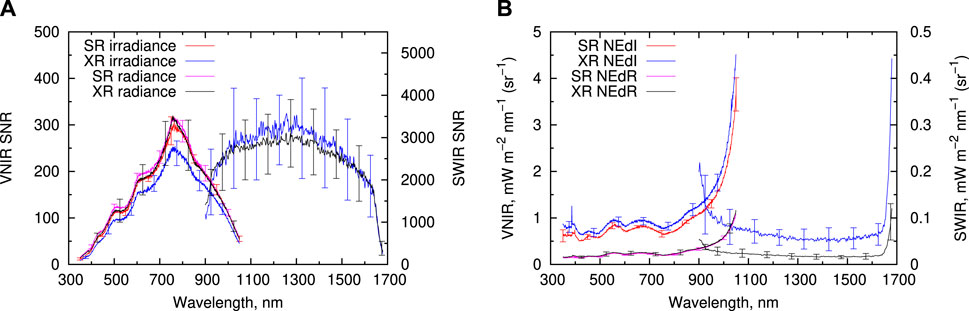
Figure 5. Mean (A) signal-to-noise ratio (SNR) and (B) noise equivalent radiance difference (NEdR) and noise equivalent irradiance difference (NEdI) of the HYPSTAR spectroradiometers during radiometric calibration. The error bars indicate the standard deviation of the results of nine SR and eight XR units.
Finally, we note that for field measurements the SNR can be improved by averaging over replicates.
3.2 Non-linearity
The radiance and irradiance levels measured in the field depend on various parameters (solar zenith angle (SZA), target reflectance, atmospheric composition, wavelength, etc.) and can vary over an order of magnitude. The raw output signal of the spectroradiometer is usually calibrated using single (ir)radiance levels.
The linearity of the VNIR and SWIR spectrometer modules was tested using two different methods: the “flux addition” method (Sanders, 1972), where the integration time was kept constant and the source radiance was changed and the “constant source” method (Pacheco-Labrador et al., 2014) where the source radiance was kept constant and the integration time was changed. The non-linearity factor
where
The non-linearity factor for the constant source method can be expressed as:
where
The radiance of the source as well as the responsivity of the spectrometer vary with wavelength, resulting in different pixel values in a single spectrum. No wavelength dependence of the non-linearity factor was evident, except for some SWIR modules, and the entire dynamic range of the sensor could be covered with measurements at only a few different integration times. The non-linearity factors obtained using the constant source method did not depend on the source radiance used for the measurements.
The non-linearity factor defined by Eqs 2, 3 describes the non-linearity of the dark-subtracted raw signal in digital counts with respect to the signal that the same instrument would record in the case of half the radiant flux when using the same instrument settings (flux addition method) or in the case of half the integration time when measuring the same radiant flux (constant source method). For instance,
A polynomial function
For non-linearity correction, the dark-subtracted pixel value
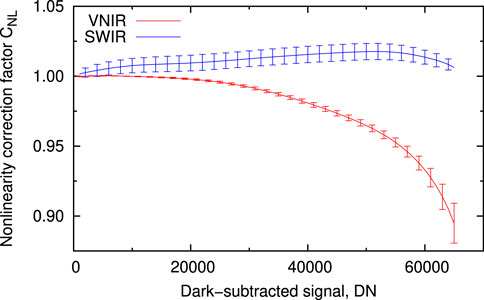
Figure 6. Mean non-linearity correction factor
3.3 Thermal sensitivity
Thermal sensitivity of the spectroradiometer can be a significant source of bias and uncertainty for radiometric measurements, especially in the NIR spectral region for instruments without thermal stabilisation for the silicon photodetectors (Salim et al., 2011; Zibordi et al., 2017; Vabson et al., 2024).
During the characterisation, the instrument was placed inside an environmental chamber. The flux from a stabilised QTH source located outside the chamber was coupled to the radiance or irradiance entrance of the HYPSTAR with an optical fibre. The temperature inside the chamber was ramped from 20°C up to 40°C and maintained for 1 hour, then ramped down to −20°C and maintained for 1 hour and then ramped back up to 20°C. The ramp-up and ramp-down rates were approximately 1°C min−1. During the experiment the lamp signal and the dark signal were alternately recorded. The dark-subtracted lamp signals were normalised to 30°C and the thermal dependence of responsivity was approximated with a second order polynomial for each spectral band.
Second order fit implies that the thermal coefficients were not constant throughout the characterised temperature range. However, the coefficients of the second degree terms of the fitted polynomials were small and the deviation from linear dependence was not significant. The temperature coefficients characterised at 30°C are presented as a function of wavelength in Figure 7. The thermal dependence was characterised using only the irradiance entrance for most of the units. The characterisation was repeated with radiance entrance for three units and the results obtained with radiance and irradiance entrances agreed within the standard deviations as shown in Figure 7B.
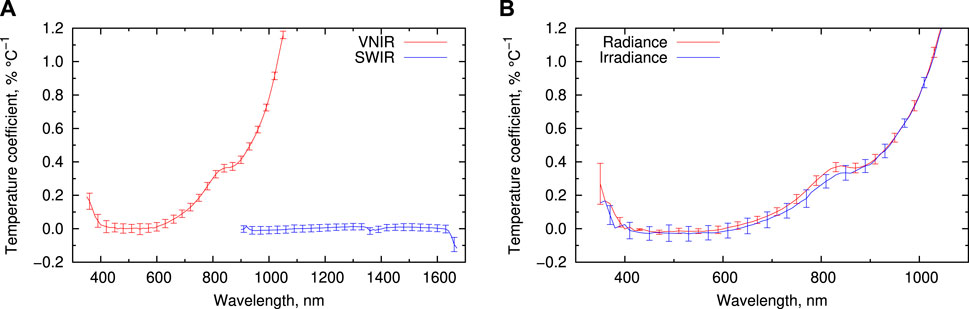
Figure 7. (A) Mean temperature coefficient of the VNIR and SWIR spectrometer modules of the HYPSTAR spectroradiometers measured at 30 °C using the irradiance entrance; (B) mean temperature coefficient of three VNIR spectrometer modules (of one XR and two SR units) measured with the radiance and irradiance entrances at 30°C. The error bars indicate the standard deviation of the temperature coefficients of 17 VNIR and eight SWIR modules (A) and three VNIR modules for both radiance and irradiance measurements (B).
3.4 Angular response
Irradiance entrance optics should collect hemispherical radiation with an angular response that varies as the cosine of the incident angle. Deviations from this ideal behaviour are expressed by the “cosine error”
where
Each radiometer was mounted on a computer-controlled rotation stage and illuminated by flux from a 450 W Xenon short arc gas discharge lamp (e.g., Mekaoui and Zibordi (2013) and references therein). The apparent size of the source was 1° which is roughly double the apparent size of the Sun. The integral cosine error defined by Eq. (6) was calculated after averaging the cosine errors
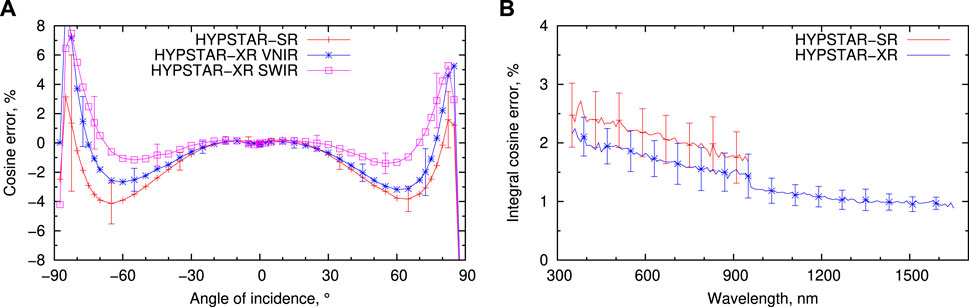
Figure 8. (A) Mean cosine error and (B) mean integral cosine error of the HYPSTAR spectroradiometers. The error bars indicate the standard deviation of the cosine error of nine SR and eight XR units.
The angular response of the radiance entrance was characterised for only a few HYPSTAR spectroradiometers using a setup similar to cosine response characterisation, but instead of the Xe source a H1 QTH lamp with a very small filament was used. As an example the characterisation result of a single HYPSTAR-SR unit measured in two orthogonal planes is shown in Figure 9. The slight asymmetry, nonuniform response within the FOV, and the FOV somewhat narrower than the nominal value given in Table 1 were characteristic to all the HYPSTAR units for which the radiance angular response was measured.
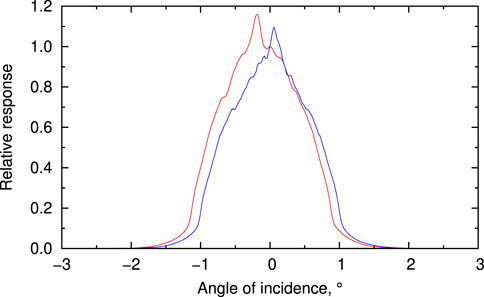
Figure 9. Angular response of a single HYPSTAR-SR spectroradiometer measured in two orthogonal planes and normalised to 0° incidence.
3.5 Polarisation sensitivity
Light reflected or scattered from some natural targets like sky or water surface can be linearly polarised to some degree (Brewster, 1815; Hansen and Travis, 1974). If polarising targets are observed with a polarisation-sensitive spectroradiometer, the measured signal depends on the alignment of the sensor relative to the target. Such sensitivity increases the measurement uncertainty unless appropriate models are used to exploit the additional information carried by the polarisation signatures.
The polarisation sensitivity of the HYPSTAR spectroradiometers was characterised by measuring the signal of an unpolarised stable source (integrating sphere illuminated by a QTH lamp) through a wire-grid polariser (Thorlabs WP50L-UB with typical extinction ratio over 2500 at 350 nm and increasing with wavelength) at 15° increments of the polariser rotation angle. The polarisation sensitivity, in percent, is defined as in Eq. (7) below (Zibordi et al., 2019):
where
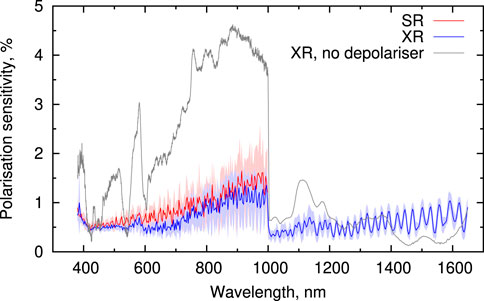
Figure 10. Mean sensitivity to linear polarisation. The shaded backgrounds indicate the standard deviation of the results of nine SR and seven XR units.
3.6 Spectral calibration
Spectral emission lines of Xe, HgAr, and Kr Pen-Ray gas discharge lamps were used for spectral calibration. The Pen-Ray lamps were measured with both optical entrances. The lamp was placed as close as possible to the irradiance entrance, without touching the protective glass dome. Behind the lamp was a white sheet of PTFE which covered the entire FOV of the radiance optics, therefore, radiance measurement recorded the lamp flux that was diffusely scattered from the PTFE.
Gaussian functions were fitted to some selected spectral emission lines. A fourth-order polynomial was used to fit the series of Gaussian means. The regression coefficients correspond to the spectral calibration coefficients used to convert pixel index to wavelength.
The different optical paths of the radiance and irradiance measurement inside the HYPSTAR result in different spectral response functions. The mean difference between the radiance and irradiance spectral calibrations is shown in Figure 11.
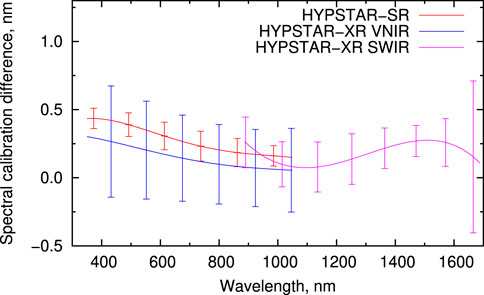
Figure 11. Mean difference between the radiance and irradiance spectral calibration. The error bars indicate the standard deviation of the results of nine SR and eight XR units.
3.7 Spectral stray light
A fraction of incoming photons of a certain wavelength are scattered inside the spectrometer and incorrectly recorded by pixels corresponding to some other wavelength. The full recorded spectrum corresponding to monochromatic input and normalised to peak value is called a spectral line spread function (LSF) (Zong et al., 2006). By tuning an adjustable monochromatic source through the entire spectral range of the sensor and recording the LSFs corresponding to each pixel, a spectral stray light matrix (SLM) can be constructed.
The SLM was determined for all the VNIR and SWIR spectrometer modules without the rest of the components (entrance optics, fibres, multiplexer) of the radiance and irradiance optical paths. A double monochromator illuminated by a QTH broadband source was used as the adjustable source of monochromatic excitation and the light was guided into the spectrometer module with a single core multimode fibre. A condenser lens was used to couple the light from the monochromator into the fibre at geometry corresponding to the nominal numerical aperture of the spectrometer module. The measured SLMs of a single VNIR and SWIR module are shown in Figure 12. The visible stray light features were found roughly similar yet with varying intensity in all units.
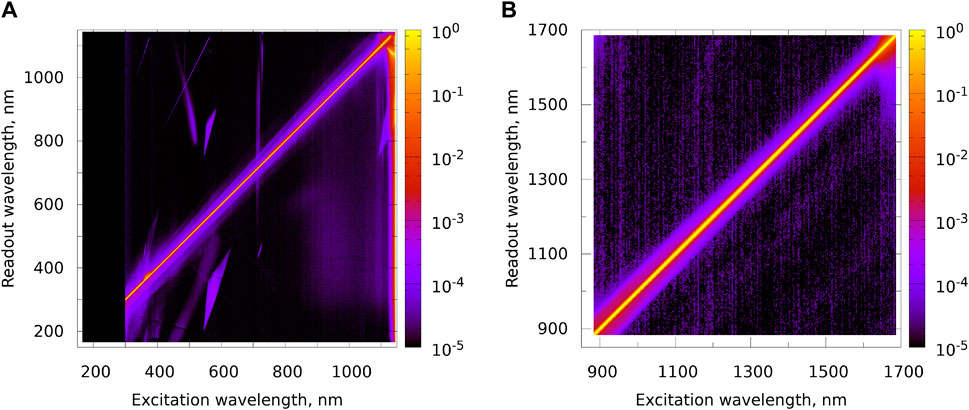
Figure 12. Spectral stray light matrices of only a single VNIR (A) and SWIR (B) spectrometer module measured without the rest of the HYPSTAR optical path.
The spectral stray light characteristics of a spectrometer module depend on illumination geometry (Kuusk et al., 2018). The different optical paths of the radiance and irradiance measurements modes of each HYPSTAR sensor result in different LSFs. Figure 13 shows the radiance and irradiance of a green diode laser measured by a HYPSTAR-SR unit compared to the corresponding LSF of its VNIR spectrometer module (a single column of the SLM shown in Figure 12A). The centre wavelength and width of the main peak is slightly different for all these three measurements. The narrow peak at double the excitation wavelength is the second order diffraction that is largely suppressed (over three orders of magnitude) but not entirely blocked.
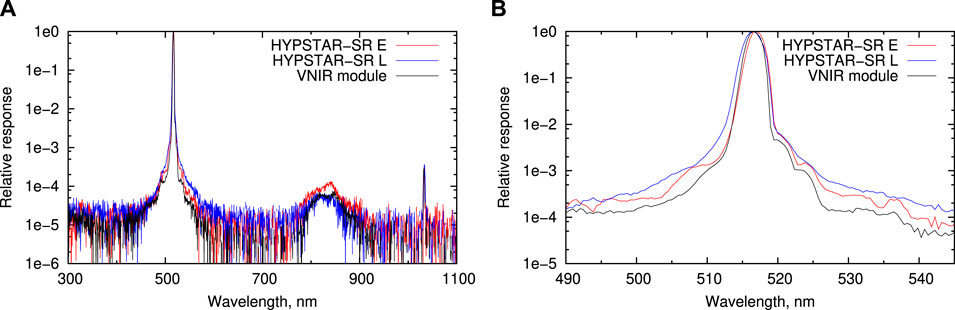
Figure 13. (A) The normalised signal of a green diode laser measured with the radiance (L) and irradiance (E) entrance of a HYPSTAR-SR and the line spread function (LSF) of the VNIR spectrometer module measured without the rest of the HYPSTAR optical path and (B) zoom in to the main peak at the excitation wavelength.
The measurement time was 12–15 h and over 2 h for each VNIR and SWIR module, respectively. Characterising the radiance and irradiance modes separately with the optical throughput reduced by the full optical path would extend the characterisation time of a single HYPSTAR to hundred(s) of hours. The experiment time could be reduced by measuring the LSF at selected wavelengths and modelling (Ylianttila et al., 2005; Kreuter and Blumthaler, 2009; Shen et al., 2009) or interpolating (Barlier-Salsi, 2014) the full SLM. This approach would likely give good results for the SWIR module since the SLM does not have fine features and varies smoothly across the spectral range (Figure 12B). However, the SLM of the VNIR module shown in Figure 12A is much more complex and has fine features that can not be easily modelled or interpolated. The most practical characterisation approach likely involves the combination of LSFs measurements for each pixel (or at least every few pixels) at shorter wavelengths and for a more sparse set of pixels in the NIR.
The stray light of the VNIR module significantly increases above 1100 nm, but the effect on field measurements is marginal due to the very low sensitivity of the silicon detector in this spectral region. Likewise, the sensitivity drops in the UV (as well as the natural illumination) and the stray light was not characterised below 300 nm.
The temperature coefficient in the UV increases, as can be seen in Figure 7. Similar results obtained for a spectrometer with a silicon charge-coupled device (CCD) array detector have been explained by the temperature-dependent reflectivity coefficients of the silicon material (see Nevas et al. (2012) and references therein). However, the dark-subtracted raw signal of the incandescent source used for the characterisation was nearly three orders of magnitude lower at 350 nm compared to the peak signal at 760 nm, which gives reason to believe that the increase of the measured temperature coefficient in the UV includes stray light contributions from the longer wavelengths, for which the temperature dependence of the silicon photodetector is stronger.
4 Reference LED measurements and long-term stability
One of the unique features of the HYPSTAR system is the reference LED for monitoring the stability of the radiometric calibration during long-term unsupervised deployment. It is rather common that the responsivity of radiometers change over time (Vabson et al., 2024). In addition to the inherent sensitivity change (usually decay) of the radiometer there is additional external contribution related to long-term unattended outdoor measurements which is the contamination of the sensor’s optics by ambient conditions, including weather and wildlife activity. The responsivity change can be monitored by regularly measuring a stable reference source. The HYPSTAR systems are programmed to measure the reference LED at night to reduce the amount of background illumination affecting this measurement. The generally lower nighttime temperatures (and associated lower temperature variations) have the advantage to limit the thermal noise. Moreover, the nightly measurements do not interfere with the daily surface reflectance measurement sequences.
The reference LED measurements are illustrated by the time series of two HYPSTAR deployments. Three measurement sequences of LED and dark acquisitions were scheduled for each night at 1 hour intervals around the local midnight. Initially, due to the limitations of the host unit software, the sequence contained only a single light measurement with the irradiance entrance followed by ten dark acquisitions. After the host system software update in the middle of July 2023 the sequence was changed to ten LED measurements followed by ten dark measurements with both entrances. The optical entrances were individually aligned with the reference LED by tilt axis movement of the PT before the measurement. Some of the scheduled acquisitions were not successful mainly for three reasons: 1) failure to reach the LED temperature setpoint within 2 min; 2) rain detected and sequence aborted or skipped; 3) system downtime either due to the site activities (dredging works at the HYPSTAR-SR location) or software errors (both sites were used for beta-testing the host system software developments which on few occasions required a site visit to fix).
The HYPSTAR-SR system was deployed on 27 April 2023 in the Võrtsjärv Limnological Station (Nõges et al., 2001) on the shore of Lake Võrtsjärv in central Estonia. The reference LED measurements were started on 8 May and 14 July for irradiance and radiance, respectively. The LED acquisition time series is displayed in Figure 14A as percent difference from the mean of the entire time series. Each data point was calculated as the mean light signal minus the mean dark signal and averaged over all the VNIR detector pixels without applying any calibration or corrections to the raw data. The decrease of variability of the irradiance data in the middle of July is caused by better averaging after the light measurement count was increased. Both radiance and irradiance signals decreased at about −0.5 % months−1 until in the middle of September there was a sudden decrease of the measured LED signal, especially for the radiance measurements. The radiometer and LED optics were cleaned on 21 September and the measured LED signals returned to the original levels. Before cleaning there were some light spider webs covering the radiance and irradiance entrances, the window of the reference LED looked visually clean.
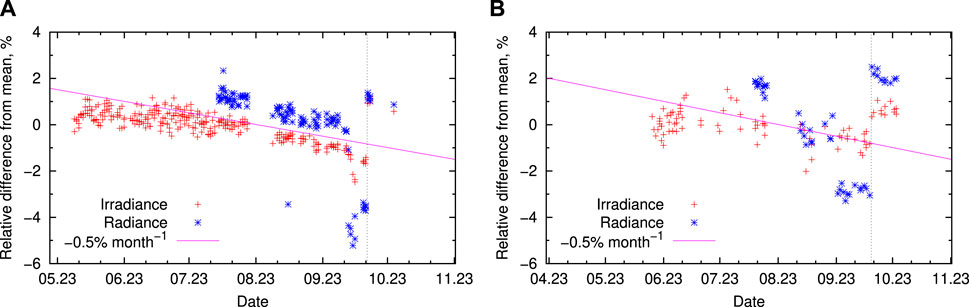
Figure 14. Time series of the reference LED signal as percent difference from the mean for HYPSTAR-SR (A) and HYPSTAR-XR (B). The horizontal axis starts at the time of field deployment, the vertical dotted lines indicate cleaning of the optical windows of the radiometer and the reference LED. −0.5 % months−1 rate is shown for reference.
The HYPSTAR-XR system was deployed on 30 March 2023 in a rural area in South-Eastern Estonia at the Järvselja Experimental Forestry Centre. It is mounted above a mixed forest on top of a 30 m scaffolding mast which is part of the SMEAR-Estonia research station infrastructure (Noe et al., 2015). The irradiance (radiance) reference LED measurements started on 25 May (19 July), and the corresponding time series are shown in Figure 14B. The sensor optics were cleaned on 19 September from spider webs, whitish deposit (possibly dust or pollen) and a brown spot of unknown origin. As for the HYPSTAR-SR, the cleaning procedure restored the LED signals to the initial levels.
The reference LED measurement time series presented in Figure 14 indicate that the main contribution of the long-term responsivity change of these two HYPSTAR deployments is caused by the contamination of the entrance optics. If the radiance and irradiance measurement time series have different trends, it is quite likely that the contamination is on the radiometer entrance optics. However, if the trends are similar like for the HYPSTAR-SR in July-August (Figure 14A) it is not possible to determine if the contamination affects the radiometer entrance optics or the LED window. Nevertheless, the reference LED measurements are helpful for detecting major contamination events like the spider webs that appeared in September on both sites.
Most of the HYPSTAR radiometers of the third manufacturing batch have been calibrated only once and there is no calibration history that could be used for evaluation of the long-term stability. Only the two HYPSTARs that were deployed at the Estonian sites have post-deployment calibration available from May 2024. The radiometers were calibrated before and after cleaning the entrance optics to evaluate also the impact of contamination. The mean change of radiometric responsivity of the HYPSTAR-SR (HYPSTAR-XR VNIR; SWIR) compared to the pre-deployment calibration made in January 2023 was −1.5% (0.2%; −0.4%) for radiance and 0.6% (0.4%; 0.4%) for irradiance. The mean impact of fore-optics contamination was −0.8% (−0.8%; −0.4%) for radiance and −2.2% (−1.4%; −0.7%) for irradiance. The change of responsivity over 16 months remained within the calibration uncertainty for both of these HYPSTAR radiometers.
5 Future improvements
The HYPERNETS network is expected to expand slowly in coming years which requires production of new HYPSTAR systems (Ruddick et al., 2024a). There are a number of design refinements that are planned to be implemented:
• During the prototyping and testing phase it was necessary to have easy access to system components inside the enclosure of the host unit. As can be seen in Figure 3B there is a lot of free space inside the host unit and the layout of the components can be optimised which allows using smaller and lighter enclosure.
• Currently the two surveillance cameras are powered by 12 V from the host system and use either wired or wireless data link depending on the site infrastructure. Adding a power over Ethernet (PoE) switch to the host unit and replacing the cameras with PoE-capable ones allows unifying the system topology by using a single cable for both power and data.
• The cables interconnecting the subsystems have plastic IP-68-rated Samtec AccliMate series bayonet connectors. The alignment keys of these circular connectors are rather small and the plastic shell not rigid enough to prevent mismating by 90° or 180° if the contact pin arrangement allows it (e.g., the four-pin input power connector) and slightly more force is applied. The connectors will be replaced by more robust ones that can not be easily mated in wrong orientation.
• It has been observed that LEDs tend to exhibit instability in light output for a period of time right after manufacturing. Example graphs by Liu et al. (2012) show that for the first couple of hundred of hours the luminous efficiency is unstable, but at some point it reaches a plateau before starting to gradually degrade. The LEDs used in the HYPSTAR reference units produced during the H2020/HYPERNETS project were not aged before deployment in the field. Pre-ageing of the LEDs is planned as a future improvement for the next HYPSTAR reference units.
• After powering on with constant current, the LEDs exhibit a short-term optical output power change related to resistance change due to internal heating until thermal equilibrium is reached. During this heating period a drop in diode forward voltage
• The reference units presently feature a white LED which does not emit in the SWIR. Adding SWIR diode(s) would be desirable for monitoring the calibration stability of the HYPSTAR-XR units. While high-power, VNIR broadband LEDs are readily available thanks to phosphor conversion and common lighting technologies, the broadband SWIR emitters available on the market have a significantly lower power output. Narrowband diodes can alternatively be used, especially because it is not essential to monitor all wavelengths to characterise the calibration stability.
• Characterising the spectral stray light only for the spectrometer module without the entrance optics, fibres, and multiplexer does not adequately represent the spectral stray light of neither radiance nor irradiance measurement. The spectral stray light measurement has to characterise the entire optical path.
• Only radiometric and spectral calibration coefficients and non-linearity correction factors are currently used in the hypernets-processor (De Vis et al., 2024b). The rest of the characterisations described in Section 3 need further work, especially in terms of uncertainty evaluation for being mature enough to be incorporated in the data processing pipeline.
6 Conclusion
A new hyperspectral radiometer system HYPSTAR is described, which enables fully automated field measurements of the multiangular reflectance of land and water targets. The hyperspectral design is suitable to the validation of remote sensing satellite observations from any sensor of choice. The multiangular capability is especially useful for validating the land data with in-situ acquisitions captured at (or near) the satellite view geometry.
The HYPSTAR spectroradiometers are available in two configurations. The HYPSTAR-SR variant covers the VNIR spectral range at 3 nm FWHM resolution and is deployed at water sites. The HYPSTAR-XR units, which are used at the land sites, extend the spectral range to 1680 nm with a 10 nm spectral resolution in the SWIR domain. All HYPSTAR radiometers have both radiance and irradiance optical entrances, multiplexed into a single spectrometer module for the SR units and into a set of modules for the XR units. The multiplexer acts as a mechanical shutter when neither of the entrance is selected. This design reduces 1) laboratory characterisation efforts; 2) uncertainties due to correlations between radiance and irradiance measurements; and 3) cost, mass, size, and power consumption. The tradeoffs are reduced optical throughput and the impossibility of making concurrent radiance and irradiance measurements. The spectroradiometers also include a 5 MP RGB camera coaligned with the radiance and irradiance entrances for capturing diagnostic snapshots of the targets.
The spectroradiometer is mounted on a two-axis PT unit that provides full rotational freedom, including towards the LED source used to monitor the stability of the radiometric calibration. The system is controlled by a host unit that takes care of the scheduling and data acquisition, storage, and transfer to the central WATERHYPERNET or LANDHYPERNET server.
The performance of the HYPSTAR spectroradiometers was studied in the laboratory. The characterised parameters include radiometric responsivity, SNR, non-linearity, thermal sensitivity, angular response, polarisation sensitivity, spectral calibration, and spectral stray light. The average and standard deviation of the characteristics of nine SR and eight XR units are presented. Not enough calibration history has been accumulated for evaluating the long-term stability of the HYPSTAR radiometers. The pre- and post-deployment radiometric responsivities agreed within calibration uncertainty after 1 year deployment in the field for one SR and one XR unit.
The reference LED measurements are demonstrated for a HYPSTAR-SR deployment at an inland water site and a HYPSTAR-XR setup in a hemiboreal mixed forest for 4–5 months in the summer and autumn. Decay of the radiometric responsivity was evident for both setups, as well as recovery to the initial level after cleaning the fore-optics.
Data availability statement
The raw data supporting the conclusions of this article will be made available by the authors, without undue reservation.
Author contributions
JK: Conceptualization, Data curation, Formal Analysis, Funding acquisition, Investigation, Methodology, Project administration, Resources, Software, Supervision, Visualization, Writing–original draft, Writing–review and editing, Validation. AC: Investigation, Methodology, Resources, Software, Writing–review and editing. DD: Conceptualization, Funding acquisition, Methodology, Project administration, Supervision, Validation, Writing–review and editing. KD: Investigation, Resources, Visualization, Writing–review and editing. KF: Investigation, Resources, Software, Writing–review and editing. JKi: Methodology, Resources, Writing–review and editing. KL: Data curation, Formal Analysis, Investigation, Methodology, Resources, Software, Visualization, Writing–original draft, Writing–review and editing. EL: Conceptualization, Methodology, Resources, Writing–review and editing. SM: Methodology, Resources, Writing–review and editing. CP: Conceptualization, Methodology, Resources, Software, Writing–review and editing. KR: Conceptualization, Funding acquisition, Methodology, Project administration, Supervision, Validation, Writing–original draft, Writing–review and editing.
Funding
The author(s) declare that financial support was received for the research, authorship, and/or publication of this article. This study was conducted by the HYPERNETS project funded by the European Union’s Horizon 2020 research and innovation programme (grant agreement 775983), by the HYPERNET-POP project funded by the European Space Agency (contract 4000139081/22/I-EF), and using the facilities funded by the Estonian Research Council grant TT8 and the Estonian State Shared Service Centre project KosEST (grant number 2014-2020.4.01.20-0284).
Acknowledgments
The authors would like to thank the partners of the HYPERNETS project for setting up and operating the HYPSTAR systems at several field sites and providing useful feedback for improving the design. The Estonian University of Life Sciences is acknowledged for operating the SMEAR-Estonia and Võrtsjärv Limnological Station infrastructure and hosting the HYPSTAR-XR and HYPSTAR-SR systems. We would like to express our deepest gratitude to the two reviewers whose insightful comments and constructive feedback greatly contributed to the improvement of this manuscript.
Conflict of interest
The intellectual property rights of the HYPSTAR design and know-how belong to University of Tartu and Sorbonne University. The HYPSTAR® trademark is registered by University of Tartu.
JK is the owner and chief executive officer of the private limited company RSware OÜ (Estonia) which is preparing the commercialisation of the HYPSTAR spectroradiometer systems.
The remaining authors declare that the research was conducted in the absence of any commercial or financial relationships that could be construed as a potential conflict of interest.
Publisher’s note
All claims expressed in this article are solely those of the authors and do not necessarily represent those of their affiliated organizations, or those of the publisher, the editors and the reviewers. Any product that may be evaluated in this article, or claim that may be made by its manufacturer, is not guaranteed or endorsed by the publisher.
Footnotes
1https://github.com/HYPERNETS/libhypstar, accessed on 15 November 2023.
2https://github.com/HYPERNETS/hypernets_tools, accessed on 15 November 2023.
References
Banks, A. C., Vendt, R., Alikas, K., Bialek, A., Kuusk, J., Lerebourg, C., et al. (2020). Fiducial reference measurements for satellite ocean colour (FRM4SOC). Remote Sens. 12, 1322. doi:10.3390/rs12081322
Barlier-Salsi, A. (2014). Stray light correction on array spectroradiometers for optical radiation risk assessment in the workplace. J. Radiol. Prot. 34, 915–930. doi:10.1088/0952-4746/34/4/915
Białek, A., Goodman, T., Woolliams, E., Brachmann, J. F. S., Schwarzmaier, T., Kuusk, J., et al. (2020). Results from verification of reference irradiance and radiance sources laboratory calibration experiment campaign. Remote Sens. 12, 2220. doi:10.3390/rs12142220
Bouvet, M., Thome, K., Berthelot, B., Bialek, A., Czapla-Myers, J., Fox, N. P., et al. (2019). RadCalNet: a radiometric calibration network for earth observing imagers operating in the visible to shortwave infrared spectral range. Remote Sens. 11, 2401. doi:10.3390/rs11202401
Brewster, D. (1815). On the laws which regulate the polarisation of light by reflexion from transparent bodies. By David Brewster, LL. D. F. R. S. Edin. and F. S. A. Edin. In a letter addressed to Right Hon. Sir Joseph Banks, Bart. K. B. P. R. S. Philos. Trans. R. Soc. Lond 105, 125–159. doi:10.1098/rstl.1815.0010
Caron, J., Bézy, J.-L., Courrèges-Lacoste, G. B., Sierk, B., Meynart, R., Richert, M., et al. (2017). “Polarization scramblers in earth observing spectrometers: lessons learned from Sentinel-4 and 5 phases A/B1,” in International conference on space optics — ICSO 2012. Editors B. Cugny, E. Armandillo, and N. Karafolas (Bellingham, WA, United States: SPIE). doi:10.1117/12.2309044
Carswell, T., Costa, M., Young, E., Komick, N., Gower, J., and Sweeting, R. (2017). Evaluation of MODIS-Aqua atmospheric correction and chlorophyll products of western North American coastal waters based on 13 years of data. Remote Sens. 9, 1063. doi:10.3390/rs9101063
Cengiz, C., Azarifar, M., and Arik, M. (2022). A critical review on the junction temperature measurement of light emitting diodes. Micromachines 13, 1615. doi:10.3390/mi13101615
Cesana, I., Bresciani, M., Cogliati, S., Giardino, C., Gupana, R., Manca, D., et al. (2021). Preliminary investigation on phytoplankton dynamics and primary production models in an oligotrophic lake from remote sensing measurements. Sensors 21, 5072. doi:10.3390/s21155072
Cogliati, S., Sarti, F., Chiarantini, L., Cosi, M., Lorusso, R., Lopinto, E., et al. (2021). The PRISMA imaging spectroscopy mission: overview and first performance analysis. Remote Sens. Environ. 262, 112499. doi:10.1016/j.rse.2021.112499
De Vis, P., Howes, A., Vanhellemont, Q., Bialek, A., Morris, H., Sinclair, M., et al. (2024a). Feasibility of satellite vicarious calibration using HYPERNETS surface reflectances from Gobabeb and Princess Elisabeth Antarctica sites. Front. Remote Sens. 5. doi:10.3389/frsen.2024.1323998
De Vis, P., Hunt, S., Vanhellemont, Q., Ruddick, K. G., and Bialek, A. (2024b). Generating hyperspectral reference measurements for surface reflectance from the LANDHYPERNET and WATERHYPERNET networks. Front. Remote Sens. 5. doi:10.3389/frsen.2024.1347230
Dogliotti, A. I., Piegari, E., Rubinstein, L., Perna, P., and Ruddick, K. G. (2024). Using the automated HYPERNETS hyperspectral system for multi-mission satellite ocean colour validation in the Río de la Plata, accounting for different spatial resolutions. Front. Remote Sens. 5. doi:10.3389/frsen.2024.1354662
Doxaran, D., ElKilani, B., Corizzi, A., and Goyens, C. (2024). Validation of satellite-derived water-leaving reflectance in contrasted French coastal waters based on HYPERNETS field measurements. Front. Remote Sens. 4. doi:10.3389/frsen.2023.1290110
Eugène, C., and Deswert, J.-M. (2009). “Photoelectric characterization of electroluminescent photodiodes,” in LEDs for lighting applications. Editor P. Mottier (John Wiley and Sons, Ltd.), 165–196. doi:10.1002/9780470612019.ch6
Gatebe, C. K., and King, M. D. (2016). Airborne spectral BRDF of various surface types (ocean, vegetation, snow, desert, wetlands, cloud decks, smoke layers) for remote sensing applications. Remote Sens. Environ. 179, 131–148. doi:10.1016/j.rse.2016.03.029
González Vilas, L., Brando, V. E., Concha, J. A., Goyens, C., Dogliotti, A. I., Doxaran, D., et al. (2024). Validation of satellite water products based on HYPERNETS in situ data using a match-up database (MDB) file structure. Front. Remote Sens. 5. doi:10.3389/frsen.2024.1330317
Gorman, E. T., Kubalak, D. A., Patel, D., Dress, A., Mott, D. B., Meister, G., et al. (2019). “The NASA plankton, aerosol, cloud, ocean ecosystem (PACE) mission: an emerging era of global, hyperspectral earth system remote sensing,” in Sensors, systems, and next-generation satellites XXIII. Editors S. P. Neeck, P. Martimort, and T. Kimura (Bellingham, WA, United States: International Society for Optics and Photonics SPIE). doi:10.1117/12.2537146
Goyens, C., and Ruddick, K. (2023). Improving the standard protocol for above-water reflectance measurements: 1. estimating effective wind speed from angular variation of sunglint. Appl. Opt. 62, 2442–2455. doi:10.1364/AO.481787
Goyens, C., Ruddick, K., and Kuusk, J. (2018). “Spectral requirements for the development of a new hyperspectral radiometer integrated in automated networks - the Hypernets sensor,” in 2018 9th Workshop on Hyperspectral Image and Signal Processing: Evolution in Remote Sensing (WHISPERS), Amsterdam, Netherlands, 23-26 September 2018, 1–5. doi:10.1109/WHISPERS.2018.8747259
Green, R. O., Mahowald, N., Thompson, D. R., Ung, C., Brodrick, P., Pollock, R., et al. (2023). “Performance and early results from the earth surface mineral dust source investigation (EMIT) imaging spectroscopy mission,” in 2023 IEEE Aerospace Conference, Big Sky, MT, USA, 04-11 March 2023, 1–10. doi:10.1109/AERO55745.2023.10115851
Hansen, J. E., and Travis, L. D. (1974). Light scattering in planetary atmospheres. Space Sci. Rev. 16, 527–610. doi:10.1007/BF00168069
Hasinoff, S. W. (2014). “Photon, Poisson noise,” in Computer vision: a reference guide. Editor K. Ikeuchi (Boston, MA: Springer US), 608–610. doi:10.1007/978-0-387-31439-6_482
Hooker, S. B., Bernhard, G., Morrow, J. H., Booth, C. R., Comer, T., Lind, R. N., et al. (2012). Optical sensors for planetary radiant energy (OSPREy): calibration and validation of current and next-generation NASA missions. Tech. rep. Greenbelt, MD, USA: NASA.
Konnik, M., and Welsh, J. (2014). High-level numerical simulations of noise in CCD and CMOS photosensors: review and tutorial. ArXiv. doi:10.48550/arXiv.1412.4031
Kreuter, A., and Blumthaler, M. (2009). Stray light correction for solar measurements using array spectrometers. Rev. Sci. Instrum. 80, 096108. doi:10.1063/1.3233897
Kuusk, A., Kuusk, J., and Lang, M. (2014). Measured spectral bidirectional reflection properties of three mature hemiboreal forests. Agric. For. Meteorol. 185, 14–19. doi:10.1016/j.agrformet.2013.10.011
Kuusk, J., Ansko, I., Bialek, A., Vendt, R., and Fox, N. (2018). Implication of illumination beam geometry on stray light and bandpass characteristics of diode array spectrometer. IEEE J. Sel. Top. Appl. Earth Obs. Remote Sens. 11, 2925–2932. doi:10.1109/JSTARS.2018.2841772
Liu, L., Ling, M., Yang, J., Xiong, W., Jia, W., and Wang, G. (2012). Efficiency degradation behaviors of current/thermal co-stressed GaN-based blue light emitting diodes with vertical-structure. J. Appl. Phys. 111. doi:10.1063/1.4712030
Mekaoui, S., and Zibordi, G. (2013). Cosine error for a class of hyperspectral irradiance sensors. Metrologia 50, 187–199. doi:10.1088/0026-1394/50/3/187
Mobley, C. D. (1999). Estimation of the remote-sensing reflectance from above-surface measurements. Appl. Opt. 38, 7442–7455. doi:10.1364/AO.38.007442
Morris, H., Sinclair, M., De Vis, P., and Bialek, A. (2024). Utilising LANDHYPERNET data products over a deciduous broadleaf forest to validate Sentinel-2 and Landsat surface reflectance products. Front. Remote Sens. 5. doi:10.3389/frsen.2024.1322760
Moses, W. J., Bowles, J. H., Lucke, R. L., and Corson, M. R. (2012). Impact of signal-to-noise ratio in a hyperspectral sensor on the accuracy of biophysical parameter estimation in case II waters. Opt. Express 20, 4309–4330. doi:10.1364/OE.20.004309
Nevas, S., Teuber, A., Sperling, A., and Lindemann, M. (2012). Stability of array spectroradiometers and their suitability for absolute calibrations. Metrologia 49, S48–S52. doi:10.1088/0026-1394/49/2/S48
Noe, S. M., Niinemets, Ü., Krasnova, A., Krasnov, D., Motallebi, A., Kängsepp, V., et al. (2015). SMEAR Estonia: perspectives of a large-scale forest ecosystem–atmosphere research infrastructure. For. stud. 63, 56–84. doi:10.1515/fsmu-2015-0009
Nõges, P., Kangur, A., Järvalt, A., and Nõges, T. (2001). History of hydrological and biological investigations of lake Võrtsjärv. Proc. Est. Acad. Sci. Biol. Ecol. 50, 180–193. doi:10.3176/biol.ecol.2001.3.04
Pacheco-Labrador, J., Ferrero, A., and Martín, M. P. (2014). Characterizing integration time and gray-level-related nonlinearities in a NMOS sensor. Appl. Opt. 53, 7778–7786. doi:10.1364/AO.53.007778
Peters, S., Laanen, M., Groetsch, P., Ghezehegn, S., Poser, K., Hommersom, A., et al. (2018). “WISPstation: a new autonomous above water radiometer system,” in Proceedings of the ocean optics XXIV conference (Croatia: Dubrovnik), 7–12. doi:10.5281/zenodo.2533079
Pulli, T., Kärhä, P., and Ikonen, E. (2013). A method for optimizing the cosine response of solar UV diffusers. J. Geophys. Res. Atmos. 118, 7897–7904. doi:10.1002/jgrd.50642
Ruddick, K. G., Bialek, A., Brando, V. E., De Vis, P., Dogliotti, A. I., Doxaran, D., et al. (2024a). HYPERNETS: a network of automated hyperspectral radiometers to validate water and land surface reflectance (380–1680 nm) from all satellite missions. Front. Remote Sens. 5. doi:10.3389/frsen.2024.1372085
Ruddick, K. G., Brando, V. E., Corizzi, A., Dogliotti, A. I., Doxaran, D., Goyens, C., et al. (2024b). WATERHYPERNET: a prototype network of automated in situ measurements of hyperspectral water reflectance for satellite validation and water quality monitoring. Front. Remote Sens. doi:10.3389/frsen.2024.1347520
Ruddick, K. G., Voss, K., Boss, E., Castagna, A., Frouin, R., Gilerson, A., et al. (2019). A review of protocols for fiducial reference measurements of water-leaving radiance for validation of satellite remote-sensing data over water. Remote Sens. 11, 2198. doi:10.3390/rs11192198
Salim, S. G. R., Fox, N. P., Theocharous, E., Sun, T., and Grattan, K. T. V. (2011). Temperature and nonlinearity corrections for a photodiode array spectrometer used in the field. Appl. Opt. 50, 866–875. doi:10.1364/AO.50.000866
Sanders, C. L. (1972). Accurate measurements of and corrections for nonlinearities in radiometers. J. Res. Natl. Bur. of Stand. A Phys. and Chem. 76 (5), 437–453. doi:10.6028/jres.076A.039
Schinke, C., Pollex, H., Hinken, D., Wolf, M., Bothe, K., Kröger, I., et al. (2020). Calibrating spectrometers for measurements of the spectral irradiance caused by solar radiation. Metrologia 57, 065027. doi:10.1088/1681-7575/abafc5
Shen, H., Pan, J., Feng, H., and Liu, M. (2009). Stray light errors in spectral colour measurement and two rejection methods. Metrologia 46, 129–135. doi:10.1088/0026-1394/46/1/017
Slivkoff, M. M. (2014). “Ocean colour remote sensing of the Great Barrier Reef waters”. Ph.D. thesis (Bentley, Australia: Curtin University).
Storch, T., Honold, H.-P., Chabrillat, S., Habermeyer, M., Tucker, P., Brell, M., et al. (2023). The EnMAP imaging spectroscopy mission towards operations. Remote Sens. Environ. 294, 113632. doi:10.1016/j.rse.2023.113632
Vabson, V., Ansko, I., Duong, K., Vendt, R., Kuusk, J., Ruddick, K., et al. (2024). Complete characterization of ocean color radiometers. Front. Remote Sens. 5. doi:10.3389/frsen.2024.1320454
Ylianttila, L., and Schreder, J. (2005). Temperature effects of PTFE diffusers. Opt. Mater. 27, 1811–1814. doi:10.1016/j.optmat.2004.11.008
Ylianttila, L., Visuri, R., Huurto, L., and Jokela, K. (2005). Evaluation of a single-monochromator diode array spectroradiometer for sunbed UV-radiation measurements. Photochem. Photobiol. 81, 333–341. doi:10.1111/j.1751-1097.2005.tb00192.x
Zibordi, G., Mélin, F., Berthon, J.-F., Holben, B., Slutsker, I., Giles, D., et al. (2009). AERONET-OC: a network for the validation of ocean color primary products. J. Atmos. Ocean. Technol. 26, 1634–1651. doi:10.1175/2009JTECHO654.1
Zibordi, G., Talone, M., and Jankowski, L. (2017). Response to temperature of a class of in situ hyperspectral radiometers. J. Atmos. Ocean. Technol. 34, 1795–1805. doi:10.1175/JTECH-D-17-0048.1
Zibordi, G., Voss, K. J., Johnson, B. C., and Mueller, J. (2019). IOCCG ocean optics and biogeochemistry protocols for satellite ocean colour sensor validation. IOCCG Protoc. Ser. 3. doi:10.25607/OBP-691
Keywords: satellite validation, hyperspectral surface reflectance, automated field spectroradiometry system, WATERHYPERNET, LANDHYPERNET, HYPSTAR
Citation: Kuusk J, Corizzi A, Doxaran D, Duong K, Flight K, Kivastik J, Laizans K, Leymarie E, Muru S, Penkerc’h C and Ruddick K (2024) HYPSTAR: a hyperspectral pointable system for terrestrial and aquatic radiometry. Front. Remote Sens. 5:1347507. doi: 10.3389/frsen.2024.1347507
Received: 30 November 2023; Accepted: 12 June 2024;
Published: 16 July 2024.
Edited by:
Enner Alcântara, São Paulo State University, BrazilReviewed by:
Matteo Ottaviani, National Aeronautics and Space Administration (NASA), United StatesMhd. Suhyb Salama, University of Twente, Netherlands
Copyright © 2024 Kuusk, Corizzi, Doxaran, Duong, Flight, Kivastik, Laizans, Leymarie, Muru, Penkerc’h and Ruddick. This is an open-access article distributed under the terms of the Creative Commons Attribution License (CC BY). The use, distribution or reproduction in other forums is permitted, provided the original author(s) and the copyright owner(s) are credited and that the original publication in this journal is cited, in accordance with accepted academic practice. No use, distribution or reproduction is permitted which does not comply with these terms.
*Correspondence: Joel Kuusk, joel.kuusk@ut.ee