- 1U.S. Geological Survey, California Water Science Center, Sacramento, CA, United States
- 2Pepperwood Preserve, Santa Rosa, CA, United States
- 3Earth Systems Modeling Earth Knowledge, Earth Knowledge Inc., Tucson, AZ, United States
- 4Department of Integrative Biology, University of California, Berkeley, Berkeley, CA, United States
- 5Department of Environmental Science, Policy, and Management, University of California, Berkeley, Berkeley, CA, United States
- 6Black Swift Technologies, Boulder, CO, United States
- 7Weather Stream Inc., Boulder, CO, United States
- 8Department of Environmental Science and Policy, University of California, Davis, Davis, CA, United States
Soil moisture maps provide quantitative information that, along with climate and energy balance, is critical to integrate with hydrologic processes for characterizing landscape conditions. However, soil moisture maps are difficult to produce for natural landscapes because of vegetation cover and complex topography. Satellite-based L-band microwave sensors are commonly used to develop spatial soil moisture data products, but most existing L-band satellites provide only coarse scale (one to tens of kilometers grid size), information that is unsuitable for measuring soil moisture variation at hillslope or watershed-scales. L-band sensors are typically deployed on satellite platforms and aircraft but have been too large to deploy on small uncrewed aircraft systems (UAS). There is a need for greater spatial resolution and development of effective measures of soil moisture across a variety of natural vegetation types. To address these challenges, a novel UAS-based L-band radiometer system was evaluated that has recently been tested in agricultural settings. In this study, L-band UAS was used to map soil moisture at 3–50-m (m) resolution in a 13 square kilometer (km2) mixed grassland-forested landscape in Sonoma County, California. The results represent the first application of this technology in a natural landscape with complex topography and vegetation. The L-band inversion of the radiative transfer model produced soil moisture maps with an average unbiased root mean squared error (ubRMSE) of 0.07 m3/m3 and a bias of 0.02 m3/m3. Improved fine-scale soil moisture maps developed using UAS-based systems may be used to help inform wildfire risk, improve hydrologic models, streamflow forecasting, and early detection of landslides.
1 Introduction
Although a small component of the water budget by volume, soil moisture is essential for characterizing antecedent conditions and quantifying water resources for vegetation survival, reservoir forecasting models, drought risk, and flood protection. This is because soil moisture is a key state variable that influences, and is influenced by, water and energy fluxes. It also influences how rainfall is divided into infiltration, runoff, recharge, and evapotranspiration (Seneviratne et al., 2010; Ali et al., 2015). Land and natural resource managers can benefit from accurate, high spatial and temporal resolution soil moisture data to inform reservoir operations, agricultural management, and water resources management. Current soil moisture data fails to provide measurements with adequate spatial and temporal resolution for field-to watershed-scale studies. Point measurements of soil moisture are temporally resolved, yet spatially sparse and do not typically represent the surrounding area, especially at resolutions from 10s to 100s of meters (m) (Vinnikov et al., 1996; Loew, 2008; Crow et al., 2012). Remotely sensed global soil moisture products are too spatially coarse for regional and local applications. Consequently, soil moisture products at a fine resolution are useful for drought and wildfire risk modeling (Seneviratne et al., 2010; Chaparro et al., 2016), as well as sustainable agriculture and global food security (Karthikeyan and Mishra, 2021). An improved representation of soil moisture dynamics at a fine resolution may also lead to improved safety from flooding for populations in areas with major reservoirs (Zhai et al., 2018; Hettiarachchi et al., 2019) and advance streamflow forecasting skill and water supply reliability (Wood et al., 2016; Harpold et al., 2017).
Due to the unique dielectric properties of water, electromagnetic methods like time domain reflectometry (TDR), ground penetrating radar (GPR), or microwave remote sensing can all be used to estimate water content based on the dielectric properties of the target medium (Robinson et al., 2003). Air and soil have a much lower dielectric constant (1–10) than water (80); therefore, soil dielectric properties and emissivity are strongly influenced by water content in soil and vegetation (Wigneron et al., 2017). Microwave remote sensing is commonly used to quantify precipitation, snow and ice water content, and soil moisture. Microwave remote sensing can be advantageous over other types of remote sensing because it is not as affected by atmospheric interference nor is it dependent on incoming solar radiation as optical remote sensing; therefore, data can be acquired day or night and during cloudy weather (Hossain and Easson, 2016). Due to the ability to retrieve a signal below the soil surface (even through moderate-density vegetation), relatively low interference from radio communications, and the dielectric properties of water, L-band (15–30 centimeter (cm) wavelength) radiometer data is widely accepted as the most commonly used microwave band to estimate soil moisture (Hossain and Easson, 2016; Mohanty et al., 2017). L-band is considered a protected band for remote sensing observations but there can still be interference from communications. Passive microwave data from satellites are generally very coarse in resolution (10s of kilometers (km)) but provide data every 1–3 days. In contrast, active microwave data offer a higher resolution (10s to 100s of m), but typically provide data every 5–12 days. Active microwave data is often less accurate compared to passive microwave data due to the decreased sensitivity of water content, increased sensitivity to surface roughness, and increased sensitivity to the structural effects of soil and vegetation that are difficult to correct for. Applications that require accurate soil moisture data like hydrologic models, ecosystem models, and predicting and monitoring extreme hydroclimatic events would benefit from higher spatial resolution and a frequent temporal time step (i.e., 30-m resolution, daily).
This study assessed near-surface soil moisture maps from a novel UAS-mounted passive L-band sensor in a natural oak woodland landscape using three flights conducted over the course of 1 year (May 2022 August 2022, and May 2023) to evaluate seasonal changes in soil moisture. This study presents results from the first application of this L-band UAS in natural landscapes with highly variable terrain and complex vegetation types. These results can be used for future studies investigating the use of UAS L-band in natural landscapes, including future development of the sensors, UAS, and calibration parameters. Extensive field sampling was undertaken to evaluate the L-band derived soil moisture at multiple scales. The NASA Soil Moisture Active Passive (SMAP) program target accuracy was 0.04 m3/m3 ubRMSE (unbiased root mean squared error) for its radar-radiometer product against in situ data (Colliander et al., 2017), a value that was used in this study as a benchmark for soil moisture retrieval accuracy.
2 Study area
The Pepperwood Preserve in northern California within Sonoma County, CA is a 13 km2 nature preserve (Figure 1) located within the Mayacamas Mountains of California’s inner Coast Ranges, northeast of the city of Santa Rosa (de Nevers, 2013; Oldfather et al., 2016). The climate at Pepperwood Preserve typifies a coastal Mediterranean climate with cool, wet winters and hot dry summers, with coastal influences and occasional fog. The vegetation consists of interspersed grasslands, shrublands, oak woodlands, and Douglas fir stands (Pseudostuga menziesii; de Nevers, 2013). The underlying geology consists of Franciscan Complex mélange, Cretaceous–Tertiary coastal belt rocks, Tertiary volcanic flows, Quaternary alluvium and marine deposits, and ultramafic rocks consisting predominantly of serpentine (Jennings, 1977). The major soil types from the Soil Survey Geographic Database (SSURGO, Soil Survey Staff (2024)) are the Laniger loam on the northeast third, Yorkville Clay loam in the middle, and a combination of Felta very gravelly loam and rock outcrop in the southwest third of the preserve. The slope ranges from 15 to 75 percent across the preserve, and the elevation ranges from 76 to 476 m with an average of 303 m.
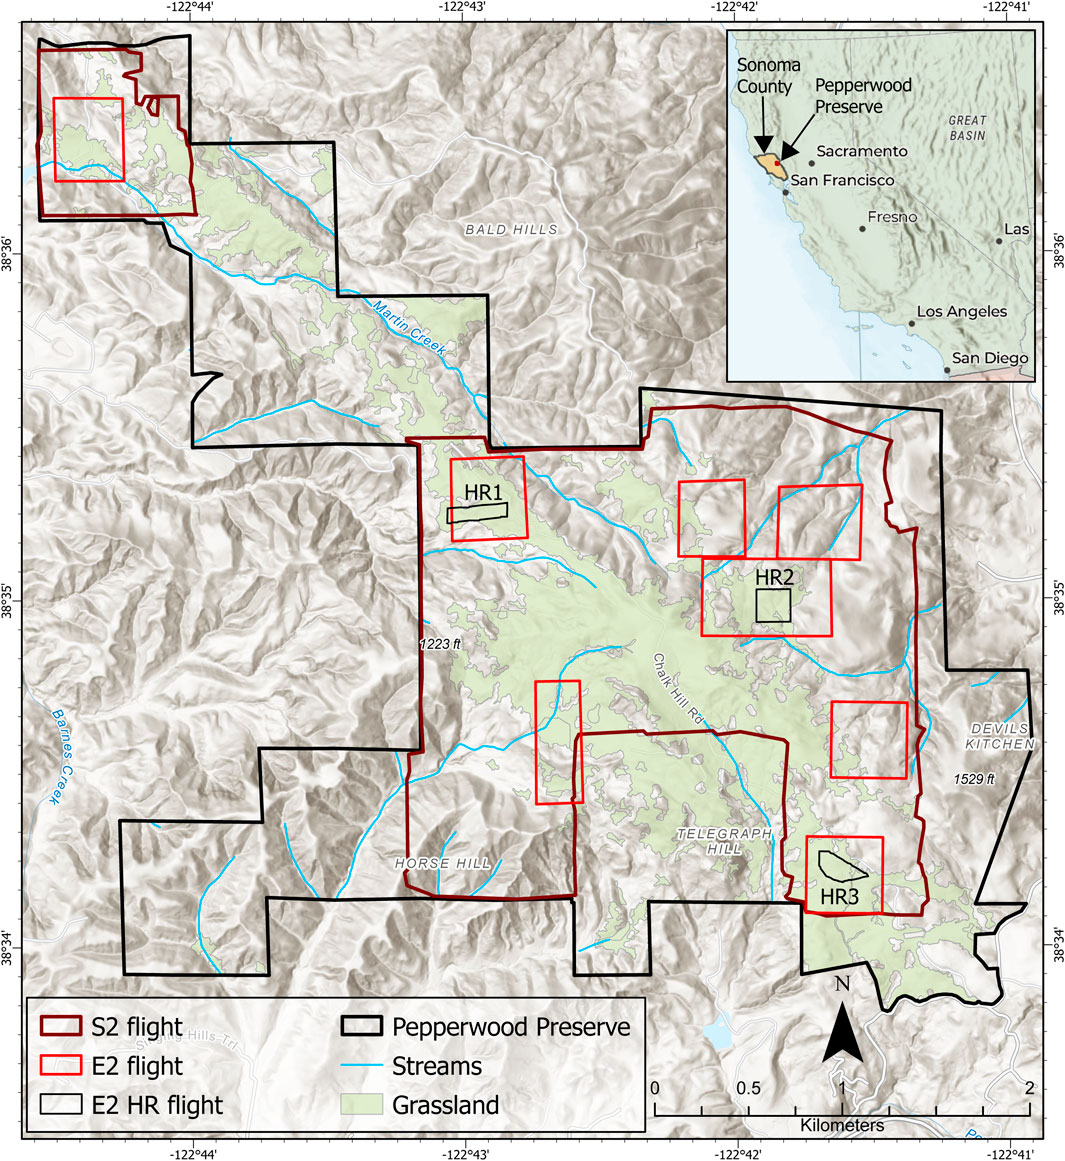
Figure 1. Pepperwood Preserve study area (black outline), uncrewed aircraft system (UAS) footprints (S2 flight = fixed-wing UAS, E2 flight = multirotor UAS, E2 HR = high resolution flight), streams, and grassland extent. The location of the Pepperwood Preserve is shown as a red outline in the northeast corner of the Sonoma County polygon in the inset map. Base map from Esri and its licensors, copyright 2024.
3 Materials and methods
Remote sensing and field measurements of soil moisture were sampled concurrently to estimate near-surface soil moisture conditions at Pepperwood Preserve in Sonoma County. Three field campaigns were conducted in 2022 and 2023 to capture seasonal variations in soil moisture. Field measurements using a mobile soil moisture sensor were used for validation. Remote sensing was conducted from a fixed-wing and multirotor UAS to test a novel passive L-band microwave sensor that collected brightness temperature data used in a radiative transfer model to estimate near-surface soil moisture.
3.1 UAS remote sensing
Three flight campaigns were flown to capture the seasonal climate and soil conditions: in May 2022 when soils were drying down, in August 2022 when soils were near wilting point, and in May 2023 when soils were near saturated/field capacity conditions after an extremely wet season. The first two flights were conducted using the S2 (Figure 2A), a fixed-wing UAS developed by Black Swift Technologies LLC and NASA Goddard Space Flight Center (Dai et al., 2020), with a wingspan of 3 m and the ability to house different instruments in the nose cone. Additional specifications and photographs of the S2 can be found online (https://bst.aero/black-swift-s2-uas/), and from Dai et al., 2020, and Kim et al., 2024. For this study, the S2 was equipped with optical, near-infrared, thermal cameras, and an L-band radiometer. Because it can fly at a lower altitude and thereby provide more detailed imagery, a multirotor UAS called the E2 (Figure 2B) was also deployed (see specifications here: https://bst.aero/black-swift-e2-uas/) using the same sensors as the S2. The L-band antenna footprint size is roughly equivalent to the UAS altitude; therefore, the S2 flights had a lower resolution but larger footprint and the E2 had a higher resolution and smaller footprint. The first two campaigns were done using the fixed-wing S2 UAS, and the last flight was undertaken using the multirotor E2 UAS. The multirotor E2 was flown at two heights to test a higher resolution soil moisture map over smaller footprints. The flight time for the S2 was roughly 1 h to cover each of the six 1,000-m flight boxes. The S2 and E2 flew over each area twice—first with the optical, near-infrared, and thermal cameras and second with the L-band radiometer. Each flight day consisted of multiple individual flights that were later stitched together, beginning around 10 a.m. and ending at around 2 p.m. to avoid shadows and temperature swings. Each campaign recorded 13,000 to 30,000 individual images. The fixed-wing S2 requires a 33-m-long and relatively flat grassy area to land, limiting the coverage of some areas of the preserve due to topography and forest cover.
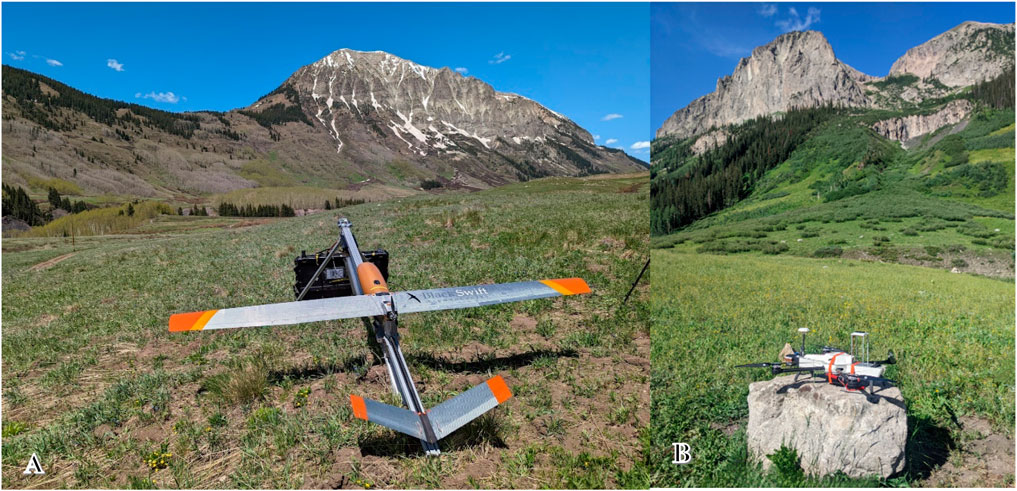
Figure 2. (A) Fixed-wing S2 uncrewed aerial system (UAS) and (B) multirotor E2 UAS. Images provided by Black Swift Technologies and taken near Crested Butte, CO.
Volumetric soil moisture (VSM) was retrieved based on a soil-vegetation radiative transfer model with vegetation correction and surface roughness correction. The VSM maps were generated using a physical linear minimum mean square error (LMMSE) method that includes surface roughness and vegetation type parameters, navigation data, physical temperatures, and the LDCR (Lobe Differencing Correlation Radiometer) radiation pattern and temperature data (Kim et al., 2024). Surface characteristics like vegetation, scattering albedo, and soil texture were from the baseline algorithm used for Soil Moisture Active Passive (SMAP) and the U.S. Department of Agriculture soil survey map. To correct for vegetation, the Normalized Difference Vegetation Index (NDVI) was estimated using the red and near-infrared bands from the multispectral Altum sensor (MicaSense Inc., Seattle, Washington). A tau-omega model was used to quantify the vegetation contribution (from the NDVI measurements) to brightness temperature. The NDVI is commonly used to quantify the health and density of green vegetation, and was calculated using the red optical band (red) and the near-infrared band (NIR) and Equation 1:
NDVI values range from 0 to 1, indicating low to high greenness. The surface physical temperature from the Altum sensor was used to compare with radiometer measurements to determine the soil emissivity and dielectric properties. Surface roughness and scattering albedo parameters were from empirically derived values for different vegetation types from the SMAP Algorithm Theoretical Basis Document (O’Neill et al., 2018). Additional details about the LMMSE equations, radiative transfer model, and associated assumptions are available from Kim et al. (2024) and Dai et al. (2020). The algorithms used to calculate VSM from the L-band radiometer data were initially developed and tested in agricultural fields. For simplicity, the methods described in this section are referred to here in as the radiative transfer model.
3.2 Field-collected soil moisture validation data
During the same week as the UAS flights, field measurements consisting of core samples and mobile TDR (Time Domain Reflectometry) measurements were collected. For the first two flights, 50-millimeter (mm) soil core samples were collected in triplicate and compared to mobile TDR measurements (referred to as TDR measurements herein). Volumetric soil moisture (VSM) was calculated using the gravimetric method for each core sample using Equation 2:
where
The Campbell Scientific CD659 HydroSense TDR instrument has two 12-cm stainless steel rods that are manually inserted vertically into the soil surface. For the first campaign in May 2022, 344 TDR measurements were collected during the week. The second flight in August 2022 consisted of 165 TDR measurements. The third flight in May 2023 resulted in a total of 419 TDR measurements. The TDR probes represent average soil moisture conditions of roughly 12 cm of soil, whereas the soil cores represent the top 10 cm of soil. The L-band data represent the top 2–10 cm of soil, depending on moisture content in the soil and vegetation density. Therefore, the TDR and core measurements should be more representative of the remote sensing depths during the summer when water content in the soil is lowest and the L-band penetration depth is the deepest.
Statistics were calculated to quantify the error between predicted maps of soil moisture and measured soil moisture at validation point locations. To provide a robust estimate of error the coefficient of determination (R2), mean percent error, mean error (bias), root mean squared error (RMSE), and unbiased RMSE were calculated against field TDR measurements.
4 Results
By May 2022, Pepperwood Preserve had experienced several years of below average precipitation, and prolonged drought conditions meant that the soils started out drier than usual and dried out faster as spring turned into summer. August 2022 followed one of the driest periods on record at Pepperwood Preserve with only 711 mm (28 inches) of precipitation in the preceding water year, compared to the average annual precipitation of 934 mm (37 inches). California often experiences weather whiplash conditions from dry to deluge, and after several dry years, the winter of water year 2023 was one of the wettest on record. Seven atmospheric rivers provided 1,092 mm (43 inches) of precipitation over the winter season (PRISM Climate Group, Oregon State University, https://prism.oregonstate.edu). As a result, even though remote sensing and field data were only collected three times over one calendar year, anomalously wet and dry conditions were represented during this study (Figure 3A). Remote sensing data generated from this study are available at Stern et al. (2024).
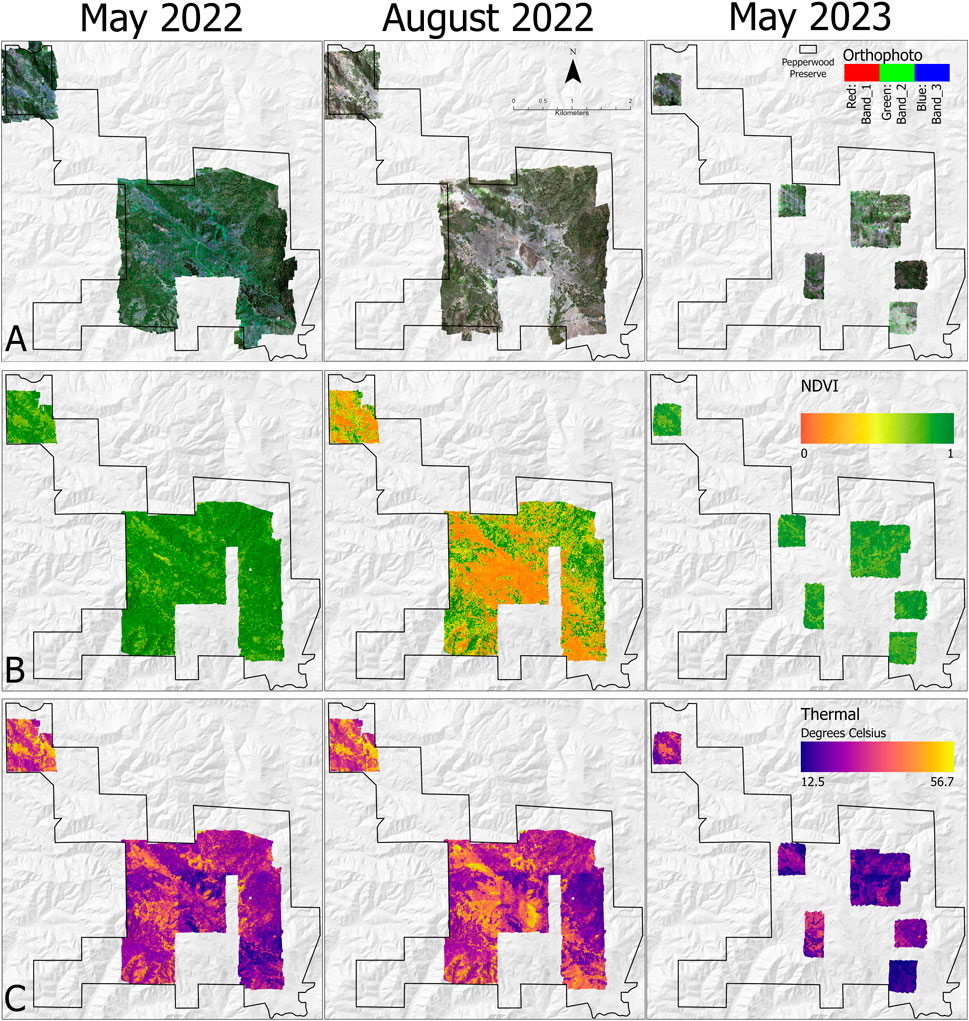
Figure 3. (A) orthoimagery, (B) Normalized Difference Vegetation Index (NDVI), and (C) thermal imagery from uncrewed aircraft system (UAS) campaigns in May 2022 August 2022, and May 2023.
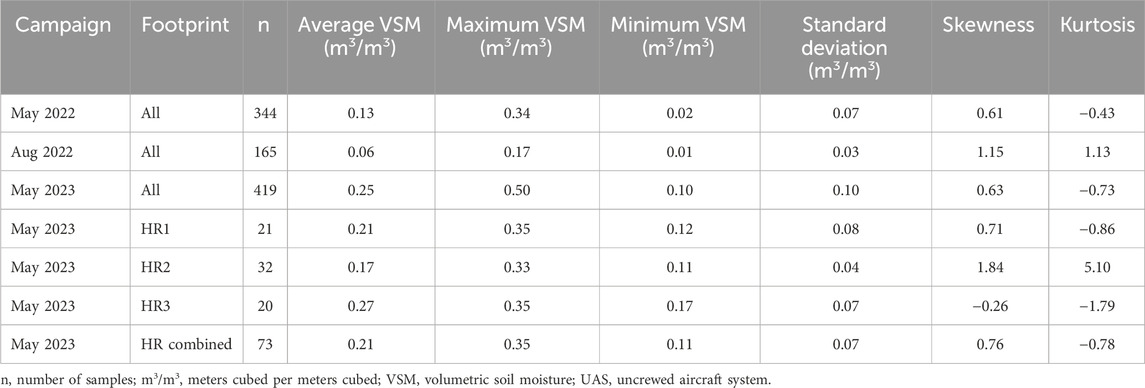
The average soil moisture conditions across all measurements were 0.13 m3/m3 in May 2022 (Table 1). The average soil moisture in August 2022 was only 0.06 m3/m3. May 2023 was much wetter overall, with average soil moisture around 0.25 m3/m3. To validate the mobile TDR measurements, core samples were used to evaluate the accuracy of the mobile TDR measurements. The TDR measurements accurately reflected soil moisture conditions as calculated through core samples, underestimating VSM on average by 0.03 m3/m3 with an ubRMSE of 0.02 m3/m3 (Supplementary Table S1).
In August 2022, the grasslands trending in a northwest-southeast direction showed up as bright orange, indicating a low NDVI, in contrast with the green (high NDVI) oak woodlands and closed canopy Douglas fir stands (Figure 3B). The north-facing slopes and highly forested areas show up as green to dark green, and May 2022 had a higher NDVI than August 2022. The thermal data in Figure 3C show that the preserve was warmest in August 2022 and coolest in May 2023, with some warmer areas in May 2022 and cooler areas on north-facing slopes and forested areas.
The passive L-band radiometer sensor picks up naturally emitted radiation in the 1.4 gigahertz (GHz) wavelength and results in a map of brightness temperature. The brightness temperature is highly dependent on soil and vegetation water content, and to a lesser extent temperature and surface roughness (Wigneron et al., 2017). Higher L-band brightness temperatures generally correlate to drier conditions, but spatial and temporal variations in brightness temperature can occur depending on diurnal and seasonal temperature fluctuations. Some temperature artifacts can be seen in the thermal data (May 2022 and August 2022, center flight box; Figure 3C) at the edge of individual footprints. This is due to the timing of multiple flights where one flight footprint in the morning is next to a footprint that was flown later in the day when temperatures were higher. The L-band results showed similar spatial patterns to the thermal data including the temperature artifacts and the highest emissions were in August 2022. To provide a rough estimate of emissivity, L-band brightness temperature was divided by thermal temperature data (Figure 4B). The emissivity estimates show a decreased temperature artifact and could be used as a correction in the final soil moisture calculations. Calculated soil moisture from the radiative transfer model (Figure 4C) shows that August 2022 had the driest conditions, with wetter conditions in May 2022 and the wettest conditions in May 2023. Table 2 shows soil moisture estimated from the radiative transfer model performed poorly for the first two flights and improved slightly for the third flight, with R2 values of 0.02, 0.02, and 0.24 for May 2022 August 2022, and May 2023, respectively. Mean percent error ranged from 8% to 76%, with an average ubRMSE value of 0.07 m3/m3.
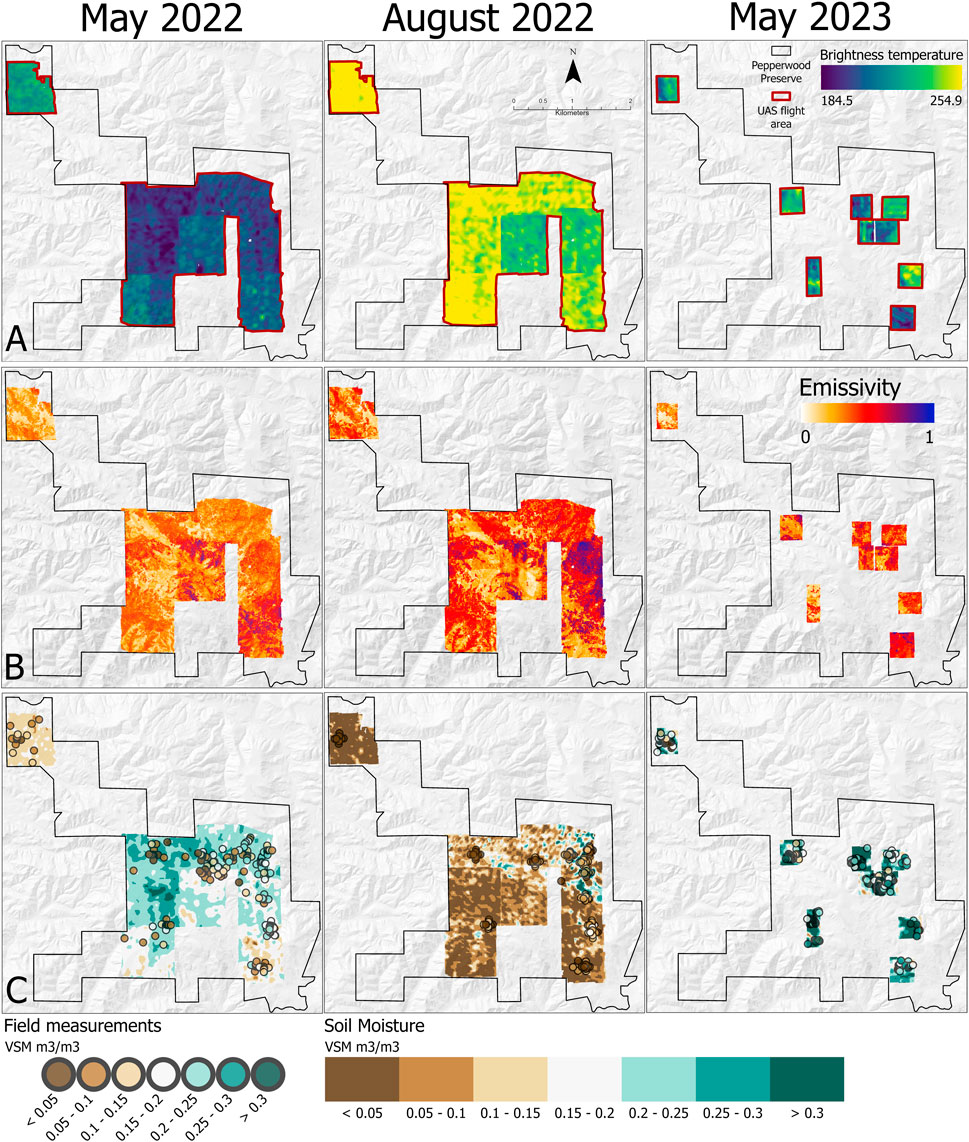
Figure 4. (A) L-band brightness temperature, (B) estimated emissivity calculated as brightness temperature divided by thermal data, and (C) soil moisture calculated using the radiative transfer model from campaigns in May 2022 August 2022, and May 2023. VSM = volumetric soil moisture, in cubic meters per cubic meter, UAS = uncrewed aircraft systems.
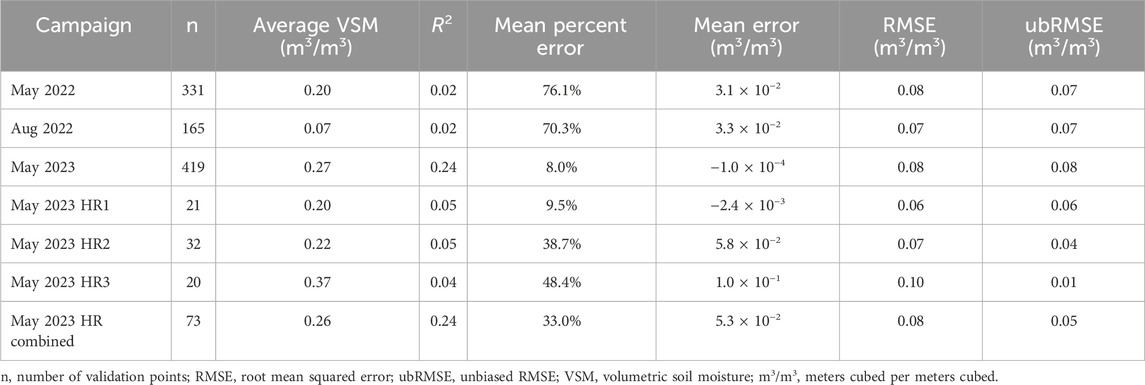
Table 2. Summary statistics comparing measured soil moisture data to predicted soil moisture maps at different scales using different methods, and the average VSM for each map.
During the May 2022 campaign, three additional campaigns were flown over the same larger footprints using the multirotor E2 UAS, at a lower height above ground than the original flights (Figures 1, 5A). This enabled the UAS to fly lower and produce more detailed brightness temperature and soil moisture maps. These flights were only performed over grasslands, and produced maps of 3–4 m resolution.
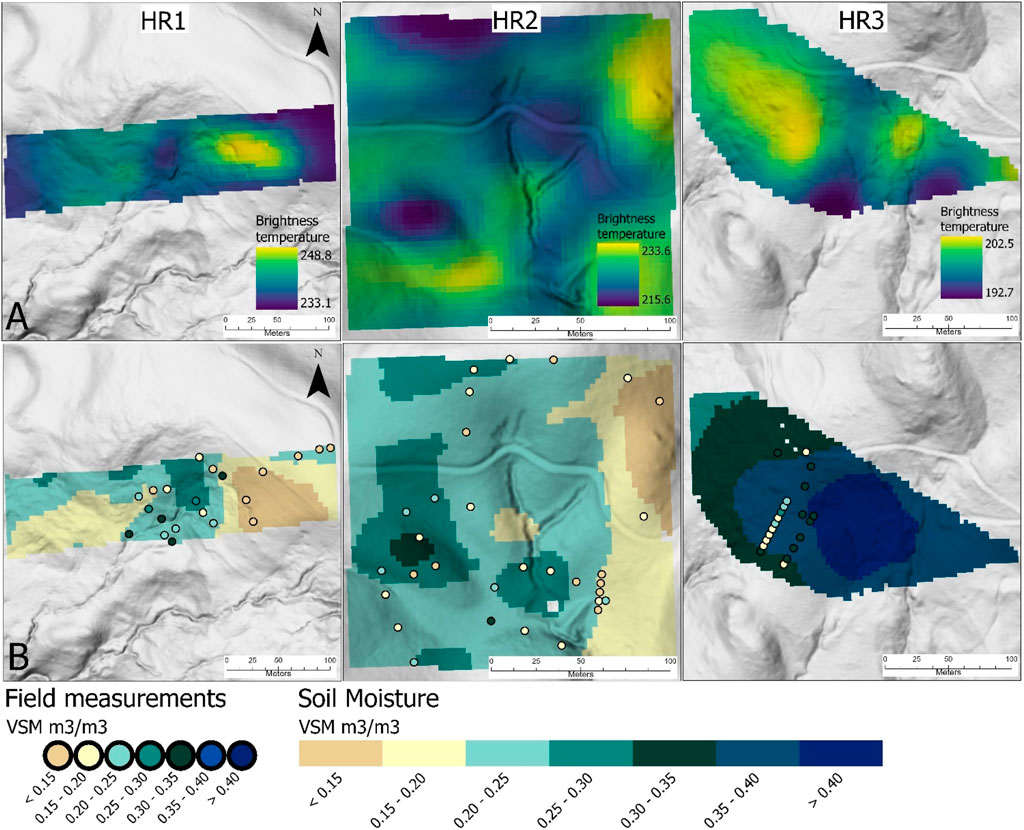
Figure 5. (A) L-band brightness temperature, and (B) soil moisture calculated using the radiative transfer model from the higher resolution flights in May 2023. VSM = volumetric soil moisture, in cubic meters per cubic meter.
The soil moisture maps for each date were compared against field-collected data and separated by grassland and forest vegetation types (Figure 6). Statistics for the overall data set not separated by vegetation type are shown in Table 2. The estimated soil moisture from the radiative transfer model had lower correlations to validation data in May 2022 and August 2022, with more accurate results in May 2023. The grassland locations performed better than the forested locations, with a tendency to overpredict soil moisture for forested lands, especially for higher soil moisture values. Soil moisture content from each map generally agreed with the averages for the corresponding validation dataset, with some exceptions (Tables 1, 2). The soil moisture map made using the radiative transfer method was wetter than the TDR measurement average, with a VSM of 0.20 m3/m3. A similar result was found for August 2022, except the radiative transfer model result using TDR measurements agreed and averaged 0.07 m3/m3, similar to the TDR measurements for August 2022 that averaged 0.06 m3/m3.
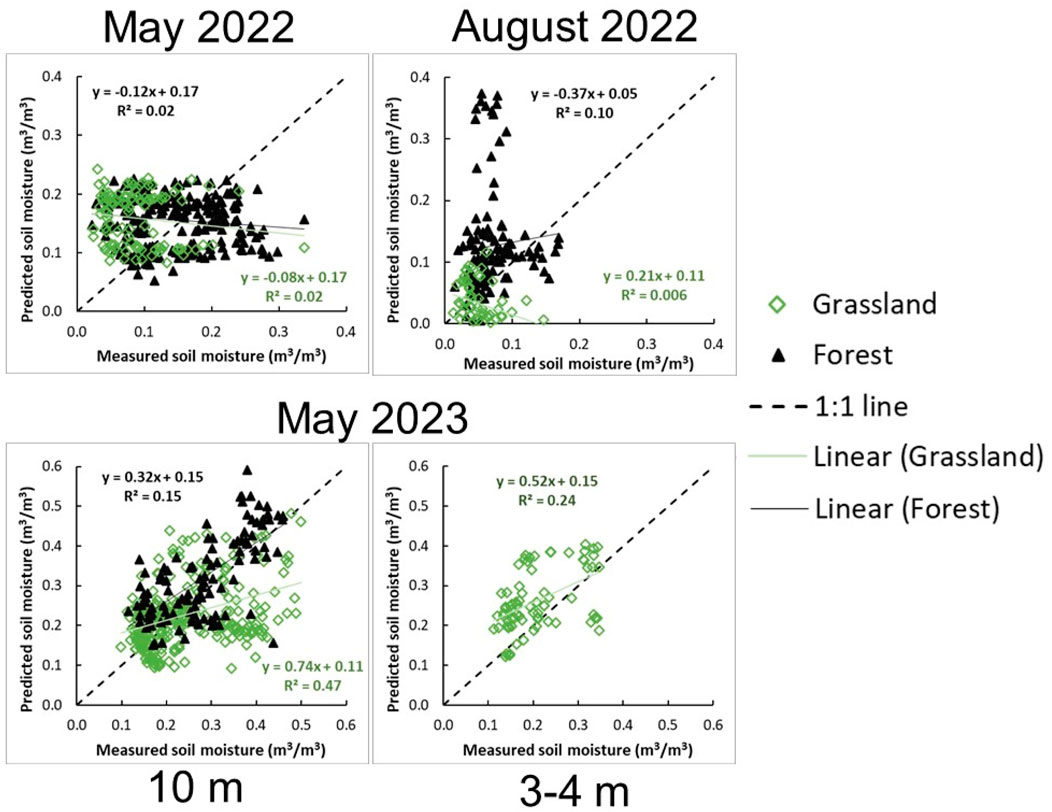
Figure 6. Measured and modeled soil moisture comparison from uncrewed aircraft system (UAS) campaigns in May 2022 August 2022, and May 2023 for lower (10 m) and higher (3–4 m) resolution flights. Green squares indicate soil moisture points in grasslands; black triangles indicate soil moisture points in forested areas. Note the different scale for the May 2023 results, and the higher resolution May 2023 flights were only over grassland.
The higher resolution May 2023 soil moisture maps from the E2 (Figure 5B) were validated using 73 of the original 419 TDR measurements that fell within the higher resolution footprints. The validation statistics when combined across high resolution areas HR1, HR2, and HR3 resulted in the same R2 of 0.24 for the lower resolution and higher resolution flights. The lower resolution May 2023 VSM tended to underpredict VSM in the 0.15–0.25 m3/m3 range compared to TDR measurements over grassland yet resulted in an R2 of 0.47 (Figure 6). The higher resolution May 2023 flights resulted in a good statistical relationship when visually comparing against the 1:1 line (Figure 6) but had a lower R2 of 0.24 m3/m3. This is due to the overprediction of VSM at the 0.3–0.4 m3/m3 range. The ubRMSE was slightly improved for the higher resolution flights—0.05 m3/m3 compared to 0.08 m3/m3 for the lower resolution flights (Table 2). The average VSM across the lower resolution May 2023 flights was 0.27 m3/m3 (Table 2), or 0.02 m3/m3 higher than the TDR measurements indicated (Table 1), yet the high-resolution maps indicated a wetter average VSM of 0.26 m3/m3, 0.05 m3/m3 higher than the TDR measurement average.
The May 2022 and August 2022 campaigns were some of the first operational missions for this sensing system in this unique environment, which includes potentially hot temperatures, steep terrain, and a mix of open and forested areas. Each of these campaigns included significant iteration and hardware changes to the soil moisture system to improve issues seen with the previous campaign. These improvements included algorithms to correct for steep slope angles, a new noise source in the radiometer that is less susceptible to environmental temperature changes, and flying trajectories on a multirotor UAS that accurately holds a height above the ground for the full mission, while providing a longer integration time for the radiometric data. This can be seen by looking at the improvement of the brightness temperature results from the first campaign to the last (Figures 4A, C).
5 Discussion
The ability to deploy UAS quickly to map soil moisture in natural landscapes would be highly beneficial for drought and wildfire risk, assessing watershed conditions before storms, and landslide early detection. Several studies have used UAS to map soil moisture, using wide band active synthetic aperture radar (SAR) (Kaundinya et al., 2018; Simpson et al., 2021), P-band reflectometer (Yueh et al., 2018), hyperspectral sensors (Eon and Bachmann, 2021), GPS signals (Senyurek et al., 2022), and optical and thermal sensors (Babaeian et al., 2019; Paridad et al., 2019; de Lima et al., 2022). Ye et al. (2023) mapped soil moisture using an L-band radiometer over an irrigated farm in Australia with an RMSE of 0.05–0.06 m3/m3 and found it was more accurate than using thermal and optical data alone, which resulted in an RMSE of 0.05–0.09 m3/m3. Most of these studies mapped soil moisture over agricultural land, and none of these used L-band radiometer sensors to attempt to map areas with complex topography and natural vegetation types.
This study assessed a novel passive L-band UAS-mounted sensor to map near-surface soil moisture in a natural landscape using three flights conducted over 1 year to capture seasonal changes in soil moisture. Extensive field sampling was undertaken to evaluate the accuracy of the resulting radiative transfer model. Although this L-band UAS sensor combination has been tested in agricultural settings with success (Dai et al., 2018; Kim et al., 2024), there are research opportunities to produce accurate fine-scale soil moisture maps in natural landscapes with complex topography and multiple vegetation types using UAS remote sensing and the radiative transfer model. Future work can build on the results presented by improving vegetation and soil calibrations, increasing the automation of soil moisture mapping from L-band brightness temperature and the thermal and optical data.
There is a high degree of uncertainty in soil moisture measurements and models due to many factors. TDR soil moisture measurements themselves are an indirect measurement of soil moisture, and in this study, VSM from TDR field measurements underestimated VSM calculated from cores by −0.03 m3/m3 (Supplementary Table S1). The soil sensors have a measurement accuracy of 0.03 m3/m3 for soils with solution electrical conductivity less than or equal to 6.5 decisiemens per meter (dS/m) (Campbell Scientific, 2020). This confirms that the TDR measurements are within an acceptable range of uncertainty according to the TDR sensor specifications. Soil moisture and other soil properties are highly spatiotemporally variable and can be difficult to characterize for a specific application. Each application may have a level of accuracy that is acceptable and that may change for different time intervals, geography, or by season.
Remote sensing data contains uncertainty due to many factors, including missing data related to clouds and other interferences, sensor failures, or bias in retrieval algorithms. Some applications of high-resolution soil moisture data may require a daily or finer time step for risk management, yet satellite data are available at weekly or longer intervals. There are many methods that can be used to fill in data between satellite overpasses, but sub-daily time intervals are not common except in UAS imagery. Generally, L-band data can penetrate up to 10 cm into soil or vegetation, but sensing depth depends on water content and therefore is constantly changing. Thus, in dry conditions, the sensing depth of the L-band brightness temperature may represent an average of the top 0–10 cm, whereas the wet season measurements may only represent the top 0–5 cm of soil. Since the TDR sensors provide an estimate of VSM averaged over the top 12 cm, the evaluation using TDR measurements to validate remote sensing estimates of VSM is an imperfect comparison. Generally, VSM increases with depth; therefore, TDR measurements may have a wetter bias than the remote sensing based VSM. This may be especially true during wet conditions when remote sensing effective depths are lowest. L-band data are also highly sensitive to surface roughness, which can change over time and sometimes substantially after a wildfire or other disturbances. In addition, there are errors associated with radio frequency interferences (RFI) that are known to affect L-band radiometer retrievals (Wigneron et al., 2021). These interferences vary in space and time and are difficult to remove, however, development of a digital correlator may help to reduce the impacts of RFI on retrievals using this system in future applications. Future work could include the calibration of scattering albedo and soil roughness parameters used in the retrieval algorithm.
6 Conclusion
This study supports two main conclusions related to the remote sensing of soil moisture: (1) high-resolution UAS data can be valuable for understanding fine-scale soil moisture variability and (2) there are research opportunities for UAS-mounted L-band radiometers in natural landscapes with complex terrain. The validation statistics for the radiative transfer model (average R2 = 0.13 and ubRMSE = 0.07 m3/m3) showed that more research could improve the accuracy of near surface soil moisture maps in natural vegetation and variable terrain. However, soil moisture estimations in forested land were not noticeably better or worse than grassland soil moisture estimates (Figure 6), except for the May 2023 flight. In addition, soil moisture retrieval accuracy increased significantly from the May 2022 and August 2022 flights to the May 2023 flight as improvements were made to the sensors, configuration, and algorithms. Importantly, to represent the extreme dry and wet soil moisture conditions, it is recommended to sample seasonally and across the landscape, including south and north facing slopes, springs or seeps, and other natural variations. Future research could improve the radiative transfer model by including vegetation types, higher resolution soil properties, and terrain following to prevent high uncertainties from changes in elevation.
Data availability statement
The datasets presented in this study can be found in online repositories. The data can be found at this link: doi.org/10.5066/P9L6GTA9.
Author contributions
MiS: Conceptualization, Data curation, Formal Analysis, Funding acquisition, Investigation, Methodology, Project administration, Resources, Supervision, Validation, Visualization, Writing–original draft, Writing–review and editing. RF: Data curation, Investigation, Methodology, Writing–review and editing. LF: Methodology, Visualization, Writing–review and editing. MK: Data curation, Writing–review and editing. DA: Data curation, Writing–review and editing. JE: Writing - review and editing, Data curation, Methodology, Validation, Visualization. MaS: Writing - review and editing, Data curation, Methodology, Validation, Visualization. ED: Writing - review and editing, Methodology, Validation. JT: Methodology, Resources, Writing–review and editing.
Funding
The author(s) declare that financial support was received for the research, authorship, and/or publication of this article. This work was funded by the USGS National Innovation Center, USGS Next-Generation Water Observing System Research and Development, and USGS/DWR Agreement # 20ZGJFA46013573.
Acknowledgments
The authors thank Jonathon Stock, Bruce Quirk, Russ Lotspeich, and Lisa Micheli for their support of this work. The authors thank the reviewers for their thoughtful comments and suggestions that greatly improved this manuscript. The authors are very grateful to the field teams who assisted in collecting soil moisture data, including Makayla Freed, Michelle Halbur, and Michael Gillogly who collected data at the grassland transects, and Jashvina Devadoss, Raphaela Elise Floreani Buzbee, Xiaoshan Wang, and Makayla Freed who collected soil moisture at the vegetation plots. Additional soil moisture data were collected by Gwen Davies, Todd Caldwell, and Noah Hoffman. Without the enormous field effort, this work would not have been possible.
Conflict of interest
Author LF was employed by Earth Knowledge Inc. Author ED was employed by Weather Stream Inc. Authors JE and MS were employed by Black Swift Technologies.
The remaining authors declare that the research was conducted in the absence of any commercial or financial relationships that could be construed as a potential conflict of interest.
Any use of trade, firm, or product names is for descriptive purposes only and does not imply endorsement by the U.S. Government.
Publisher’s note
All claims expressed in this article are solely those of the authors and do not necessarily represent those of their affiliated organizations, or those of the publisher, the editors and the reviewers. Any product that may be evaluated in this article, or claim that may be made by its manufacturer, is not guaranteed or endorsed by the publisher.
Supplementary material
The Supplementary Material for this article can be found online at: https://www.frontiersin.org/articles/10.3389/frsen.2024.1337953/full#supplementary-material
References
Ali, I., Greifeneder, F., Stamenkovic, J., Neumann, M., and Notarnicola, C. (2015). Review of machine learning approaches for biomass and soil moisture retrievals from remote sensing data. Remote Sens. 7 (12), 16398–16421. doi:10.3390/rs71215841
Babaeian, E., Sadeghi, M., Jones, S. B., Montzka, C., Vereecken, H., and Tuller, M. (2019). Ground, proximal, and satellite remote sensing of soil moisture. Reviews of Geophysics 57 (2), 530–616.
Campbell Scientific (2020). HS2 and HS2P (HydroSense II) product manual. Revision 02/2020. Logan, UT: Campbell Scientific, Inc.
Chaparro, D., Vall-Llossera, M., Piles, M., Camps, A., Rüdiger, C., and Riera-Tatché, R. (2016). Predicting the extent of wildfires using remotely sensed soil moisture and temperature trends. IEEE J. Sel. Top. Appl. earth observations remote Sens. 9 (6), 2818–2829. doi:10.1109/jstars.2016.2571838
Colliander, A., Jackson, T. J., Bindlish, R., Chan, S., Das, N., Kim, S. B., et al. (2017). Validation of SMAP surface soil moisture products with core validation sites. Remote Sens. Environ. 191, 215–231. doi:10.1016/j.rse.2017.01.021
Crow, W. T., Berg, A. A., Cosh, M. H., Loew, A., Mohanty, B. P., Panciera, R., et al. (2012). Upscaling sparse ground-based soil moisture observations for the validation of coarse-resolution satellite soil moisture products. Rev. Geophys. 50 (2). doi:10.1029/2011rg000372
Dai, E., Gasiewski, A. J., Venkitasubramony, A., Stachura, M., and Elston, J. (2020). High spatial resolution soil moisture mapping using a lobe differencing correlation radiometer on a small unmanned aerial system. IEEE Transactions on Geoscience and Remote Sensing 59 (5), 4062–4079.
Dai, E., Venkitasubramony, A., Gasiewski, A., Stachura, M., and Elston, J. (2018). “High spatial soil moisture mapping using small unmanned aerial system,” in IGARSS 2018-2018 IEEE international geoscience and remote sensing symposium (IEEE), 6496–6499.
de Lima, R. S., Li, K. Y., Vain, A., Lang, M., Bergamo, T. F., Kokamägi, K., et al. (2022). The potential of optical UAS data for predicting surface soil moisture in a peatland across time and sites. Remote Sens. 14 (10), 2334. doi:10.3390/rs14102334
Eon, R. S., and Bachmann, C. M. (2021). Mapping barrier island soil moisture using a radiative transfer model of hyperspectral imagery from an unmanned aerial system. Sci. Rep. 11 (1), 3270. doi:10.1038/s41598-021-82783-3
Harpold, A. A., Sutcliffe, K., Clayton, J., Goodbody, A., and Vazquez, S. (2017). Does including soil moisture observations improve operational streamflow forecasts in snow-dominated watersheds? JAWRA J. Am. Water Resour. Assoc. 53 (1), 179–196. doi:10.1111/1752-1688.12490
Hettiarachchi, S., Wasko, C., and Sharma, A. (2019). Can antecedent moisture conditions modulate the increase in flood risk due to climate change in urban catchments? J. Hydrology 571, 11–20. doi:10.1016/j.jhydrol.2019.01.039
Hossain, A. A., and Easson, G. (2016). Soil moisture estimation in South-Eastern New Mexico using high resolution synthetic aperture radar (SAR) data. Geosciences 6 (1), 1. doi:10.3390/geosciences6010001
Jennings, C. W. (1977). Geologic map of California: California division of mines and geology geologic data, Map number 2, scale 1:750,000.
Karthikeyan, L., and Mishra, A. K. (2021). Multi-layer high-resolution soil moisture estimation using machine learning over the United States. Remote Sens. Environ. 266, 112706. doi:10.1016/j.rse.2021.112706
Kaundinya, S., Arnold, E., Rodriguez-Morales, F., and Patil, A. (2018). “A UAS-based ultra-wideband radar system for soil moisture measurements,” in 2018 IEEE radar conference (RadarConf18) (IEEE), 0721–0726.
Kim, K. Y., Zhu, Z., Zhang, R., Fang, B., Cosh, M. H., Russ, A. L., et al. (2024). Precision soil moisture monitoring with passive microwave L-band UAS mapping. IEEE J. Sel. Top. Appl. Earth Observations Remote Sens. 17, 7684–7694. doi:10.1109/jstars.2024.3382045
Loew, A. (2008). Impact of surface heterogeneity on surface soil moisture retrievals from passive microwave data at the regional scale: the Upper Danube case. Remote Sens. Environ. 112 (1), 231–248. doi:10.1016/j.rse.2007.04.009
Mohanty, B. P., Cosh, M. H., Lakshmi, V., and Montzka, C. (2017). Soil moisture remote sensing: state-of-the-science. Vadose Zone J. 16 (1), 1–9. doi:10.2136/vzj2016.10.0105
Oldfather, M. F., Britton, M. N., Papper, P. D., Koontz, M. J., Halbur, M. M., Dodge, C., et al. (2016). Effects of topoclimatic complexity on the composition of woody plant communities. AoB Plants 8, plw049. doi:10.1093/aobpla/plw049
O’Neill, P., Bindlish, R., Chan, S., Njoku, E., and Jackson, T. (2018). Algorithm theoretical basis document. Level 2 and 3 soil moisture (passive) data products.
Paridad, P., Dal Sasso, S. F., Pizarro, A., Mita, L., Fiorentino, M., Margiotta, M. R., et al. (2019). Estimation of soil moisture from UAS platforms using RGB and thermal imaging sensors in arid and semi-arid regions. IX Int. Symposium Irrigation Hortic. Crops 1335, 339–348. doi:10.17660/actahortic.2022.1335.42
Robinson, D. A., Jones, S. B., Wraith, J. M., Or, D., and Friedman, S. P. (2003). A review of advances in dielectric and electrical conductivity measurement in soils using time domain reflectometry. Vadose zone J. 2 (4), 444–475. doi:10.2136/vzj2003.4440
Seneviratne, S. I., Corti, T., Davin, E. L., Hirschi, M., Jaeger, E. B., Lehner, I., et al. (2010). Investigating soil moisture–climate interactions in a changing climate: a review. Earth-Science Rev. 99 (3-4), 125–161. doi:10.1016/j.earscirev.2010.02.004
Senyurek, V., Farhad, M. M., Gurbuz, A. C., Kurum, M., and Adeli, A. (2022). Fusion of reflected GPS signals with multispectral imagery to estimate soil moisture at subfield scale from small UAS platforms. IEEE J. Sel. Top. Appl. Earth Observations Remote Sens. 15, 6843–6855. doi:10.1109/jstars.2022.3197794
Simpson, C. D., Kolpuke, S., Awasthi, A. K., Luong, T., Memari, S., Yan, S., et al. (2021). “Development of a UAS-based ultra-wideband radar for fine-resolution soil moisture measurements,” in 2021 IEEE radar conference (RadarConf21) (IEEE), 1–4.
Soil Survey Staff (2024). Natural resources conservation service, United States department of agriculture. Soil survey geographic (SSURGO) database. Available at: https://sdmdataaccess.sc.egov.usda.gov (Accessed July 02, 2019).
Stern, M. A., Elston , J., and Stachura , M. (2024). Aerial imagery and other remotely-sensed data from a UAS survey of Pepperwood Preserve, Sonoma County, CA. U.S. Geological Survey data release. doi:10.5066/P9L6GTA9
Vinnikov, K. Y., Robock, A., Speranskaya, N. A., and Schlosser, C. A. (1996). Scales of temporal and spatial variability of midlatitude soil moisture. J. Geophys. Res. Atmos. 101 (D3), 7163–7174. doi:10.1029/95jd02753
Wigneron, J. P., Jackson, T. J., O'neill, P., De Lannoy, G., de Rosnay, P., Walker, J. P., et al. (2017). Modelling the passive microwave signature from land surfaces: a review of recent results and application to the L-band SMOS and SMAP soil moisture retrieval algorithms. Remote Sens. Environ. 192, 238–262. doi:10.1016/j.rse.2017.01.024
Wigneron, J. P., Li, X., Frappart, F., Fan, L., Al-Yaari, A., De Lannoy, G., et al. (2021). SMOS-IC data record of soil moisture and L-VOD: historical development, applications and perspectives. Remote Sens. Environ. 254, 112238. doi:10.1016/j.rse.2020.112238
Wood, A. W., Hopson, T., Newman, A., Brekke, L., Arnold, J., and Clark, M. (2016). Quantifying streamflow forecast skill elasticity to initial condition and climate prediction skill. J. Hydrometeorol. 17 (2), 651–668. doi:10.1175/jhm-d-14-0213.1
Ye, N., Walker, J. P., Gao, Y., PopStefanija, I., and Hills, J. (2023). Comparison between thermal-optical and L-band passive microwave soil moisture remote sensing at farm scales: towards UAV-based near-surface soil moisture mapping. IEEE J. Sel. Top. Appl. Earth Observations Remote Sens. 17, 633–642. doi:10.1109/jstars.2023.3329015
Yueh, S., Shah, R., Xu, X., Elder, K., Margulis, S., Liston, G., et al. (2018). UAS-based P-band signals of opportunity for remote sensing of snow and root zone soil moisture. Sensors, Syst. Next-Generation Satell. XXII, SPIE 10785, 39–46. doi:10.1117/12.2325819
Keywords: UAS, soil moisture, L-band, remote sensing, NDVI
Citation: Stern M, Ferrell R, Flint L, Kozanitas M, Ackerly D, Elston J, Stachura M, Dai E and Thorne J (2024) Fine-scale surficial soil moisture mapping using UAS-based L-band remote sensing in a mixed oak-grassland landscape. Front. Remote Sens. 5:1337953. doi: 10.3389/frsen.2024.1337953
Received: 13 November 2023; Accepted: 21 October 2024;
Published: 20 November 2024.
Edited by:
John Fulton, United States Geological Survey (USGS), United StatesReviewed by:
Michael Cosh, University of San Diego, United StatesJean-Pierre Wigneron, Institut National de recherche pour l’agriculture, l’alimentation et l’environnement (INRAE), France
Copyright © 2024 Stern, Ferrell, Flint, Kozanitas, Ackerly, Elston, Stachura, Dai and Thorne. This is an open-access article distributed under the terms of the Creative Commons Attribution License (CC BY). The use, distribution or reproduction in other forums is permitted, provided the original author(s) and the copyright owner(s) are credited and that the original publication in this journal is cited, in accordance with accepted academic practice. No use, distribution or reproduction is permitted which does not comply with these terms.
*Correspondence: Michelle Stern, bXN0ZXJuQHVzZ3MuZ292
 Michelle Stern
 Ryan Ferrell
 Lorraine Flint3
 David Ackerly
 James Thorne