 Harry Morris
 Morven Sinclair
 Pieter De Vis
 Agnieszka Bialek
94% of researchers rate our articles as excellent or good
Learn more about the work of our research integrity team to safeguard the quality of each article we publish.
Find out more
ORIGINAL RESEARCH article
Front. Remote Sens. , 29 April 2024
Sec. Multi- and Hyper-Spectral Imaging
Volume 5 - 2024 | https://doi.org/10.3389/frsen.2024.1322760
This article is part of the Research Topic Optical Radiometry and Satellite Validation View all 22 articles
This paper demonstrates the use of a novel, autonomous hyperspectral surface reflectance data collected at Wytham Woods, United Kingdom (WWUK) as part of the LANDHYPERNET network for the validation of multispectral data from Sentinel-2, Landsat 8 and Landsat 9. The deployment of the HYPSTAR instrument at the site and the corresponding quality control of the data products is described. In addition, a methodology based upon metrological principles is outlined showing the propagation of uncertainties from the LANDHYPERNET and satellite data products to enable conformity testing of the satellite products using the satellite mission requirements. A total of 9 matchups are found for satellite validation at the site, where there is a cloud-free satellite scene and a corresponding LANDHYPERNET sequence, which has passed all quality checks, within two hours of the overpass. An analysis of the impact of the spatial variability of the site is presented and can account for up to 40% of the uncertainty associated with the in-situ surface reflectance data. There is no systematic bias in the Bottom-Of-Atmosphere reflectance data obtained from the LANDHYPERNET data in comparison to the satellite data. In the best case, differences of less than 2% are found for certain spectral bands. However, in the worst cases, relatively large differences are found which exceed 100%, this is affected by the relatively low reflectance values found in the visible bands. These differences could be caused by the spatial and temporal mismatch between the in-situ and satellite measurement, or due to shadowing caused by the flux tower. Further data quality control and assurance is needed to best choose data sets suitable for satellite validation. Incorporating a Bidirectional Reflectance Distribution Function model into the processing chain for the forest canopy is recommended. Overall, although there are areas to further characterise, the site provides a useful benchmark for which to develop techniques for validation of satellite surface reflectance products over a challenging environment.
Data from Earth Observation (EO) satellites are increasingly being used for commercial and scientific purposes. Long-term time series of this data are being utilised to develop records of environmental change (Fensholt et al., 2009; Yang et al., 2013). Users are combining data sets from multiple satellites to either increase the data coverage or extend the time series beyond the operational range of a single satellite (Li and Roy, 2017; Claverie et al., 2018). Although pre-launch calibration of the instruments is performed for many satellite missions, ongoing validation on their products performance is needed against independent sources to provide users with the confidence in the quality of the data products to ensure performance and remove satellite degradation effects, which change characteristics after launch and are not captured by the pre-flight calibration efforts (Justice et al., 2000). The main satellite-derived products which are used as inputs for terrestrial monitoring are the Bottom-Of-Atmosphere (BOA) products, also referred to as Surface Reflectance (SR) products. BOA products are generated by applying Atmospheric Correction (AC) algorithms from the Top-Of-Atmosphere (TOA) products, removing the influence of the atmosphere to the TOA signal (Liang et al., 2012). AC algorithms introduce more uncertainties into the SR products, which in the visible and near infra-red (VNIR) and short wave infra-red (SWIR) can be mainly attributed to the uncertainties associated with the aerosol and water vapour optical properties (Li et al., 2018). Currently European Space Agency (ESA) SR products do not have per-pixel uncertainty estimates, which can be considered a key limitation in subsequently derived bio-geophysical retrieval algorithms (Niro et al., 2021). Presently, there are no global networks systematically collecting ground-data for the validation of surface reflectance products over land.
There is a long history of using ad hoc campaigns, ground and airborne measurements for the validation of EO products (Badawi et al., 2019). However, there are limitations to ad hoc campaign validation approaches including inclement weather conditions, time and cost constraints and personal availability which minimises the number of validation matchups. Moreover, attempts to validate multiple sensors with different overpass times and dates can be difficult to achieve using campaign validation models (Malthus et al., 2019). Recent advances in automated techniques have been developed to overcome some of these challenges, whilst maintaining similar results to those obtained from traditional validation campaigns. One such system which has been extensively used for the vicarious calibration to TOA products is the Radiometric Calibration Network (RadCalNet) (Banks et al., 2017; Bouvet et al., 2019; Jing et al., 2019), which was developed by the RadCalNet working group under the Committee on Earth Observation Satellites (CEOS) Working Group on Calibration and Validation (WGCV) and the Infrared Visible Optical Sensors (IVOS). However, there are still significant challenges and gaps which affect our ability to assess the radiometric quality of BOA products such as the limited geographical coverage of existing validation datasets and temporal and spatial mismatches between the reference datasets and the satellite data products (Niro et al., 2021).
Alternatively, indirect validation of SR products can be performed, such as the joint ESA-NASA Atmospheric Correction Inter-Comparison Exercise (ACIX) (Doxani et al., 2018) utilising the AERONET stations (Holben et al., 1998), to obtain a globally representative set of surface and climatological conditions.
The Horizon 2020 LANDHYPERNET project aimed to fill the gap in the validation of SR products by developing a network of land and water sites with automated, hyperspectral platforms which can make continuous measurements over a variety of surface types (Goyens et al., 2021). As part of this project, 9 test sites were deployed and formed a LANDHYPERNET network. The sites are: DEMMIN, Germany (DEGE), Wytham Woods, United Kingdom (WWUK), Princess Elisabeth, Antarctica (PEAN), ATB, Germany (ATGE), Gobabeb, Namibia (GHNA), IFEVA, Argentina (IFAR), Järvselja, Estonia (JAES), Tõrravere, Estonia (TOES) and Barrax, Spain (BASP). They include various land cover types such as deciduous broadleaf forest, cropland, bare soil, snow and ice, desert, grassland and needleleaf forest. All sites are equipped with the Hyperspectral Pointable System for Terrestrial and Aquatic Radiometry, (HYPSTAR®) instrument deployed as part of the LANDHYPERNET project. This paper describes the deployment of the HYPSTAR® instrument at the Wytham Woods, United Kingdom site. An overview of the LANDHYPERNET and satellite-derived SR products are presented. Then, the spatial variability of the site and validation results for two different high-resolution satellite missions: Sentinel-2 (S2), Landsat-8 and Landsat-9 (Landsat) are presented. Finally, the suitability of the site for use as a calibration and validation site for surface reflectance products and future steps are discussed.
The Wytham Woods United Kingdom (WWUK) site is a site of special scientific interest (SSSI) and has a long history of scientific research, including for the validation of satellite products (Brown et al., 2021), understanding the dynamics of canopy bio-physical properties (Brown et al., 2020) and carbon sequestration (Calders et al., 2022). Being a SSSI, it is a protected area in the United Kingdom and is representative of its natural fauna and flora. The site is managed by the University of Oxford and the area surrounding the flux tower is primarily ancient seminatural woodlands with the main species being ash (Fraxinus excelsior), beech (Fagus sylvatica), hazel (Corylus avellana), oak (Quercus robur) and sycamore (Acer pseudoplatanus) (Figure 1 left). The HYPSTAR® extended range (-XR)1 instrument was deployed at the top of a flux tower (N 51.77503°, W1.33906°) in November 2021, at a height of 28 m above the ground, on an extended 6 m horizontal boom to minimise the impact of the tower on the field of view (Figure 1 right). Data is collected every 30 min between 9 a.m. and 6 p.m. local time (UTC+0 in winter months and UTC+1 in British Summer Time) between viewing zenith angles of 0–30° and viewing azimuth angles of 83, 98, 113, 263, 278 and 293° corresponding to the typical viewing geometry of satellites on sun-synchronous orbits. The deployment of the instrument was not optimal, being on the North facing side of the flux tower due to local topography and the presence of other instruments on the flux tower.
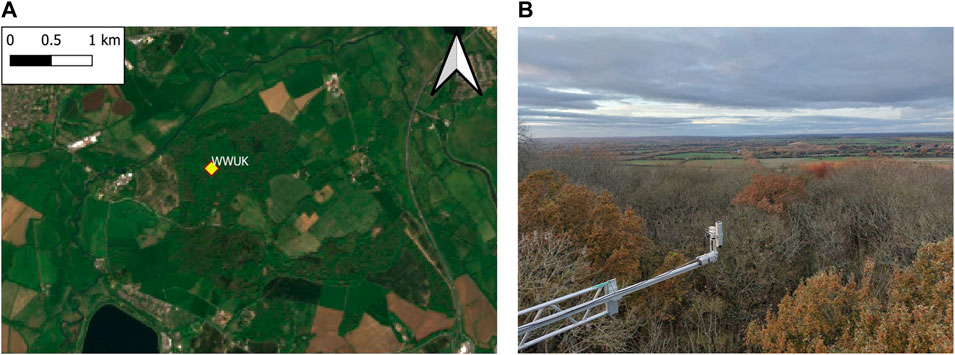
Figure 1. Wytham Woods United Kingdom (WWUK) site location (A) and mast (B). Contains modified Copernicus Sentinel data (2022) obtained from Copernicus Data Space Ecosystem.
The site is highly variable due to the annual phenological cycle of the vegetation changing the surface reflectance values and the structure of the canopy over the growing season. Moreover, diurnal variability in the surface reflectance is caused by variable shadowing affecting the site in different illumination conditions. Shadowing, caused by both the flux tower and the trunks of the tree, particularly impacted the sequences obtained in leaf-off conditions between mid-October and mid-April.
The HYPSTAR® XR instrument has been deployed as part of the LANDHYPERNET network. The instrument contains two modules; the first collecting visible and near-infrared spectra (VNIR, 380–1,000 nm) and the second collecting shortwave-infrared spectra (SWIR) up to 1700 nm with a 5° FOV for radiance measurements and 180° for irradiance measurements. The spectral sampling is 0.5 nm in the VNIR and 3 nm in the SWIR, with a spectral resolution of 3 nm and 10 nm respectively. All sequences have been processed using the HYPERNET_processor (Goyens et al., 2021) (De Vis et al., in prep) which automatically generates data products at different levels from raw counts (L0), up to surface reflectance (L2A) values for each angle by combining the radiance and irradiance measurements from each sequence. The surface reflectance product is defined as the Hemispherical-directional Reflectance Factor (HDRF) (Schaepman-Strub et al., 2006), which can be used as a proxy to measured Hemispherical-conical Reflectance Factor (HCRF), under the assumption that the relatively small instrument FOV (5°) and the small physical size of the fore optic allows us to make this approximation. Each data product comes with random and systematic uncertainties propagated using the CoMet toolkit (www.comet-toolkit.org) which applies a rigorous metrological approach (GUM, 2008).
A detailed description of the processing steps and the uncertainty propagation performed in the HYPERNET_processor can be found in De Vis et al. (in prep) or in the HYPERNET_processor documentation2. In total 5,572 sequences have been collected since the instrument has been deployed up to the 31 August 2023, of which 4,254 sequences have been processed to surface reflectance products (L2A) without any issues.
In addition to the standard checks in the HYPERNET_processor two additional screening procedures are developed to remove outliers and only supply the best quality data suitable for satellite validation. These two additional checks are firstly that the spectrum matches a typical vegetation spectrum and the sigma-clipping approach, both are described in detail below. Only data between April and October, corresponding to the leaf on period, are considered to be checked against a nominal vegetation spectrum. Spectra need to pass three tests: that there is a peak in the green portion of the visible wavebands (560 nm), that a red edge is detected and that their Normalized Difference Vegetation Index (NDVI) exceeds 0.42. The threshold of NDVI >0.42 was selected as it allowed for consistency between spectrum from the HYPSTAR instrument corresponding to vegetation and pixels classified as vegetation in the scene classification layer of S2 SR products (Main-Knorn et al., 2017).
After the vegetation quality flags are applied and spectra that failed any of the three tests have been removed, a sigma-clipping method is used to remove remaining outliers. First reflectances are extracted in separate 2 hour windows throughout the day (to account for BRDF differences due to different solar position) for 4 different wavelengths (500, 900, 1,100 and 1,600 nm). Outliers in these reflectances are then identified by iteratively calculating the mean reflectance trend with time (by binning the data per maximum 30 data points), calculating the standard deviation from this trend, and masking any data that is more than 3 standard deviations away from the trend. This process is repeated on the unmasked data until the standard deviation does not vary by more than 5% between two iterations. The masks for the 4 different wavelengths are then combined (keeping only measurements for which none of the 4 wavelengths is an outlier). The reflectances and associated uncertainties for any masked series (i.e., a geometry that is masked either by the sigma-clipping procedure or from the masks of the HYPERNETS_processor) are replaced by NaNs. Any sequence that has more than half of its series masked is removed entirely. After this second screening procedure is applied 396 sequences remain. This data is open access and the first version available (Morris et al., 2023)3 which contains data from April 2022–April 2023. Additional data files from May–August 2023 have been used in this study which are not currently included in the zenodo dataset but will be included in the next release.
The Sentinel-2 (S2) Copernicus mission is a high spatial resolution (10 m–60 m), multi-spectral optical imaging mission. Two sun-synchronous satellites, S2A and S2B, launched in June 2015 and March 2017 respectively, are phased at 180° to each other, providing a revisit time of 5 days (Drusch et al., 2012). Onboard these satellites is a multispectral instrument (MSI), which has 13 spectral bands covering the visible, infrared and short wave infrared. Surface reflectance data, which corresponds to the directional hemispherical reflectance at a surface (Schaepman-Strub et al., 2006), is provided to users in the Level-2A products which have been generated using the atmospheric correction processor Sen2Cor (Main-Knorn et al., 2017).
There have been a limited number of studies which have attempted to evaluate the performance of S2 Level-2A products (Origo et al., 2020; Pancorbo et al., 2021). Systematic evaluation of the performance of S2 SR products is conducted by the S2 Mission Performance Cluster (S2MPC) (S2MPC, 2023). Total uncertainty of SR retrieval with Sen2Cor was estimated as 7% (k = 1) over bright RadCalNet sites and 17% over bare soil and meadow sites in Germany (Pflug et al., 2022). Utilising the data collected by Pflug et al., the S2MPC found that 79% of retrieved SR values are within the mission uncertainty requirement goals of S2, (0.05 * reflectance value +0.005). The conventional S2 Level-2A product does not come with any associated uncertainty values. However, a recently released tool, the S2L2 Radiometric Uncertainty Tool (RUT) which utilises a multivariate MonteCarlo Model (MCM) to derive uncertainty and spectral correlation information for a S2 region of interest, has been used in this study to obtain uncertainties, using the standard parameters provided (Gorroño et al., 2023).
All available S2 L2A surface reflectance products and their corresponding top of atmosphere L1C products, from April 2022 to August 2023, which have been processed using Sen2cor version 4.0.0 (Main-Knorn et al., 2017), were downloaded from the Copernicus Open Access Hub (https://scihub.copernicus.eu/).
Landsat 8 (L8) and Landsat 9 (L9) are the most recently launched missions (February 2013 and September 2021 respectively) of the NASA/USGS Landsat program, which has been operational since the 1970s (Wulder et al., 2019). Both satellites have two instruments onboard: the Operational Land Imager (OLI) and the Thermal Infrared Sensor (TIRS). OLI provides 15–30 m imagery in 9 multispectral bands covering the visible, near infrared and shortwave infrared. TIRS measures land surface temperature in two infrared bands. Both satellites orbit in a sun-synchronous, near-polar orbit (98.2° inclination) with a 16-day repeat cycle (Markham et al., 2015; Masek et al., 2020). Validation of L8 and L9 L2 products has found differences of 3.3%–10% in comparison to in-situ datasets over a number of land cover types (Wulder et al., 2019; Teixeira Pinto et al., 2020; Eon et al., 2023). The current radiometric calibration accuracy and stability mission requirement targets are within 5% (k = 1) absolute spectral radiance; within 3% top-of-atmosphere reflectance and within 2% thermal infrared spectral radiance.
The Landsat 8/9 data was extracted using the cloud based platform of Google Earth Engine (Gorelick et al., 2017). For both satellites the corresponding Collection 2 Level-2 Tier 1 surface reflectance products were used (L84, L95). The surface reflectance products are generated using the Land Surface Reflectance Code (LaSRC), version 1.5.0 (Vermote et al., 2016).
One of the areas of interest in this study has been to assess the representativeness of the region of interest (ROI) measured by the HYPSTAR®XR instrument in comparison to the pixel extraction from the satellite. As previously mentioned, variability in the forest canopy can be caused by a variety of factors including different tree species, an undulating surface at the top of canopy, hot spots and shadowing.
The uncertainty associated with the spatial variability of the site at the HYPSTAR ROI scale was quantified using hyperspectral airborne data captured over the site on the 17 July 2021. This data was captured by the University of Zurich (UZH) Airborne Research Facility for Earth System (ARES) using the Airborne Visible/Infrared Imaging Spectrometer Next-Generation (AVIRIS-NG) instrument developed by the National Aeronautics and Space Administration (NASA) Jet Propulsion Laboratory (JPL). The data covered the spectral range of 380–2,510 nm with a 5 nm full width half maximum per band and a spatial resolution of 3 m. This data was radiometrically, atmospherically and geometrically corrected in house by JPL (Thompson et al., 2018; Chapman et al., 2019).
For each of the corresponding extracted ROIs from the satellite data the uncertainty associated with the spatial variability of the site at the HYPSTAR measurement size is determined from the standard deviation in the spread of the reflectance values per band. The spatial uncertainty is first interpolated to 1 nm bands then band integrated using the spectral response function of the HYPSTAR bands, before being propagated into the final uncertainty budget for the HYPSTAR measurements.
Once the satellite data has been downloaded, a python script identifies matchups to the nearest LANDHYPERNET sequence. A match-up is only considered, if there is a corresponding sequence within 2 hours of a cloud-free satellite overpass. In the case of multiple sequences, the sequences with the smallest difference in time is selected. As each sequence contains multiple reflectance scans taken at different viewing geometries, a matching procedure was used based upon the VAA of the satellite matchup and using the maximum VZA (30°), to maximise the top of canopy area sampled by the HYPSTAR instrument.
The hyperspectral data from the HYPSTAR instrument was integrated into the multispectral bands of each satellite using the specific relative spectral response (RSR) function of the sensor. This was obtained for both S2A and S2B6 as well as for OLI L8 (Barsi et al., 2014) and OLI L9 (Barsi et al., 2019).
Frtom each S2 scene, a 5 × 5 pixel extraction centered on the flux tower was acquired, corresponding to a 100 m × 100 m ROI. For Landsat scenes, a 3 × 3 pixel extraction was acquired corresponding to a 90 m × 90 m ROI. Pixels were flagged in each product using the corresponding quality flags provided with the products to remove pixels affected by cloud, cirrus cloud, no-data, saturated, degraded or otherwise contaminated pixels. For Landsat matchups, the mean and the standard deviation of all valid pixels per band was taken as the mean and spatial uncertainty associated with the extraction. For Sentinel-2 matchups, the average value was calculated as the mean of all valid pixels, whereas the uncertainty was calculated using the S2L2 RUT using its default parameters and running for 250 iterations of the MonteCarlo Model.
There were 32 S2 scenes available over the site during this study. Of these, 13 were affected by cloud cover and an additional 15 had no corresponding sequence that had passed all quality checks. There are 4 good quality S2 matchups found for the site over the two growing seasons. For Landsat 8 and 9 there are 62 potential matchups for this study. 45 of these are removed due to cloud cover and an additional 13 have no corresponding sequence. This leaves 5 good quality Landsat matchups for the site. Therefore in total there are 9 matchups between LANDHYPERNET and satellites used in this study. Matchups from the summer of 2022 were affected by periods of downtime, as the instrument is a prototype and needed maintenance, additionally, the summer of 2023 has been unseasonably cloudy affecting the majority of the matchups. Although, the current number of matchups is lower than expected for the site, in the future we hope to be able to provide greater statistics from this site. Details of all of the matchups can be found in Table 1, including time of observations, viewing and solar geometries. Plots for every matchup are given in the Supplementary Appendix S1.
For each match-up the reflectances from the LANDHYPERNET sequence can be compared directly to the satellite observations. The bias is calculated using Eq. 1 as the uncertainties are represented as relative in this study. Where ρband,LANDHYPERNET are the relevant satellites band-integrated BOA reflectances and ρsat are the observed BOA satellite reflectances. In the visible parts of the spectrum, reflectance values are very low over the dark vegetated site and therefore representing bias as a ratio leads to a lack of precision. Therefore, for these bands the results are compared in absolute reflectances in addition to relative signals. Each bias measurement comes with an associated uncertainty calculated using Eq. 2
where usat is the uncertainty associated with the satellite observation, uLANDHYPERNET is the measurement uncertainty associated with the LANDHYPERNETS data and ucomp is the comparison uncertainty accounting for differences in the measurements between the satellite and the HYPSTAR. The spatial variability of the site derived from the airborne data is used as the lower limit estimator of ucomp in this study. This is likely to be an underestimation of ucomp as it does not take into account other factors such as the BRDF of the canopy, shadowing and a mixture of the above and below canopy reflectance, pointing errors in the HYPSTAR and changes in both the viewing and solar geometries within the match-up window (Widlowski et al., 2015; Nevalainen et al., 2017). As the data from the LANDHYPERNET instrument and the satellite data has an associated uncertainty, conformity testing of the satellite SR products is performed using the mission requirements to define the upper and lower limits of the tolerance intervals. For each matchup the absolute difference between the WWUK data and the satellite data is used for evaluation. This difference also has an associated uncertainty derived using Eq. 2, accounting for the uncertainty associated with the satellite and LANDHYPERNET data and the comparison uncertainty. A measurement is conforming if the difference combined with the total uncertainty (utotal), is within the mission requirements. Shown in Eq. 3 for Sentinel-2 at k = 1. A measurement can also be inconclusive or nonconforming if one or both of the requirements are not met (ISO, 2003).
and
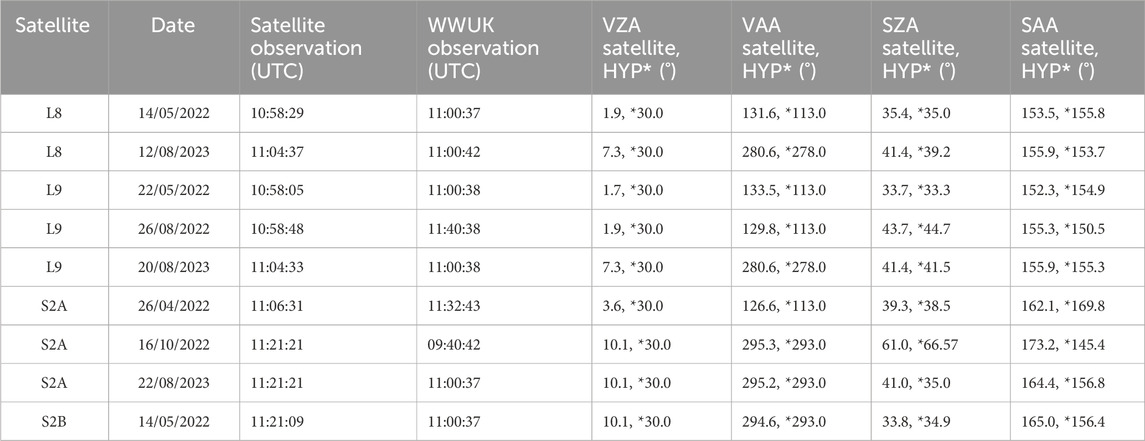
Table 1. Details of the matchups between the observations for WWUK with Landsat and Sentinel satellites. The viewing and solar zenith and azimuth angles are measured clockwise from North.
The heterogeneity of the site within a satellite ROI extraction can be seen in Figure 2, which shows the average airborne reflectance spectra (red data series) and the variability of the spectra within a 100 m × 100 m area around the flux tower (red shaded area) and the reflectance spectra from the exact pixel of the deployment of the HYPSTAR instrument from the airborne data (black data series). The spatial variability is expressed as k = 1 uncertainty and derived as the standard deviation of all pixels in ROI of airborne data. There is a slight underestimation in the HYPSTAR pixel in the NIR and SWIR bands in comparison to the average for the ROI. For all bands, this difference is less than the variability of the spectra within the ROI. The absolute difference between the two spectra in the visible range is less than 0.01, increasing to between 0.01 and 0.04 in 800–1,400 nm (Figure 2).
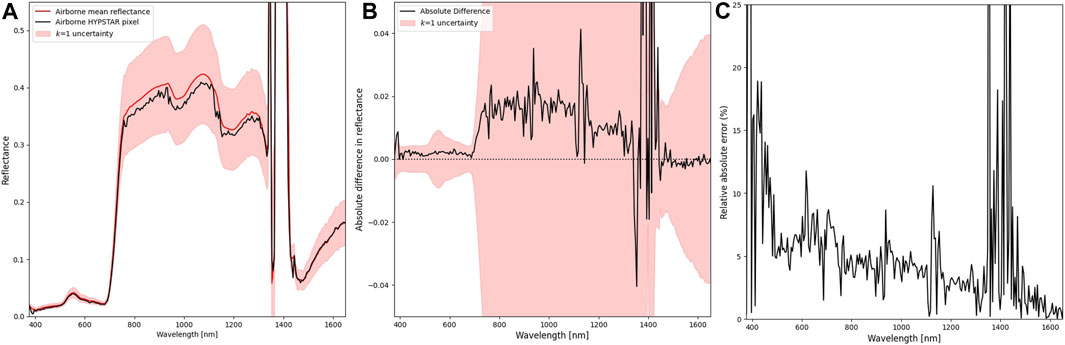
Figure 2. (A) Reflectance profiles for the central pixel and the ROI average with the standard deviation (k = 1) of the ROI plotted. (B) The absolute difference per wavelength between the ROI average and the central pixel, with the standard deviation (k = 1) of the ROI plotted. (C) The spectral relative absolute error (RAE) between the central and ROI spectra.
The Spectral Relative Absolute Error (RAE) was used to evaluate the representativeness of the airborne spectral reflectance profile of the pixel where the HYPSTAR instrument is deployed in comparison to the ROI average spectral reflectance profile (Xu et al., 2016). A smaller RAE value means the location of the HYPSTAR instrument is representative of the ROI at the spatial scale of the airborne data (Hakuba et al., 2013). In Figure 2 it can be seen that the location of the HYPSTAR instrument is representative of the overall 100 m × 100 m ROI. In the visible and NIR bands a near perfect relationship is seen with an RAE less than 20% at 400 nm and decreasing to less than 10% from 500 nm onwards. There are a few increases in the RAE values corresponding to bands affected by aerosols and water vapour bands in the atmosphere which would affect the airborne data.
The relative uncertainty associated with the airborne spectra at different spatial resolutions was calculated as the standard deviation of the airborne spectra divided by the mean airborne spectra for the ROI size. The relative variability was highest in the blue bands reaching 40% variability and averaging 20% variability for all wavelengths between 500–1,300 nm at k = 1 coverage factor (Figure 3). With an increase within the red-edge portion of tree species present at the site. The relative uncertainty increased as the size of the region of interest increased up to the decametric scale of the satellite data as shown in Figure 3. At any scale greater than this the uncertainties stabilised as the variability between the tree species and gaps in the canopy become less predominant. This pattern was found for all wavelengths across the visible, NIR and SWIR bands.

Figure 3. The relative spatial variability in the airborne data with k = 1 uncertainty for different spatial scales around the flux tower.
Observations of the BOA reflectance from S2 and from the corresponding LANDHYPERNET sequences show a similar spatial pattern for all of the matchups, whereby the WWUK data has a similar spectral profile to the S2 files, falling within the LANDHYPERNET uncertainties. In the visible wavelengths, both SR products have very low reflectances varying between 0.02–0.1. In the NIR and SWIR range, both products increase to the region of 0.35–0.5 (Figure 4).
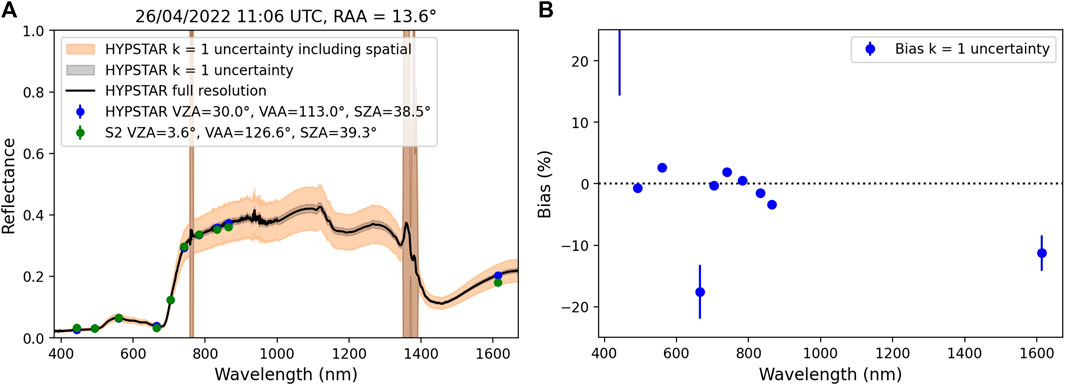
Figure 4. (A) The full resolution and band-integrated LANDHYPERNET data compare to Sentinel-2 data for the WWUK matchup on 26 April 2022. The two shaded areas represent the uncertainty (k = 1) of the LANDHYPERNET data only considering the instrument uncertainty (grey) or the instrument and the spatial representativeness uncertainty of the measurement (orange). The uncertainty bars on the S2 data are derived using the S2L2RUT tool. (B) The percentage difference (bias) between the band-integrated LANDHYPERNET data and the S2 data. A few points are off the graph due to the absolute values in reflectance being very small.
For the WWUK data products, two uncertainties are included accounting for the measurement uncertainty and also the spatial representativeness uncertainty, corresponding to the grey and orange shaded areas respectively. For each of the S2 bands the bias between the band-integrated WWUK data and the S2 bands has been calculated and plotted in the figures as a percentage. In the matchup from the 26 April 2022 shown in Figure 4, B01 has the greatest relative bias, at 27%. In absolute terms, this difference is 0.0071 which slightly exceeds the mission requirements of 0.0066 for the low reflectance. For the bands in the visible region, the relative bias ranges between −17.6% and 27.2%. The best agreement is found in bands B06, B07, B08 and B8A, with differences of less than 2% relative bias between the two datasets. Overall, these bands have the lowest relative biases across all of the S2 matchups. For all of the matchups the absolute biases between the LANDHYPERNETS data and the S2 extractions are less than the total combined uncertainty.
Additionally, an assessment into the temporal variability of the matchups between S2 and WWUK are presented. The percentage difference (bias) for all matchups are shown in Table 2, for all bands, there is a marked increase in the bias between the WWUK and S2 products from 2022 to 2023. This increasing bias between the two data sets could be caused by a number of factors such as a change in the vegetation conditions or degradation of the HYPSTAR via a build up of dust or dirt on the fore optics. However, to truly characterise this phenomenon, more matchups with satellite SR products over the next growing season are needed.
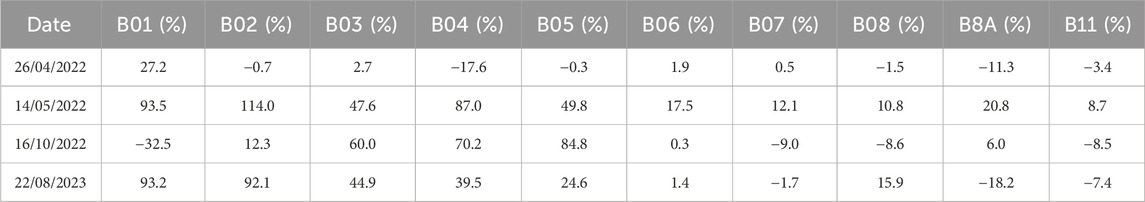
Table 2. The relative bias (%) per S2 band for all matchups used in this study.
The uncertainties in the S2 BOA reflectance products derived from the S2L2RUT tool are presented in Table 3. The tool gives the uncertainties at coverage k = 1. The lowest relative uncertainty (in the range of 3%–5%) occurs in the bands in the NIR and SWIR. The visible bands have higher uncertainties, ranging from 25% to 60%, for all S2 scenes. This is due to the relatively low reflectance values in these bands. These are represented in Figure 4 as error bars on the S2 values.
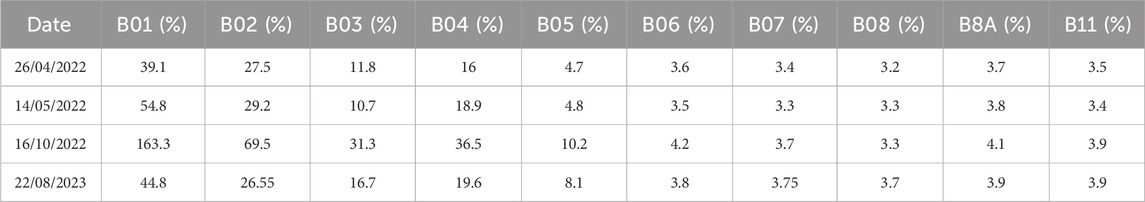
Table 3. The uncertainty (k = 1) (%) associated per band for the S2 data derived from the S2L2RUT tool.
The performance of the matchups against the mission requirements for S2 are shown in Figure 6 left. Overall, there is good agreement with the mission requirements for all bands, with an overall bias of - 0.01 in the S2 data. However, for all bands except Band 5 (704.1 nm), which has two non-conforming measurements, all measurements are inconclusive when assessing their conformity in comparison to the S2 mission requirements. As the absolute difference falls within the mission requirements and agrees within the combined uncertainties, there is no evidence that the S2 mission requirements are not being met. However, further work on reducing the comparison contributions towards the combined uncertainty would improve the conformity results from the analysis.
Overall, the results are similar to other validation results which found an absolute bias of 0.005 ± 0.02 for validation sites over much brighter and homogeneous surfaces (Pflug et al., 2022).
A comparison of Landsat SR and the corresponding LANDHYPERNET sequence from the 20 August 2023 is shown in Figure 5. In this example, there is relatively good agreement between the BOA reflectance from the two products with an underestimation (where Landsat reflectance is less than the LANDHYPERNETS) of less than 10% for B03 and B04. For all Landsat matchups there was an overestimation in B01 and B02, however these are reasonably small in absolute terms. Moreover, the agreement between the LANDHYPERNET data and Landsat was consistently worse than for S2, with significant differences in the NIR bands. This may suggest that the matchup approach adopted in this study, selecting the corresponding scan from a VZA of 30°, may need a BRDF correction implemented to minimise the different in VZA between the two datasets.
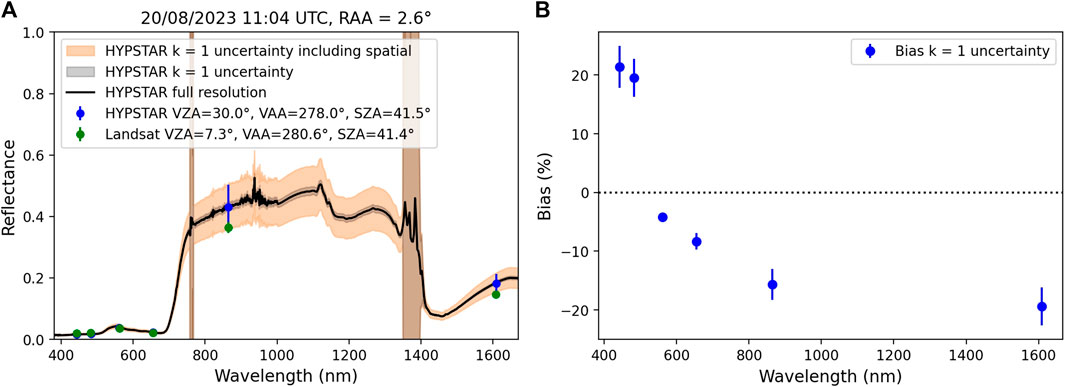
Figure 5. (A) The full resolution and band-integrated LANDHYPERNET data compare to Landsat data for the WWUK matchup on 20 August 2023. The two shaded areas represent the uncertainty (k = 1) of the LANDHYPERNET data only considering the instrument uncertainty (grey) or the instrument and the spatial representativeness uncertainty of the measurement (orange). The uncertainty bars on the Landsat data correspond to the standard deviation of the reflectances within the ROI. (B) The percentage difference (bias) between the band-integrated LANDHYPERNET data and the Landsat data. The error bars on the differences are derived using Eq. 2.
Finally, the overall performance of the matchups against the mission requirements are presented in Figure 6 right. For all of the bands, none of the measurements from the matchups are conforming to the mission requirements. However, this is partially due to the dominance of the comparison uncertainties in the total uncertainty budget. Overall, the performance is worse for Landsat than S2 with a higher bias of 0.04 from the HYPERNETS data in comparison to the Landsat data. In addition, there is a larger spread in the results, which can be seen in Band 5 (865.0 nm), with matchups both over and underestimating the reflectance in comparison to the satellite data. These results are similar, to those of Eon et al. (2023) which found a difference of 2% in the VNIR and 5%–8% in the SWIR region between UAV and Landsat SR products when performing SR validation over desert sites.
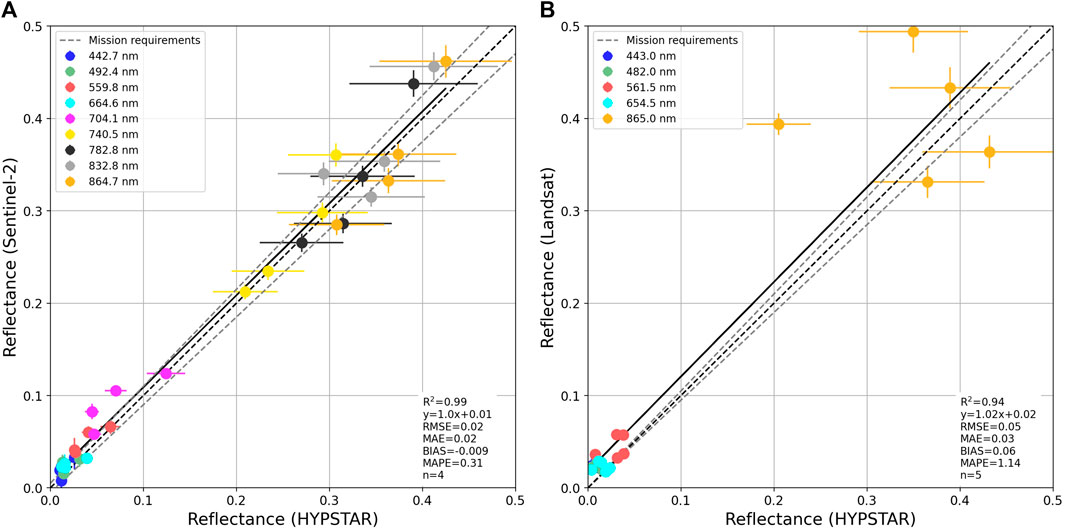
Figure 6. Evaluation of (A) S2 and (B) Landsat SR products against LANDHYPERNET products. The black dashed line represents a 1:1 relationship, the grey dashed lines represent the corresponding satellite mission requirements and the black solid line is the line of best fit between the WWUK data and the satellite matchups. The error bars on the plots correspond to the (k = 1) uncertainty associated with the LANDHYPERNET and satellite data.
The results presented in the previous section indicate that in its current set up, the WWUK site is suitable for use as a validation site for surface reflectance. However, as the site is operational for longer it will develop the understanding of the spatial variability at the site. There is no systematic bias between the WWUK data and the satellite data. As discussed in Section 2.1 the instrument deployment was compromised due to the presence of other instruments at the ideal location upon the flux tower. Additionally, as the instrument is deployed facing North, it is quite likely that the shadow from the structure of the flux tower is influencing the upwelling radiance measurements taken from the measurement area of the instrument, an example of which can be seen in Figure 7 as the shadow moves across the measurement area across the day. There is a large variability in the surface reflectance measurements obtained by the instrument for a particular VAA depending on the VZA as demonstrated in Figure 8. As the VZA increases the area of the top of canopy being measured will increase, with a lower gap fraction obtained at higher VZA, minimising the area of the understory being measured.
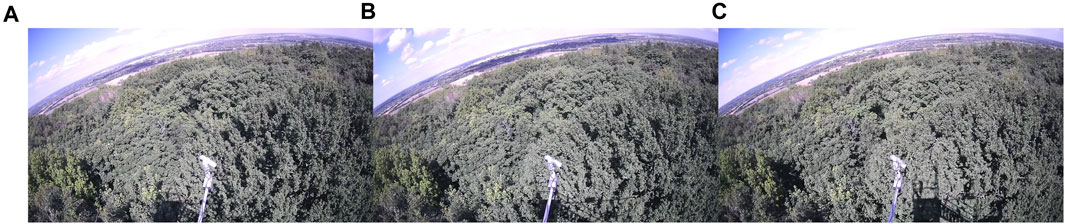
Figure 7. Webcam images of the HYPSTAR instrument from the 26th of August 2022. (A) image from 11:41, (B) image from 12:21 and (C) image from 13:01.
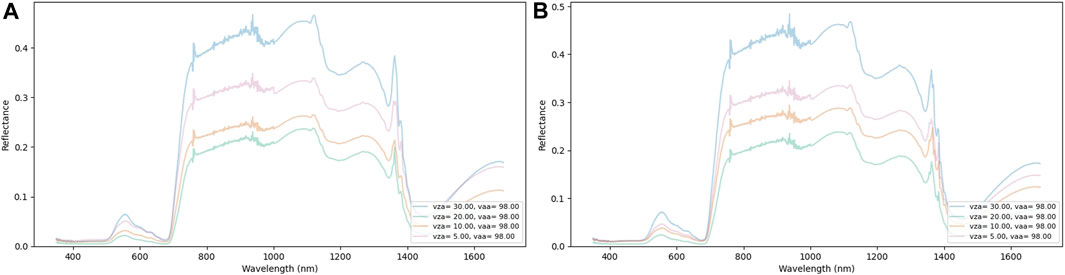
Figure 8. Examples of the different surface reflectances from the 98° VAA for some of the WWUK sequences. (A) 11:32 26 April 2022. (B) 11:40 30 April 2022.
As shown in Figure 8 measurements at 30° VZA do have the highest reflectance values. However, for measurements approaching nadir, there is no consistent pattern between the days, suggesting individual measurements could be affected by shadowing. To fully understand this further, additional measurements taken at more VZA and VAA angles would give us a better understanding of the variability in the reflectance due to the structure of the canopy. Therefore, in this study, the maximum VZA was used for comparisons. The uncertainty of using a different VZA in comparison to the satellite data was assessed through simulations based upon MODIS BRDF albedo products (MCD43A1) (Strahler et al., 1999) by generating reflectance for the same VZA measured by HYPSTAR (0°, 5°, 10°, 20°, 30°). Overall, a maximum difference in reflectance values of 25% in wavelengths 841 nm–876 nm was found comparing VZA of 0° and 30° within the solar principle plane, suggesting that a full BRDF model for the forest canopy would help to correct for this variability. However, due to the overpass time of the satellite observations used in this study, measurements are taken with a relative azimuth angle of 5°–15°which would reduce the BRDF effect.
To minimise the impact of changes in local environmental and illumination conditions the closest, valid, HYPSTAR sequence within a 2 hour window was selected for the comparison. For the majority of the comparisons a matchup was available within 30 min, leading to a change in SZA of <1°(viewing geometries for matchups are presented in Table 1). However, for the match up on the 16 October 2022, the closest available sequence was at 09:40 from the HYPSTAR instrument in comparison to an S2 overpass of 11:21. As such there was a change in the SZA from 66.57° to 61° between the matchups. The change in SZA for this matchup, may have been a significant factor in the differences for the disagreement between the SR as we are not yet able to correct for the forest BRDF effect.
Another issue which could be affecting the measurements is the height above the canopy that the HYPSTAR instrument is deployed at and the corresponding small FOV of the in-situ measurements. For nadir measurements the maximum canopy footprint of the HYPSTAR instrument is 4.69 m2 assuming the instrument is pointing at a gap in the canopy and measuring the ground surface. However, it is likely to be a lot smaller than this due to the height of the surrounding trees, which average 24 m in the surrounding area (Calders et al., 2022). Therefore the measurements from different viewing angles and different days are susceptible to a number of unknown assumptions such as the BRDF of the foliage elements, the BRDF of the background, the spatial variability of the background BRDF and the temporal dynamics of these characteristics. These assumptions were identified in the RAMI-IV exercise as all having an influence on the retrieved reflectance (Widlowski et al., 2015). Additionally, the illumination conditions of the understory and overstory vegetation could be different, both of which could be measured within the FOV of a HYPERNETS scan whereas in summer, when the canopy is at maximum coverage, the satellite signal is dominated by the overstory vegetation (Nevalainen et al., 2017). For future studies, this could be estimated at the site by measuring the distance to the canopy and the understory at various viewing angles from the location of the sensor by using a laser range finding instrument. This information could then be utilised in a 3D-model of the site to be incorporated for satellite matchups at different viewing geometries.
Ideally to assess the accuracy of the surface reflectance obtained by the HYPSTAR instrument and fully validate its measurements uncertainty estimates a comparison against an independent instrument would be performed at the site (Kuester et al., 2001). A comparison of the HYPSTAR against a RadCalNet instrument has been performed at the Gobabeb site for BOA data from both instruments. Comparisons over a six-month period displays initial difference to within 5% in the visible and near infrared (VNIR), as well as 1%–2.5% agreement in the short-wave infrared (SWIR) (Sinclair et al., 2023). However, there are currently no independent, point, multiangular hyperspectral measurements taken at WWUK over where the instrument is positioned. Future work involving UAV mounted sensors could provide an independent method for assessing the accuracy of the HYPSTAR system.
Additionally, further work is needed to expand the uncertainties associated with the HYPSTAR measurements. In the current version of the data used in this paper, uncertainties associated with the stray light correction and the spectral positioning of the LANDHYPERNET bands are not included in the full uncertainty budget.
Accounting for the spatial heterogeneity of the site was one of the key considerations applied in the validation methodology in this study. The spatial variability of the site at the satellite was included as the comparison uncertainty (ucomp) in the overall uncertainty calculation to account for this variability. However, the spatial uncertainty becomes the dominant component in the combined uncertainty over a heterogeneous target. The issue of spatial mismatch between in-situ and satellite SR is frequently discussed in the literature (Gamon et al., 2006; Hill et al., 2006; Román et al., 2009; Song et al., 2019). Consequently, validation of SR products tends to be conducted over homogeneous targets (Wulder et al., 2019; Origo et al., 2020; Teixeira Pinto et al., 2020; Pflug et al., 2022; Eon et al., 2023). Nevertheless, it is important to assess the performance of these products over multiple landcover types, especially forests, which biophysical products such as leaf area index are derived from satellite SR products. Additionally, as far as we are aware this is the first validation of high spatial resolution satellite data using a multi-angular hyperspectral imaging system and therefore the results presented here give us a baseline for expected performance, which will be improved as the understanding of spatial variability increases.
Finally, although the use of the airborne data helped to quantify the spatial variability of the site at the satellite scale, there are improvements that could be made in this analysis. The collection of hyperspectral data over the site using sensors mounted on Unmanned Aerial Vehicles would address two limitations of the current technique. Firstly, the spatial resolution of such data is on the order of tens of time smaller than that of the currently used airborne data, allowing more precise information about the spatial representativeness for different viewing angles to be understood (Fawcett et al., 2020). Secondly, in comparison to airborne campaigns, UAV campaigns are relatively low cost to perform which could allow for a more frequent sampling interval across the growing season to see how the spatial variability varies across the year which would improve the uncertainty assessment associated with the spatial variability (Arroyo-Mora et al., 2019).
This paper demonstrates the use of a novel, autonomous hyperspectral surface reflectance data collected at Wytham Woods, United Kingdom (WWUK) as part of the LANDHYPERNET network for the validation of multispectral data from Sentinel-2 and Landsat 8 and Landsat 9. The deployment of the HYPSTAR instrument at the site, the corresponding quality control of the data products is described. In this paper the first satellite validation activity of Sentinel-2 and Landsat 8 and 9 has been performed using the BOA products produced by the HYPERNET_processor at the WWUK site. This is the first study using autonomous, hyperspectral in-situ measurements for the validation of surface reflectance land products over forests using a point measurement and therefore provides an understanding of the minimum performance expected using such a system. In addition, a methodology based upon metrological principles has been outlined showing the propagation of uncertainties from the LANDHYPERNET and satellite data products to enable conformity testing of the satellite products using the satellite mission requirements. Overall for the WWUK site, the initial findings from this comparison indicate good agreeement between the reflectance products produced by the HYPSTAR instrument and the satellite product. The strongest agreement is with bands in the red and NIR. Additionally, in absolute terms, the differences in the visible bands are within the mission requirements for Sentinel-2 but are inconclusive due to the large uncertainties associated with the in-situ data.
These differences could be reduced by mounting the HYPSTAR instrument on a higher tower above the surrounding forest canopy, increasing the FOV of the instrument and minimising the impact of local shadowing on the instrument. A longer time series from the site will improve the analysis by leading to more satellite matchups, additionally incorporating a BRDF model of the local vegetation could improve the matchups between the in-situ and satellite products. Furthermore, expanding the analysis to include leaf-off conditions will allow for a more comprehensive understanding of the temporal dynamics of the satellite products. Finally, this analysis focused on multispectral satellite products, further analysis could be conducted on hyperspectral missions such as CHIME, ENMAP, PRISMA and GLIMR further exploiting the relatively fine spectral resolution of the LANDHYPERNET data products.
The raw data supporting the conclusion of this article will be made available by the authors, without undue reservation.
HM: Writing–original draft, Writing–review and editing, Conceptualization, Data curation, Formal Analysis, Investigation, Methodology, Project administration, Resources, Software, Supervision, Validation, Visualization. MS: Conceptualization, Data curation, Methodology, Validation, Visualization, Writing–review and editing. PD: Conceptualization, Data curation, Methodology, Software, Validation, Visualization, Writing–review and editing. AB: Conceptualization, Data curation, Funding acquisition, Methodology, Project administration, Resources, Supervision, Validation, Visualization, Writing–review and editing.
The author(s) declare financial support was received for the research, authorship, and/or publication of this article. The HYPERNETS project is funded by the European Union’s Horizon 2020 research and innovation program under grant agreement No. 775983 and by the HYPERNET-POP project funded by the European Space Agency (contract no. 4000139081/22/I-EF). The CoMet toolkit was developed using funding from the ESA-funded Instrument Data quality Evaluation and Assessment Service—Quality Assurance for Earth Observation (IDEAS-QA4EO) contract funded by ESA-ESRIN (no. 4000128960/19/I-NS) and the United Kingdom’s Department for Business, Energy and Industrial Strategy’s (BEIS) National Measurement System (NMS) programme.
We thank the Copernicus program, the U.S. Geological Survey for the use of their data. The authors extend their gratitude to Nigel Fisher and the University of Oxford for facilitating access to Wytham Woods, in addition to Curt Lambert for his technical support in the establishment and maintenance of the Wytham Woods site. We thank Andreas Hueni and his team from the University of Zürich for the collection of the AVIRIS-NG airborne data over Wytham Woods used in this study.
The authors declare that the research was conducted in the absence of any commercial or financial relationships that could be construed as a potential conflict of interest.
All claims expressed in this article are solely those of the authors and do not necessarily represent those of their affiliated organizations, or those of the publisher, the editors and the reviewers. Any product that may be evaluated in this article, or claim that may be made by its manufacturer, is not guaranteed or endorsed by the publisher.
2https://LANDHYPERNET-processor.readthedocs.io/en/latest/
3https://doi.org/10.5281/zenodo.7962557
4https://developers.google.com/earth-engine/datasets/catalog/LANDSAT_LC08_C02_T1_L2
5https://developers.google.com/earth-engine/datasets/catalog/LANDSAT_LC09_C02_T1_L2
6https://sentinels.copernicus.eu/web/sentinel/user-guides/sentinel-2-msi/document-library/-/asset_publisher/Wk0TKajiISaR/content/sentinel-2a-spectral-responses
Arroyo-Mora, J. P., Kalacska, M., Inamdar, D., Soffer, R., Lucanus, O., Gorman, J., et al. (2019). Implementation of a uav–hyperspectral pushbroom imager for ecological monitoring. Drones 3, 12. doi:10.3390/drones3010012
Badawi, M., Helder, D., Leigh, L., and Jing, X. (2019). Methods for earth-observing satellite surface reflectance validation. Remote Sens. 11, 1543. doi:10.3390/rs11131543
Banks, A. C., Hunt, S. E., Gorroño, J., Scanlon, T., Woolliams, E. R., and Fox, N. P. (2017). A comparison of validation and vicarious calibration of high and medium resolution satellite-borne sensors using radcalnet. Sensors, Syst. Next-Generation Satell. XXI 10423, 246–254. doi:10.1117/12.2278528
Barsi, J. A., Lee, K., Kvaran, G., Markham, B. L., and Pedelty, J. A. (2014). The spectral response of the landsat-8 operational land imager. Remote Sens. 6, 10232–10251. doi:10.3390/rs61010232
Barsi, J. A., Markham, B. L., McCorkel, J., McAndrew, B., Donley, E., Morland, E., et al. (2019). The operational land imager-2: prelaunch spectral characterization. Earth Obs. Syst. XXIV 11127, 35–45. doi:10.1117/12.2529776
Bouvet, M., Thome, K., Berthelot, B., Bialek, A., Czapla-Myers, J., Fox, N. P., et al. (2019). Radcalnet: a radiometric calibration network for earth observing imagers operating in the visible to shortwave infrared spectral range. Remote Sens. 11, 2401. doi:10.3390/rs11202401
Brown, L. A., Camacho, F., García-Santos, V., Origo, N., Fuster, B., Morris, H., et al. (2021). Fiducial reference measurements for vegetation bio-geophysical variables: an end-to-end uncertainty evaluation framework. Remote Sens. 13, 3194. doi:10.3390/rs13163194
Brown, L. A., Ogutu, B. O., and Dash, J. (2020). Tracking forest biophysical properties with automated digital repeat photography: a fisheye perspective using digital hemispherical photography from below the canopy. Agric. For. Meteorology 287, 107944. doi:10.1016/j.agrformet.2020.107944
Calders, K., Verbeeck, H., Burt, A., Origo, N., Nightingale, J., Malhi, Y., et al. (2022). Laser scanning reveals potential underestimation of biomass carbon in temperate forest. Ecol. Solutions Evid. 3, e12197. doi:10.1002/2688-8319.12197
Chapman, J. W., Thompson, D. R., Helmlinger, M. C., Bue, B. D., Green, R. O., Eastwood, M. L., et al. (2019). Spectral and radiometric calibration of the next generation airborne visible infrared spectrometer (aviris-ng). Remote Sens. 11, 2129. doi:10.3390/rs11182129
Claverie, M., Ju, J., Masek, J. G., Dungan, J. L., Vermote, E. F., Roger, J.-C., et al. (2018). The harmonized landsat and sentinel-2 surface reflectance data set. Remote Sens. Environ. 219, 145–161. doi:10.1016/j.rse.2018.09.002
Doxani, G., Vermote, E., Roger, J.-C., Gascon, F., Adriaensen, S., Frantz, D., et al. (2018). Atmospheric correction inter-comparison exercise. Remote Sens. 10, 352. doi:10.3390/rs10020352
Drusch, M., Del Bello, U., Carlier, S., Colin, O., Fernandez, V., Gascon, F., et al. (2012). Sentinel-2: esa’s optical high-resolution mission for gmes operational services. Remote Sens. Environ. 120, 25–36. doi:10.1016/j.rse.2011.11.026
Eon, R., Gerace, A., Falcon, L., Poole, E., Kleynhans, T., Raqueño, N., et al. (2023). Validation of landsat-9 and landsat-8 surface temperature and reflectance during the underfly event. Remote Sens. 15, 3370. doi:10.3390/rs15133370
Fawcett, D., Panigada, C., Tagliabue, G., Boschetti, M., Celesti, M., Evdokimov, A., et al. (2020). Multi-scale evaluation of drone-based multispectral surface reflectance and vegetation indices in operational conditions. Remote Sens. 12, 514. doi:10.3390/rs12030514
Fensholt, R., Rasmussen, K., Nielsen, T. T., and Mbow, C. (2009). Evaluation of earth observation based long term vegetation trends—intercomparing ndvi time series trend analysis consistency of sahel from avhrr gimms, terra modis and spot vgt data. Remote Sens. Environ. 113, 1886–1898. doi:10.1016/j.rse.2009.04.004
Gamon, J. A., Rahman, A., Dungan, J., Schildhauer, M., and Huemmrich, K. (2006). Spectral network (specnet)—what is it and why do we need it? Remote Sens. Environ. 103, 227–235. doi:10.1016/j.rse.2006.04.003
Gorelick, N., Hancher, M., Dixon, M., Ilyushchenko, S., Thau, D., and Moore, R. (2017). Google earth engine: planetary-scale geospatial analysis for everyone. Remote Sens. Environ. 202, 18–27. doi:10.1016/j.rse.2017.06.031
Gorroño, J., Guanter, L., Graf, L. V., and Gascon, F. (2023). A software tool for the estimation of uncertainties and spectral error correlation in sentinel-2 level-2a data products. EarthArXiv. doi:10.31223/X5GM33
Goyens, C., De Vis, P., and Hunt, S. E. (2021). Automated generation of hyperspectral fiducial reference measurements of water and land surface reflectance for the hypernets networks. IEEE Int. Geoscience Remote Sens. Symposium IGARSS, 7920. doi:10.1109/IGARSS47720.2021.9553738
GUM (2008). Evaluation of measurement data—guide to the expression of uncertainty in measurement. Int. Organ. Stand. Geneva 50, 134. doi:10.59161/JCGM100-2008E
Hakuba, M. Z., Folini, D., Sanchez-Lorenzo, A., and Wild, M. (2013). Spatial representativeness of ground-based solar radiation measurements. J. Geophys. Res. Atmos. 118, 8585–8597. doi:10.1002/jgrd.50673
Hill, M., Held, A., Leuning, R., Coops, N., Hughes, D., and Cleugh, H. (2006). Modis spectral signals at a flux tower site: relationships with high-resolution data, and co2 flux and light use efficiency measurements. Remote Sens. Environ. 103, 351–368. doi:10.1016/j.rse.2005.06.015
Holben, B. N., Eck, T. F., Slutsker, I. a., Tanré, D., Buis, J., Setzer, A., et al. (1998). Aeronet—a federated instrument network and data archive for aerosol characterization. Remote Sens. Environ. 66, 1–16. doi:10.1016/s0034-4257(98)00031-5
ISO (2003). Statistical methods: guidelines for the evaluation of conformity with specified requirements: Part 1: general principles. Int. Organ. Stand. doi:10.3403/30398733u
Jing, X., Leigh, L., Teixeira Pinto, C., and Helder, D. (2019). Evaluation of radcalnet output data using landsat 7, landsat 8, sentinel 2a, and sentinel 2b sensors. Remote Sens. 11, 541. doi:10.3390/rs11050541
Justice, C., Belward, A., Morisette, J., Lewis, P., Privette, J., and Baret, F. (2000). Developments in the’validation’of satellite sensor products for the study of the land surface. Int. J. Remote Sens. 21, 3383–3390. doi:10.1080/014311600750020000
Kuester, M., Thome, K., Krause, K., Canham, K., and Whittington, E. (2001). “Comparison of surface reflectance measurements from three asd fieldspec fr spectroradiometers and one asd fieldspec vnir spectroradiometer,” in IGARSS 2001. Scanning the Present and Resolving the Future. Proceedings. IEEE 2001 International Geoscience and Remote Sensing Symposium, China, 09-13 July 2001 (IEEE), 72–74.1
Li, J., and Roy, D. P. (2017). A global analysis of sentinel-2a, sentinel-2b and landsat-8 data revisit intervals and implications for terrestrial monitoring. Remote Sens. 9, 902. doi:10.3390/rs9090902
Li, Y., Chen, J., Ma, Q., Zhang, H. K., and Liu, J. (2018). Evaluation of sentinel-2a surface reflectance derived using sen2cor in north America. IEEE J. Sel. Top. Appl. Earth Observations Remote Sens. 11, 1997–2021. doi:10.1109/jstars.2018.2835823
Liang, S., Li, X., and Wang, J. (2012). Atmospheric correction of optical imagery. Adv. Remote Sens. 117. doi:10.1016/B978-0-12-385954-9.00005-8
Main-Knorn, M., Pflug, B., Louis, J., Debaecker, V., Müller-Wilm, U., and Gascon, F. (2017).Sen2cor for sentinel-2, Image Signal Process. Remote Sens. XXIII, 10427, 37–48. doi:10.1117/12.2278218
Malthus, T., Ong, C., Lau, I., Fearns, P., Byrne, G., Thankappan, M., et al. (2019). A community approach to the standardised validation of surface reflectance data. A technical handbook to support the collection of field reflectance data.
Markham, B., Storey, J., and Morfitt, R. (2015). Landsat-8 sensor characterization and calibration. Remote Sens. 7, 2279–2282. doi:10.3390/rs70302279
Masek, J. G., Wulder, M. A., Markham, B., McCorkel, J., Crawford, C. J., Storey, J., et al. (2020). Landsat 9: empowering open science and applications through continuity. Remote Sens. Environ. 248, 111968. doi:10.1016/j.rse.2020.111968
Morris, H., Bialek, A., Sinclair, M., and De Vis, P. (2023). Initial Sample of HYPERNETS hyperspectral surface reflectance measurements for satellite validation from the Wytham Woods site in the United Kingdom.
Nevalainen, O., Honkavaara, E., Tuominen, S., Viljanen, N., Hakala, T., Yu, X., et al. (2017). Individual tree detection and classification with uav-based photogrammetric point clouds and hyperspectral imaging. Remote Sens. 9, 185. doi:10.3390/rs9030185
Niro, F., Goryl, P., Dransfeld, S., Boccia, V., Gascon, F., Adams, J., et al. (2021). European space agency (esa) calibration/validation strategy for optical land-imaging satellites and pathway towards interoperability. Remote Sens. 13, 3003. doi:10.3390/rs13153003
Origo, N., Gorroño, J., Ryder, J., Nightingale, J., and Bialek, A. (2020). Fiducial reference measurements for validation of sentinel-2 and proba-v surface reflectance products. Remote Sens. Environ. 241, 111690. doi:10.1016/j.rse.2020.111690
Pancorbo, J., Lamb, B. T., Quemada, M., Hively, W. D., Gonzalez-Fernandez, I., and Molina, I. (2021). Sentinel-2 and worldview-3 atmospheric correction and signal normalization based on ground-truth spectroradiometric measurements. ISPRS J. Photogrammetry Remote Sens. 173, 166–180. doi:10.1016/j.isprsjprs.2021.01.009
Pflug, B., Louis, J., de los Reyes, R., Pflug, K., Mueller-Wilm, U., Quang, C., et al. (2022). “Evaluation of sen2cor surface reflectance products over land surface with reference measurements on ground,” in IGARSS 2022-2022 IEEE international geoscience and Remote sensing symposium (China: IEEE), 4308–4311.
Román, M. O., Schaaf, C. B., Woodcock, C. E., Strahler, A. H., Yang, X., Braswell, R. H., et al. (2009). The modis (collection v005) brdf/albedo product: assessment of spatial representativeness over forested landscapes. Remote Sens. Environ. 113, 2476–2498. doi:10.1016/j.rse.2009.07.009
S2MPC (2023). Data quality report - MSI L2A (June 2023) (Copernicus Sentinel optical mission performance cluster).
Schaepman-Strub, G., Schaepman, M. E., Painter, T. H., Dangel, S., and Martonchik, J. V. (2006). Reflectance quantities in optical remote sensing—definitions and case studies. Remote Sens. Environ. 103, 27–42. doi:10.1016/j.rse.2006.03.002
Sinclair, M., Bialek, A., De Vis, P., and Bouvet, M. (2023). “Hypernets land network: hypstar®-xr deployment and validation in Namibia, africa,” in IGARSS 2023-2023 IEEE international geoscience and Remote sensing symposium (China: IEEE), 4625. –4627.
Song, R., Muller, J.-P., Kharbouche, S., and Woodgate, W. (2019). Intercomparison of surface albedo retrievals from misr, modis, cgls using tower and upscaled tower measurements. Remote Sens. 11, 644. doi:10.3390/rs11060644
Strahler, A. H., Muller, J., Lucht, W., Schaaf, C., Tsang, T., Gao, F., et al. (1999). Modis brdf/albedo product: algorithm theoretical basis document version 5.0. MODIS Doc. 23, 42–47.
Teixeira Pinto, C., Jing, X., and Leigh, L. (2020). Evaluation analysis of landsat level-1 and level-2 data products using in situ measurements. Remote Sens. 12, 2597. doi:10.3390/rs12162597
Thompson, D. R., Natraj, V., Green, R. O., Helmlinger, M. C., Gao, B.-C., and Eastwood, M. L. (2018). Optimal estimation for imaging spectrometer atmospheric correction. Remote Sens. Environ. 216, 355–373. doi:10.1016/j.rse.2018.07.003
Vermote, E., Justice, C., Claverie, M., and Franch, B. (2016). Preliminary analysis of the performance of the landsat 8/oli land surface reflectance product. Remote Sens. Environ. 185, 46–56. doi:10.1016/j.rse.2016.04.008
Widlowski, J.-L., Mio, C., Disney, M., Adams, J., Andredakis, I., Atzberger, C., et al. (2015). The fourth phase of the radiative transfer model intercomparison (rami) exercise: actual canopy scenarios and conformity testing. Remote Sens. Environ. 169, 418–437. doi:10.1016/j.rse.2015.08.016
Wulder, M. A., Loveland, T. R., Roy, D. P., Crawford, C. J., Masek, J. G., Woodcock, C. E., et al. (2019). Current status of landsat program, science, and applications. Remote Sens. Environ. 225, 127–147. doi:10.1016/j.rse.2019.02.015
Xu, B., Li, J., Liu, Q., Huete, A. R., Yu, Q., Zeng, Y., et al. (2016). Evaluating spatial representativeness of station observations for remotely sensed leaf area index products. IEEE J. Sel. Top. Appl. Earth Observations Remote Sens. 9, 3267–3282. doi:10.1109/jstars.2016.2560878
Keywords: LANDHYPERNET, HYPERNETS, hyperspectral, validation, surface reflectance, uncertainty, fiducial reference measurement, earth observation
Citation: Morris H, Sinclair M, De Vis P and Bialek A (2024) Utilising LANDHYPERNET data products over a deciduous broadleaf forest to validate Sentinel-2 and Landsat surface reflectance products. Front. Remote Sens. 5:1322760. doi: 10.3389/frsen.2024.1322760
Received: 16 October 2023; Accepted: 06 February 2024;
Published: 29 April 2024.
Edited by:
Quan Wang, Shizuoka University, JapanReviewed by:
Andreas Hueni, University of Zurich, SwitzerlandCopyright © 2024 Morris, Sinclair, De Vis and Bialek. This is an open-access article distributed under the terms of the Creative Commons Attribution License (CC BY). The use, distribution or reproduction in other forums is permitted, provided the original author(s) and the copyright owner(s) are credited and that the original publication in this journal is cited, in accordance with accepted academic practice. No use, distribution or reproduction is permitted which does not comply with these terms.
*Correspondence: Harry Morris, aGFycnkubW9ycmlzQG5wbC5jby51aw==
Disclaimer: All claims expressed in this article are solely those of the authors and do not necessarily represent those of their affiliated organizations, or those of the publisher, the editors and the reviewers. Any product that may be evaluated in this article or claim that may be made by its manufacturer is not guaranteed or endorsed by the publisher.
Research integrity at Frontiers
Learn more about the work of our research integrity team to safeguard the quality of each article we publish.