 Madjid Hadjal
 Ross Paterson1
 David McKee
- 1Physics Department, University of Strathclyde, Glasgow, United Kingdom
- 2Department of Arctic and Marine Biology, Faculty for Bioscience, Fisheries and Economy, UiT The Arctic University of Norway, Tromsø, Norway
Estimation of chlorophyll (CHL) using ocean colour remote sensing (OCRS) signals in coastal waters is difficult due to the presence of two other constituents altering the light signal: coloured dissolved organic material (CDOM) and mineral suspended sediments (MSS). Artificial neural networks (NNs) have the capacity to deal with signal complexity and are a potential solution to the problem. Here NNs are developed to operate on two datasets replicating MODIS Aqua bands simulated using Hydrolight 5.2. Artificial noise is added to the simulated signal to improve realism. Both datasets use the same ranges of in water constituent concentrations, and differ by the type of logarithmic concentration distributions. The first uses a Gaussian distribution to simulate samples from natural water conditions. The second uses a flat distribution and is intended to allow exploration of the impact of undersampling extremes at both high and low concentrations in the Gaussian distribution. The impact of the concentration distribution structure is assessed and no benefits were found by switching to a flat distribution. The normal distribution performs better because it reduces the number of low concentration samples that are relatively difficult to resolve against varying concentrations of other constituents. In this simulated environment NNs have the capacity to estimate CHL with outstanding performance compared to real in situ algorithms, except for low values when other constituents dominate the light signal in coastal waters. CDOM and MSS can also be predicted with very high accuracies using NNs. It is found that simultaneous retrieval of all three constituents using multitask learning (MTL) does not provide any advantage over single parameter retrievals. Finally it is found that increasing the number of wavebands generally improves NN performance, though there appear to be diminishing returns beyond ∼8 bands. It is also shown that a smaller number of carefully selected bands performs better than a uniformly distributed band set of the same size. These results provide useful insight into future performance for NNs using hyperspectral satellite sensors and highlight specific wavebands benefits.
1 Introduction
Retrieving concentrations of the three main water constituents, Chlorophyll (CHL), coloured dissolved organic material (CDOM) and Mineral Suspended Sediments (MSS) in coastal areas from remote sensing is a challenging task due to the complex interactions between these constituents and the associated light signal. Accurate estimations of these constituents is critical to understand interactions between physics, biology and human impacts in coastal waters. It is known that retrieval of CHL has potential to be overestimated by up to several orders of magnitude (Darecki and Stramski, 2004) using inappropriate algorithms in coastal waters. CDOM absorbs light in the visible with a decreasing exponential relationship from ultraviolet to infrared (Bricaud et al., 1981). It impacts the light signal used to retrieve CHL in coastal waters and leads to failure of CHL algorithms (Darecki and Stramski, 2004; Pitarch et al., 2016). MSS is relatively easy to estimate with good confidence from remote sensing algorithms (Nechad et al., 2010; Neil et al., 2011). However, high sediment concentrations impact the atmospheric correction process that converts the signal measured by a satellite spectroradiometer at the top of atmosphere into a water leaving remote sensing reflectance (Rrs0+) which most algorithms rely on. It is therefore crucial to be able to make accurate estimations of these three parameters based on remote sensing signals in coastal waters, and to be able to do so under conditions where each constituent varies freely from the other two.
Multi layered perceptrons (McCulloch andPitts, 1943; Hebb, 1949; Rosenblatt, 1958; Rumelhart et al., 1985; Rumelhart et al., 1986), here referred as neural networks (NNs), have in the past shown capacity to deal with complexity of the light signal in coastal conditions and allowed good retrieval of different parameters (Doerffer and Schiller, 1994; Buckton et al., 1999; Gross et al., 1999) and are potential candidates to advance from semi-analytical or empirical algorithms currently in use in complex waters (e.g., OC5, Gohin et al., 2002). Their potential benefit stems from ability to assimilate complex input information and independently establish statistically optimal relationships returning similar or higher performances than existing algorithms. However, NNs typically require substantial datasets to support training and limited availability of clear sky matchups between in situ and remotely sensed data is a limiting factor on the development of NNs. To date most NN algorithms remain regional with limited application to global scale or under represented conditions. With access to radiative transfer models such as Hydrolight 5.2, we can simulate remote sensing light fields for a wide variety of optical constituent combinations and create artificial data to test different hypothesis, thereby overcoming data availability issues and generating an opportunity to establish the real limits of NN development for coastal water remote sensing.
Hydrolight requires knowledge of inherent optical properties (IOPs, absorption, attenuation and backscattering) to be able to simulate light spectra leaving the ocean surface. In this case we need to be able to relate IOPs to constituent concentrations using a bio-optical model operating on material-specific IOPs (SIOPs). Relatively few complete sets of SIOPs have been presented in the literature. The dataset presented by Bengil et al. (2016) for optically complex waters in the Ligurian Sea, comprising both Case 1 and Case 2 water types (Morel and Prieur, 1977), provides the SIOPs needed to support rigorous exploration of the optical variability associated by freely varying CHL, CDOM and MSS concentrations. By being able to simulate surface remote sensing reflectance signals for a wide range of constituent combinations, we can test several hypotheses related to neural network development. Efforts are made to incorporate realistic estimates of measurement noise in both light and optical constituent concentrations in order to better simulate real world conditions. Hydrolight simulations of hyperspectral Rrs were used to produce the 13 MODIS Aqua bands available up to 869 nm and used for most parts of this study, as well as being used to study the potential of hyperspectral data for future ocean colour missions e.g. the Plankton, Aerosol, Cloud, ocean Ecosystem (PACE, Gorman et al., 2019).
The first hypothesis (H1) to be tested is that NNs will be able to provide accurate estimates of all three optical constituents across a wide range of constituent concentration combinations. This hypothesis sets the control group, and if a specific method improves performance, it has to outperform this hypothesis setup. This is an apparently simple test, but has to be considered within the context of the limits of real world data sampling. The distribution of data sampled in natural waters typically follows log normal distributions, reflecting a tendency to under-sample extreme scenarios of very high and very low concentrations of any given constituent (SeaBASS matchup dataset, Seegers et al., 2018). NNs require more data than empirical methods to learn robustly, especially if the signal contains complex non-linear interactions and is dependent on other factors, which are numerous in ocean colour (sun angle, temporal window used, resolution etc.). The reduced amount of data at both low and high ends of the data distribution is expected to negatively impact NN development when applied to such ranges in coastal waters (Hadjal et al., 2022). The second hypothesis (H2) is that training with an evenly distributed ‘flat’ data distribution will produce higher quality performance over the range of variability than is possible from a log-normal data distribution. If found to be true, this would point to potential benefits of directing future in situ sampling effort to more carefully attempt to cover the full range of optical variability found in coastal waters.
Schiller and Doerffer (1994) were the first to mention the use of NNs to solve the inverse problem in ocean color (1994). Gross et al. (1999); Schiller and Doerffer (1999) both proposed NNs to make estimates of CHL using Rrs as an input in respectively Case 1 and Case 2 waters condition; Buckton et al. (1999) proposed to test the impact of instrumental noise on the performances achieved by a NN on 300 simulated matchups. Hypothesis H1 consists of testing a combination of these three different studies with a simulated radiative transfer matchup dataset and actual knowledge of realistic uncertainties for the MODIS Aqua sensor. NN showed promising results when applied to real coastal data (D’Alimonte and Zibordi, 2003) and returned coherent structures for wide scale images (Jamet et al., 2005). A NN algorithm specific to the MERIS sensor wavebands was later developed (Doerffer and Schiller, 1994). Recently, similar work has been conducted for Sentinel–3 sensors by Brockmann et al. (2016). Hieronimyi et al. (2017) trained NNs optimized for 13 distinct water classes. Similar applications to retrieve CHL over lakes has been conducted with the use of NNs (Pahlevan et al., 2020; Xue et al., 2021; Cao et al., 2022), NNs have also successfully retrieved other variables, such as the spectral diffuse attenuation, Kd, in both open and coastal waters (Jamet et al., 2012); inherent optical properties (Ioannou et al., 2013); photosynthetically available radiation (Schiller, 2006) or multiple variables at the same time (Schroeder et al., 2007; Fan et al., 2021).
Despite great results achieved by NNs, the operational products in use by the ocean color community still rely on empirical or semi analytical algorithms to estimate chlorophyll (O’Reilly et al., 1998; Gohin et al., 2002; Lavigne et al., 2021). One of the limitations of NNs is the potential to overfit signals by remembering the training examples rather than establishing robust relationships between inputs and the target. This type of artefact is at least partly due to limited numbers of data available from ocean colour matchup datasets with only several thousand examples for the biggest datasets in the literature, while a single MODIS Aqua image can contain multiple millions of 1 km2 pixels. Multiple techniques exist to avoid overfitting issues, including multi-task learning (MTL). MTL occurs when NNs are trained to produce multiple related targets at the same time, with the main objective being to improve their performance, robustness and reduce overfitting problems (see Ruder, 2017 for a recent overview of different techniques available). Optical signals sampled in coastal waters are a good candidate to evaluate MLT as all three constituents contribute to the light signal. Tanaka et al. (2004) and Pahlevan et al. (2022) proposed to simultaneously retrieve CHL, CDOM and MSS based on NNs trained with modelled data. The third hypothesis (H3) is that simultaneous retrieval of all three constituents using MTL will perform better than individual retrievals by helping to constrain NN construction.
To date the majority of ocean colour NN development has been done in the context of data from multispectral sensors. A number of hyperspectral radiometers onboard satellites have been launched in the past including EO-1 and PROBA-1 (2001), with others added as an additional sensor to the ISS (International Space Station), including HICO the hyperspectral imager for the coastal ocean in 2009 (Corson et al., 2008) and HISUI the Hyperspectral Imager Suite in 2020 (Iwasaki et al., 2011). This development has continued with the launches of PRISMA (PRecursore IperSpettrale della Missione Applicativa, Loizzo et al., 2018) in 2019 and EnMap (Environmental Mapping and Analysis Program, Guanter et al., 2015) in 2020. There is a clear trend towards future ocean colour missions being equipped with hyperspectral sensors. However, increased spectral resolution is a technical challenge that is usually achieved by compromise with other mission parameters. For example, all of the sensors mentioned above have high spatial resolution (30–100 m) which comes with the side effect of a reduced temporal resolution (usually an image of the full Earth every 16 days) and signal to noise ratios are usually lower than for multispectral systems, reducing their effectiveness for deep ocean observations. These factors greatly reduce their impact for global scale algorithm development even though they provide access to much higher spectral information content and explains the absence to date of publicly available hyperspectral remote sensing matchup datasets. A further limiting factor stems from the challenge of accurate atmospheric correction for hyperspectral sensors (Ibrahim et al., 2018). The first sensor fulfilling global scale and time overpass requirements, PACE is planned to be launched in the near future by NASA.
Providing a neural network with additional relevant information should typically lead to improved performance, so it is reasonable to expect that NNs operating on hyperspectral data should perform better than those operating on multispectral data. Radiative transfer simulations can be performed with hyperspectral resolution that can be subsequently re-sampled at multispectral resolution, in this case corresponding to the wavebands used by MODIS. There is, of course, the potential for hyperspectral data to contain an element of information redundancy as there is likely to be some degree of correlation between adjacent or nearby spectral bands. By resampling the hyperspectral reflectance data produced by simulations we can test a fourth hypothesis (H4) that NNs operating on hyperspectral data will perform better than those operating on multi-spectral data. At the moment and until such time as there has been opportunity to collect sufficient volumes of matchup datasets for PACE, the only way to test the hypothesis that NNs will benefit from availability of hyperspectral data is with the use of modelled data.
2 Materials and methods
2.1 Hydrolight radiative transfer simulations
All remote sensing reflectance data used in this study were generated using Ecolight 5.2, part of the Hydrolight 5.2 software package(Sequoia Scientific Ltd). EcoLight 5.2 was used for the creation of the simulated above surface remote sensing reflectance (Rrs0+) spectra rather than Hydrolight mainly due to the processing time involved in creation of such extensive datasets: 10,000 constituent combinations for the dataset with a normal or flat distrubiton, which gives 20,000 independent combinations in total. Each of the 20,000 combinations of CHL, CDOM and MSS are unique and the constituents vary freely from each other (randomly selected). Comparison of light spectra with the more accurate model Hydrolight was not conducted here but is expected to be very similar (Lefering et al., 2016) and satisfies requirements for this study.
Simulations were set up with a uniform water column, a solar zenith angle of 0°, zero cloud cover, wind speed 9 m s−1, a refractive index of 1.34, water temperature of 20°C and salinity of 35 PSU. Note that the surface reflectance product reported here does not include sun glint effects (Lw/Es). The light signal was saved every 5 nm from 390 nm to 895 nm. 13 MODIS Aqua wavebands from the visible and infrared spectrum were simulated by averaging the hyperspectral signal using their full wavebands width provided by NASA (https://modis.gsfc.nasa.gov/about/specifications.php, last access 26th of March 2022) at 412, 443, 469, 488, 531, 547, 555, 645, 667, 678, 748, 859, 869 nm. Two datasets of 10,000 hyperspectral light spectra each were created. A bespoke Matlab script was used to generate IOPs using constituent data distributions and a bio-optical model described below, with data being presented to Hydrolight in the form of simulated AC and BB instrument files.
2.1.1 Constituent data distributions
Two constituent concentration data distributions were generated in order to test the hypothesis that evenly distributed training data would lead to NNs that outperform those trained with log-normal training datasets (H2). CHL, CDOM and MSS constituents were created following two different approaches. Both approaches use a random distribution of values for all three variables and return two datasets of 10,000 values each. The first dataset uses a log-normal (LN) distribution and crosses several orders of magnitude with limits summarized in Table 1 for each variable. These kinds of distributions are commonly found in reports of sampling campaigns from natural waters (e.g; Babin et al., 2003; Pahlevan et al., 2022) and can be observed in Figure 1 (a, b and c). The second dataset was created using a log-flat (LF) distribution, applying the same logarithmically spaced intervals as LN, shown in Figure 1 (d, e and f). While medians between the normal and flat distributions remain the same, there are significant difference in the mean values for each distribution type.
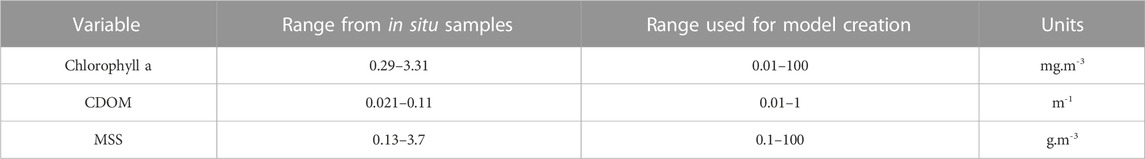
TABLE 1. In situ constituent concentration ranges.
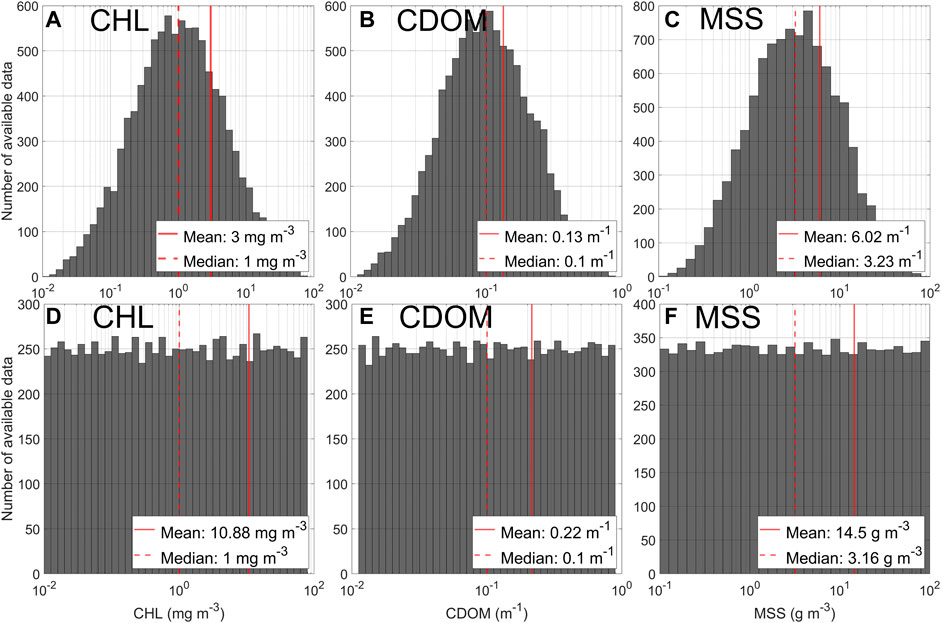
FIGURE 1. Histogram of each constituent concentration used for application of the radiative transfer model. First row shows the log normal distribution of (A) CHL, (B) CDOM and (C) MSS respectively. The second row shows the log flat distributions for (D) CHL, (E) CDOM and (F) MSS respectively.
2.1.2 Bio-optical model used
In order to simulate reflectance spectra for different combinations of optical constituents, the radiative transfer simulation requires selection of a bio-optical model to allow prediction of IOPs from constituent concentrations. Bengil et al. (2016) presented a bio-optical model for the Ligurian Sea that was adopted here. Full details are provided in Bengil et al. (2016) and are briefly summarized here. CHL, CDOM and MSS samples and IOP profiles were collected during a cruise campaign in the Ligurian Sea from 13 to 26 March 2009 off the northwest coast of Italy on board NR/V Alliance. Absorption and attenuation profiles were collected with a 25 cm pathlength AC-9 (WetLabs Inc.) operating at nine wavebands (10 nm FWHM) centred on 412, 440, 488, 510, 532, 555, 650, 676 and 715 nm. The AC-9 was calibrated using ultrapure water (Milli-Q, Millipore) before and during the cruise, with corrections applied for the temperature and salinity dependence of pure seawater. Absorption data were corrected for scattering errors using the proportional correction method (Zaneveld et al., 1994) Backscattering profiles were collected using a WETLabs BB9 operating at nine wavebands centred on 412, 440, 488, 510, 532, 595, 650, 676 and 715 nm. Backscattering data were interpolated to AC-9 wavelengths and measurements were corrected according to the BB-9 manual (WETLabs Inc, 2013). See Lefering et al. (2016) for more details. The absorption of all dissolved and suspended components minus water was measured using a Point Source Integrating Cavity Absorption Meter (PSICAM; Röttgers and Doerffer, 2007; Röttgers et al., 2005). A 1 m liquid waveguide capillary cell (LWCC) with an Ocean Optics USB2000 mini-spectrometer was used to measure absorption by CDOM. total particulate absorption was also measured using the quantitative filter pad method (Ferrari and Tassan, 1999). Samples were placed directly in front of the optical windows of a Shimadzu UV-2501PC spectrophotometer. Absorption by phytoplankton was determined by bleaching samples, measuring the absorption of non-algal particles, and subtracting this from total particulate absorption. Path length amplification factors and scattering offset corrections were determined using a linear regression approach (McKee et al., 2014; Lefering et al., 2016) and corresponding PSICAM particulate absorption data. The resulting filter pad corrections were subsequently applied to both bleached and unbleached filter pad absorption spectra.
Chlorophyll concentration was measured using standard HPLC measurements on samples filtered through GF/F filters, stored in liquid nitrogen and transported to laboratories for later analysis. CHL data presented here were collected by colleagues from Management Unit of the North Sea Mathematical Models (MUMM). Triplicate HPLC samples were analyzed by the Marine Chemistry Laboratory of the MUMM using a reversed phase, acetone-based method with a C18 column and a Jasco FP-1520 fluorescence detector. Total suspended solids concentrations (TSS) were obtained by colleagues from MUMM by filtering samples through pre-ashed, rinsed and pre-weighed 47 mm GF/F filters. Samples were rinsed with several aliquots of ultrapure water, taking care to rinse the edge of the filter to minimize salt retention. Filters were stored frozen and returned to the lab where they were dried and reweighed. All samples were measured in triplicate and final values expressed as averages. TSS in northeastern stations was numerically decomposed into organic (OSS) and mineral (MSS) components using the technique outlined in Bengil et al. (2016).
34 stations were available after quality control (Figure 2). Stations were partitioned into onshore and offshore sub sets, with deep clear case 1 waters in the southwestern part and shallower clear to turbid case 2 waters in the northeastern part. Figure 2 shows that the northeastern, onshore area is partly influenced by the Arno River plume and generally shows higher sediment concentrations near the coast. The offshore data set was in deep, relatively clear water which fitted the Case 1 definition and therefore did not contain significant MSS. This was used to determine CHL-specific IOPs. These CHL-specific IOPs were then used to help partition onshore IOPs which did contain MSS as well as CHL in the particulate fraction, enabling derivation of mineral specific SIOPs (again, for absorption, scattering and backscattering). Absorption by CDOM was directly measured in both sectors. Further details of this approach are found in Lo Prejato et al. (2020).

FIGURE 2. Repartition of the 34 in situ stations (displayed as white stars) where light and constituent concentrations were collected during the Ligurian cruise campaign in March 2009 displayed onto the true colour Landsat 5 image of the 8th of March, 2009.
SIOP spectra were generated from IOP measurements spanning the visible range (400–715 nm). In order to fully represent the range of wavebands provided by MODIS, SIOP spectra were extended out to 895 nm by linear extrapolation. Figure 3 shows the final set of SIOP spectra used to form the bio-optical model used for Ecolight simulations. Figure 4 shows remote sensing reflectance spectra obtained from Ecolight simulations using both LN and LF constituent distributions. These reflectance spectra together with their associated input constituent concentrations form the basis for training and testing NNs in this paper.
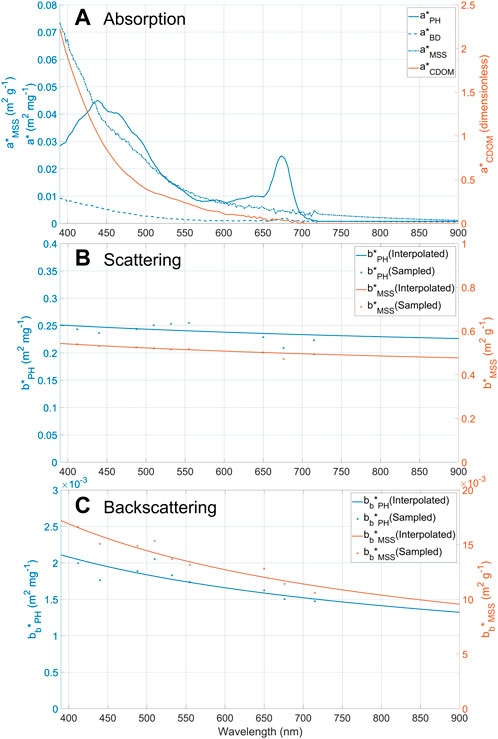
FIGURE 3. SIOP spectra used in radiative transfer simulations: (A) specific absorption spectra, (B) specific scattering spectra, and (C) backscattering spectra. PH stands for Phytoplankton, BD for Biogenic Detritus, MSS for Mineral Suspended Sediments.
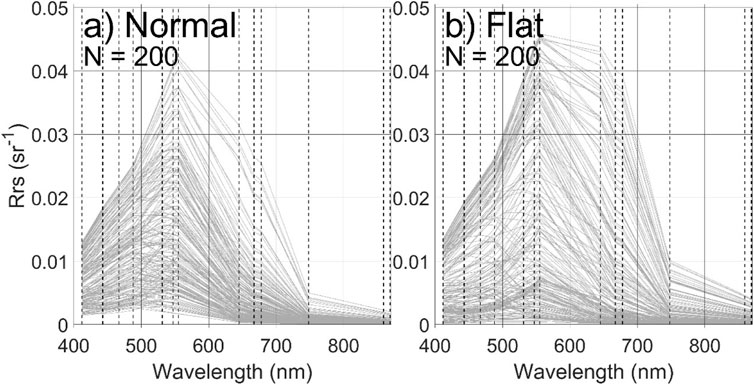
FIGURE 4. Rrs spectra for (A) log normal (LN) and (B) log flat (LF) constituent distributions. Only 200 random spectra of the 10,000 combinations are displayed for each distribution.
2.1.3 Simulation of radiometric noise and constituent measurement uncertainty
Simulated data from model outputs are essentially error-free and not impacted by noise compared to real Earth Observation data. In reality, measurement uncertainties will impact both remote sensing reflectance signals and measurements of constituent concentrations, both of which go into training and testing of NNs. In order to better simulate real world conditions, artificial noise was added to both the Rrs and constituent data prior to NN training. This is not related to the development of neural networks to help them make more realistic estimates if applied to real radiometric data, but an attempt at being as close as possible to real conditions using a simulated dataset.
Mélin et al. (2016) evaluated noise impacting the MODIS Aqua sensor data and found a wavelength dependent relationship, with shorter wavelengths returning higher measurement uncertainties. Figure 5 shows the error estimates for 5 MODIS Aqua bands following their work. Note that these estimates are for random noise only, and are based on analysis of 1 km spatial resolution bands which typically will have lower noise than the 500 m and 250 m spatial resolution bands, some of which have been used in our NNs. Here we have interpolated the Mélin et al. (2016) results using a power law relationship to provide estimated measurement uncertainties for Rrs on a hyperspectral basis. These values provide the standard deviation of measurement uncertainty for each wavelength, with noise being assigned to each wavelength of simulated Rrs using a random normal distribution operating on these predicted standard deviations.
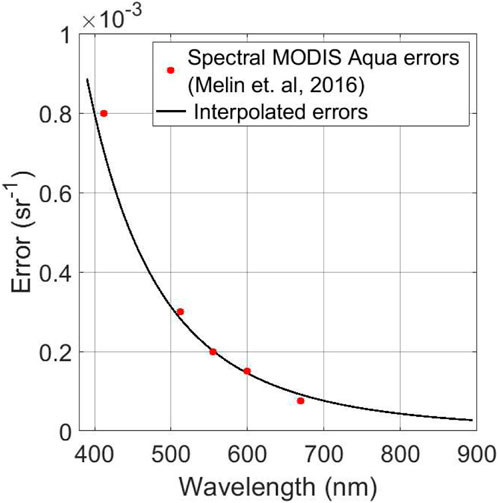
FIGURE 5. MODIS Aqua spectral random error (Estimated from Figure 3A in Melin et al., 2016) and its hyperspectral interpolation.
Constituent concentration measurements collected during fieldwork campaigns are sensitive to errors for several reasons, including errors related to the water sample filtration, sensor calibration, method specific or human errors, etc. Estimates of systematic uncertainties related to CHL sampling range from +/-10% (Claustre et al., 2004) to ±80% standard deviation (Sørensen et al., 2007; Tilstone et al., 2012), depending on the method used for sampling and the degree of quality control applied. We have used these systematic error ranges as a guide to define random errors due to limited information in the literature on random errors for CHL samples. There is even less information available in the literature for estimates of uncertainty in MSS measurements, so we have assumed that errors will be similar to those found for CHL as both techniques operate on filtered samples. For CDOM, Dall’Olmo et al. (2017) respectively found absorption measurements accuracy and precision of 0.0004 m−1 and 0.0025 m−1 when compared with independent data at 440 nm. For consistency Gaussian random errors were applied to CHL and MSS following a standard deviation of 20% and were assumed to be proportional to the concentration. Uncertainties for CDOM were determined using random normal distributions with a standard deviation of 0.0025 m−1. We applied noise to the model constituent outputs to better represent realistic datasets.
2.2 Neural network development
For this study, feed forward neural networks with backpropagation of the error until convergence was reached were developed using Matlab’s train function. An architecture of three hidden layers and N neurons in each layer was selected for each networks, with N being the number of inputs. For example, N was set to 13 when NNs were created using the 13 MODIS Aqua-like bands available with both datasets. Selecting three hidden layers is sufficient to avoid under fitting issues and is computationally efficient. The Rectified Linear Unit activation function was selected and the error was evaluated using the MSE error function. Light and constituents concentrations were log transformed and then normalised between 0 and 1 prior to training, following Dransfeld et al. (2006). The train set represented 70% of available data, and validation and test sets 15% each, all randomly selected for each training. For the last results section when hyperspectral NN were developed, the number of neurons per layer was selected to be the number of bands available for each experiment. Figure 6 shows a schematic diagram of a NN. It contains four inputs, two hidden layers of four neurons each (following the number of inputs as mentioned above), and can make estimations of all three constituents at the same time, CHL, CDOM and MSS as used in multi-task learning. When a single constituent is estimated, the output layer contains only one node associated with the desired constituent.
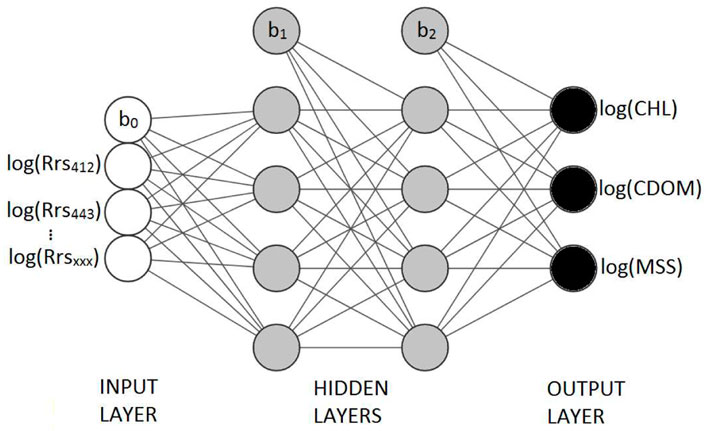
FIGURE 6. Neural network diagram as used for multi-task learning. Hidden layers always contain a number of neurons equal to the number of inputs. The output layer returns a single constituent at a time when MLT is not used.b0, b1 etc, represent the bias unit. The Rrs and constituents are log transformed prior to training.
NN performance will be evaluated with the Mean Absolute Error (MAE) using the Seegers et al. (2018) formula, which is a MAE applied to log transformed values to the model and observation parameters prior to application as shown in Eq. 1 below. For example, a MAE of 1.3 represents a relative measurement error of 30%.
The purpose of neural network development is to provide sufficient training data to allow the NN to establish robust statistical relationships that enable accurate prediction of the target parameter from potentially complex input data. The training part of the dataset is used to train the network, the validation part is used to stop the network training when it stops improving (when the magnitude of the gradient descent reaches a value below 10–7), and the test part is used to evaluate the performance of the resulting NN. Figure 7 shows data for training, validation and test datasets for CHL prediction using the LN distributed dataset without inclusion of input noise. All three datasets show very similar performances, and the same observation was made during the analysis of results section. This suggests that the NNs are not overfitting. To avoid showing similarly repetitive diagrams in the results section, only the independent test set results will be shown going forward.
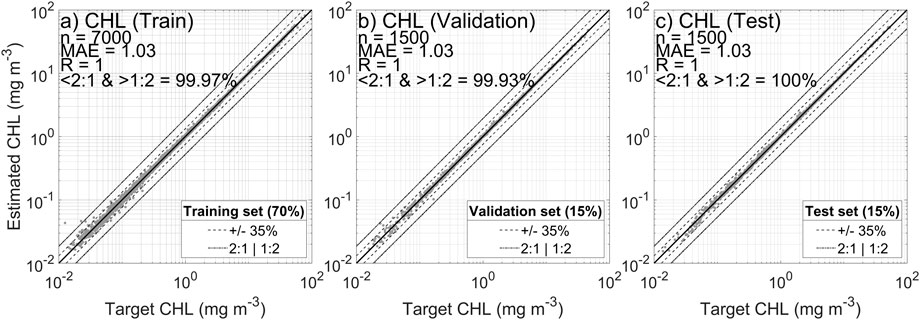
FIGURE 7. Neural network results estimating CHL based on the 13 MODIS Q23 Aqua bands, using the log normal distribution of data without addition of noise. (A) training, (B) validation, and (C) test data sets.
3 Results
3.1 NN retrieval of constituents in optically complex waters (H1)
The first set of experiments is designed to test the hypothesis that NNs should be able to accurately retrieve individual constituent concentrations (CHL, CDOM and MSS) across the broad range of optical water conditions found in coastal waters (H1) with this modelled dataset. Therefore for this section, NN were trained to produce a single constituent at a time. Figure 8 (a, b and c) shows performance obtained for the test sets for each constituent concentration, for the LN dataset, without addition of noise. All three constituents can be predicted with very high performances under these idealized conditions, with MAE vales close to one and more than 99% of data falling within a factor of two of the 1:1 line. Adding realistic estimates of random noise to both the reflectance and constituent datasets has a significant impact on NN performance. Figure 9 (a, b and c) shows that retrieval of CHL, CDOM and MSS is still largely successful, but there is a noticeable increase in the spread of data for each parameter, with MAEs reaching as high as 1.25 for CHL, though more than 96% of data still falls within a factor of two of the 1:1 line.
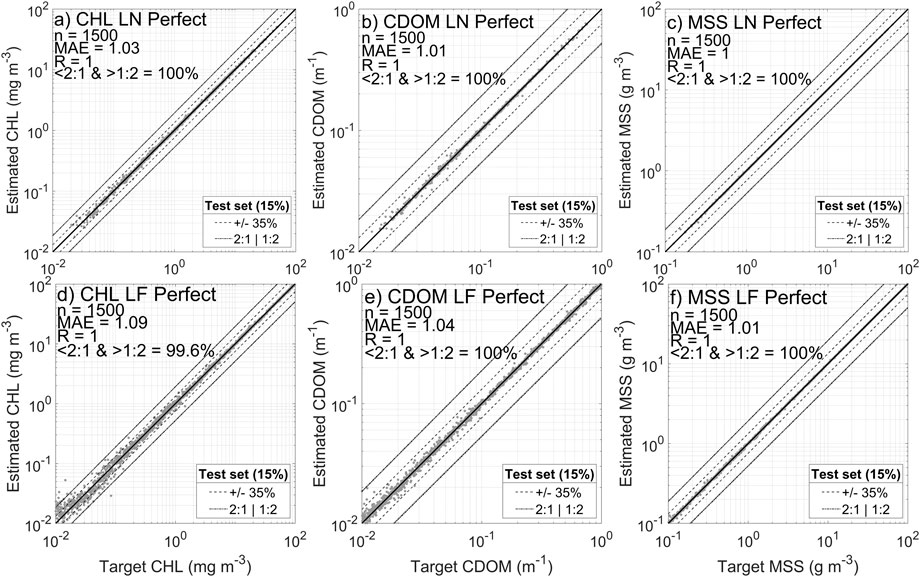
FIGURE 8. Neural network results obtained using a log normal (top row) or log flat (bottom row) distribution of data without addition of noise (raw model output) for: (A,D) CHL, (B,E) CDOM, and (C,F) MSS.
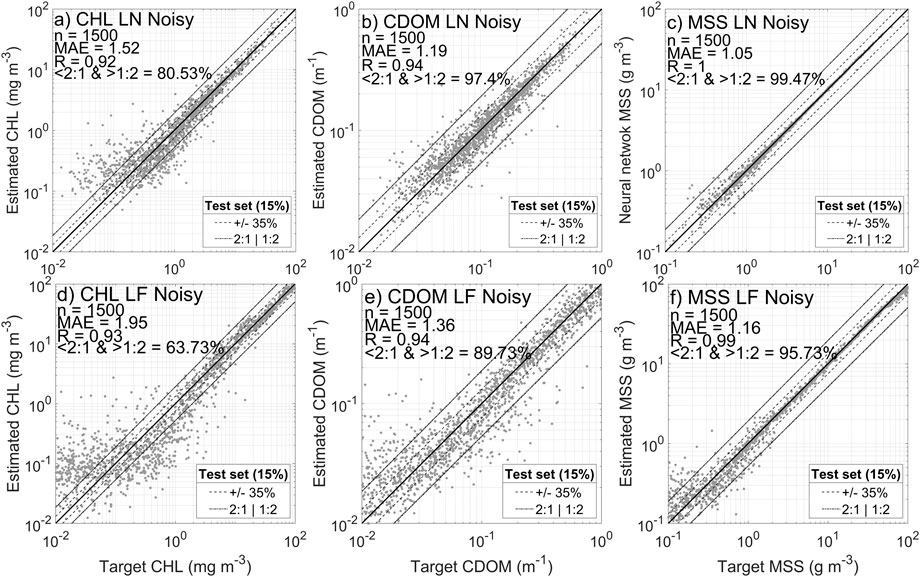
FIGURE 9. Neural network results obtained using a log normal (top row) or log flat (bottom row) distribution of data with addition of noise for: (A,D) CHL, (B,E) CDOM, and (C,F) MSS.
These results clearly demonstrate that NNs have the capacity to overcome the optical complexity of coastal waters with freely varying constituent concentration combinations. This is perhaps unsurprising in the case of noise-free data, but it is reassuring to see that inclusion of noise in the system does not irreparably impair performance. We can therefore conclude that hypothesis 1 (H1) is demonstrated to be correct as was previously observed in the literature with other datasets (Buckton et al., 1999; Schiller and Doerffer, 1994; Tanaka et al., 2004; Ioannou et al., 2013 for example). The NN developed for this hypothesis can reach close to perfect estimates due to the absence of noise and the controlled environment of Hydrolight similarly to results achieved by Schiller and Doerffer, 1999, with the difference being that low concentrations are slightly harder to estimate.
3.2 Impact of data distribution on NN performance (H2)
The results presented in section 3.1 were produced using the log-normal (LN) datasets where the distribution of data has been organized to broadly replicate datasets found in the literature. In this section we test the hypothesis (H2) that NN performance will improve if the training dataset is more evenly distributed to better capture extreme events at both high and low concentrations. First, when trained on their respective perfect datasets, the normal and flat distribution both produce good estimates (Figure 8), where panels d, e and f show NN performance using the log-flat (LF) data distribution. NN performance for the LF dataset is generally slightly worse than for the LN dataset, with MAEs increasing very slightly for CDOM and MSS, but more markedly for CHL (MAE = 1.11). It is noticeable the greatest deterioration in performance appears to be for low CHL values. This is slightly surprising as part of the interest in testing the LF distribution was specifically to address the question of less commonly occurring scenarios at the extremes of the concentration ranges. It may be the case that although the LF training dataset has increased the proportion of low concentration training data, there is an intrinsic problem in trying to estimate very low concentrations of CHL in the presence of potentially high concentrations of other constituents. This could simply be attributable to the CHL making an insignificant contribution to the optical signals under these circumstances.
Figure 9 (d, e and f) shows the impact of incorporating noise into the LF NNs. As found previously with the LN dataset, introduction of realistic measurement uncertainties negatively impacts NN performance for all three constituents, with CHL more strongly affected than CDOM and MSS. In the latter cases although MAEs increase to 1.13 and 1.2, approximately 99% of points still fall within a factor of 2 of the 1:1 line. In contrast, performance of the CHL NN deteriorates significantly with a MAE of 1.49 and the fraction of points falling within a factor of 2 of the 1:1 line dropping to 83%. CHL performance is again most notably affected for low concentrations where it would appear that introduction of measurement uncertainties has made it even harder to resolve the small contribution of CHL to the optical signals. This level of CHL retrieval is close to the levels found with real in situ observations (Hadjal et al., 2022; Pahlevan et al., 2022). Retrieval of CDOM and MSS is fairly robust under all of the circumstances tested here. This is unsurprising in the case of MSS which has previously been robustly determined using even single red wavebands (Nechad et al., 2010; Neil et al., 2011).
The idea behind the creation of a LF NN is to evaluate if it can outperform a LN NN at estimating data where it is problematic, near the edges of distributions where the amount of training data is limited. To further evaluate this hypothesis, we apply a cross validation test, where the LN NN is applied to the flat dataset, and the LF NN is applied to the normal dataset. For this specific test, the input data were normalised using the entire dataset to avoid obvious normalisation bias during the training session which would lead to failure in both cases. The results are displayed in Figure 10. Panels a to c present the results from the application of the LN NN to the flat dataset, while panels d to f present the results from application of the LF NN to the normal dataset. Both NN return poorer performances on the opposite dataset compared to the original NN. The LN NN (Figures 10A–C) shows reduced MAE net performances for all constituents. Similarly, the LF NN (Figures 10D–F) shows net reduced MAEs of for CHL but very close to what the LN NN produce for CDOM and MSS. The LF NN performs better on a flat distribution (Figure 9) and is much less impacted than a LN NN. This is mostly due to the training session that included more extreme values, easier to predict than a NN that did not have access to it previously.
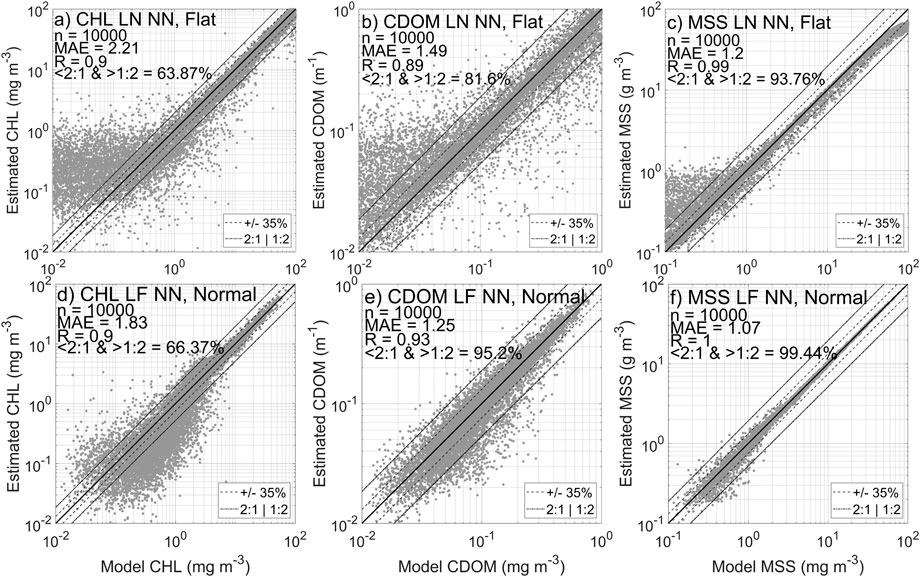
FIGURE 10. (A–C) Neural network results obtained for each constituent estimates by applying the log normal neural network (LN NN) algorithm trained in Figure 9 to the log flat distributed dataset (top row). (D–F) Log flat neural network applied to the log normally distributed dataset.
The results presented in Figure 8, Figure 9 and Figure 10 refute the hypothesis (H2) that a more evenly distributed dataset will tend to improve NN performance. It seems that the NN trained with a LF distributed dataset is more resilient and produce better results at both edges of the dataset, yet performances are still lower than a NN trained with this specific type of distribution. Nonetheless, across the full range of variability of the three constituents there is no evidence to suggest that the LF dataset is producing superior performance. Thus it seems unlikely that either subsampling existing datasets to artificially produce log-flat distributions or targeting sampling effort to achieve it in future will lead to any improvement in performance.
3.3 Multitask learning: Simultaneous estimation of CHL, CDOM and MSS (H3)
Multitask learning (MTL) is a type of machine learning method (Caruana, 1997) that tries to improve neural networks generalization capabilities performance by compelling networks to learn how to estimate multiple, potentially correlated variables simultaneously. There are multiple reports of successful applications from different fields in the literature (Collobert and Weston, 2008; Deng et al., 2013; Girshick, 2015; Ramsundar et al., 2015). In order to test the potential benefits of MTL one needs to have access to a set of data containing both the reflectance signals and all three optically significant constituent concentrations. Additionally the dataset needs to be sufficiently large and representative to be suitable for NN training. Unfortunately there are relatively few publicly available in situ datasets where all of these parameters are simultaneously recorded. Here, because we use modelled datasets based on user-defined ranges of constituent concentrations and a complete set of SIOPs, we have sufficient flexibility to produce a dataset that can be used to test the hypothesis that MTL will improve determination of constituent concentrations using NNs (H3).
The NNs developed in this section estimate all three constituent concentrations (CHL, CDOM and MSS) simultaneously in the output layer as shown in Figure 6; Figure 11 displays the performance reached for each variable for both the LN and LF distributions, with noise included in both cases. MTL performance levels are broadly comparable with single parameter retrievals (Figure 9) in all cases. There is no evidence to suggest that MTL has improved retrieval of any of the constituents and in the case of CDOM there is even some degradation in performance compared to single parameter retrieval. Whilst we cannot rule out the possibility that MTL may have benefits if used with more complex NN architectures or with real world data, at this point we can only draw the conclusion that there is currently no evidence to support the hypothesis (H3) that MTL will improve NN retrieval of CHL, CDOM and MSS.
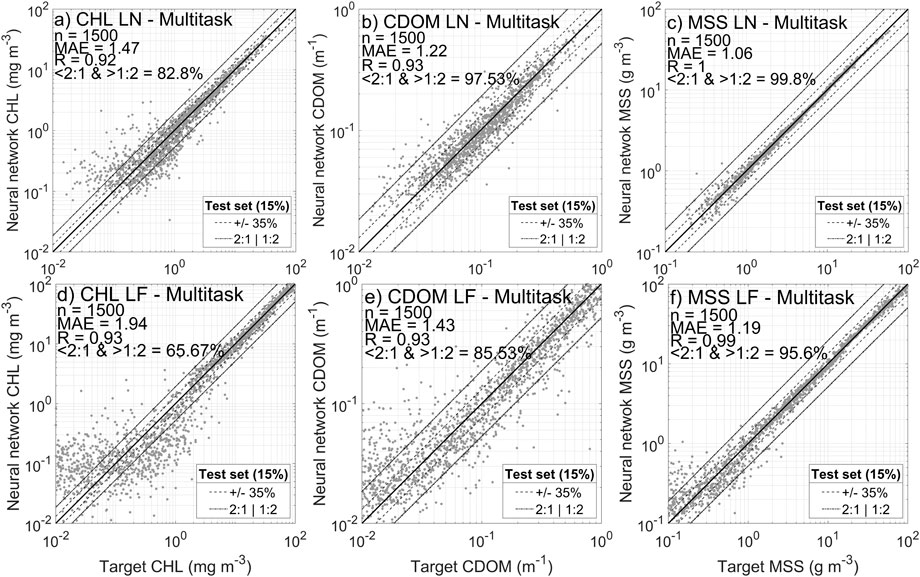
FIGURE 11. Results obtained for estimating CHL, CDOM and MSS at the same time using a neural network (3 layers of 13 neurons each) and using the 13 MODIS Aqua bands as inputs for (A–C) log normal and (D–F) log flat distributions.
3.4 Comparison of hyperspectral vs. multispectral NN performance (H4)
The final experiment presented in this study concerns evaluation of the potential for hyperspectral reflectance data to significantly improve the performance of NNs over existing multispectral capabilities (H4). The work presented in previous sections was conducted using 13 wavebands that were selected to mimic MODIS signals. The Ecolight simulations produced a total of 102 wavebands. Using all available wavebands would be computationally expensive and there is good reason to believe that such an approach would be superfluous due to information redundancy between adjacent bands. Instead we systematically explore the impact of increasing the number of bands available for the network. In order to be methodical, bands were selected using even spacing. For example, when two bands were used, bands 33 and 66 (550 and 715 nm respectively) were selected among the 102 available. When three bands were used, bands 25, 50 and 75 were selected. This approach does not attempt to optimize performance by selecting the best performing bands for each subset, but rather treats the data in a systematic manner operating on an assumption that each band has similar information value. Here between 1 and 20 wavebands were selected and resulting NNs were tested for both the LN and LF datasets, with noise included in all cases. Each NN is composed of three layers with the number of neurons per layer being equal to the number of wavebands used, and separate NNs being developed for each constituent (no MTL).
Figure 12 shows the MAE obtained for 10 neural networks trained with 1–20 bands evenly spaced from the full hyperspectral signal. To improve consistency for each band combination, an ensemble approach was used (Hadjal et al., 2022). The ensemble consists of 10 neural networks that were created for each band combination. The output of each set of 10 networks is averaged (median value for each estimates based on the 10 values available). The 10 networks of each architecture are all independent and trained with a different initial randomization and different training datasets. The results are shown for the entire dataset, not the test set only as it was conducted for previous figures. The light grey area that englobes the dashed or solid lines represent the median ± 1 standard deviation (std) of the 10 networks for each band combination. There is an obviously higher std when small numbers of bands are used due to the potential increased presence of failure to reach convergence during the NN training. It does not affect the median, which is why it was selected over the mean. The MODIS Aqua examples are shown as an horizontal line ± 1 std.

FIGURE 12. Modelled absolute retrieval errors for (A) CHL, (B) CDOM, and (C) MSS for varying numbers of wavebands and different data distribution structures (log normal and log flat). Plain and dashed line: median of mean absolute error obtained for 10 neural networks using the specified number of bands used to create an evenly-spaced algorithm. Grey areas represent the median ± standard deviation. The green and red crosses represent performance obtained for the 13 band MODIS Aqua NN shown in Figure 8 along with associated standard deviations.
As expected, there is a clear improvement of NN performance with increasing waveband availability and increased dimensions of the networks. Improvements are most significant for small numbers of wavebands and then in most cases a region of much slower improvement is reached once approximately 7–10 bands are used. In all cases the MODIS Aqua NNs outperform evenly-spaced algorithms with equivalent spectral regions suggesting that careful selection of specific wavebands may be slightly beneficial compared to evenly spaced wavebands. Further testing of 25–50 evenly spaced wavebands (not shown) provided little further improvement in NN performance (MAE is 5% lower). The same test using 61 hyperspectral bands (the real number of information carried by the 13 MODIS Aqua-like bands) returned similar performances as the MODIS Aqua NN (MAE of 1.5) but took more computational time to train (up to 10 times longer). To separate the H4 performance changes attributed to the number of input bands from increasing dimension of the networks, the aforementioned band combinations were also tested on a fixed network architecture. Reproducing the method with a fixed size NN (3 layers of 13 neurons) for each number of band combination rather than using the number of inputs as the number of neurons per layer also returned broadly the same performances, with the main difference being slightly better estimates when one to 5 bands are used due to higher number of neurons available, which can lead to overfitting issues. These results generally refute the hypothesis (H4) that ever greater spectral resolution will improve retrieval of CHL, CDOM and MSS in optically complex coastal waters. This may reflect the fact that the optical properties of the water constituents vary slowly with wavelength and associated reflectance spectra offer only limited spectral information content. There are still good motivations for access to further resolved spectral resolution in future, which may help deal with pigment specific algae. While we cannot demonstrate it due to the absence of real data, there is also scope for improving performances for light signals contaminated by other sources such as glint, haze, land adjacency effects, etc. due to their impact over different parts of the light spectrum hyperspectral sensors will have access to.
Table 2 summarises the different metrics obtained for each test. The percentage of data between the 1:2 and 2:1 line was not processed for the hyperspectral experiments.
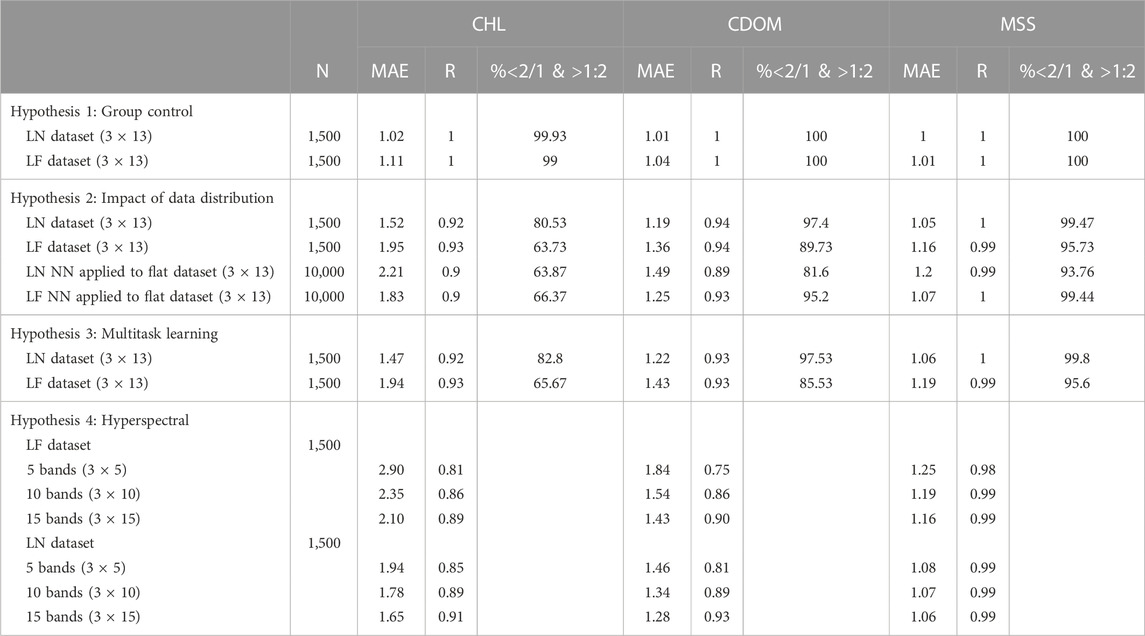
TABLE 2. Statistical performances of the different experiments. The size of the neural network architecture used is displayed (3 × 13 means three layers of 13 neurons each).
4 Discussion
The potential for NNs to provide improved quality ocean colour products for optically complex coastal waters has been demonstrated for many years (Buckton et al. (1999); Doerffer and Schiller, 1994; Buckton et al. (1999); Gross et al., 1999). The advent of hyperspectral ocean colour sensors with genuine global spatio-temporal capabilities and the availability of affordable computational resources provides growing impetus to further explore this potential. However limited data availability for training and testing NNs is a serious impediment to development of this approach. Here we have developed realistic radiative transfer simulations in order to generate training datasets that span the range of constituent concentrations needed to test NN performance across the range of variability encountered in coastal waters. This modelling approach has allowed us to test a number of fundamental hypotheses relating to development of NN algorithms for coastal ocean colour applications. Of course it should be noted that our bio-optical model is restricted through selection of SIOPs generated from a single region and does not include variability associated with optically distinct algal functional types.
When applied to the simulated data used in this study, neural networks have shown capacity to accurately retrieve CHL, CDOM and MSS when all three constituents are free to vary independently from one another over concentration ranges spanning several orders of magnitude (H1). NN performance is affected by inclusion of realistic measurement uncertainties, but the fundamental conclusion remains the same that relatively small NN architectures are capable of handling the levels of optical complexity encountered in coastal and shelf seas. These results are broadly consistent with recently presented research by Pahlevan et al. (2022) who have demonstrated ability to retrieve all three constituents using Mixture Density Networks. The simulated datasets presented here could usefully be used to test approaches of this nature and other machine learning algorithms. Whilst NN return almost perfect results with noise-free simulations, their performance appears to be strongly linked to the uncertainty in the in situ training data. With 20% (StdDev) noise added to both CHL and MSS but not to the light signal (not shown), MAEs close to 1.2 were reached. With application of noise to both constituents and Rrs signals (Figure 9) the MAE achieved reach 1.5 for CHL retrievals with the MODIS Aqua like NN, which shows over and under estimates at low concentrations. Whilst the error on the light signal impacts the constituents retrieval in the same way, the noise addition to CDOM measurements consists of a net value, which may explain why the estimates are closer to the model value (MAE of 1.2 on average). The performance of NN estimates is directly linked with in situ constituents data quality and is probably the main limiting factor here. Except for the low values of CHL, CDOM and MSS, NN have shown the capacity to make excellent estimates of the constituents.
Various strategies to improve NN performance have been developed over a wide number of research fields. One of the more commonly discussed approaches is multitask learning (MTL) which is immediately of interest in ocean colour remote sensing in coastal waters as the reflectance signals is inherently dependent on more than one optical constituent. The ability to determine constituent concentration ranges used in radiative transfer simulations provides an opportunity to systematically test the potential merit of MTL. In this case we have clear evidence that simultaneous retrieval of all three optical constituents does not improve upon single parameter retrievals and in fact may slightly reduce overall performance (H2, Figure 11). For a pure performance approach, MTL should not be considered, at least with simulated data. However, MTL is also being used to help generalisation of neural networks in other fields, but this hypothesis was not testable here because we rely on simulated coastal data.
One of the most common perceptions of NNs (and other machine learning approaches) is supposed limitation to the training dataset provided. Whilst there is indeed an element of truth to this, it should also be recognized that if a training dataset is genuinely representative of prevailing circumstances then there is good scope for a NN to be able to provide general predictive power for that system. Many of the criticisms based on training set limitations are similarly true for empirical and semi-analytical algorithms. In all cases datasets for algorithm development are subject to the vagaries of in situ sampling effort and impact of cloud cover on matchup realization. The NN approach discussed in this paper was first developed using an in situ dataset to predict CHL (Hadjal et al., 2022). One of the concerns identified in that work was the log-normal nature of the data distribution in the assembled training dataset, with concern that both high and low concentration scenarios were under-represented. The simulation approach developed here has allowed us to compare results from datasets with both log-normal and log-flat constituent distributions. Somewhat surprisingly, there does not appear to be any benefit to having a more evenly spaced training dataset and in fact the performance of CHL retrieval was of lower quality for the flat dataset at low concentrations. It seems likely that there is a fundamental limit on accurate retrieval of any constituent when its contribution to the reflectance signal becomes sufficiently insignificant. There is naturally interest in trying to retrieve CHL concentrations at very low concentrations such as are found in oligotrophic offshore waters (Signorini et al., 2015). However, in the case of optically complex coastal water it may be much more difficult or even impossible to achieve the same level of CHL retrieval at low concentrations due to the confounding influence of CDOM and MSS which would typically either be absent or found at very low concentrations in case 1 waters. That said, these results are helpful in so much as they illustrate that the normal distributions, which are similar to those generally obtained from large field campaigns, are capable of producing high quality results across the full range of concentrations for each constituent, and there is no obvious merit in trying to further manipulate them to manage over- or under-representation across the dataset.
Development of the hyperspectral PACE mission has brought renewed interest in establishing the potential for hyperspectral remote sensing to improve the quality of ocean colour products for optically complex coastal waters. This is particularly relevant for NNs and other data-hungry machine learning approaches that have potential to exploit additional information content to improve product quality. Here we have tested the hypothesis that NNs trained on simulated hyperspectral reflectance data will produce better quality estimates of CHL, CDOM and MSS than is possible with multispectral data (H4). Results presented in Figure 11 suggest that there is in fact a practical limit to NN performance and that there is little further improvement in algorithm performance with higher numbers of wavebands. For this modelled dataset, the NNs do not produce better results as soon as the visible and NIR signal has been split into approximately 10 evenly spaced regions. It should be noted that these results were obtained using evenly spaced hyperspectral wavebands and that there is clearly scope for further optimization by careful selection of specific combinations of wavebands which is an option with hyperspectral data. Indeed, in all cases NNs operating on the MODIS Aqua waveband set outperformed evenly spaced hyperspectral data, illustrating the potential benefit of carefully selected waveband subsets. Nonetheless, these results strongly suggest that simply increasing spectral resolution will not of itself improve determination of CHL, CDOM and MSS in coastal waters. However, there may be many other benefits to use of hyperspectral data such as identification of specific spectral features associated with e.g. cyanobacterial blooms. The main improvement from a remote sensing point of view could in fact come from the capacity of these neural network algorithms to deal with natural sources of signal contamination (e.g. sun glint, thin clouds, etc.). The NN method recently developed by Hadjal et al. (2022) using TOA signals to retrieve CHL directly could benefit from inclusion of additional bands providing information on sources of signal disruption. For good quality Rrs data, expectations for significant improvement in product quality across the board would be misplaced. Additional factors such as signal to noise ratio, atmospheric correction performance and quality of spatio-temporal matching will significantly impact product performance as well.
Data availability Statement
The original contributions presented in the study are publicly available. This data can be found here: https://doi.org/10.15129/8d279184-3e7d-4d29-9a75-c6b52948937b.
Author contributions
All authors were responsible for developing the methodology, visualisation and formal analysis.
Funding
This work was supported by an UKRI Natural Environment Research Council award (NE/S003517/1) to DM and by award of a joint MASTS/Datalab PhD studentship to MH.
Acknowledgments
We are grateful to Marilisa Lo Prejato for providing IOP datasets and Dr Ina Kostakis for providing Matlab scripts to process Hydrolight data.
Conflict of interest
The authors declare that the research was conducted in the absence of any commercial or financial relationships that could be construed as a potential conflict of interest.
Publisher’s note
All claims expressed in this article are solely those of the authors and do not necessarily represent those of their affiliated organizations, or those of the publisher, the editors and the reviewers. Any product that may be evaluated in this article, or claim that may be made by its manufacturer, is not guaranteed or endorsed by the publisher.
References
Babin, M., Stramski, D., Ferrari, G. M., Claustre, H., Bricaud, A., Obolensky, G., et al. (2003). Variations in the light absorption coefficients of phytoplankton, nonalgal particles, and dissolved organic matter in coastal waters around Europe. J. Geophys. Res. Oceans 108 (C7), 3211. doi:10.1029/2001jc000882
Bengil, F., McKee, D., Beşiktepe, S. T., Calzado, V. S., and Trees, C. (2016). A bio-optical model for integration into ecosystem models for the Ligurian Sea. Prog. Oceanogr. 149, 1–15. doi:10.1016/j.pocean.2016.10.007
Bricaud, A., Morel, A., and Prieur, L. (1981). Absorption by dissolved organic matter of the sea (yellow substance) in the UV and visible domains. Limnol. Oceanogr. 26 (1), 43–53. doi:10.4319/lo.1981.26.1.0043
Brockmann, C., Doerffer, R., Peters, M., Stelzer, K., Embacher, S., and Ruescas, A. (2016). “Evolution of the C2RCC neural network for sentinel 2 and 3 for the retrieval of ocean colour products in normal and extreme optically complex waters,” in Proc. ‘Living Planet Symposium 2016’, Prague, Czech Republic, 9–13 May, 2016 (ESA SP-740, August 2016).
Buckton, D., O'mongain, E. O. N., and Danaher, S. (1999). The use of neural networks for the estimation of oceanic constituents based on the MERIS instrument. Int. J. Remote Sens. 20 (9), 1841–1851. doi:10.1080/014311699212515
Cao, Z., Ma, R., Pahlevan, N., Liu, M., Melack, J. M., Duan, H., et al. (2022). Evaluating and optimizing VIIRS retrievals of chlorophyll-a and suspended particulate matter in turbid lakes using a machine learning approach. IEEE Trans. Geoscience Remote Sens. 60, 1–17. doi:10.1109/tgrs.2022.3220529
Claustre, H., Hooker, S. B., Van Heukelem, L., Berthon, J. F., Barlow, R., Ras, J., et al. (2004). An intercomparison of HPLC phytoplankton pigment methods using in situ samples: Application to remote sensing and database activities. Mar. Chem. 85 (1-2), 41–61. doi:10.1016/j.marchem.2003.09.002
Collobert, R., and Weston, J. (2008). “A unified architecture for natural language processing: Deep neural networks with multitask learning,” in Proceedings of the 25th international conference on Machine learning (USA: ACM).
Corson, M. R., Korwan, D. R., Lucke, R. L., Snyder, W. A., and Davis, C. O. (2008). “The hyperspectral imager for the coastal ocean (HICO) on the international space station,” in IGARSS 2008-2008 IEEE International Geoscience and Remote Sensing Symposium, Boston, MA, USA, 07-11 July 2008 (IEEE), IV–101.
D'Alimonte, D., and Zibordi, G. (2003). Phytoplankton determination in an optically complex coastal region using a multilayer perceptron neural network. IEEE Trans. Geoscience Remote Sens. 41 (12), 2861–2868. doi:10.1109/tgrs.2003.817682
Dall’Olmo, G., Brewin, R. J., Nencioli, F., Organelli, E., Lefering, I., McKee, D., et al. (2017). Determination of the absorption coefficient of chromophoric dissolved organic matter from underway spectrophotometry. Opt. Express 25 (24), A1079–A1095. doi:10.1364/oe.25.0a1079
Darecki, M., and Stramski, D. (2004). An evaluation of MODIS and SeaWiFS bio-optical algorithms in the Baltic Sea. Remote Sens. Environ. 89 (3), 326–350. doi:10.1016/j.rse.2003.10.012
Deng, L., Hinton, G., and Kingsbury, B. (2013). “New types of deep neural network learning for speech recognition and related applications: An overview,” in 2013 IEEE international conference on acoustics, speech and signal processing, Vancouver, BC, Canada, 26-31 May 2013 (IEEE), 8599–8603.
Doerffer, R., and Schiller, H. (1994). “Inverse modeling for retrieval of ocean color parameters in case II coastal waters: An analysis of the minimum error,” in Ocean Optics (SPIE), 887–893.
Dransfeld, S., Tatnall, A. R., Robinson, I. S., and Mobley, C. D. (2006). Neural network training: Using untransformed or log-transformed training data for the inversion of ocean colour spectra? Int. J. Remote Sens. 27 (10), 2011–2016. doi:10.1080/01431160500245658
Fan, Y., Li, W., Chen, N., Ahn, J.-H., Park, Y.-J., Kratzer, S., et al. (2021). OC-SMART: A machine learning based data analysis platform for satellite ocean color sensors. Remote Sens. Environ. 253, 112236. doi:10.1016/j.rse.2020.112236
Ferrari, G. M., and Tassan, S. (1999). A method using chemical oxidation to remove light absorption by phytoplankton pigments. J. Phycol. 35 (5), 1090–1098. doi:10.1046/j.1529-8817.1999.3551090.x
Girshick, R. (2015). “Fast r-cnn,” in Proceedings of the IEEE international conference on computer vision, Santiago, Chile, 07-13 December 2015 (IEEE), 1440–1448.
Gohin, F., Druon, J. N., and Lampert, L. (2002). A five channel chlorophyll concentration algorithm applied to SeaWiFS data processed by SeaDAS in coastal waters. Int. J. Remote Sens. 23 (8), 1639–1661. doi:10.1080/01431160110071879
Gorman, E. T., Kubalak, D. A., Patel, D., Mott, D. B., Meister, G., and Werdell, P. J. (2019). “The NASA Plankton, Aerosol, cloud, ocean Ecosystem (PACE) mission: An emerging era of global, hyperspectral earth system remote sensing,” in Proc. SPIE 11151, sensors, systems, and next-generation satellites XXIII, 111510G (10 October 2019). doi:10.1117/12.2537146
Gross, L., Thiria, S., and Frouin, R. (1999). Applying artificial neural network methodology to ocean color remote sensing. Ecol. Model. 120 (2-3), 237–246. doi:10.1016/s0304-3800(99)00105-2
Guanter, L., Kaufmann, H., Segl, K., Foerster, S., Rogass, C., Chabrillat, S., et al. (2015). The EnMAP spaceborne imaging spectroscopy mission for Earth observation. Remote Sens. 7 (7), 8830–8857. doi:10.3390/rs70708830
Hadjal, M., Medina-Lopez, E., Ren, J., Gallego, A., and McKee, D. (2022). An artificial neural network algorithm to retrieve chlorophyll a for northwest European shelf seas from top of atmosphere Ocean Colour reflectance. Remote Sens. 14 (14), 3353. doi:10.3390/rs14143353
Hieronymi, M., Müller, D., and Doerffer, R. (2017). The OLCI neural network swarm (ONNS): A bio-geo-optical algorithm for open ocean and coastal waters. Front. Mar. Sci. 4, 140. doi:10.3389/fmars.2017.00140
Ibrahim, A., Franz, B., Ahmad, Z., Healy, R., Knobelspiesse, K., Gao, B. C., et al. (2018). Atmospheric correction for hyperspectral ocean color retrieval with application to the Hyperspectral Imager for the Coastal Ocean (HICO). Remote Sens. Environ. 204, 60–75. doi:10.1016/j.rse.2017.10.041
Ioannou, I., Gilerson, A., Gross, B., Moshary, F., and Ahmed, S. (2013). Deriving ocean color products using neural networks. Remote Sens. Environ. 134, 78–91. doi:10.1016/j.rse.2013.02.015
Iwasaki, A., Ohgi, N., Tanii, J., Kawashima, T., and Inada, H. (2011). “Hyperspectral Imager Suite (HISUI)-Japanese hyper-multi spectral radiometer,” in 2011 IEEE International Geoscience and Remote Sensing Symposium, Vancouver, BC, Canada, 24-29 July 2011 (IEEE), 1025–1028.
Jamet, C., Loisel, H., and Dessailly, D. (2012). Retrieval of the spectral diffuse attenuation coefficientKd(λ) in open and coastal ocean waters using a neural network inversion. J. Geophys. Res. Oceans 117 (C10), 8076. doi:10.1029/2012jc008076
Jamet, C., Thiria, S., Moulin, C., and Crepon, M. (2005). Use of a neurovariational inversion for retrieving oceanic and atmospheric constituents from ocean color imagery: A feasibility study. J. Atmos. Ocean. Technol. 22, 460–475. doi:10.1175/jtech1688.1
Lavigne, H., Van der Zande, D., Ruddick, K., Dos Santos, J. C., Gohin, F., Brotas, V., et al. (2021). Quality-control tests for OC4, OC5 and NIR-red satellite chlorophyll-a algorithms applied to coastal waters. Remote Sens. Environ. 255, 112237. doi:10.1016/j.rse.2020.112237
Lefering, I., Bengil, F., Trees, C., Röttgers, R., Bowers, D., Nimmo-Smith, A., et al. (2016). Optical closure in marine waters from in situ inherent optical property measurements. Opt. Express 24 (13), 14036–14052. doi:10.1364/oe.24.014036
Lo Prejato, M., McKee, D., and Mitchell, C. (2020). Inherent optical properties-reflectance relationships revisited. J. Geophys. Res. Oceans 125 (11), e2020JC016661. doi:10.1029/2020JC016661
Loizzo, R., Guarini, R., Longo, F., Scopa, T., Formaro, R., Facchinetti, C., et al. (2018). “Prisma: The Italian hyperspectral mission,” in IGARSS 2018-2018 IEEE International Geoscience and Remote Sensing Symposium, Valencia, Spain, 22-27 July 2018 (IEEE), 175–178.
McCulloch, W. S., and Pitts, W. (1943). A logical calculus of the ideas immanent in nervous activity. Bull. Math. Biophysics 5 (4), 115–133. doi:10.1007/bf02478259
McKee, D., Röttgers, R., Neukermans, G., Calzado, V. S., Trees, C., Ampolo-Rella, M., et al. (2014). Impact of measurement uncertainties on determination of chlorophyll-specific absorption coefficient for marine phytoplankton. J. Geophys. Res. Oceans 119 (12), 9013–9025. doi:10.1002/2014jc009909
Mélin, F., Sclep, G., Jackson, T., and Sathyendranath, S. (2016). Uncertainty estimates of remote sensing reflectance derived from comparison of ocean color satellite data sets. Remote Sens. Environ. 177, 107–124. doi:10.1016/j.rse.2016.02.014
Morel, A., and Prieur, L. (1977). Analysis of variations in ocean color 1. Limnol. Oceanogr. 22 (4), 709–722. doi:10.4319/lo.1977.22.4.0709
Nechad, B., Ruddick, K. G., and Park, Y. (2010). Calibration and validation of a generic multisensor algorithm for mapping of total suspended matter in turbid waters. Remote Sens. Environ. 114 (4), 854–866. doi:10.1016/j.rse.2009.11.022
Neil, C., Cunningham, A., and McKee, D. (2011). Relationships between suspended mineral concentrations and red-waveband reflectances in moderately turbid shelf seas. Remote Sens. Environ. 115 (12), 3719–3730. doi:10.1016/j.rse.2011.09.010
O'Reilly, J. E., Maritorena, S., Mitchell, B. G., Siegel, D. A., Carder, K. L., Garver, S. A., et al. (1998). Ocean color chlorophyll algorithms for SeaWiFS. J. Geophys. Res. Oceans 103 (C11), 24937–24953. doi:10.1029/98jc02160
Pahlevan, N., Smith, B., Alikas, K., Anstee, J., Barbosa, C., Binding, C., et al. (2022). Simultaneous retrieval of selected optical water quality indicators from Landsat-8, Sentinel-2, and Sentinel-3. Remote Sens. Environ. 270, 112860. doi:10.1016/j.rse.2021.112860
Pahlevan, N., Smith, B., Schalles, J., Binding, C., Cao, Z., Ma, R., et al. (2020). Seamless retrievals of chlorophyll-a from sentinel-2 (msi) and sentinel-3 (olci) in inland and coastal waters: A machine-learning approach. Remote Sens. Environ. 240, 111604. doi:10.1016/j.rse.2019.111604
Pitarch, J., Volpe, G., Colella, S., Krasemann, H., and Santoleri, R. (2016). Remote sensing of chlorophyll in the Baltic Sea at basin scale from 1997 to 2012 using merged multi-sensor data. Ocean Sci. 12 (2), 379–389. doi:10.5194/os-12-379-2016
Ramsundar, B., Kearnes, S., Riley, P., Webster, D., Konerding, D., and Pande, V. (2015). Massively multitask networks for drug discovery. arXiv preprint arXiv:1502.02072.
Rosenblatt, F. (1958). The perceptron: A probabilistic model for information storage and organization in the brain. Psychol. Rev. 65 (6), 386–408. doi:10.1037/h0042519
Röttgers, R., and Doerffer, R. (2007). Measurements of optical absorption by chromophoric dissolved organic matter using a point-source integrating-cavity absorption meter. Limnol. Oceanogr. Methods 5 (5), 126–135. doi:10.4319/lom.2007.5.126
Röttgers, R., Schönfeld, W., Kipp, P. R., and Doerffer, R. (2005). Practical test of a point-source integrating cavity absorption meter: The performance of different collector assemblies. Appl. Opt. 44 (26), 5549–5560. doi:10.1364/ao.44.005549
Ruder, S. (2017). An overview of multi-task learning in deep neural networks. arXiv preprint arXiv:1706.05098.
Rumelhart, D. E., Hinton, G. E., and McClelland, J. L. (1986). A general framework for parallel distributed processing. Parallel distributed Process. Explor. Microstruct. Cognition 1 (45-76), 26.
Rumelhart, D. E., Hinton, G. E., and Williams, R. J. (1985). “Learning internal representations by error propagation,” in California univ san diego La jolla inst for cognitive science (Cambridge, MA, United States: MIT Press).
Schiller, H., and Doerffer, R. (1999). Neural network for emulation of an inverse model operational derivation of Case II water properties from MERIS data. Int. J. Remote Sens. 20 (9), 1735–1746. doi:10.1080/014311699212443
Schiller, H., and Doerffer, R. (1994). “Neuronal network for simulation of an inverse model,” in Talk given at the Bio-optics Meeting of the SeaWiFS Science Team (IEEE).
Schiller, K. (2006). Derivation of photosynthetically available radiation from METEOSAT data in the German bight with neural nets. Ocean Dyn. 56, 79–85. doi:10.1007/s10236-006-0058-1
Schroeder, T., Schaale, M., and Fischer, J. (2007). Retrieval of atmospheric and oceanic properties from MERIS measurements: A new case-2 water processor for beam. Int. J. Remote Sens. 28, 5627–5632. doi:10.1080/01431160701601774
Seegers, B. N., Stumpf, R. P., Schaeffer, B. A., Loftin, K. A., and Werdell, P. J. (2018). Performance metrics for the assessment of satellite data products: an Ocean color case study. Opt. Express 26 (6), 7404–7422. doi:10.1364/oe.26.007404
Signorini, S. R., Franz, B. A., and McClain, C. R. (2015). Chlorophyll variability in the oligotrophic gyres: Mechanisms, seasonality and trends. Front. Mar. Sci. 2, 1. doi:10.3389/fmars.2015.00001
Sørensen, K., Grung, M., and Röttgers, R. (2007). An intercomparison of in vitro chlorophyll a determinations for MERIS level 2 data validation. Int. J. Remote Sens. 28 (3-4), 537–554. doi:10.1080/01431160600815533
Tanaka, A., Kishino, M., Doerffer, R., Schiller, H., Oishi, T., and Kubota, T. (2004). Development of a neural network algorithm for retrieving concentrations of chlorophyll, suspended matter and yellow substance from radiance data of the ocean color and temperature scanner. J. Oceanogr. 60 (3), 519–530. doi:10.1023/b:joce.0000038345.99050.c0
Tilstone, G. H., Peters, S. W., van der Woerd, H. J., Eleveld, M. A., Ruddick, K., Schönfeld, W., et al. (2012). Variability in specific-absorption properties and their use in a semi-analytical ocean colour algorithm for MERIS in North Sea and Western English Channel Coastal Waters. Remote Sens. Environ. 118, 320–338. doi:10.1016/j.rse.2011.11.019
Xue, Y., Zhu, L., Zou, B., Wen, Y. M., Long, Y. H., and Zhou, S. L. (2021). Research on inversion mechanism of chlorophyll—A concentration in water bodies using a convolutional neural network model. Water 13 (5), 664. doi:10.3390/w13050664
Keywords: artificial neural network, ocean colour remote sensing, MODIS aqua, chlorophyll a, coastal waters, modelled light, hyperspectral
Citation: Hadjal M, Paterson R and McKee D (2023) Neural networks to retrieve in water constituents applied to radiative transfer models simulating coastal water conditions. Front. Remote Sens. 4:973944. doi: 10.3389/frsen.2023.973944
Received: 20 June 2022; Accepted: 23 January 2023;
Published: 16 February 2023.
Edited by:
Amir Ibrahim, Goddard Space Flight Center, National Aeronautics and Space Administration, United StatesReviewed by:
Thomas Schroeder, CSIRO Oceans and Atmosphere, AustraliaIan Carroll, Goddard Space Flight Center, United States
Copyright © 2023 Hadjal, Paterson and McKee. This is an open-access article distributed under the terms of the Creative Commons Attribution License (CC BY). The use, distribution or reproduction in other forums is permitted, provided the original author(s) and the copyright owner(s) are credited and that the original publication in this journal is cited, in accordance with accepted academic practice. No use, distribution or reproduction is permitted which does not comply with these terms.
*Correspondence: David McKee, RGF2aWQubWNrZWVAc3RyYXRoLmFjLnVr