 David Doxaran
 Boubaker ElKilani1
94% of researchers rate our articles as excellent or good
Learn more about the work of our research integrity team to safeguard the quality of each article we publish.
Find out more
ORIGINAL RESEARCH article
Front. Remote Sens., 08 February 2024
Sec. Multi- and Hyper-Spectral Imaging
Volume 4 - 2023 | https://doi.org/10.3389/frsen.2023.1290110
This article is part of the Research TopicOptical Radiometry and Satellite ValidationView all 22 articles
Since 2021, two autonomous HYPERNETS (A new hyperspectral radiometer integrated in automated networks of water and land bidirectional reflectance measurements for satellite validation) stations are operated in contrasted French coastal waters: one in the center of an optically complex coastal lagoon and one at the mouth of a highly turbid estuary. These stations perform predefined sequences of above-water hyperspectral radiometric measurements following a strict viewing geometry. The data recorded by the ®HYPSTAR radiometer is automatically transmitted to servers for quality-controls then computation of the water-leaving reflectance signal. Numerous matchups were identified with high (Sentinel2-MSI and Landsat8/9-OLI) and medium (Sentinel3-OLCI and Aqua-MODIS) spatial resolution satellite data and are analyzed to assess the performance of different atmospheric correction algorithms (Sen2Cor, ACOLITE, POLYMER, iCOR, C2RCC, GRS, BPAC, NIR-SWIR). Considering the specifications of each site (i.e., spatial and temporal variations of water optical properties), optimized matchup protocols are first established to guaranty high quality comparisons between satellite products and field measurements. The matchup results highlight the failure and limits of several atmospheric correction algorithms in complex/turbid coastal waters. The importance of accurate sun glint corrections in low to moderately-turbid waters (with the good performances of POLYMER, C2RCC and GRS processors, e.g., errors (MAPE) lower than 25% in the green spectral region) is also shown while the use of dark targets and spectral fitting to estimate the aerosol contributions is proved to be the most accurate method in the case of turbid waters (with Sen2Cor and ACOLITE errors (MAPE) lower than 20% in the visible and near-infrared spectral regions).
In coastal, nearshore and inland waters, many new applications have been developed using high quality medium to high spatial resolution satellite data notably provided by the Sentinel3 (S3) Ocean and Land Colour Instrument (OLCI), Sentinel2 (S2) MultiSpectral Instrument (MSI), and Landsat8&9 (L8&9) Operational Land Imager (OLI) sensors. These applications include the monitoring of water quality, sediment transport and dredging activities, aquaculture, detection of (harmful) algal blooms and pollutants from anthropogenic activities (e.g., Doxaran et al., 2009; Gernez et al., 2014; 2017; 2023; Vanhellemont and Ruddick, 2018; Katlane et al., 2020). This statement has been even reinforced with the distribution of hyperspectral (e.g., PRISMA, EnMap) and meter-scale spatial resolution (e.g., Pléiades, PlanetScope) satellite data (Vanhellemont and Ruddick, 2019; 2023; Luo et al., 2020; Pellegrino et al., 2023). Such satellite data is potentially very useful to complement field observations, as long as measurements carried out at the top of the atmosphere can be accurately corrected for complex atmospheric, adjacency and sun glint effects to retrieve the water-leaving reflectance signal (Rhow in the present study, equivalent to ρw, dimensionless, used in other studies (e.g., Goyens et al., 2022)). This multiple-correction step is crucial before deriving from Rhow other water optical and biogeochemical properties used for scientific and/or operational monitoring purposes.
Several recent studies assessed the performance of existing atmospheric correction processors used to retrieve Rhow from S2-MSI, L8-OLI and S3-OLCI satellite data in coastal and inland waters (e.g., Pahlevan et al., 2017a; 2017b; 2021; De Keukelaere et al., 2018; Ilori et al., 2019; Pereira-Sandoval et al., 2019; Warren et al., 2019; Soomets et al., 2020; Vanhellemont and Ruddick, 2021). These studies, based on matchups between satellite data and field radiometric measurements provided by the AERONET-OC network (Zibordi et al., 2009; 2020) or dedicated campaigns, revealed significant to high errors associated to satellite-derived Rhow values. These errors are usually around 30% in green and red spectral bands but increase (60% and over) towards short (blue) and near-infrared (NIR) wavebands due to, respectively, higher atmospheric contribution and low water-leaving signal (De Keukelaere et al., 2018; Ilori et al., 2019; Vanhellemont and Ruddick, 2021). Moreover, these studies did not identify any specific AC processor outperforming the others over the wide range of optically complex waters encountered in coastal and inland environments and most recommend a classification of optical water types before selecting the most appropriate atmospheric correction processor (Pereira-Sandoval et al., 2019; Soomets et al., 2020; Pahlevan et al., 2021).
The validation of Rhow values derived from satellite data therefore requires high-quality field radiometric measurements in various coastal, nearshore and inland water environments, at high temporal and radiometric resolutions, to multiply matchups with all satellite data covering all seasonal conditions. Only autonomous systems can satisfy such requirements. The AERONET-OC network is certainly the network of reference around the world; however, it only provides multi-spectral radiometric measurements at a minimum distance from the coast, which is quite limited in terms of current satellite wavebands and excludes nearshore and most inland waters. A new autonomous network has been recently designed to complement radiometric measurements provided by AERONET-OC stations: HYPERNETS1. As described by Goyens et al. (2022), the HYPERNETS system includes a new radiometer, the HYperspectral Pointable System for Terrestrial and Aquatic Radiometry (HYPSTAR)2 mounted on a pointable device. In several fixed locations around the world, this system already executes predefined sequences of above-water radiometric measurements during satellite overpasses. It allows multiplying matchups with satellite data to assess the performance of processing algorithms used to derive the water-leaving reflectance signal from top-of-atmosphere (TOA) measurements. Since 2021, two HYPERNETS stations are operated in France in contrasted nearshore waters: one at the center of an optically complex and dynamic Mediterranean coastal lagoon (Berre), and a second at the mouth of a highly turbid macrotidal estuary (the Gironde, Bay of Biscay).
The present study describes the radiometric measurements carried out aboard these two stations, the quality-control of the data so as the adaptation of existing matchup protocols in the case of dynamic nearshore waters. The resulting matchups are detailed and analyzed to document the respective performance of various atmospheric/glint/adjacency correction algorithms applied to medium (OLCI) and high (MSI, OLI) spatial resolution satellite data. Conclusions and perspectives are finally presented for a future autonomous validation network and improvements of satellite data processing algorithms.
The section first presents the HYPERNETS system and its implementation in the first two French sites. It then describes the considered satellite data and tested processing algorithms used to correct for atmospheric, glint and adjacency effects in order to retrieve the water-leaving reflectance signal. It finally explains how site-specific matchup protocols are established to compare satellite products and field radiometric measurements.
The HYPSTAR sensor has been developed in the frame of the H2020 HYPERNETS project and is part of the HYPERNETS network (Goyens et al., 2022). The model designed for water applications is the HYPSTAR-SR radiometer which takes radiance (field of view (FOV) = 2°) and irradiance (FOV = 180°) measurements from 380 to 1020 nm with a spectral sampling of 0.5 nm (i.e., Full Width Half Maximum is 3 nm).
As part of the HYPERNETS project, a system has also been developed to operate the HYPSTAR in autonomous mode and outdoor conditions. This system is mainly composed of a pan-tilt unit, to accurately point the radiometer towards specific directions, and a water-proof main box. This box contains an electronic card to switch ON/OFF the system, a rugged PC, a GPS antenna and a 3G card for data transmission. Ancillary sensors are used to measure humidity, temperature and pressure inside the main box. Deported sensors are used to detect rainfall and measure ambient light conditions. Two webcams, one pointing towards the system, the other towards the target/surrounding waters, are used for remote control and detection of potential presence of floating debris, animals or boats which could contaminate the radiometric measurements, respectively. The whole system is powered by a 12V battery connected to a solar panel for long-term autonomous operation. The hypernets_tools software3 is installed on the rugged PC to execute predefined measurement sequences when environmental conditions (e.g., enough light and no rain) are favorable and store recorded data. After the execution of each measurement sequence, the recorded data is also automatically transferred (3G) to a remote server for quality-controls and further processing (i.e., computation of the water-leaving reflectance signal) (see Goyens et al. (2022) for details). The 3G communication also allows to modify remotely the data acquisition procedure. At night the system is OFF to minimize power consumption with the HYPSTAR pointing to nadir. The system wakes up every morning to execute measurement sequences at predefined times, typically every 15 or 30 min.
When executing a “water standard” measurement sequence, the system first detects the Sun position to adopt a +/- 90° or +/- 135° azimuth angle. The sensor is then successively pointed towards the zenith to measure the downwelling irradiance, (Ed), then at zenith angles of 140° and 40° to measure respectively the sky (Ls) and upwelling (Lu) radiances. These viewing angles are the ones recommended by Mobley (1999) based on computations and by Ruddick et al. (2006) based on field measurements. The duration of this sequence varies from 2 to 3 min, depending on light conditions and contains 6 measurements of each parameter recorded in this order: 3 Ed, 3 Ls, 6 Lu, 3 Ls and 3 Ed spectra.
The data transferred to servers are processed using the HYPERNETS Processor4. The data quality controls and computation of the remote sensing reflectance signal (Rrs in sr−1) which is multiplied by π sr to obtain the water-leaving reflectance (Rhow, dimensionless) spectra are detailed in Goyens et al. (2022). Spectra are distributed to users as Rhow and Rhow_nosc values, i.e., with or without applying the NIR similarity correction (Ruddick et al., 2005), which was proved to be no longer valid in highly turbid waters (Doron et al., 2011). However, note that the quality checks are slightly different from one HYPERNETS site to another (and in some conditions from one application to another). Here, we have used quality checks that do not rely on the NIR similarity correction.
The first HYPERNETS station operated in France was implemented in February 2021 in the central part of the Berre lagoon (Figure 1). This coastal lagoon, located North-West of Marseille and connected to the Mediterranean Sea, is the second largest in Europe. With a mean depth of 6 m, it is highly influenced by the freshwater discharge of three small rivers and by the massive discharge of turbid freshwater from a power plant (Électricité de France). These natural and human-controlled river inputs regularly provide high loads of nutrients which enhance the primary production with regular intensive phytoplankton blooms at the end of the summer period. They also induce a strong density stratification of water masses which may generate anoxic crises when wind conditions do not guaranty an efficient mixing of the water column for long periods. The lagoon is also surrounded by many industrial zones which have contributed in the past to several pollution events with significant impacts on water quality affecting the pelagic and benthic ecosystems. In the central part of the Berre lagoon, concentrations of suspended particulate matter (SPM) and chlorophyll-a (Chla) typically vary from 0.1 to 10 g m-3 and from 0.1 to 5 mg m-3, within surface waters, with peaks of concentrations up to 100 g m-3 and 30 mg m-3, respectively, during exceptional phytoplankton bloom events (Elkilani 2020).
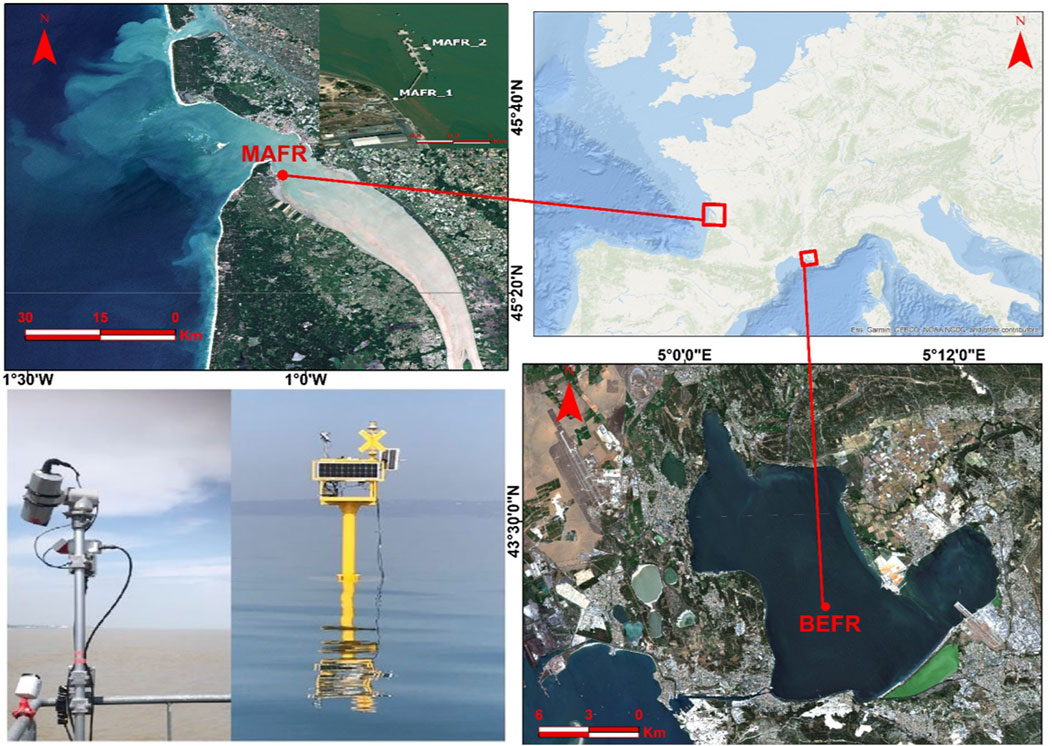
FIGURE 1. Locations of the two autonomous HYPERNETS stations operated in France since 2021: (i) at the mouth of the Gironde Estuary (South-West of France, Atlantic coast) (top left) and (ii) in the central part of the Berre coastal lagoon (South-East of France, Mediterranean Sea) (bottom right). Pictures of the HYPERNETS stations in the Gironde (turbid brown waters) and Berre lagoon (blue optically dynamic waters) (bottom left).
To prevent such events, the GIPREB company was created in20005 notably to monitor the water quality in different parts of the Berre lagoon, based on monthly field measurements and laboratory analyses of key parameters. The implementation of the HYPERNETS station in collaboration with GIPREB in this sensitive area was done with the objective to locally calibrate and validate ocean color satellite products (e.g., optical and biogeochemical parameters) for the monitoring of water quality in the lagoon. The HYPERNETS station was implemented on a fixed platform in the center of the lagoon to guaranty optically-deep waters (9 m depth) and minimize adjacency effects on satellite data (Figure 1). Since its implementation in February 2021, standard water sequence measurements have been executed every 30 min during day time. Note that several minor technical problems occurred with this version 1 of the HYPERNETS system; these issues were rapidly fixed to provide the acquisition of good quality measurements more than 90% of the operation phase.
On a cloud-free day in Berre (e.g., in July 2021, see Figure 2), illumination conditions are very stable so that the 6 Ed spectra recorded during a water standard measurement sequence are almost superimposed. The measured Ls (6 spectra) also show almost negligible variations. During calm wind conditions, the Lu is also expected to be quite stable as the water surface is plane and the water mass is usually homogeneous in the central part of the lagoon. In such conditions, the spectra easily pass the following quality controls, i.e., temporal variability in Ed, Ls and Lu is low with differences between consecutive scans at 550 nm not exceeding 25%, and the resulting Rhow spectra can be computed (Figure 1). Note than applying the near-infrared similarity correction is useful to minimize imperfect correction of skylight reflection effects on Lu. The resulting Rhow spectra are typical of moderately turbid waters, with also a significant decrease around 675 nm indicating the presence of phytoplankton pigments (Gernez et al., 2017; 2023).
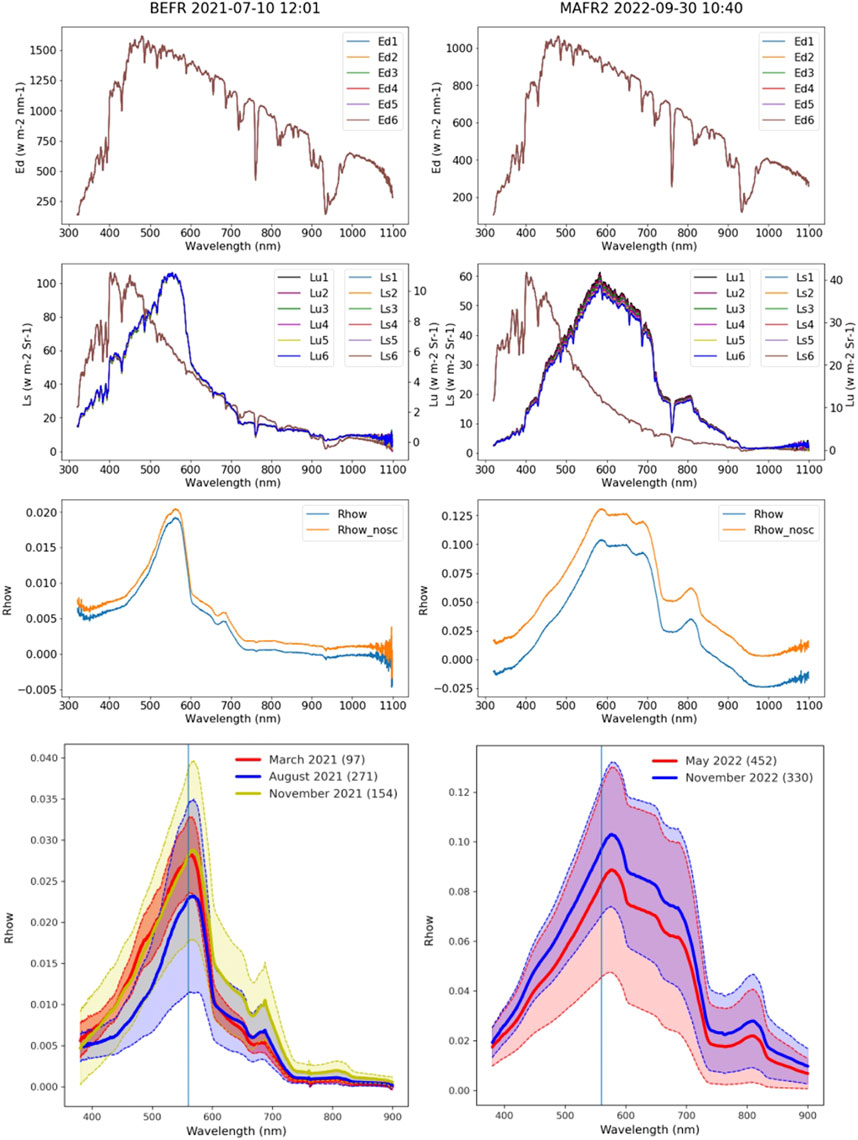
FIGURE 2. Processing and quality controls applied to above-water HYPERNETS radiometric measurements (downwelling irradiance (Ed), upwelling (Lu) and sky (Ls) radiances) used to compute the water-leaving reflectance after applying or not the NIR similarity correction (Rhow and Rhow_nosc, respectively, see the text for details). Typical measurement sequences recorded at the Berre [BEFR, (A)] and Gironde [MAFR2, (B)] stations. Bottom left: plain lines are the averaged reflectance spectra measured during March (97 spectra), August (271 spectra) and November (154 spectra) 2021 at the BEFR station with the shaded area delimited by dashed lines being +/- standard deviation around the average. Bottom right: plain lines are the resulting averaged reflectance spectra during May (452 spectra) and November (330) 2022 at the MAFR station with the shaded area being the +/- standard deviation around the average.
The Figure 2 (bottom plots) summarizes the resulting water reflectance spectra measured at the BEFR station in March, August and November 2021.
A second French site was implemented in November 2021 with the version 2 of the HYPERNETS system, i.e., a more robust and technically improved system. The location of this station is at the mouth of the macro-tidal Gironde Estuary, South-West of France, connected to the Atlantic Ocean (Figure 1). This estuary is characterized by well-developed maximum turbidity zones, with high concentrations of suspended sediments which strongly vary according to daily to fortnightly tidal cycles (e.g., Doxaran et al., 2009). The mouth of the Gironde Estuary actually represents a limit between sediment-rich turbid waters (inside the estuary) and phytoplankton-rich productive waters (in the adjacent coastal zone). The limits between predominantly brown and green waters have been often observed using satellite data in this transition zone, where the mixing of water masses depends on the river discharge and tidal currents (e.g., Novoa et al., 2017; Luo et al., 2020; Renosh et al., 2020). At the mouth of the Gironde Estuary, SPM and Chla concentrations typically vary from 10 to 600 g m-3 and from 0.1 to 5 mg m-3, within surface waters (Doxaran et al., 2009; Jalón-Rojas et al., 2021).
From November 2021 to September 2022, the HYPERNETS station was operated on the West shore of the estuary, on a fixed platform located at the beginning of a pontoon (50 m from the shore, station MAFR1 in Figure 1) where is located the MAGEST-Verdon autonomous station which provides continuous measurements of water turbidity, salinity and temperature (Jalón-Rojas et al., 2021). In September 2022, in order to improve the quality of comparisons between satellite and field data, the HYPERNETS station was moved 400 m away from the shore to face estuarine waters and minimize potential land contamination on satellite data (station MAFR2 in Figure 1). Taking into account the strong variations of water turbidity with tidal currents, water standard measurement sequences were recorded every 15 min in this location, during day time.
Selecting a cloud-free day over the Gironde Estuary (e.g., end of September 2022, see Figure 2), quite stable illumination conditions logically result in 6 almost superimposed Ed spectra measured over a full sequence. The same is observed for the 6 Ls spectra, while a low but significant variability is observed amongst the 6 Lu spectra. These variations can result from fast variations of water turbidity in the estuary, but also heterogeneous waters with mixed suspended sediment and phytoplankton particles. In such conditions, the data quality controls (see Section 2.1.1) are successfully passed and the water reflectance signal can be computed. Dealing with quite turbid waters, the obtained Rhow values are about ten times higher than in the Berre coastal lagoon, with a very strong signal in the red and NIR parts of the spectrum. However, the presence of phytoplankton cells can be detected with a significant decrease of Rhow around 675 nm, the second absorption peak of chlorophyll-a. Finally note that applying the NIR similarity correction in such turbid waters generates negative values at the two extremities of the spectrum (<400 nm and >850 nm), i.e., the Rhow_nosc values must be considered in such waters.
The Figure 2 (bottom plots) summarizes the resulting water reflectance spectra measured at the MAFR station in May and November 2022.
Satellite data considered in the present study were selected based on their specifications in terms of spatial, temporal and spectral resolutions which should be adapted to monitor water quality parameters in estuaries and coastal lagoons. As already highlighted (Doxaran et al., 2009; Ody et al., 2016; 2022; Novoa et al., 2017; Renosh et al., 2020), the combined S2A&B-MSI and S3A&B-OLCI satellite sensors from the European Space Agency (ESA) have great capabilities in this scope. S2-MSI has 12 wavebands from the visible to the shortwave-infrared (SWIR) with different spatial resolutions ranging from 10 to 60 m. The S2A&B-MSI sensors in activity since 2015 and 2017, respectively, provide a revisit time period of about 4 days at mid-latitudes. Comparatively, the S3A&B-OLCI sensors in activity since 2016 and 2018, respectively, provide daily observations at 300 m spatial resolution with 21 wavebands in the visible and NIR spectral regions. Level-1 data and Level-2 products were downloaded from CREODIAS6.
The L8 and L9-OLI sensors provide since 2013 and 2021, respectively, observations at high spatial resolution (30 m), with 9 wavebands from the visible to the SWIR and a revisit time period of about 9 days at mid-latitudes. These sensors are operated by NASA, the National Aeronautics and Space Administration. Data and products were downloaded from USGS7.
Finally, the Aqua-MODIS (Moderate-resolution Imaging Spectroradiometer) sensor (NASA) was also considered as it provides daily observations since 2002 at spatial resolutions of 250, 500 and 1000 m (19 wavebands from the visible to the SWIR). Level-1 data were downloaded from the NASA ocean color data portal8 to generate level-2 products at 250 m spatial resolution using the SeaWiFS Data Analysis System (SeaDAS) l2gen function. This processing, however, is known to be limited in confined areas such as estuaries, bays and lagoons as only two wavebands are available at 250 m and since the wavebands at 1000 m spatial resolution are used to apply atmospheric corrections (i.e., water pixels partly on land will be masked).
For each satellite sensor, atmospheric correction algorithms specifically developed for coastal turbid and dynamic waters were considered (Novoa et al., 2017; Warren et al., 2019; Renosh et al., 2020; Pahlevan et al., 2021). Note that some of these algorithms also integrate a correction for sun glint effects and/or also explicitly or implicitly a correction (which can be activated or not) for adjacency effects. Table 1 summarizes, the atmospheric correction algorithms tested for each sensor (and the corresponding versions).
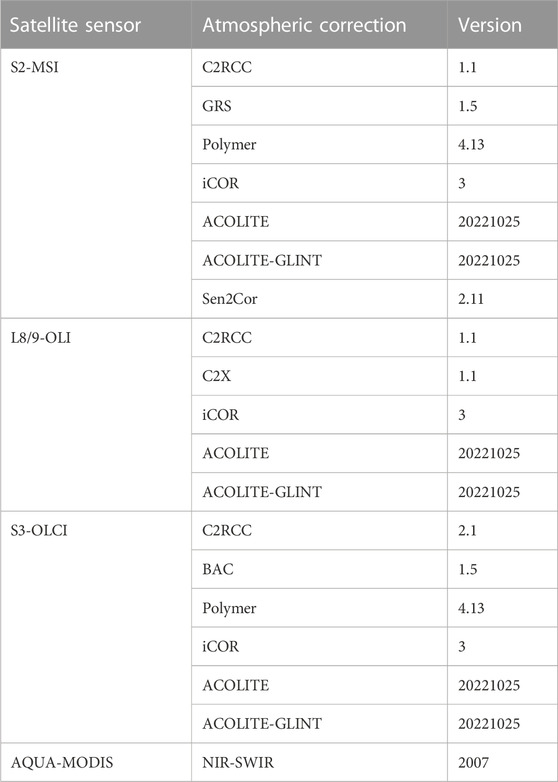
TABLE 1. List of satellite sensors and atmospheric correction algorithms tested.
C2RCC–The C2RCC processor has been developed for different satellite sensors (Brockmann et al., 2016). It is an advanced neural network (NN) algorithm trained for several water types including highly backscattering waters (rivers, estuaries and lakes). In this study, C2RCC processors available in SNAP 9.0 were used to process S2-MSI, S3-OLCI and L8&9-OLI satellite data. Here the default values were used for the water salinity (35 PSU) and temperature (15°C), as field data were not always available to document these parameters.
GRS–The Glint Removal for Sentinel2 (GRS) processor was initially develop to correct S2-MSI satellite data for sun glint effect. It now also incorporates a Rayleigh correction and applies a spectral fitting approach to estimate aerosol radiances (Harmel et al., 2018). Selected S2-MSI images were processed on demand by T. Harmel for the purpose of this study.
Polymer–The Polynomial Spectral Matching based algorithm applied to MERIS (Polymer) is an algorithm specially designed for waters with and without glint contamination (Steinmetz et al., 2011). Polymer works on the principle of the spectral matching method. This method depends upon a polynomial function to model the spectral reflectance of the atmosphere and sun glint with the help of a water reflectance model covering the visible and NIR (700–900 nm) spectral regions using the similarity spectrum for turbid waters (Ruddick et al., 2006). It was used to process S2-MSI and S3-OLCI satellite data. Note that the processing of L8&9-OLI data has been recently implemented in Polymer (v4.14) (e.g., see Kabir et al., 2023).
iCOR–Image correction for atmospheric effects (iCOR) is an image-based atmospheric correction tool which first identifies land and water pixels based on a band threshold then uses land pixels to estimate the aerosol optical thickness (AOT) (De Keukelaere et al., 2018). Multiple steps allow retrieving AOT values over land which are extrapolated over water. An adjacency correction can be applied using the SIMilarity Environmental Correction (SIMEC) approach (Sterckx et al., 2015). For consistency with the other processing algorithms, SIMEC was not applied in the present study. Finally, look-up-tables (LUT) are used to solve the radiative transfer equation and an additional correction for Fresnel reflectance is applied over water pixels. iCOR can be implemented into the SNAP software and was used here to process S2-MSI, S3-OLCI and L8&9-OLI satellite data.
ACOLITE–This generic processor was developed for atmospheric correction of multi-sensor satellite data (incl. L8&9-OLI, S2-MSI, S3-OLCI) for coastal and inland water applications. The default correction uses the dark spectrum fitting (DSF) approach (Vanhellemont and Ruddick, 2018; 2021; Vanhellemont and Ruddick, 2019; 2019; 2020). It is exclusively image-based, hence does not need external inputs such as measured AOT values, and assumes that the atmospheric path reflectance can be predicted from multiple dark targets in the scene (or sub-scene). The GRS correction for glint effects (Harmel et al., 2018) can be activated in ACOLITE (method called here ACOLITE-GLINT).
Sen2Cor–Sen2Cor is the processor supported by ESA to generate standard S2-MSI level-2 products distributed by Copernicus. It performs the atmospheric-, terrain- and cirrus correction of TOA data. Sen2Cor creates Bottom-Of-Atmosphere and cirrus corrected reflectance images, and additionally, AOT (Main-Knorn et al., 2017) using look-up-tables generated with the LIBRADTRAN radiative transfer model (Mayer and Killing, 2005). While Sen2Cor was designed for land processing with no water application, it was tested here as this standard level-2 product may perform well in highly turbid estuarine waters.
BAC–The Baseline Atmospheric Correction algorithm (BAC) is a combination of NIR-based black pixel assumption accommodated with the multiple scattering of air molecules and aerosols together with the bright pixel atmospheric correction approach (Moore et al., 2017). Initially developed for MERIS it was updated using OLCI wavebands. The BPAC corrects for the contribution of sediments on Rhow before estimating the atmospheric contribution in the NIR bands and applying the standard atmospheric correction scheme. It is the standard level-2 OLCI product distributed by Copernicus.
NIR-SWIR–This method of ocean color data processing combines the use of NIR and SWIR wavebands for the atmospheric correction of Aqua-MODIS satellite data (Wang and Shi, 2007). A turbid water index is used to discriminate clear and turbid waters. The standard (open ocean) atmospheric correction algorithm is applied in the first case, whereas for identified turbid waters MODIS SWIR bands are used to estimate the aerosol contribution on Rayleigh-corrected satellite data.
For validating satellite-derived products using in situ data in coastal and inland waters, Concha et al. (2017) raised the need to adapt matchup protocols to each site, depending on spatiotemporal collocation criteria. This approach was cautiously applied here taking into account the temporal variations of field measurements nearshore in the macro-tidal Gironde Estuary and in the center of the dynamic Berre coastal lagoon, and considering the high and medium spatial resolutions of satellite observations.
The list of high-quality matchups, identified in 2021 and 2022 between satellite data and HYPERNETS measurements, is presented in Table 2, for each satellite sensor and HYPERNETS station. These quality matchups were identified based on the availability of HYPERNETS field data and cloud-free satellite data.
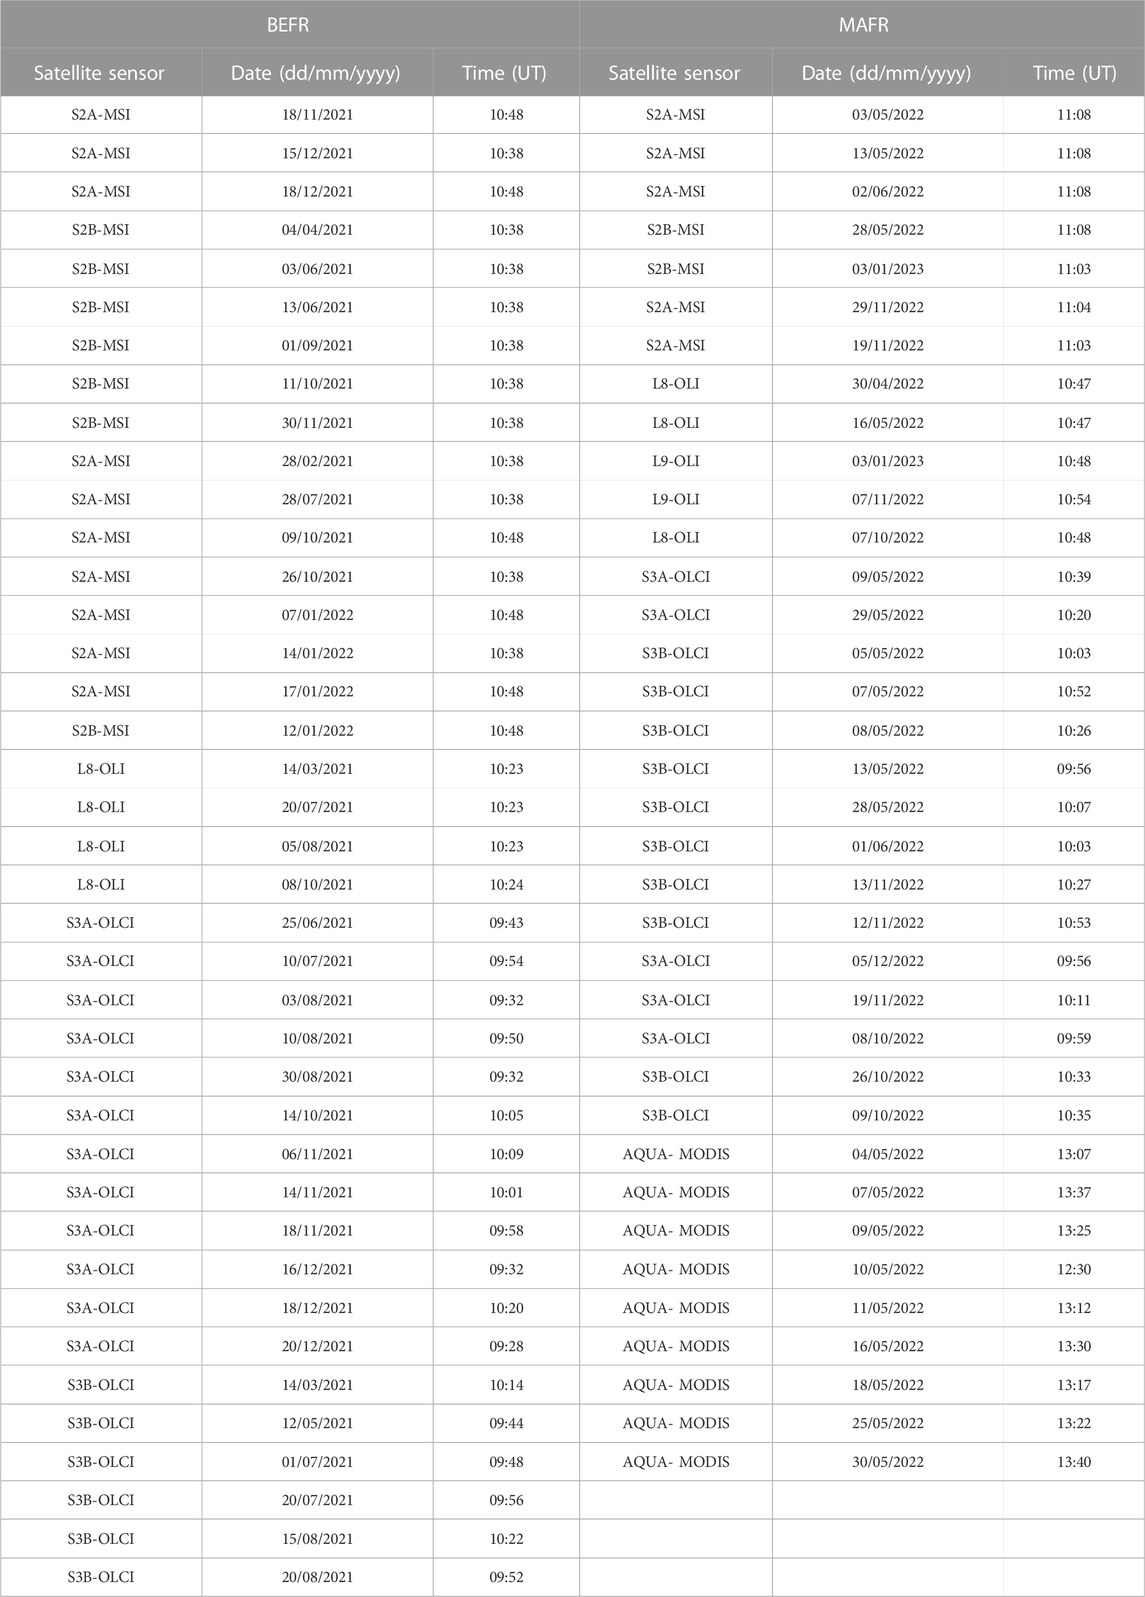
TABLE 2. List of satellite images considered for matchups with field data on the two study sites: the Berre coastal lagoon (BEFR on the left) and Gironde Estuary on the right (MAFR1 up to June 2022 and MAFR2 since September 2022).
Before comparing satellite-derived and field-measured Rhow values, the HYPERNETS Rhow spectra were convolved with the relative spectral responses of each satellite sensor to obtain band-equivalent Rhow values (e.g., see section 2.3.1 in Renosh et al. (2020) for details). The quantitative comparisons were then based on five different statistical indicators: the slope, intercept and determination coefficient (R2) of the best-fitted linear regression, the root mean square error (RMSE) (Eq. 1) and mean absolute percentage error (MAPE) (Eq. 2):
Where Rhow_sat(λ) is the water-leaving reflectance derived from the satellite at the waveband λ, and Rhow_HYP(λ) is the water-leaving reflectance derived from the HYPERNETS field measurements within the same waveband λ.
Matchup results are presented separately for each satellite sensor in different sections and for each HYPERNETS site as scatterplots, indicating the overall statistics (combining all wavebands) and comparing the different atmospheric correction methods tested. Detailed statistical results are also presented separately for each waveband in Tables 2–12. The results obtained are assumed to be representative of the uncertainties associated to satellite-derived water reflectance values.
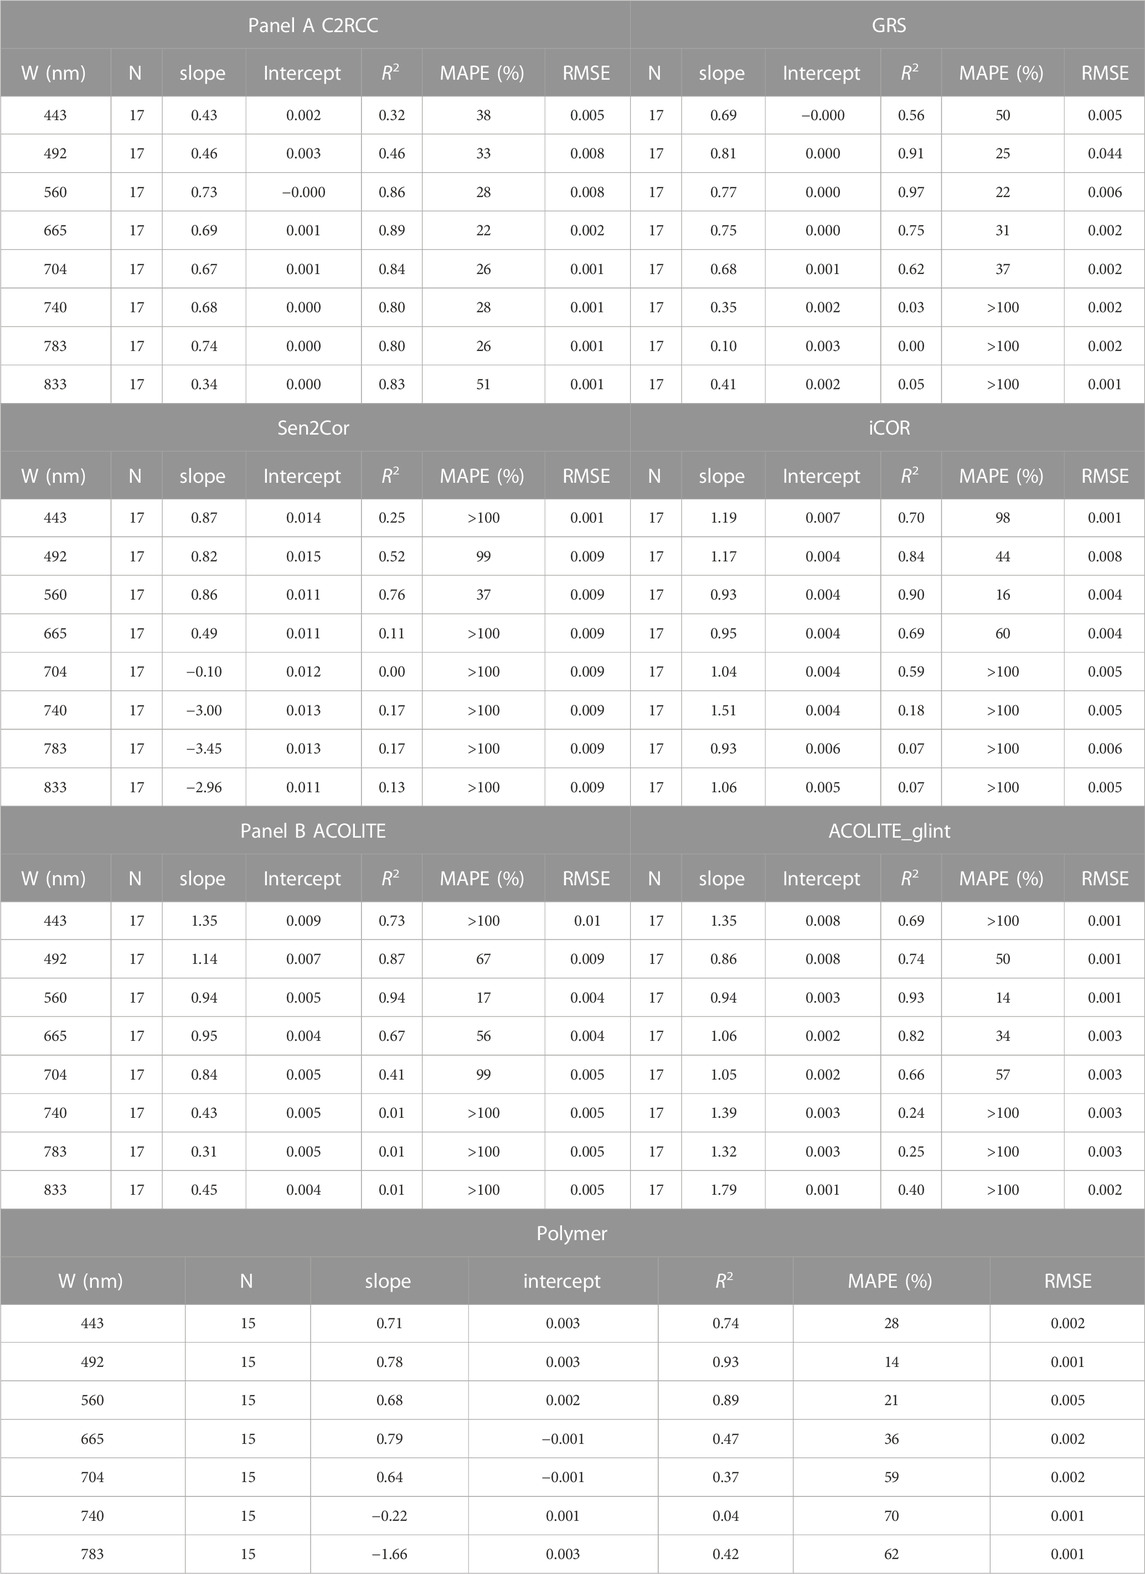
TABLE 3. S2-MSI matchup results (statistics for Berre lagoon).
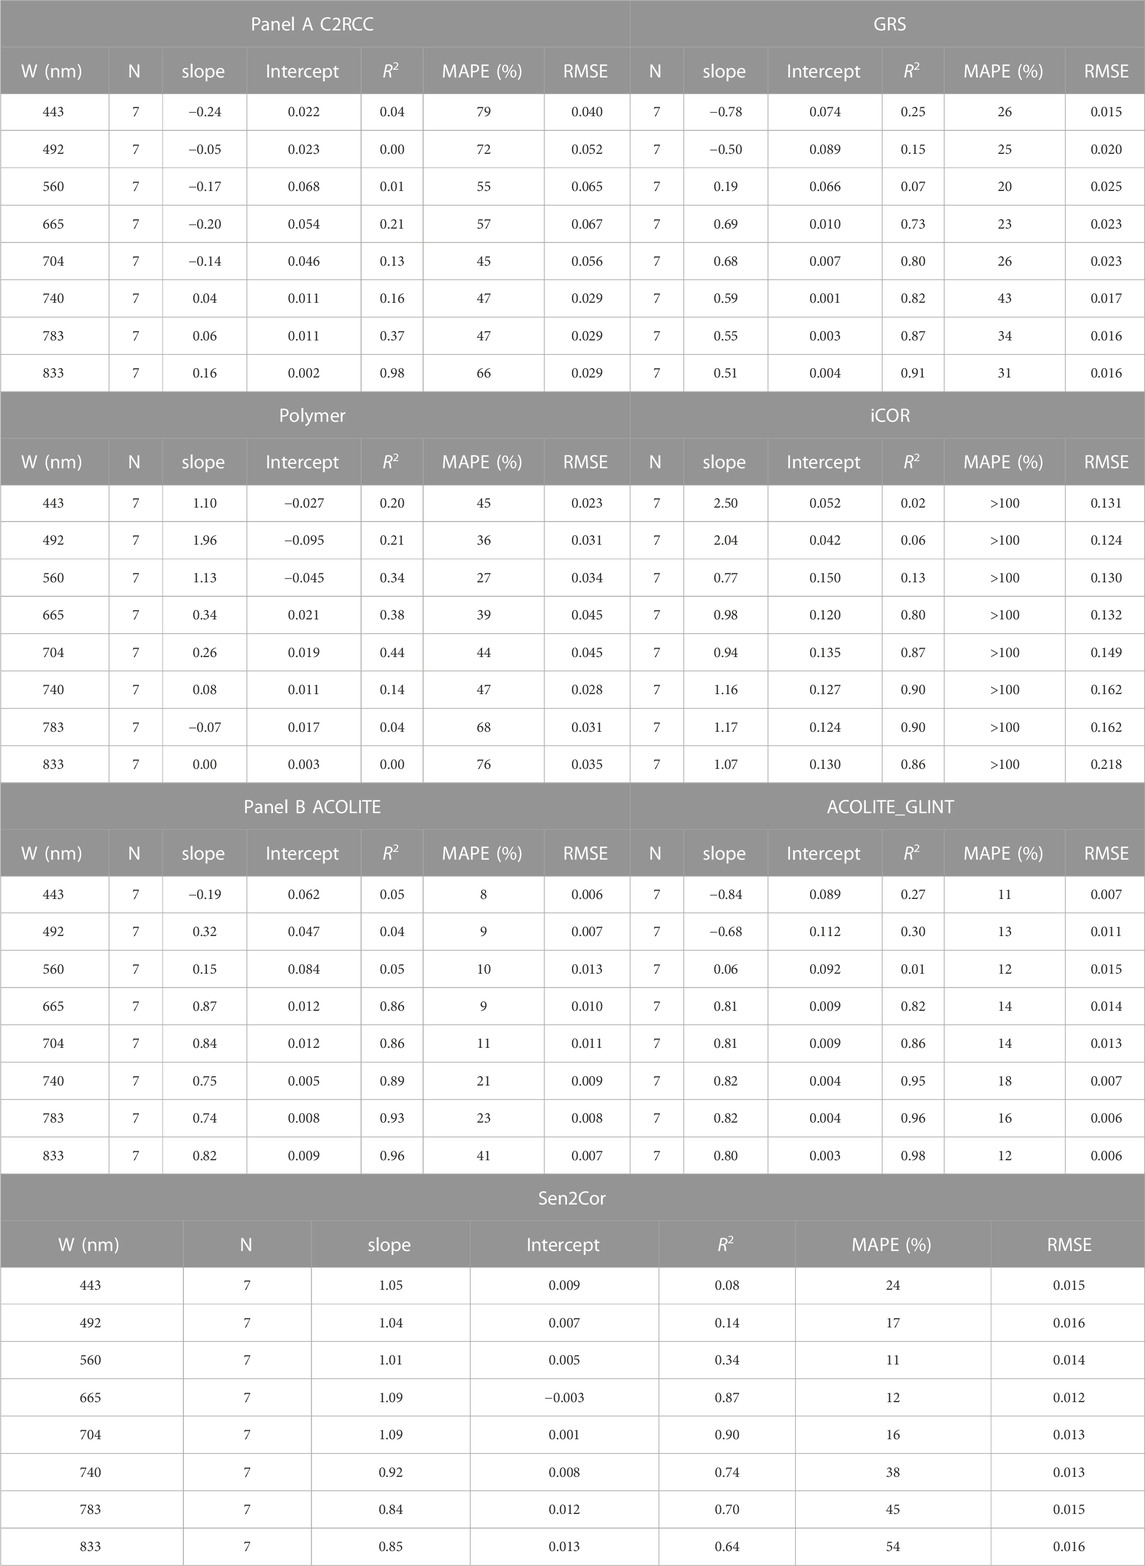
TABLE 4. S2-MSI matchup results (statistics for Gironde Estuary).
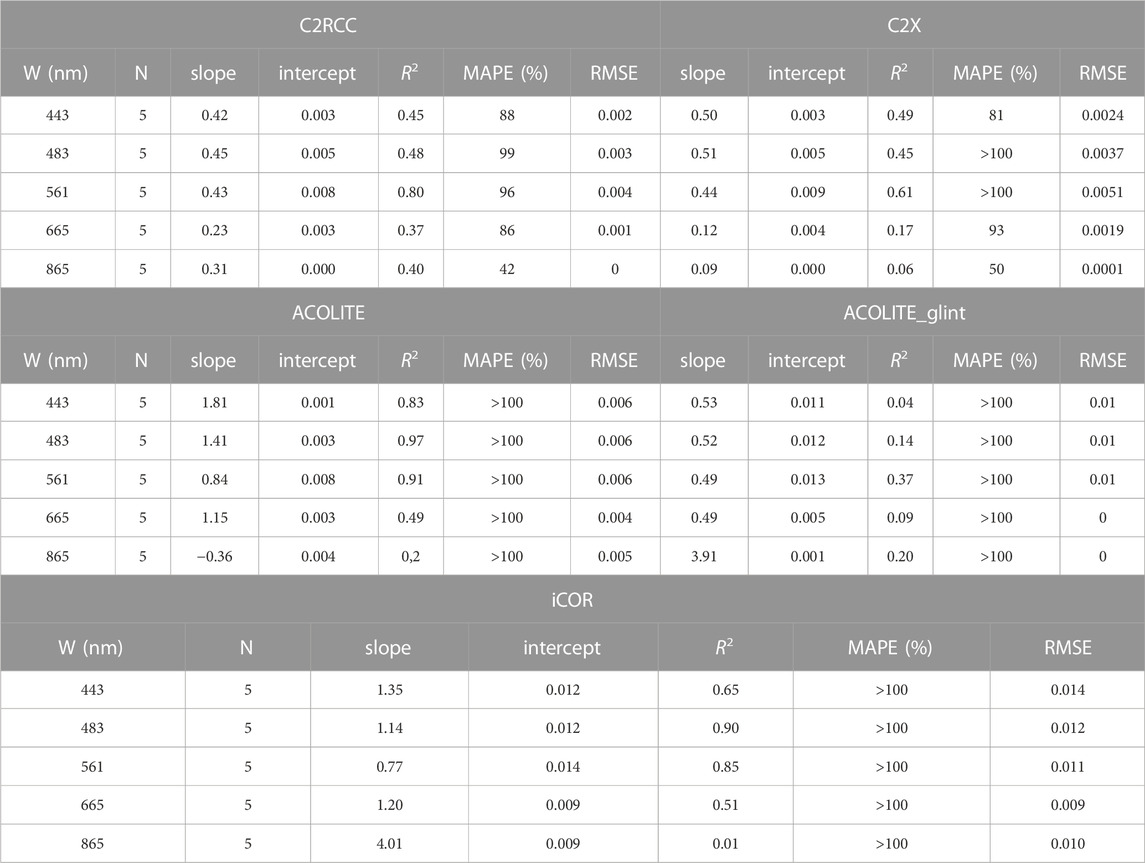
TABLE 5. L8/9-OLI matchup results (statistics for Berre lagoon).
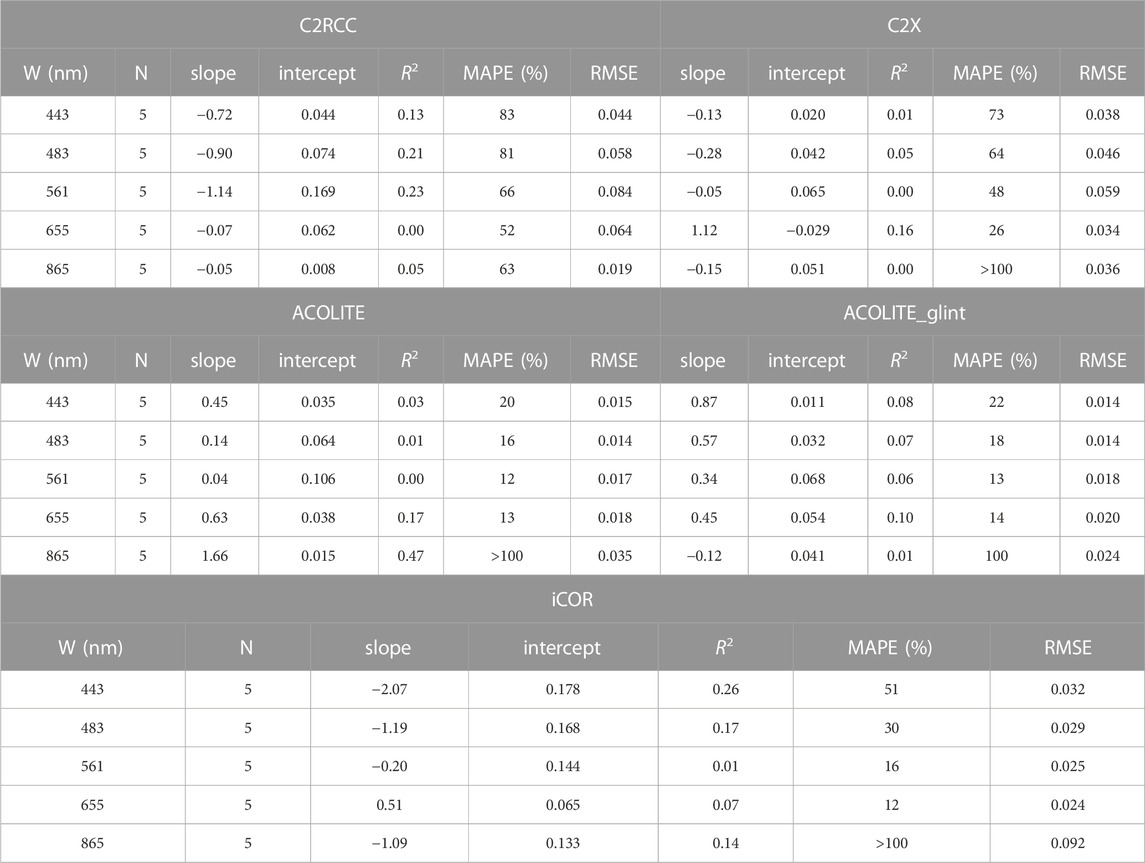
TABLE 6. L8/9-OLI matchup results (statistics for Gironde Estuary).
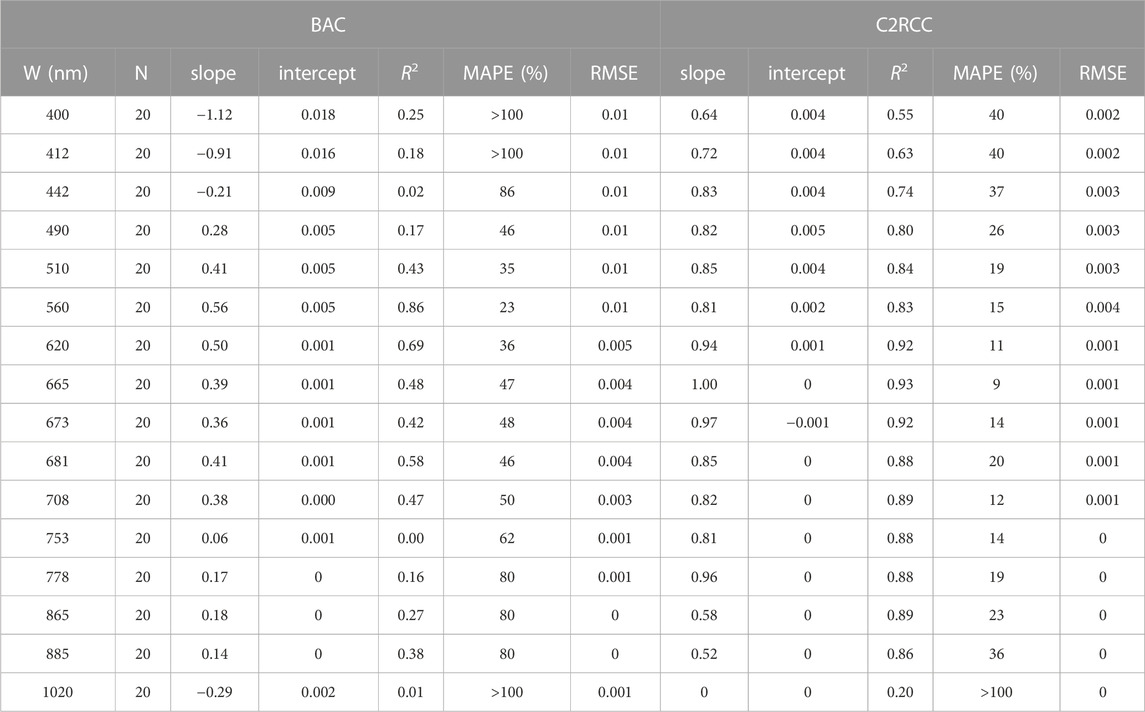
TABLE 7. S3-OLCI matchup results (statistics for Berre lagoon) (part ½).
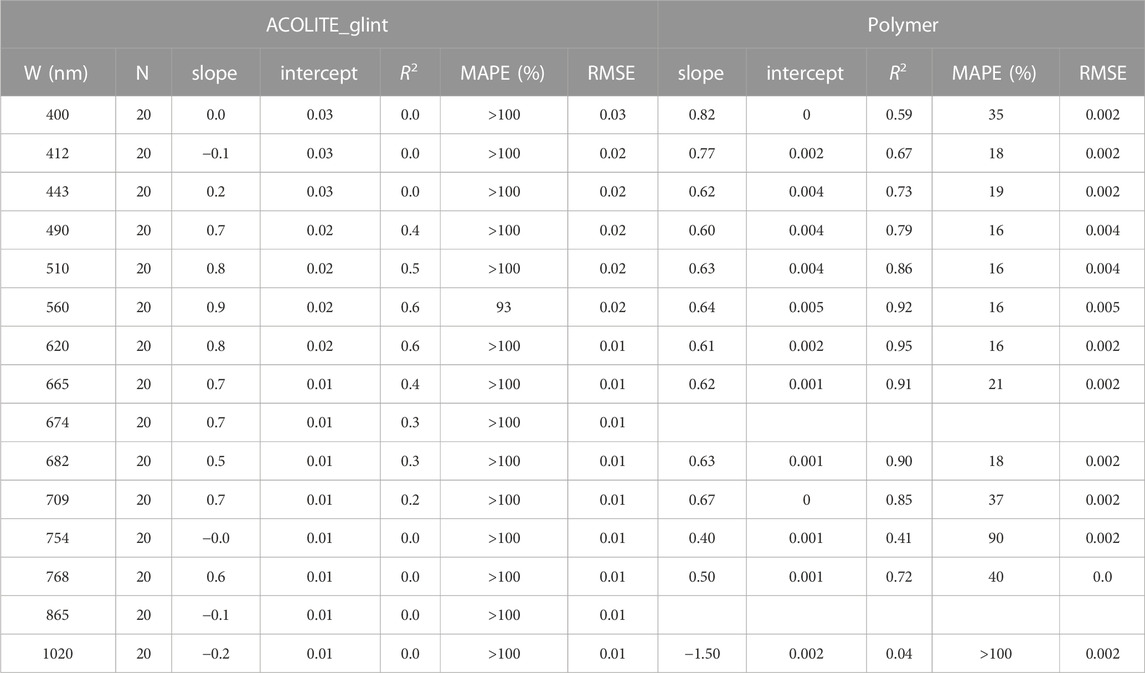
TABLE 8. S3-OLCI matchup results (statistics for Berre lagoon) (part 2/2).
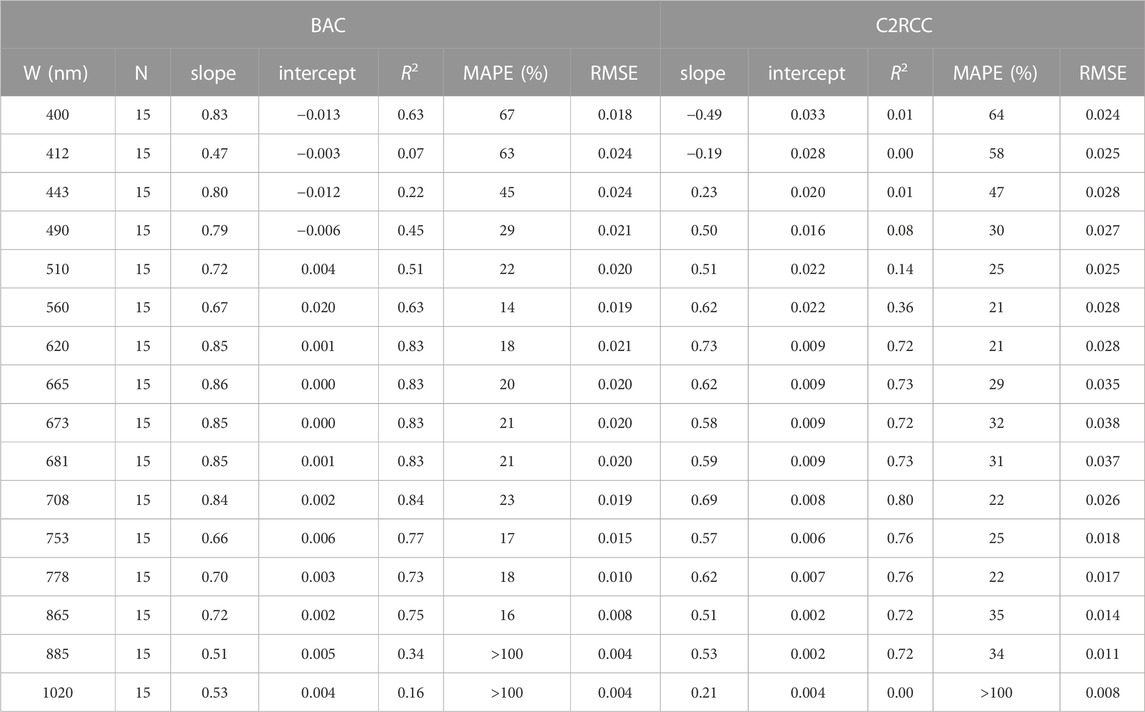
TABLE 9. S3-OLCI matchup results (statistics for Gironde Estuary) (part 1/3).
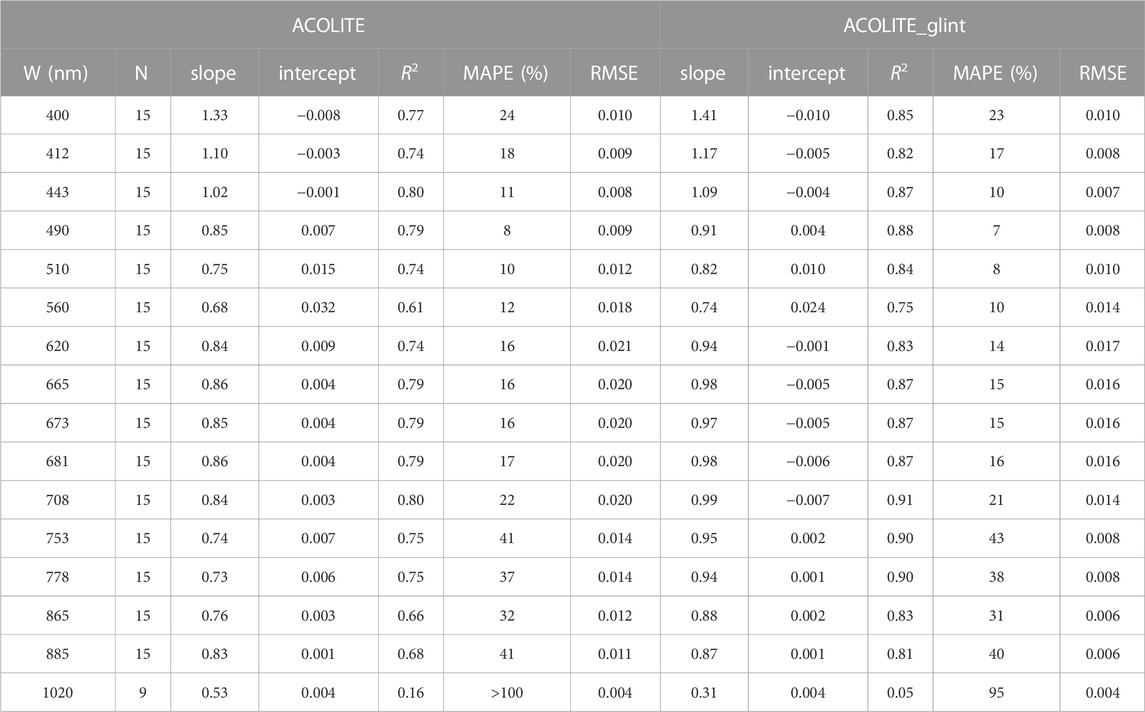
TABLE 10. S3-OLCI matchup results (statistics for Gironde Estuary) (part 2/3).
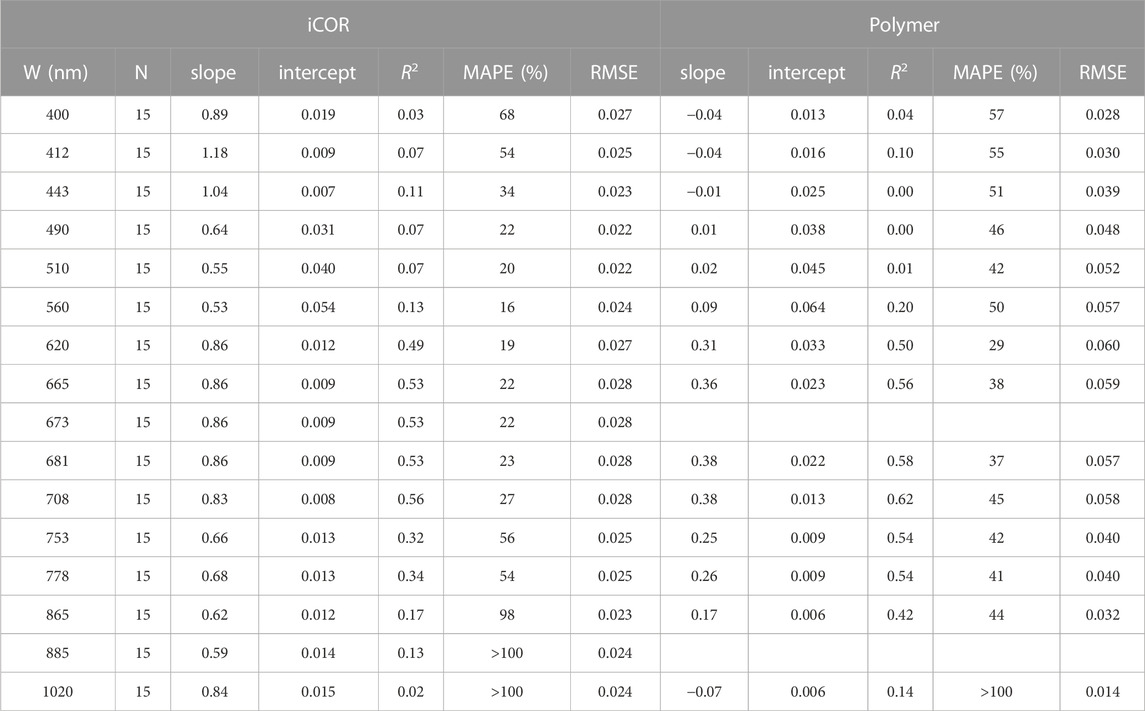
TABLE 11. S3-OLCI matchup results (statistics for Gironde Estuary) (part 3/3).
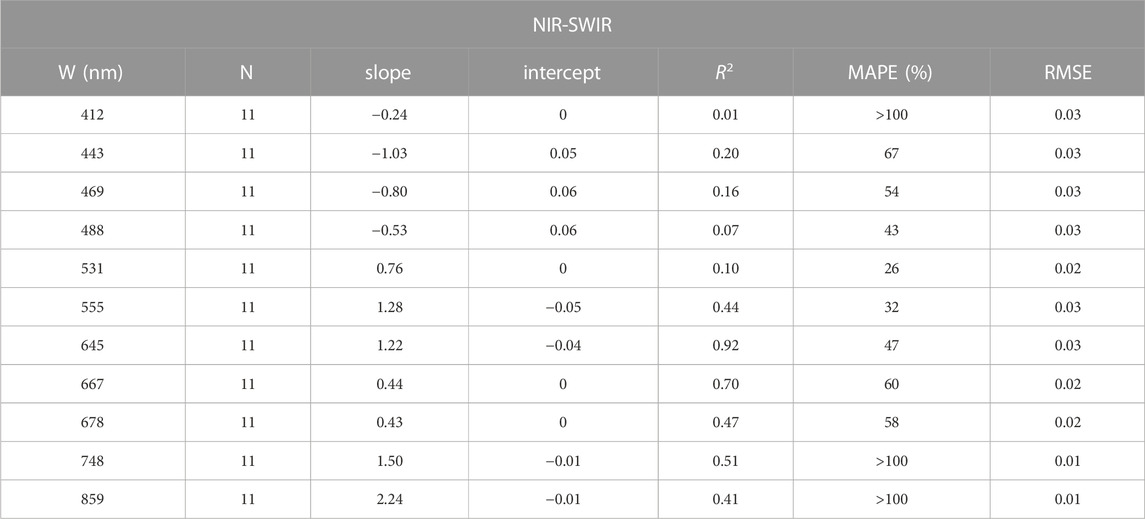
TABLE 12. Aqua-MODIS matchup results (statistics for Gironde Estuary).
Around the HYPERNETS station operated in Berre, the spatial dynamics of the water reflectance was characterized using 20 S2-MSI and 20 S3-OLCI images here corrected for atmospheric effects using ACOLITE-GLINT (Figure 3). Independently of the spatial resolution (20 m S2-MSI, and, 300 m S3 OLCI, respectively), mean values of Rhow (555) in the 3 × 3 and 5 × 5 pixels boxes, respectively, show a very good agreement with the Rhow (555) values of the central pixel (where is located the station). This homogeneity is even confirmed when mapping the variations (in %) of Rhow (555) compared to the Rhow (555) value in the central pixel over a larger area (Figure 3). These variations are typically lower than 15% on S2-MSI images (despite some apparent residual glint effects) and lower than 7% on S3-OLCI images (Figure 3). Now looking at the temporal variations of field-measured Rhow (555) values (HYPERNETS data), between 10 h and 14 h (local time) over a 10 months period, these variations within +/-30 and +/-60 min time windows do not usually exceed 6%. Rare maximum variations of 10% are also detected. This could be explained by the presence of algal blooms causing higher diurnal variability in the optical properties of the water (i.e., August). This period of time also corresponds to higher variability in the HYPERNETS in-situ reflectance spectra (see Figure 2). Therefore, as a local adaptation of matchup protocols, extracting the mean satellite-derived value over the 3 × 3 pixels box and field measurements averaged within a +/-30 min time windows around the satellite data acquisition time seems appropriate in the central part of the Berre lagoon.
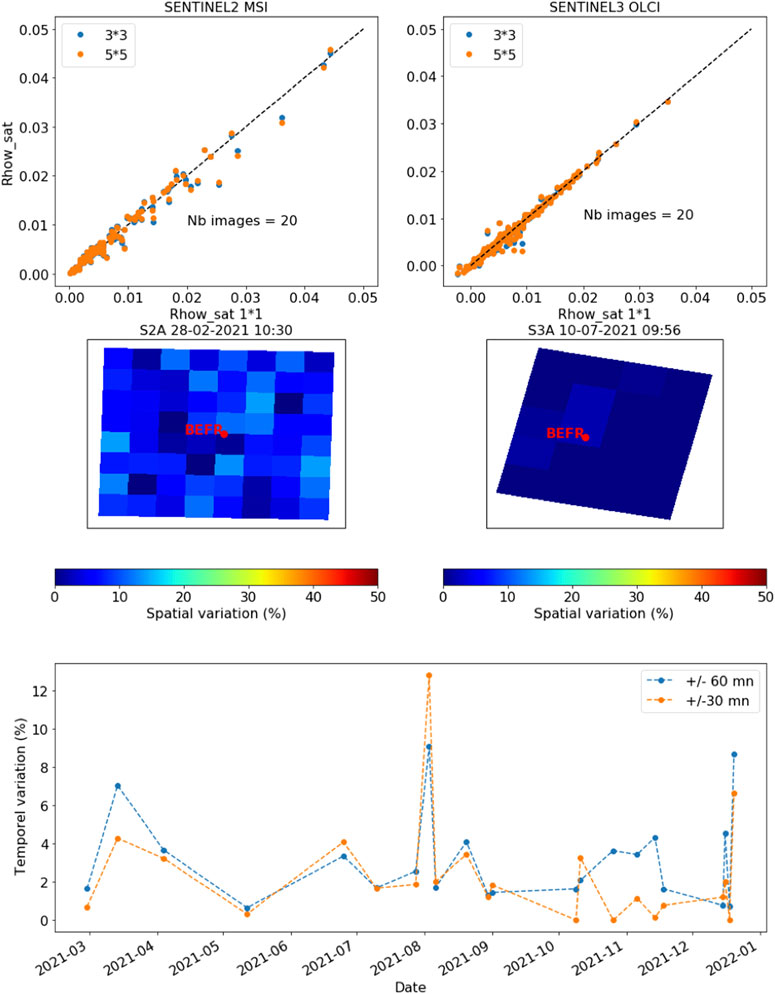
FIGURE 3. Observed spatial and temporal variations of the water-leaving reflectance (Rhow at 560 nm) at and around the Berre HYPERNETS station. Spatial variations are derived from S2-MSI (top left) and S3-OLCI (top right) satellite products respectively generated using the ACOLITE and BAC algorithms (20 images; the number of points correspond to the number of images multiplied by the number of each sensor spectral bands). Scatterplots of mean reflectance values within the 3 × 3 and 5 × 5 pixels centered on the HYPERNETS station versus the reflectance value of the single pixel containing the HYPERNETS station (top). Spatial variation of Rhow (560) in % around the station (center). Temporal variations (in %) observed on HYPERNETS -derived Rhow (560) (mean values within +/- 30 and 60 min) on selected dates from March 2021 to January 2022.
The spatiotemporal dynamics of the water reflectance at the mouth of the Gironde Estuary significantly differ from that observed in Berre (Figure 4). Around the HYPERNETS station located at the extremity of the pontoon (left shore), the high spatial resolution of S2-MSI pixels (7 images) show limited variations of the water reflectance signal (Rhow (665) within boxes of 1–5 × 5 pixels boxes (once the pontoon is accurately masked). This is no longer the case on S3-OLCI pixels which coarser spatial resolution results in a more significant scatter, as Rhow (665) values within boxes of 3 × 3 to 5 × 5 pixels are partly contaminated by the shore and the pontoon itself (Figure 4). As for the temporal variations of the water reflectance measured in the field, time windows of maximum +/-30 min must be considered to avoid variations larger than 20% (as the turbidity of the water, and consequently the water reflectance, strongly varies with tidal currents [e.g., Doxaran et al. (2009)]. This is also confirmed by Figure 2 with the very high variability in water reflectance expected at the Gironde especially in May and, slightly less, in November. Therefore, at the mouth of the Gironde Estuary, the site-specific matchup protocol consists in extracting the satellite-derived value of the closest pixel to the HYPERNETS station and average the field measurements within a +/-15 min time window.
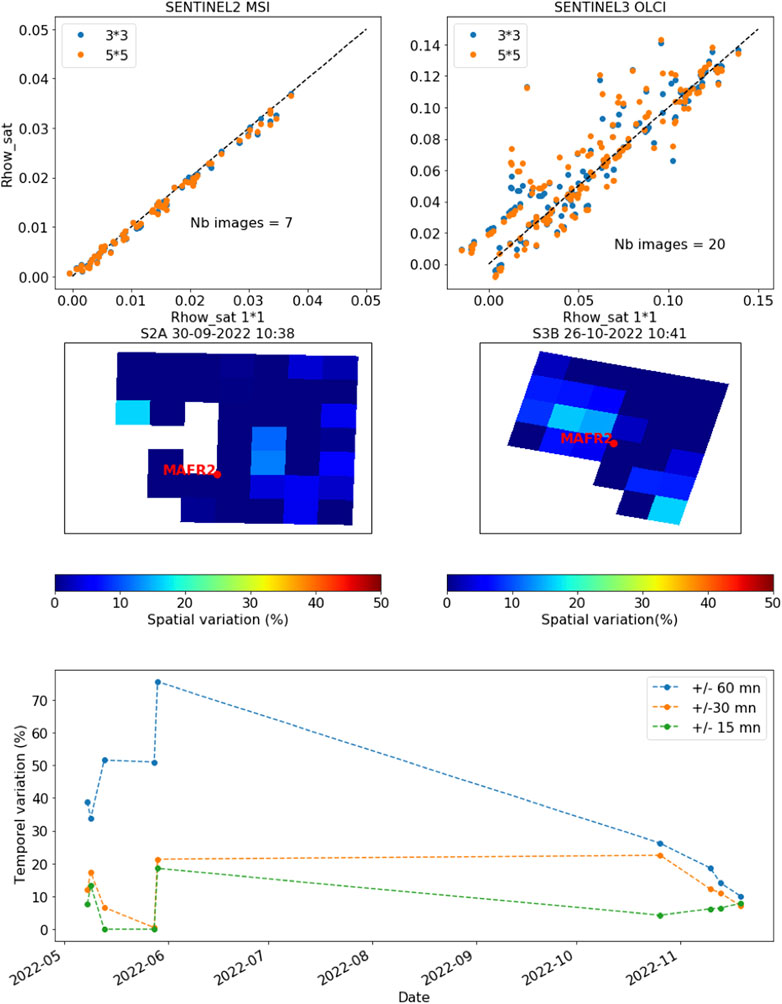
FIGURE 4. Observed spatial and temporal variations of the water-leaving reflectance (Rhow at 665 nm) at and around the Gironde HYPERNETS station. Spatial variations are derived from S2-MSI (top left) and S3-OLCI (top right) satellite products generated using the ACOLITE algorithm (7 and 20 images, respectively; the number of points correspond to the number of images multiplied by the number of each sensor spectral bands). Scatterplots of mean reflectance values within the 3 × 3 and 5 × 5 pixels centered on the HYPERNETS station versus the value right at the HYPERNETS station (top). Spatial variation of Rhow (560) in % around the station (center). Temporal variations (in %) observed on HYPERNETS -derived Rhow (665) (mean values within +/- 15, 30 and 60 min) on selected dates from May to November 2022.
Based on 17 quality matchups identified in the Berre lagoon, the C2RCC, GRS and Polymer processors provide results highly correlated with field measurements (R2 > 0,90), but all tend to underestimate (by about 25%) high Rhow values (Figure 5). C2RCC and Polymer provide accurate retrievals of low reflectance values (negligible intercepts) while GRS results are significantly noisier. Results obtained with iCOR, ACOLITE (with or without glint correction) are overall satisfactory (slope close to 1), but associated to more scatter especially for low Rhow values. The difference between satellite-derived and field-measured values is significantly lower when applying a glint correction, which was expected as S2-MSI data over the lagoon are often affected by sun glint (sensor pointing close to nadir). Sen2Cor results clearly overestimate field measurements (significant intercept) and are associated to a high scatter, as this processor is not designed to perform well in clear to moderately turbid waters and does not correct for glint effects.
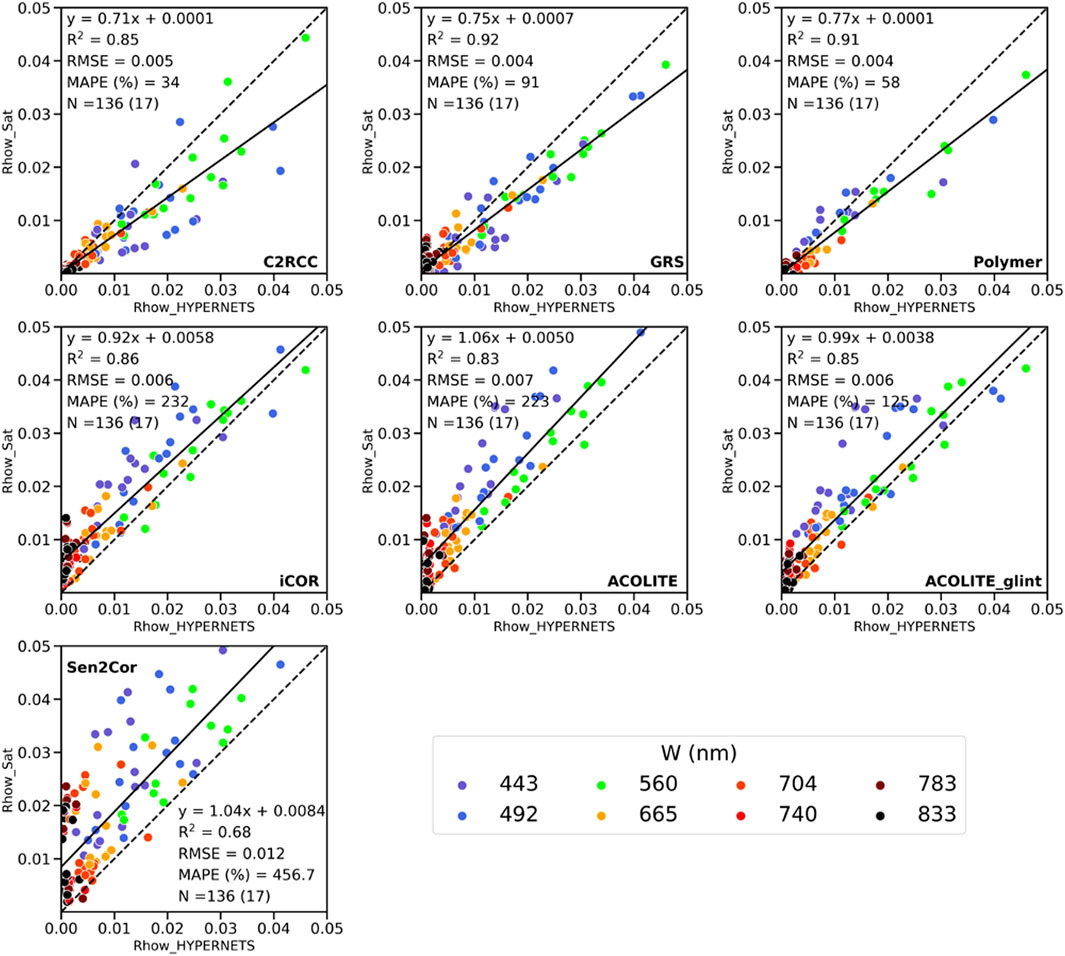
FIGURE 5. Matchup results (Berre coastal lagoon) obtained between Rhow derived from HYPERNETS field measurements (x-axis) and S2-MSI satellite-derived Rhow product (y-axis) when applying the different atmospheric correction algorithms tested in this study. Colors represent the satellite wavebands. For each scatterplot, statistics are presented as the best-fitted linear regression and associated determination coefficient, the RMSE and MAPE, the number of points (N) and processed satellite images (in brackets).
Distinguishing S2-MSI wavebands (Table 3), the performance of C2RCC is overall satisfactory and stable, except at short visible wavebands (<500 nm). The inverse is observed for GRS and Polymer with good performances for visible wavebands and worst results in the NIR spectral region. Rather surprisingly, Sen2Cor performance is higher at short visible wavebands (<600 nm), but systematically with a high overestimation. The performance of iCOR is spectrally-stable except for the specific 740 nm waveband. The best ACOLITE results are obtained at wavebands when field Rhow values are maximum (500–700 nm), while activating the glint correction tends to provide slightly underestimated Rhow values.
Overall, all the tested processing algorithms (except Sen2Cor) provide rather satisfactory results in such complex waters (low water-leaving signal, glint and potentially adjacency effects). Their results are actually complementary with best performances obtained either at short visible, visible or NIR wavebands. A glint correction module on top of atmospheric corrections appears to be crucial when selecting a specific processor. The C2RCC algorithm provides the minimum differences with field-measured values.
Based on 7 quality matchups with S2-MSI satellite data, one of the first striking result is the failure of the C2RCC and Polymer processors which both strongly underestimate Rhow values measured in the field (Figure 6). These two processing algorithms require to be trained using datasets representative of such waters (e.g., Knaeps et al., 2018). GRS performs significantly better but also provides underestimated reflectance values. The overall performances of ACOLITE (with or without glint correction) but also Sen2Cor is impressive; these two algorithms are simply well designed for highly turbid waters.
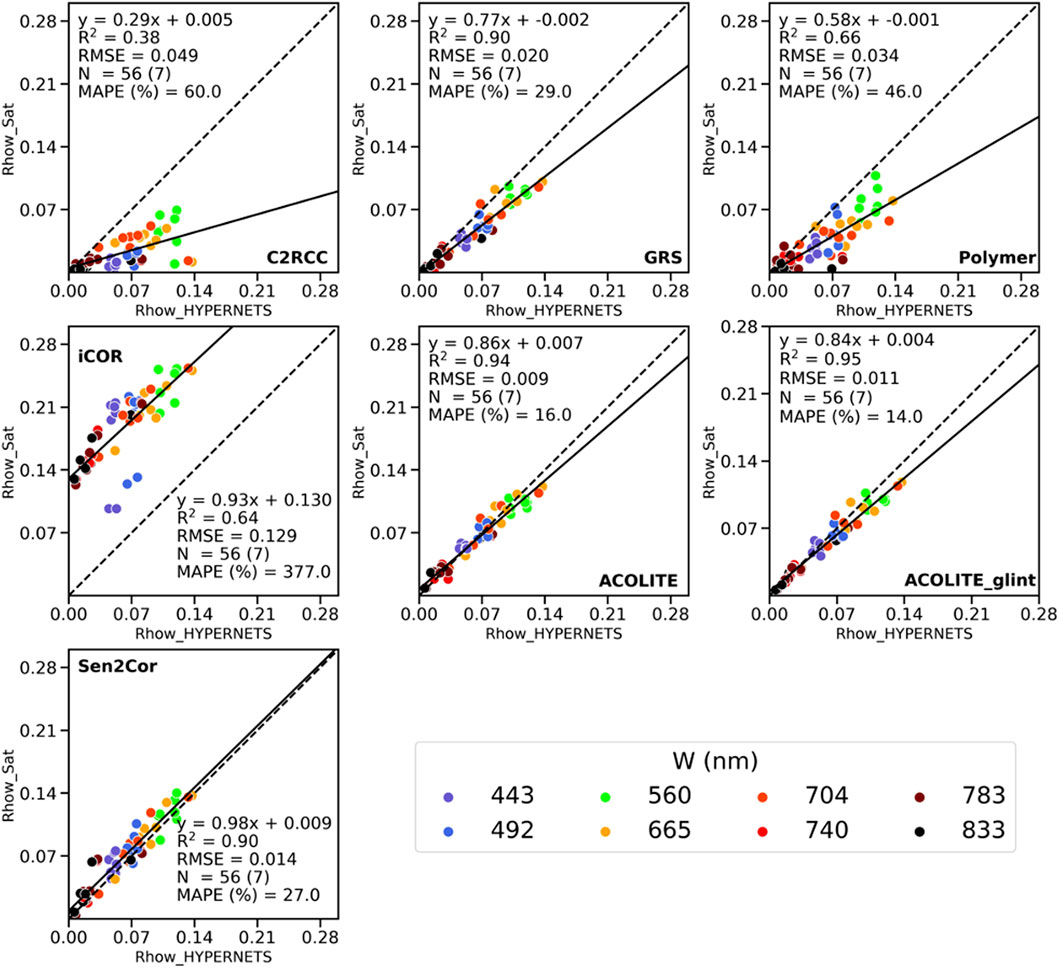
FIGURE 6. Matchup results (Gironde Estuary) obtained between Rhow derived from HYPERNETS field measurements (x-axis) and S2-MSI satellite-derived Rhow product (y-axis) when applying the different atmospheric correction algorithms tested in this study. Colors represent the satellite wavebands. For each scatterplot, statistics are presented as the best-fitted linear regression and associated determination coefficient, the RMSE and MAPE, the number of points (N) and processed satellite images (in brackets).
When looking at wavebands separately, the C2RCC processor is clearly not adapted to highly turbid waters (Table 4), while the worst performance of GRS this time is observed at short visible wavelengths (<500 nm). It is also at these shortest wavebands that iCOR clearly fails and overestimates Rhow by a factor 2, while much better results are obtained at longer wavebands. This is actually the inverse for Polymer which provides better results in this specific spectral region. ACOLITE (especially with the glint correction activated) definitely generates the minimum differences between satellite and field Rhow values (<18%); the results obtained with Sen2Cor are not as good but still quite satisfactory.
Overall, the best results are obtained with processing algorithms which do not make assumptions on the water reflectance but rather rely on dark (land) targets to estimate the aerosol contribution on recorded satellite data.
Only few (5) quality matchups between L8&9-OLI satellite products and HYPERNETS field data are available in both the Berre lagoon and Gironde Estuary to assess the performance of existing processing algorithms and estimate the uncertainties associated to the water reflectance products. These results, however, tend to confirm those obtained with S2-MSI, with quite satisfactory results obtained with C2RCC in Berre (Figure 7; Table 5) and with ACOLITE-GLINT in the Gironde (Figure 8; Figure 5B).
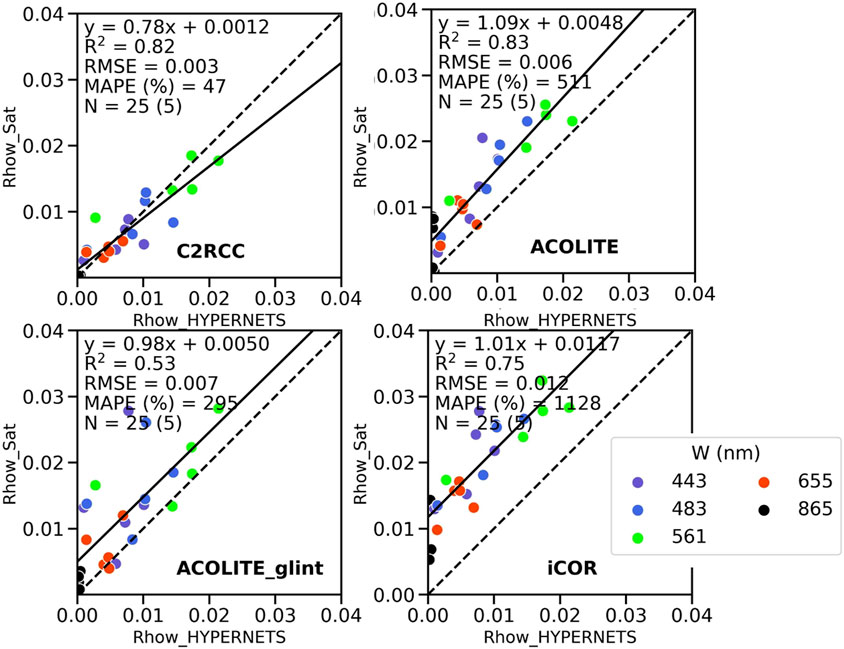
FIGURE 7. Matchup results (Berre coastal lagoon) obtained between Rhow derived from HYPERNETS field measurements (x-axis) and L8&9-OLI satellite-derived Rhow product (y-axis) when applying the different atmospheric correction algorithms tested in this study. Colors represent the satellite wavebands. For each scatterplot, statistics are presented as the best-fitted linear regression and associated determination coefficient, the RMSE and MAPE, the number of points (N) and processed satellite images (in brackets).
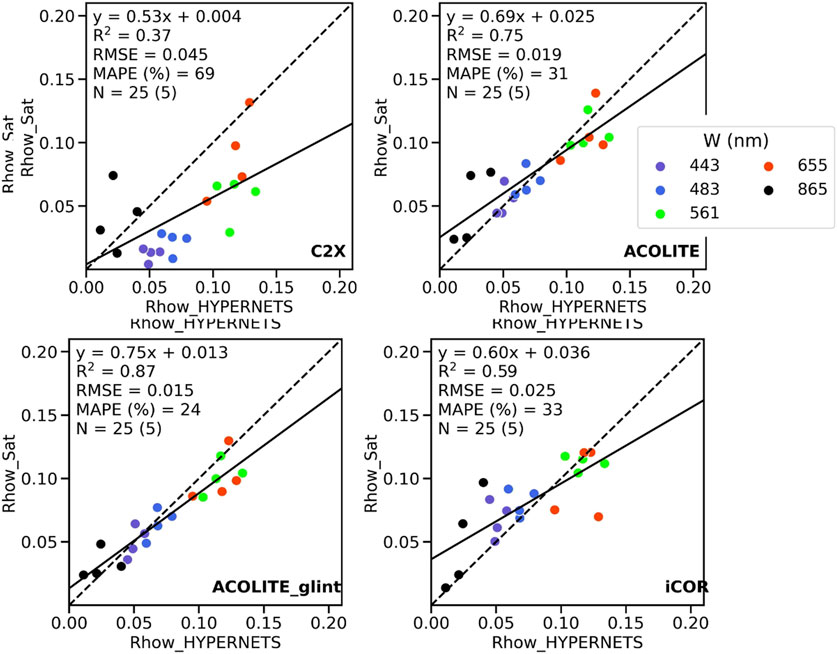
FIGURE 8. Matchup results (Gironde Estuary) obtained between Rhow derived from HYPERNETS field measurements (x-axis) and L8&9-OLI satellite-derived Rhow product (y-axis) when applying the different atmospheric correction algorithms tested in this study. Colors represent the satellite wavebands. For each scatterplot, statistics are presented as the best-fitted linear regression and associated determination coefficient, the RMSE and MAPE, the number of points (N) and processed satellite images (in brackets).
Comparatively to S2-MSI and L8&9-OLI, numerous matchups were available (20 and 15, respectively, in the Berre lagoon and Gironde Estuary) to assess the validity of S3-OLCI satellite products generated using different processing algorithms.
In the Berre lagoon, the poor performance of the standard (BAC) processor is clearly highlighted as the results obtained are quite scattered and satellite-derived Rhow values underestimated by up to 39% (Figure 9; Tables 7–11). Poor results are also obtained with ACOLITE, even when activating the glint correction, with a very significant scatter and a strong overestimation of field-measured Rhow values. The two best performers for S3-OLCI data are clearly C2RCC and Polymer, in this order, with a slope of 1 and differences of 20% on average for C2RCC, while Polymer results show a higher determination factor (0.95) but a significant underestimation of high Rhow values. Clearly the best results are obtained with C2RCC while the Polymer processing should be improved for turbid waters.
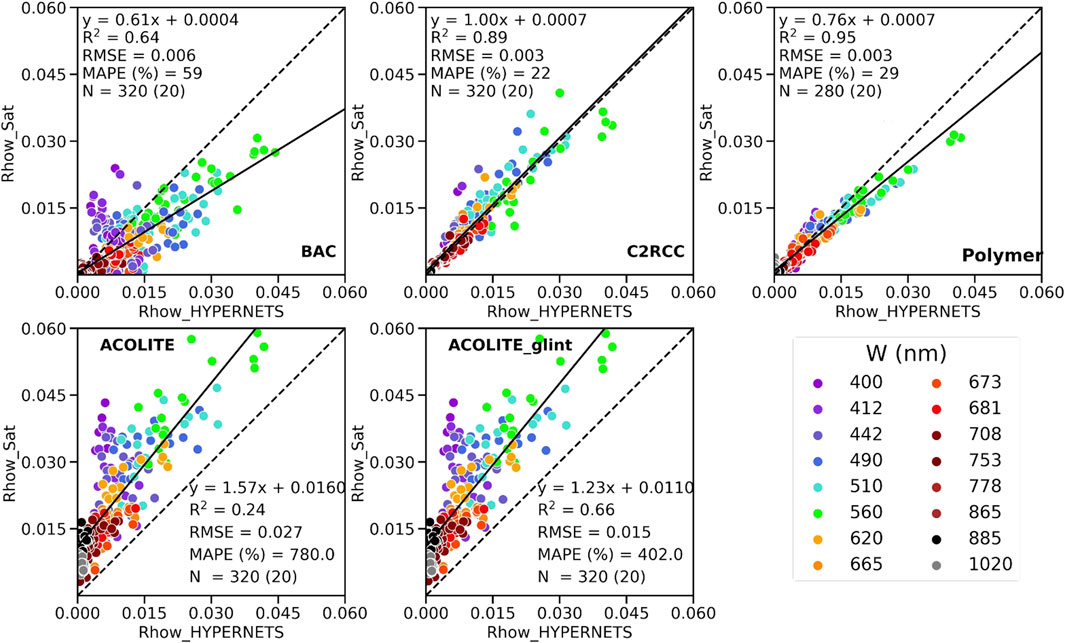
FIGURE 9. Matchup results (Berre coastal lagoon) obtained between Rhow derived from HYPERNETS field measurements (x-axis) and S3-OLCI satellite-derived Rhow product (y-axis) when applying the different atmospheric correction algorithms tested in this study. Colors represent the satellite wavebands. For each scatterplot, statistics are presented as the best-fitted linear regression and associated determination coefficient, the RMSE and MAPE, the number of points (N) and processed satellite images (in brackets).
Several processing algorithms provide satisfactory results in the moderately to highly turbid waters encountered at the mouth of the Gironde Estuary (Figure 10). First the standard (BAC) product is highly correlated to field measurements (R2 = 0.89), but tends to underestimate field-measured Rhow values with overall differences of 35%. Results obtained with C2RCC are still reasonable but correspond to significantly underestimated (by 29%) satellite-derived Rhow values, especially in presence of highly turbid waters, and slightly higher differences (42%) overall. This is no longer the case when considering satellite-derived Rhow values generated using Polymer, with a significant underestimation of field values. This processor clearly reaches its limits for Rhow values higher than 0.02. Satisfactory results are obtained using iCOR over the whole range of Rhow values measured in the field, but with a significant scatter (R2 = 0.65) and differences higher than 70%. Once again in the case of turbid waters, the best results are obtained using the ACOLITE processor, especially when activating the glint correction [slope close to 1, negligible intercept and high correlation (R2 = 0.92)], with mean differences lower than 30% between satellite-derived and field measured Rhow values (Figure 10; Tables 7–11).
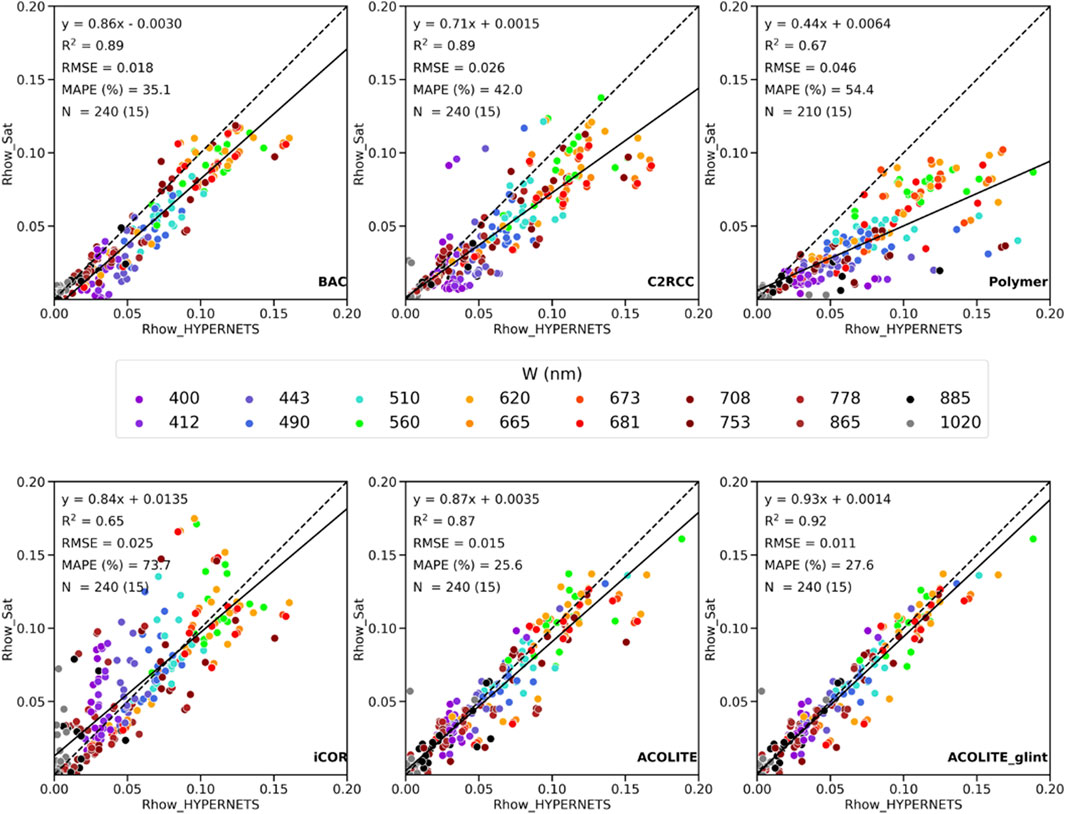
FIGURE 10. Matchup results (Gironde Estuary) obtained between Rhow derived from HYPERNETS field measurements (x-axis) and S3-OLCI satellite-derived Rhow product (y-axis) when applying the different atmospheric correction algorithms tested in this study. Colors represent the satellite wavebands. For each scatterplot, statistics are presented as the best-fitted linear regression and associated determination coefficient, the RMSE and MAPE, the number of points (N) and processed satellite images (in brackets).
Doxaran et al. (2009) used the “surface reflectance” MODIS land product at full spatial resolution (250 m) to retrieve and map concentrations of suspended particulate matter (SPM) in the whole Gironde Estuary. Here, the more conventional NIR-SWIR atmospheric correction method was applied to estimate water reflectance values at the mouth of the estuary characterized by moderately to highly turbid waters. The SeaDAS l2gen function allowed retrieving Rhow values at 250 m spatial resolution at all MODIS visible to NIR wavebands, by interpolation, for comparisons with HYPERNETS Rhow field measurements.
Unfortunately, the use of the l2gen function is problematic in inland and nearshore turbid waters such as estuaries and bays as atmospheric corrections and application of land, cloud and other masks rely on wavebands at 1000 m resolution. Therefore, as expected, few MODIS products satisfy matchup criteria and only 11 images provide matchups with MAFR HYPERNETS data. Including all MODIS wavebands, the matchup results show a significant but not satisfactory linear correlation (R2 = 0.62) between satellite-derived and field-measured Rhow values (Figure 11). The NIR-SWIR processing clearly tends to underestimate actual Rhow values, by about 30%. Results are inverse and satisfactory (slope of 1.2, negligible intercept and R2 = 0.92) only at 645 nm, a band with a native spatial resolution of 250 nm and wavelengths sensitive to moderately to highly turbid waters (Table 12). Therefore, despite the potential of specific MODIS wavebands, accurately retrieving Rhow values in confined and turbid estuarine waters remains challenging using the ocean color l2gen function.
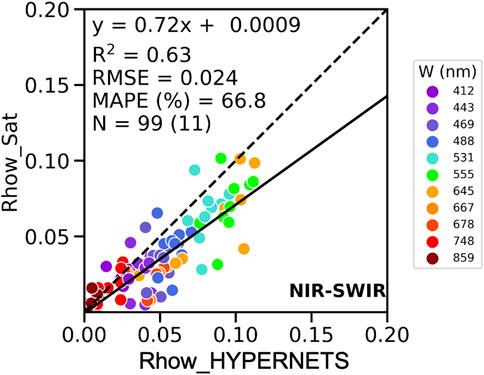
FIGURE 11. Matchup results (Gironde Estuary) obtained between Rhow derived from HYPERNETS field measurements (x-axis) and AQUA-MODIS satellite-derived Rhow product (y-axis) when applying the NIR-SWIR atmospheric correction algorithm. Colors represent the satellite wavebands. Statistics are presented as the best-fitted linear regression and associated determination coefficient, the RMSE and MAPE, the number of points (N) and processed satellite images (in brackets).
As part of the HYPERNETS project, a new network of autonomous field optical stations has been developed and is already in operation around the world for the validation of multi-sensor satellite products. It notably includes coastal and inland water sites such as estuaries, lagoons and reservoirs, i.e., optically complex water bodies where only few measurements are available in this scope (e.g., Pahlevan et al., 2021). These stations provide daily hyperspectral above-water radiance and irradiance measurements, recorded with a precise viewing geometry and used to accurately compute the water-leaving reflectance signal (Goyens et al., 2022). The autonomous system operating the HYPSTAR radiometer was already proved to be robust as successfully operated in wet and windy environments for more than 2 years over a wide range of air temperatures. This system guaranties accurate pointing geometries and provides useful information on environmental conditions (e.g., illumination, rainfall, humidity, air pressure, floating debris) to help operators optimizing their sampling strategy and anticipate technical problems.
The HYPERNETS network will certainly help characterizing the complex optical properties of nearshore coastal waters and confined inland waters (coastal lagoon, estuaries, rivers). These new field datasets will be of great benefit to complement existing ones such as AERONET-OC datasets (Zibordi et al., 2018; 2020), the SeaWiFS Bio-optical Archive and Storage System (SeaBASS), GLORIA (a globally representative hyperspectral in situ dataset for optical sensing of water quality) (Lehmann et al., 2023) or Lake Bio-optical Measurements and Matchup Data for Remote Sensing data (LIMNADES) (Pahlevan et al., 2021). The field datasets in generation will certainly enlarge our knowledge in terms of optical (and biogeochemical) properties of natural waters, extending the ranges of water dynamics and turbidity currently covered for the training of reflectance models used to develop inversion algorithms.
The first aim of HYPERNETS stations operated in water sites is to validate atmospheric, sun glint and adjacency corrections applied to multi-sensor high and medium spatial resolution satellite data. Matchups between field and satellite data in dynamic and often turbid nearshore waters is challenging and matchup protocols previously defined for open ocean then coastal waters must be revised (Concha et al., 2021). In the present study, the analysis of field radiometric measurements and ocean color satellite data has highlighted the need to adapt to each site matchup protocols in contrasted environments such as estuaries and coastal lagoons. Strict quality controls are also required and applied to field radiometric measurements to remove any suspicious or contaminated data (Goyens et al., 2022).
Operating two HYPERNETS stations in France for less than 2 years has already provided numerous matchups with high (L8&9-OLI, S2-MSI) and medium (S3-OLCI, Aqua-MODIS) spatial resolution satellite data. These new matchup datasets will grow and rapidly complement recent attempts to validate the processing of radiometric satellite data in coastal and inland waters and assess the uncertainties associated to satellite-derived optical and biogeochemical properties (e.g., Novoa et al., 2017; Warren et al., 2019; Renosh et al., 2020; Pahlevan et al., 2021).
The first results obtained using the two HYPERNETS stations operated in contrasted French coastal waters confirm that the water-leaving reflectance retrieved using most atmospheric correction processors is associated to significant (>20%) to critical (>60%) errors in nearshore waters (here a coastal lagoon and the mouth of an estuary), as already pointed out by previous studies (e.g., De Keukelaere et al., 2018; Ilori et al., 2019; Warren et al., 2019). These errors typically increase from green and/or red wavebands where the Rhow signal is usually maximum towards the blue and NIR spectral regions; several atmospheric correction algorithms, in their current version, simply generate unreliable results (Warren et al., 2019). There is no processor outperforming others, i.e., providing satisfactory results over the wide diversity of coastal and nearshore waters (Pereira-Sandoval et al., 2019), so that a prior optical water type classification is recommended for selecting the most appropriate atmospheric correction processor (e.g., Soomets et al., 2020; Pahlevan et al., 2021). In moderately turbid coastal lagoon waters, our results show that C2RCC and Polymer provide satisfactory results (errors respectively lower than 30% in visible wavebands and lower than 40% from 443 to 800 nm), as already reported by Pereira-Sandoval et al. (2019) for inland waters where glint and adjacency corrections of satellite data may be as important as atmospheric corrections. Now our study actually shows that the current versions of these two processors reach their limits in turbid to highly turbid waters (with errors higher than 40% at all wavebands). The failure most probably comes from the water reflectance models used in these processors, i.e., models which do not yet account for the large variations of Rhow in the NIR part of the spectrum (Knaeps et al., 2018). The HYPERNETS network will provide new validation datasets to complement the lack of matchups between field and satellite data in highly turbid waters (Knaeps et al., 21018; Goyens et al., 2022), but also contribute to tune then adopt adapted water reflectance models (e.g., Lee et al., 2016; Luo et al., 2018) in atmospheric correction processors. In such waters, our results clearly highlight the very satisfactory performances of ACOLITE (with errors lower than 20% over the visible to NIR parts of the spectrum, when the glint correction is applied) but also Sen2Cor (errors lower than 30% in visible wavebands), i.e., processors which do not make (potentially erroneous) assumptions on the water-leaving reflectance signal to be retrieved from the signal recorded at the top of the atmosphere. Similar results were obtained by Vanhellemont and Ruddick (2021) in moderately turbid coastal waters.
Our results therefore complement previous studies quantifying atmospheric correction errors and understanding the implication on downstream data, such as the concentrations of algal and non-algal particles, water turbidity (and transparency) and light absorption by colored dissolved organic matter (CDOM) (e.g., Ansper and Alikas, 2019; Pahlevan et al., 2021). In turbid estuarine waters, several processors certainly provide satisfactory results in order to accurately estimate the water turbidity and SPM concentration, but also Chla concentrations using a NIR to red edge algorithm (Gernez et al., 2017). In moderately turbid lagoon waters, a processor such as C2RCC (neural networks) is expected to provide satisfactory results to estimate SPM concentrations (using Rhow in the green or red waveband) but also Chla concentrations using a blue-to-green ratio (Erena et al., 2019; Jiménez-Quiroz et al., 2021) or preferably using a NIR-red ratio algorithm where waters are more turbid and/or more productive (Tavares et al., 2021; Zhan et al., 2022). The retrieval of CDOM optical properties is certainly more challenging, as all atmospheric correction processors are associated to significant errors at short visible wavelengths (<450 nm).
This study shows the great potential of hyperspectral radiometric measurements recorded on nearshore water sites when operated by autonomous pointing and recording systems. While the new HYPSTAR sensor allows a fine characterization of the spectral signatures in the visible and NIR, the accuracy of the pointing system guaranties the quality of the radiometric measurements for the computation of the water-leaving reflectance signal (after applying several steps of strict quality controls on recorded data). The system specifically designed as part of the HYPERNETS project also provides to users a high flexibility in order to adapt the sampling strategy to changing environmental conditions. HYPERNETS stations are already operated as part of an international network that will generate optical datasets needed to extend existing ocean color algorithms to nearshore and inland waters (e.g., estuaries, rivers, coastal lagoons, lakes).
Based on data recorded by two stations operated over the last 2 years in contrasted French waters, concluding results were already obtained concerning the first objective of HYPERNETS field measurements: the validation of atmospheric corrections applied to satellite data. These stations provide numerous quality matchups with data recorded aboard any satellite or airborne platform that will help better understanding atmospheric but also sun glint and adjacency effects on remote sensing data. In turbid estuarine waters, our results showed that the use of dark targets on each satellite image processed to estimate the aerosol contribution provides an accurate retrieval of the water-leaving reflectance signal (errors lower than 30% from short visible to NIR wavelengths). Other atmospheric processors (e.g., NN) still require improvements in such highly scattering waters by updating the reflectance model used, i.e., the assumptions made on the water-leaving reflectance signal. In less turbid coastal lagoon waters, by opposition, corrections of sun glint effects can be as important as atmospheric corrections. In all cases, adjacency effects are certainly significant, highly wavelength-dependent and should not be ignored. Our first and future results obtained using HYPERNETS field measurements are expected to be useful in order to improve existing processing algorithms, then validate satellite products to be used for the operational monitoring of coastal, nearshore and inland waters.
Parts of the HYPERNETS data from the Berre (BEFR site) and Gironde (MAFR site) stations are available and can be accessed here: https://zenodo.org/records/8057777 (BEFR), https://zenodo.org/records/8057789 (MAFR).
DD: Methodology, Supervision, Writing–original draft. BE: Data curation, Investigation, Validation, Writing–review and editing. AC: Conceptualization, Software, Visualization, Writing–review and editing. CG: Data curation, Investigation, Software, Validation, Writing–review and editing.
The author(s) declare financial support was received for the research, authorship, and/or publication of this article. HYPSTAR deployments and maintenance, data processing and analysis were funded by the H2020 Project HYPERNETS (grant number: 775983). Field campaigns and data processing were co-funded by CNES through the TOSCA program (HYPERVAL project).
The authors address special thanks to local collaborators in the Berre lagoon (GIPREB) and Gironde Estuary (Port de Bordeaux) who allowed the deployment and maintenance of the HYPERNETS stations.
The authors declare that the research was conducted in the absence of any commercial or financial relationships that could be construed as a potential conflict of interest.
All claims expressed in this article are solely those of the authors and do not necessarily represent those of their affiliated organizations, or those of the publisher, the editors and the reviewers. Any product that may be evaluated in this article, or claim that may be made by its manufacturer, is not guaranteed or endorsed by the publisher.
1https://www.hypernets.eu/from_cms/summary
3https://github.com/HYPERNETS/hypernets_tools
4https://github.com/HYPERNETS/hypernets_processor
7https://earthexplorer.usgs.gov
8https://oceancolor.gsfc.nasa.gov
Concha, J., Bracaglia, M., and Brando, V. (2021). Assessing the influence of different validation protocols on Ocean Colour match-up analyses. Remote Sens. Environ. 259, 112415. doi:10.1016/j.rse.2021.112415
De Keukelaere, L., Sterckx, S., Adriaensen, S., Knaeps, E., Reusen, I., Giardino, C., et al. (2018). Atmospheric correction of Landsat-8/OLI and Sentinel-2/MSI data using iCOR algorithm: validation for coastal and inland waters. Eur. J. Remote Sens. 51, 525–542. doi:10.1080/22797254.2018.1457937
Doron, M., Bélanger, S., Doxaran, D., and Babin, B. (2011). Spectral variations in the near-infrared ocean reflectance. Remote Sens. Environ. 115, 1617–1631. doi:10.1016/j.rse.2011.01.015
Doxaran, D., Froidefond, J. M., Castaing, P., and Babin, M. (2009). Dynamics of the turbidity maximum zone in a macrotidal estuary (the Gironde, France): observations from field and MODIS satellite data. Estuar. Coast. Shelf Sci. 81, 321–332. doi:10.1016/j.ecss.2008.11.013
Erena, M., Domínguez, J. A., Aguado-giménez, F., Soria, J., and García-Galiano, S. (2019). Monitoring coastal lagoon water quality through remote sensing: the mar menor as a case study. Water 11 (7), 1468. doi:10.3390/w11071468
Gernez, P., Barillé, L., Lerouxel, A., Mazeran, C., Lucas, A., and Doxaran, D. (2014). Remote sensing of suspended particulate matter in turbid oyster-farming ecosystems. J. Geophys. Res. - Oceans 119, 7277–7294. doi:10.1002/2014JC010055
Gernez, P., Doxaran, D., and Barillé, L. (2017). Shellfish aquaculture from Space: potential of Sentinel2 to monitor tide-driven changes in turbidity, chlorophyll concentration and oyster physiological response at the scale of an oyster farm. Front. Mar. Sci. 4. doi:10.3389/fmars.2017.00137
Gernez, P., Zoffoli, M. L., Lacour, T., Hernandez Farinas, T., Navarro, G., Caballero, I., et al. (2023). The many shades of red tides: sentinel-2 optical types of highly-concentrated harmful algal blooms. Remote Sens. Environ. 287, 113486. doi:10.1016/j.rse.2023.113486
Goyens, C., Lavigne, H., Dille, A., and Vervaeren, H. (2022). Using hyperspectral remote sensing to monitor water quality in drinking water reservoirs. Remote Sens. 14, 5607. doi:10.3390/rs14215607
Harmel, T., Chami, M., Tormos, T., Reynaud, N., and Danis, P.-A. (2018). Sunglint correction of the multi-spectral instrument (MSI)-SENTINEL-2 imagery over inland and sea waters from SWIR bands. Remote Sens. Environ. 204, 308–321. doi:10.1016/j.rse.2017.10.022
Ilori, C. O., Pahlevan, N., and Knudby, A. (2019). Analyzing performances of different atmospheric correction techniques for Landsat 8: application for coastal remote sensing. Remote Sens. 11, 469. doi:10.3390/rs11040469
Jalón-Rojas, I., Dijkstra, Y. M., Schuttelaars, H. M., Brouwer, R. L., Schmidt, S., and Sottolichio, A. (2021). Multidecadal evolution of the turbidity maximum zone in a macrotidal river under climate and anthropogenic pressures. J. Geophys. Res. Oceans 126, e2020JC016273. doi:10.1029/2020JC016273
Jiménez-Quiroz, M. C., Martell-Dubois, R., Cervantes-Duarte, R., and Cerdeira-Estrada, S. (2021). Seasonal pattern of the chlorophyll-a in a coastal lagoon from the southern Baja California (Mexico), described with in situ observations and MODIS-Aqua imagery. Oceanologia 63, 329–342. doi:10.1016/j.oceano.2021.03.003
Kabir, S., Pahlevan, N., O'Shea, R. E., and Barnes, B. B. (2023). Leveraging Landsat-8/-9 underfly observations to evaluate consistency in reflectance products over aquatic environments. Remote Sens. Environ., 296. doi:10.1016/j.rse.2023.113755
Katlane, R., Dupouy, C., El Kilani, B., and Berges, J.-C. (2020). Estimation of chlorophyll and turbidity using sentinel 2A and EO1 data in Kneiss Archipelago Gulf of Gabes, Tunisia. Int. J. Geosciences 11, 708–728. doi:10.4236/ijg.2020.1110035
Knaeps, E., Doxaran, D., Dogliotti, A. I., Nechad, B., Ruddick, K. G., Raymaekers, D., et al. (2018). The SeaSWIR dataset. Earth Syst. Sci. Data 10, 1439–1449. doi:10.5194/essd-10-1439-2018
Lee, Z., Shang, S., Lin, G., Chen, J., and Doxaran, D. (2016). On the modeling of hyperspectral remote-sensing reflectance of high-sediment-load waters in the visible to shortwave-infrared domain. Appl. Opt. 55, 1738–1750. doi:10.1364/ao.55.001738
Lehmann, M. K., Gurlin, D., Pahlevan, N., Alikas, K., Conroy, T., Anstee, J., et al. (2023). GLORIA - a globally representative hyperspectral in situ dataset for optical sensing of water quality. Sci. Data 10, 100. doi:10.1038/s41597-023-01973-y
Luo, L., Doxaran, D., and Vanhellemont, Q. (2020). Retrieval and validation of water turbidity at metre-scale using Pléiades satellite data: a case study in the Gironde estuary. Remote Sens. 12, 946. doi:10.3390/rs12060946
Luo, Y., Doxaran, D., Ruddick, K. G., Shen, F., Gentili, B., Yan, L., et al. (2018). Saturation of water reflectance in extremely turbid media based on field measurements, satellite data and bio-optical modelling. Opt. Express 26 (8), 10435. doi:10.1364/OE.26.010435
Main-Knorn, M., Pflug, B., Louis, J., Debaecker, V., Müller-Wilm, U., and Gascon, F. (2017). “Sen2Cor for sentinel-2,” in SPIE remote sensing (Bellingham, WA, USA: SPIE), 12.
Mayer, B., and Kylling, A. (2005). Technical note: the libRadtran software package for radiative transfer calculations - description and examples of use. Atmos. Chem. Phys. 5, 1855–1877. doi:10.5194/acp-5-1855-2005
Mobley, C. D. (1999). Estimation of the remote-sensing reflectance from above-surface measurements. Appl. Opt. 38, 7442. doi:10.1364/ao.38.007442
Moore, G., Mazeran, C., and Huot, J. P. (2017). MERIS ATBD 2.6 case II bright pixel atmospheric correction (BPAC). Eur. Space Agency 5, 3.
Novoa, S., Doxaran, D., Ody, A., Vanhellemont, Q., Lafon, V., Lubac, B., et al. (2017). Atmospheric corrections and multi-conditional algorithm for multi-sensor remote sensing of suspended particulate matter in low-to-high turbidity levels coastal waters. Remote Sens. 9, 61. doi:10.3390/rs9010061
Ody, A., Doxaran, D., Vanhellemont, Q., Nehad, B., Novoa, S., Many, G., et al. (2016). Potential of high spatial and temporal ocean color satellite data to study the dynamics of suspended particles in a micro-tidal river plume. Remote Sens. 8 (3), 245. doi:10.3390/rs8030245
Ody, A., Doxaran, D., Verney, R., Bourrin, F., Morin, G. P., Pairaud, I., et al. (2022). Ocean color remote sensing of suspended sediments along a continuum from rivers to river plumes: concentration, transport, fluxes and dynamics. Remote Sens. 14, 2026. doi:10.3390/rs14092026
Pahlevan, N., Mangin, A., Balasubramanian, S. V., Smith, B., Alikas, K., Arai, K., et al. (2021). ACIX-Aqua: a global assessment of atmospheric correction methods for Landsat-8 and Sentinel-2 over lakes, rivers, and coastal waters. Remote Sens. Environ. 258, 112366. doi:10.1016/j.rse.2021.112366
Pahlevan, N., Sarkar, S., Franz, B. A., Balasubramanian, S. V., and He, J. (2017a). Sentinel-2 MultiSpectral instrument (MSI) data processing for aquatic science applications: demonstrations and validations. Remote Sens. Environ. 201, 47–56. doi:10.1016/j.rse.2017.08.033
Pahlevan, N., Schott, J. R., Franz, B. A., Zibordi, G., Markham, B., Bailey, S., et al. (2017b). Landsat 8 remote sensing reflectance (R rs) products: evaluations, intercomparisons, and enhancements. Remote Sens. Environ. 190, 289–301. doi:10.1016/j.rse.2016.12.030
Pellegrino, A., Fabbretto, A., Bresciani, M., Lima, T., Braga, F., Pahlevan, N., et al. (2023). Assessing the accuracy of PRISMA standard reflectance products in globally distributed aquatic sites. Remote Sens. 15, 2163. doi:10.3390/rs15082163
Pereira-Sandoval, M., Ruescas, A., Urrego, P., Ruiz-Verdú, A., Delegido, J., Tenjo, C., et al. (2019). Evaluation of atmospheric correction algorithms over Spanish inland waters for sentinel-2 multi spectral imagery data. Remote Sens. 11, 1469. doi:10.3390/rs11121469
Renosh, P. R., Doxaran, D., De Keukelaere, L. 2, and Gossn, J. I. (2020). Evaluation of atmospheric correction algorithms for sentinel-2-MSI and sentinel-3-OLCI in highly turbid estuarine waters. Remote Sens. 12, 1285. doi:10.3390/rs12081285
Ruddick, K., De Cauwer, V., and Van Mol, B. (2005). “Use of the near infrared similarity reflectance spectrum for the quality control of remote sensing data,” in Remote sensing of the coastal oceanic environment. Editors R. J. Frouin, M. Babin, and S. Sathyendranath (Bellingham, WA, USA: SPIE).588501
Ruddick, K. G., De Cauwer, V., Park, Y. J., and Moore, G. (2006). Seaborne measurements of near infrared water-leaving reflectance: the similarity spectrum for turbid waters. Limnol. Oceanogr. 51, 1167–1179. doi:10.4319/lo.2006.51.2.1167
Soomets, T., Uudeberg, K., Jakovels, D., Brauns, A., Zagars, M., and Kutser, T. (2020). Validation and comparison of water quality products in Baltic Lakes using Sentinel-2 MSI and Sentinel-3 OLCI data. Sensors 20, 742. doi:10.3390/s20030742
Sterckx, S., Knaeps, S., Kratzer, S., and Ruddick, K. (2015). SIMilarity Environment Correction (SIMEC) applied to MERIS data over inland and coastal waters. Remote Sens. Environ. 157, 96–110. doi:10.1016/j.rse.2014.06.017
Tavares, M. H., Lins, R. C., Harmel, T., Fragoso, C. R., Martínez, J. M., and Motta-Marques, (2021). Atmospheric and sunglint correction for retrieving chlorophyll-a in a productive tropical estuarine-lagoon system using Sentinel-2 MSI imagery. ISPRS J. Photogrammetry Remote Sens. 174, 215–236. doi:10.1016/j.isprsjprs.2021.01.021
Vanhellemont, Q., and Ruddick, K. (2018). Atmospheric correction of metre-scale optical satellite data for inland and coastal water applications. Remote Sens. Environ. 216, 586–597. doi:10.1016/j.rse.2018.07.015
Vanhellemont, Q., and Ruddick, K. (2021). Atmospheric correction of Sentinel-3/OLCI data for mapping of suspended particulate matter and chlorophyll-a concentration in Belgian turbid coastal waters. Remote Sens. Environ. 256, 112284. doi:10.1016/j.rse.2021.112284
Wang, M., and Shi, W. (2007). The NIR-SWIR combined atmospheric correction approach for MODIS ocean color data processing. Opt. Express 15, 15722–15733. doi:10.1364/oe.15.015722
Warren, M., Simis, S., Martinez-Vicente, V., Poser, K., Bresciani, M., Alikas, K., et al. (2019). Assessment of atmospheric correction algorithms for the Sentinel-2A MultiSpectral Imager over coastal and inland waters. Remote Sens. Environ. 225, 267–289. doi:10.1016/j.rse.2019.03.018
Zhan, Y., Delegido, J., Erena, M., Soria, J., Ruiz-Verdu, A., Urrego, P., et al. (2022)). Menor lagoon (SE Spain) chlorophyll-a and turbidity estimation with Sentinel-2. Limnetica 41, 253. doi:10.23818/limn.41.18
Zibordi, G., Holben, B. N., Talone, M., D’Alimonte, D., Slutsker, I., Giles, D. M., et al. (2020). Advances in the ocean color component of the aerosol robotic network (AERONET-OC). J. Atmos. Ocean. Technol. 38, 725–746. doi:10.1175/JTECH-D-20-0085.1
Keywords: ocean color, atmospheric corrections, validation, autonomous system, coastal waters
Citation: Doxaran D, ElKilani B, Corizzi A and Goyens C (2024) Validation of satellite-derived water-leaving reflectance in contrasted French coastal waters based on HYPERNETS field measurements. Front. Remote Sens. 4:1290110. doi: 10.3389/frsen.2023.1290110
Received: 07 September 2023; Accepted: 11 December 2023;
Published: 08 February 2024.
Edited by:
Nima Pahlevan, Science Systems and Applications, Inc., United StatesReviewed by:
Zhigang Cao, Chinese Academy of Sciences (CAS), ChinaCopyright © 2024 Doxaran, ElKilani, Corizzi and Goyens. This is an open-access article distributed under the terms of the Creative Commons Attribution License (CC BY). The use, distribution or reproduction in other forums is permitted, provided the original author(s) and the copyright owner(s) are credited and that the original publication in this journal is cited, in accordance with accepted academic practice. No use, distribution or reproduction is permitted which does not comply with these terms.
*Correspondence: David Doxaran, ZGF2aWQuZG94YXJhbkBpbWV2LW1lci5mcg==
Disclaimer: All claims expressed in this article are solely those of the authors and do not necessarily represent those of their affiliated organizations, or those of the publisher, the editors and the reviewers. Any product that may be evaluated in this article or claim that may be made by its manufacturer is not guaranteed or endorsed by the publisher.
Research integrity at Frontiers
Learn more about the work of our research integrity team to safeguard the quality of each article we publish.