
94% of researchers rate our articles as excellent or good
Learn more about the work of our research integrity team to safeguard the quality of each article we publish.
Find out more
ORIGINAL RESEARCH article
Front. Remote Sens., 18 October 2023
Sec. Image Analysis and Classification
Volume 4 - 2023 | https://doi.org/10.3389/frsen.2023.1274019
 Fatima Imtiaz1
 Aitazaz Farooque1,2*
 Xander Wang1
 Farhat Abbas3
 Hassan Afzaal2
 Travis Esau4
 Bishnu Acharya5Qamar Zaman4
Soil moisture variability caused by soil erosion, weather extremes, and spatial variations in soil health is a limiting factor for crop growth and productivity. Crop evapotranspiration (ET) is significant for irrigation water management systems. The variability in crop water requirements at various growth stages is a common concern at a global level. In Canada’s Prince Edward Island (PEI), where agriculture is particularly prominent, this concern is predominantly evident. The island’s most prominent business, agriculture, finds it challenging to predict agricultural water needs due to shifting climate extremes, weather patterns, and precipitation patterns. Thus, accurate estimations for irrigation water requirements are essential for water conservation and precision farming. This work used a satellite-based normalized difference vegetation index (NDVI) technique to simulate the crop coefficient (Kc) and crop evapotranspiration (ETc) for field-scale potato cultivation at various crop growth stages for the growing seasons of 2021 and 2022. The standard FAO Penman–Monteith equation was used to estimate the reference evapotranspiration (ETr) using weather data from the nearest weather stations. The findings showed a statistically significant (p < 0.05) positive association between NDVI and tabulated Kc values extracted from all three satellites (Landsat 8, Sentinel-2A, and Planet) for the 2021 season. However, the correlation weakened in the subsequent year, particularly for Sentinel-2A and Planet data, while the association with Landsat 8 data became statistically insignificant (p > 0.05). Sentinel-2A outperformed Landsat 8 and Planet overall. The Kc values peaked at the halfway stage, fell before the maturity period, and were at their lowest at the start of the season. A similar pattern was observed for ETc (mm/day), which peaked at midseason and decreased with each developmental stage of the potato crop. Similar trends were observed for ETc (mm/day), which peaked at the mid-stage with mean values of 4.0 (2021) and 3.7 (2022), was the lowest in the initial phase with mean values of 1.8 (2021) and 1.5 (2022), and grew with each developmental stage of the potato crop. The study’s ET maps show how agricultural water use varies throughout a growing season. Farmers in Prince Edward Island may find the applied technique helpful in creating sustainable growth plans at different phases of crop development. Integrating high-resolution imagery with soil health, yield mapping, and crop growth parameters can help develop a decision support system to tailor sustainable management practices to improve profit margins, crop yield, and quality.
Water availability and accessibility pose a considerable challenge to maintaining sustainable agriculture. The future risk of water scarcity stems from catastrophic climate projections and environmental degradation of water and natural resources. Additionally, the ever-growing population intensifies the problem’s complexity, increasing the demand for water for food production and other uses. Thus, it is affecting the long-term sustainability of irrigation-based agriculture. Canada’s vulnerability to the effects of climate change has grown in recent years. For instance, in Prince Edward Island (PEI), there are currently more high-temperature days, fewer snowy days, and a shift in rainfall patterns. These climate changes could profoundly affect agriculture in the area, highlighting how urgent it is to address water-related problems for sustainable food production. Agriculture is a significant industry in PEI. The province is particularly famous for its potato production, with approximately 25% of the Canadian output (Canada, 2023). They contribute $1 billion every year to the PEI’s economy. Potatoes are relatively trickier to cultivate than other crops as the final yield remains underground and susceptible to restricted or excess water conditions, lowering tuber output, grade, and quality. Therefore, it is crucial to understand crop water requirements and adopt effective water management strategies (Barrett et al., 2023; Ierna, 2023). Evapotranspiration (ET) monitoring is critical for allocating water to the agricultural sector. Crop evapotranspiration reflects crop water need, which consists of water lost by transpiration from plant leaves and evaporation from the soil surface.
Crop ET evaluation is vital for sustainable agriculture to ensure the efficient use of water resources, boost crop yield, and lessen agriculture’s detrimental effects on the environment; hence, determining this parameter’s precise value is critical to regulating water consumption for irrigation (Mokhtari et al., 2019). PEI relies on rain-fed agriculture; however, changing rainfall patterns deeply threaten this type of farming. Farmers adopt supplemental irrigation, particularly in dry summer, to overcome this issue. Thus, accurate estimation of irrigation water is significant to maintaining groundwater sustainability, preventing farmers from over- or under-irrigation, which can lead to water waste or crop failure (Abbas et al., 2020).
Agriculture has long employed traditional techniques of crop ET estimation, such as the Penman–Monteith approach, the Hargreaves method, and the use of lysimeters or eddy covariance towers, which demand expensive equipment and installation. However, their accuracy depends on the accessibility of meteorological information, crop characteristics, and other site-specific factors. Recently, more modern approaches based on remote sensing and modeling techniques are gaining popularity because of their potential to produce more precise and spatially explicit estimations of crop ET. In addition, these remote sensing-based methods are cost-effective, easy to implement, and provide good coverage for even large-scale areas (Liou and Kar, 2014). Existing research indicates several techniques and tools for evaluating agricultural ET, but most research studies were limited to crop–weather models in PEI. Although some researchers have combined these models with machine learning, satellite-based remote sensing has not been investigated yet to estimate crop evapotranspiration (Farooque et al., 2021; Maqsood et al., 2022). To fill this gap, it is essential to utilize satellite-based observations for this region.
Using satellite imagery provides an alternative approach to traditional methods of estimating crop water requirements. Moreover, it also gives its distribution in space and time on a field and regional scale. Implementing the water balance theory on satellite-based vegetation indices helps assess actual crop evapotranspiration (ETc) (Maselli et al., 2020). These vegetation indices are also helpful in determining crop coefficient Kc and reference evapotranspiration (ETr). The Penman–Monteith equation is the principal method for computing ETr. The multiplication of ETr with crop coefficient (Kc) gives ETc. When evaluating the crop’s water requirements, Kc is an important quantity to consider. Its value can be obtained from the literature or any agriculture manual for a particular crop. Estimating reference crop evapotranspiration using the FAO-56 Penman–Monteith equation is a standard practice, and many researchers have used it in past works to obtain reliable findings (Ji et al., 2017; Hashemi and Sepaskhah, 2019; Moratiel et al., 2020; Liu et al., 2021; Ndulue and Ranjan, 2021). The fact behind this is that it includes all the critical metrological parameters, which are crucial for generating reliable results.
The normalized difference vegetation index (NDVI) is the most widely used of all vegetation indices (VIs) (Glenn et al., 2011). In healthy vegetation, near-infrared light is extremely reflective, partly because of the interior cellular structure of leaves. Apart from that, chlorophyll in plant cells absorbs red light to facilitate photosynthesis. Thus, the difference in red and near-infrared (NIR) light is reflected in the vegetation and shows the plant’s overall health. The amount of green vegetation reduces with increasing water stress, which causes a drop in NDVI. Moreover, NDVI may be used to track, assess, and locate water stress zones in crops. Since crop coefficients derived from VIs describe the conditions for crop growth and the spatial variability of that development, the computation of ETc is more accurate and real-time compared to tabular Kc (Daryanto et al., 2017; Romero-Trigueros et al., 2017). This information is helpful for the shareholders as they can spatially characterize the areas with significant differences in production and yield and make the right decisions in response to these variations (Atzberger, 2013; Tang et al., 2015).
The literature suggests that remotely sensed multispectral vegetation indices help quantify accurate ETc in croplands and at local scales (Virnodkar et al., 2020). Ihuoma and Madramootoo (2021) studied Sentinel-2A and 2B satellite mission data to estimate ETc based on crop vegetation indices. They used the FAO-56 Penman–Monteith module of AquaCrop software and validated it by achieving real-time results. Mahmoud and Gan (2019) estimated crop evapotranspiration using a MODIS satellite and developed a relationship between NDVI and Kc. Furthermore, they applied this relationship in soil–water balance models. Their results showed that these types of models and maps are helpful in sustainable water management for different crops. Hence, using this methodology can significantly increase the efficiency of water usage. This study aims to (i) develop a relationship between the Kc value from the FAO-56 handbook and NDVI derived from multispectral remotely sensed images at different spatial and temporal resolutions and (ii) determine the evapotranspiration for potato fields in PEI based on high-resolution imagery. The linear regression model was applied to generate field-level Kc maps. The standard Penman–Monteith method was used to determine ETr. Finally, the potato ETc maps were generated. The developed ETc maps will help growers estimate the water requirements of potato production in space and time at the local scale. Consequently, farmers are better equipped to decide when and how much water to apply to their crops, increasing resource efficiency. Moreover, policymakers will assess total irrigation water requirements for various crops.
The study was conducted in PEI for the growing season of 2021 and 2022. The mean temperatures in January and July were −8°C and 19°C, respectively (PEI Climate and Weather, 2022). Four potato fields, denoted as field 1(46° 27′ 51.948″N and 63° 40′ 23.124″W), field 2 (46° 20′ 42.972″ N and 63° 45′ 29.592″ W), field 3 (46°27′55.56″N and −63°40′9.70″W), and field 4 (46°18′29.43″N and 63°34′51.46″ W) located in PEI, Canada, were selected for this study (Figure 1; 2). All four fields belong to commercial agricultural farms.
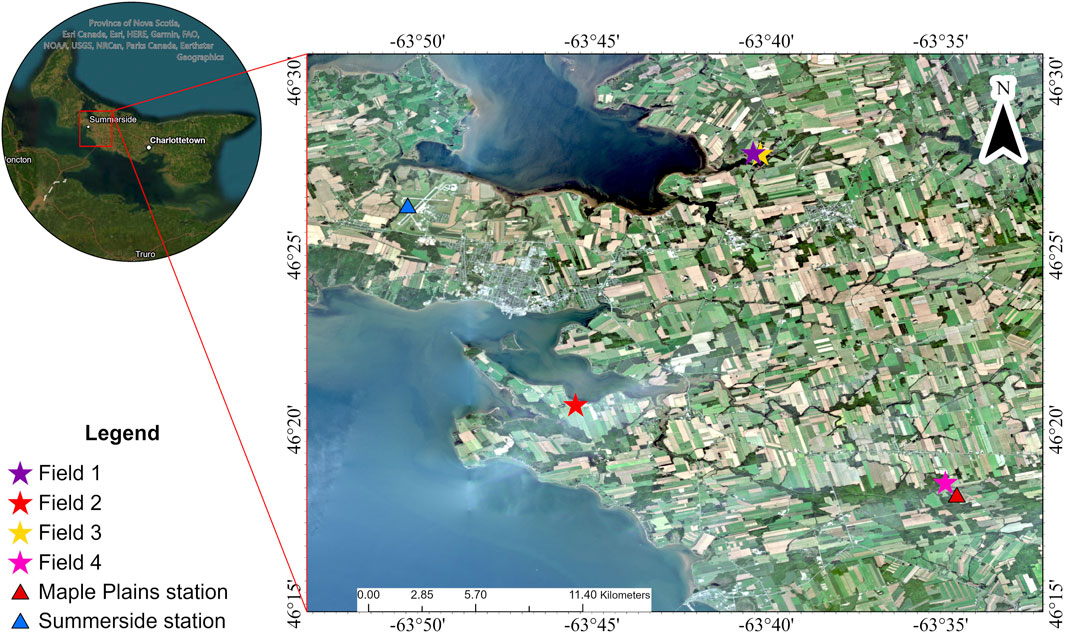
FIGURE 1. Study area location with an indication of selected potato fields (stars) and weather stations (triangles) in PEI. The natural color composition of Planet imagery was acquired in September 2021.
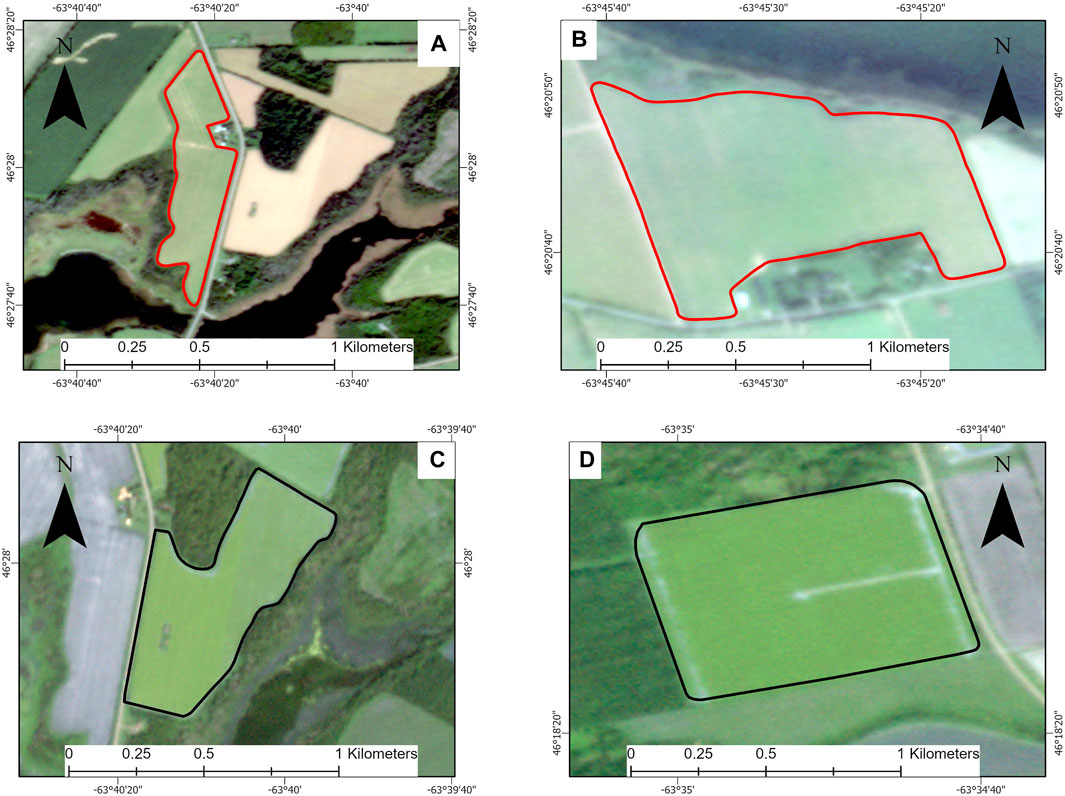
FIGURE 2. Field-scale layout of the selected potato fields. Field 1 (A) and field 2 (B) for the 2021 growing season; field 3 (C) and field 4 (D) for the 2022 growing season.
This study uses satellite imagery from Landsat 8, Sentinel-2A, and Planet acquired through the growing season. The attributes of all three satellites are stated in Table 1. Six cloud-free Landsat 8 images were downloaded during two crop seasons with a level correction of 2T from the USGS EarthExplorer site (https://earthexplorer.usgs.gov/). The spatial resolution of visible bands was 30 m. Sentinel-2A imagery was obtained from ESA’s website through Copernicus; 10 images at different growth stages were downloaded. High-resolution imagery covering 23 overpass dates (42 images) was obtained from Planet (www.planet.com) at 3 m spatial resolution for the 2021 and 2022 seasons. Table 2 displays the acquisition date, growth stage, and days after plantation for each year. To avoid data loss, all imagery was selected in this study based on criteria with less than 10% cloud. The processing of all imagery and NDVI calculation was carried out in ArcGIS Pro version 10.3.1 by ESRI.
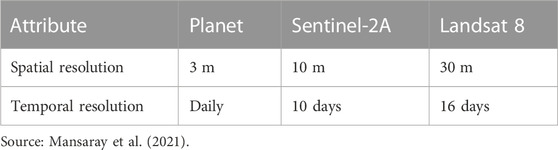
TABLE 1. Attributes of Landsat 8, Sentinel-2A, and Planet imagery.

TABLE 2. Satellite name, image acquisition dates, potato growth stages, and the day after plantation (DAP) when images were captured for the 2021 and 2022 growing seasons.
The data from two meteorological stations, namely, Summerside (46° 26′ 20″ N and 63° 50′ 17″ W) and Maple Plains (46° 18′ 10″N and 63° 34′ 32″W), located at elevations of 12.20 m and 45.70 m, respectively, were downloaded from the Environment Canada historical database for the 2021 and 2022 growing seasons. All four fields are located approximately 10–15 km from these stations. The daily Tmax, Tmin, Tmean, relative humidity, and wind speed were obtained to estimate reference evapotranspiration. The missing data values were calculated using the linear regression model on the related data from adjacent stations.
NDVI was calculated for all three satellites for the two growing seasons using ArcGIS Pro, as presented in the following equations:
For Landsat 8, NDVI was estimated as follows:
For Sentinel-2A, NDVI was estimated as follows:
For Planet, NDVI was estimated as follows:
As for each study field, three different sensors were used, having different spatial grids and resolutions. It is not possible to make comparisons on a pixel-by-pixel basis. Therefore, the mean NDVI value was extracted from all the resulting NDVI maps to present the entire potato field to avoid uncertainty and error in the results. These values were later used to develop a relationship between Kc and NDVI. The Kc values were adjusted according to the FAO manual for various potato growth phases through the crop season. In the FAO manual, potato-growing season has five stages with varying values of Kc. At the initial stage (20–30 days), Kc is 0.4–0.5; at the development stage (30–40 days), it is between 0.7 and 0.8, with an average value of 0.75; at the midseason stage (30–60 days), the values range between 1.05 and 1.2, with a mean value of 1.15; at the late-season stage (20–35 days), it is 0.85–0.95, with an average value of 0.85; and at maturity, the value is 0.7–0.75, with a mean value of 0.72. The value for a specific day in each growth stage was determined and adjusted according to the FAO manual (Allen et al., 1998). The relationship between NDVI obtained from each satellite image and the adjusted Kc values taken from FAO was established by applying a linear regression model for the growing seasons. An ANOVA (analysis of variance) was conducted at a 5% probability level to assess the model’s statistical significance and overall fit. The coefficient of determination R2 was used to determine the magnitude of variance between NDVI and Kc. The actual values of Kc were ascertained using the output regression equation. Accordingly, Kc maps were developed based on this relationship.
Based on the selected weather parameters, the FAO Penman–Monteith equation (Equation 4) was used to quantify reference evapotranspiration (mm day−1) (Mahmoud and Gan, 2019):
where
The multiplication of Kc values by ETr (equation 5) was performed to generate field-scale ETc maps in ArcGIS Pro. The resultant ETc maps were generated to observe crop water needs in space and time during the season.
The methodological framework for this study is shown in Figure 3. The two major inputs in the vegetation index method are satellite imagery and meteorological data.
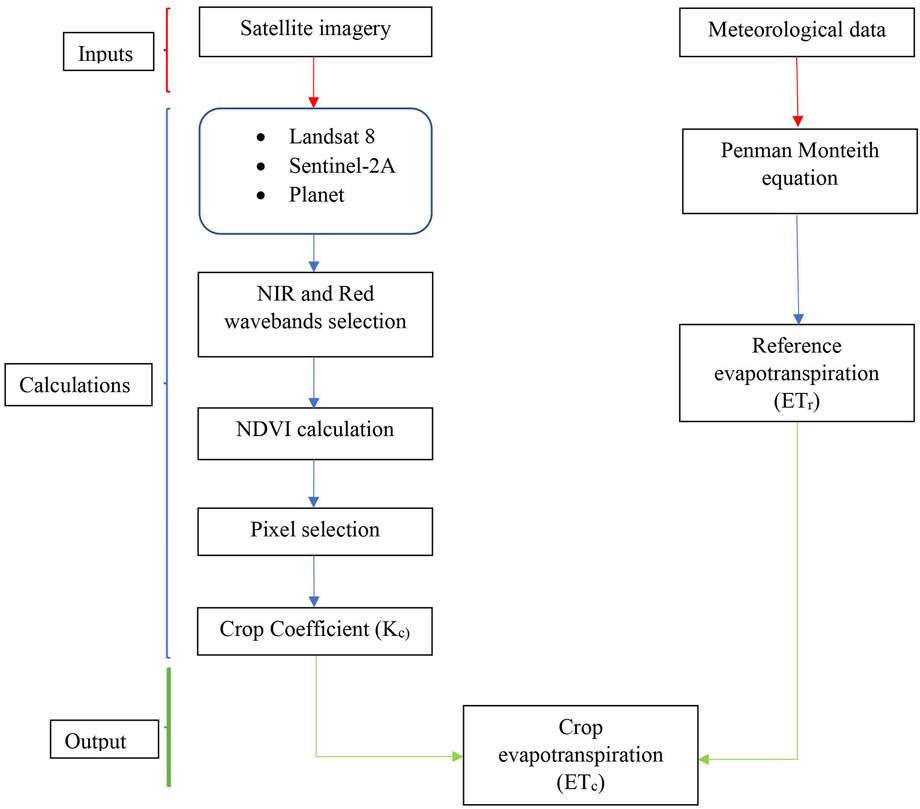
FIGURE 3. Flowchart of vegetation index-based evapotranspiration calculation for the potato crop.
NDVI maps produced as an output using Landsat 8, Sentinel-2A, and Planet were used to extract NDVI values. In contrast, Kc values were derived from the FAO manual for the two potato growing seasons. Figure 4 illustrates the association between Kc values and NDVI of four potato fields for the 2021 and 2022 growing seasons. Strong correlations were noted for the two fields in the 2021 season, with the R2 value equal to (field 1 = 1, field 2 = 1, p < 0.05) for Landsat 8, (field 1 = 0.94, field 2 = 0.91, p < 0.05) for Sentinel-2A, and (field 1 = 0.93, field 2 = 0.85, p < 0.05) for Planet. However, strong to moderate correlations were observed for the selected fields in 2022, with the R2 value equal to (field 3 = 0.8, field 4 = 0.73, p > 0.05) for Landsat 8, (field 3 = 0.88, field 4 = 0.89, p < 0.05) for Sentinel-2A, and (field 3 = 0.69, field 4 = 0.69, p < 0.05) for Planet. The resulting equations were employed to prepare Kc maps for the 2021 and 2022 growing seasons at different potato growth stages.
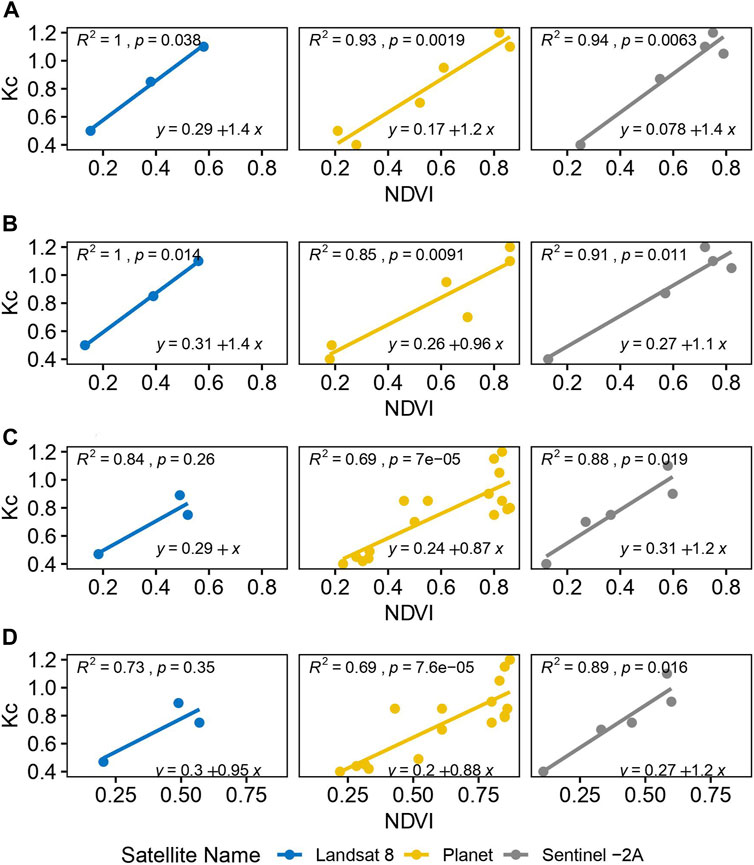
FIGURE 4. Linear relationship between NDVI derived from three different satellites and FAO-suggested Kc for two growing seasons. Field 1 (A), field 2 (B), field 3 (C), and field 4 (D).
The seasonal Kc values were obtained using the previously described regression equation. The stages of evolution of calculated Kc for the growing season 2021 for field 1 and field 2 are reported in Tables 3 and 4, respectively. For both areas, the overall trend of Kc evolution was similar in the estimation carried out with all three satellites. At the initial stage, the mean Kc values were low (May and June), with maximum values at the midseason stage (July and August), and the values declined afterward (September). The trends of calculated Kc values in terms of date after plantation (DAP) for the growing season 2022 for fields 3 and 4 are reported in Tables 5 and 6, respectively. In June, the mean Kc values were low at the initial stage of potato growth. Maximum mean Kc values were observed at development and midseason (July and August), and the values decreased afterward (September). These descriptive value tables represent the evolution of Kc over 2 years. It is clear from these tables that Kc values are different for different satellites. For example, in Table 3, the value at DAP 8 for Sentinel-2A is lower than that for Planet. Similarly, in Table 6, at DAP 125, the Kc value for Sentinel-2A is greater than that for Planet.
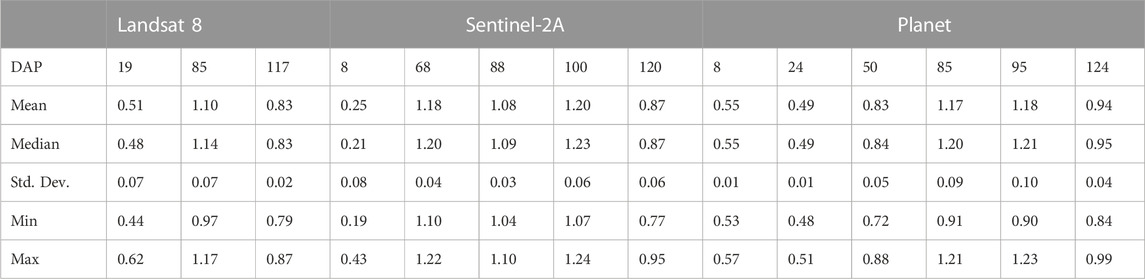
TABLE 3. Descriptive statistics for Kc values obtained from Landsat 8, Sentinel-2A, and Planet images for the 2021 growing season (field 1).
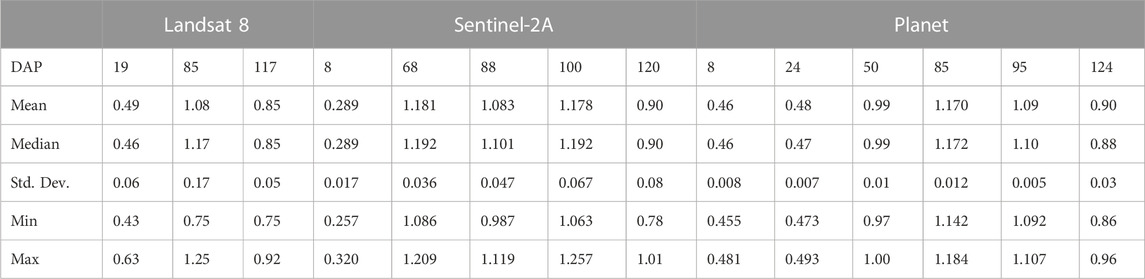
TABLE 4. Descriptive statistics for Kc values obtained from Landsat 8, Sentinel-2A, and Planet images for the 2021 growing season (field 2).
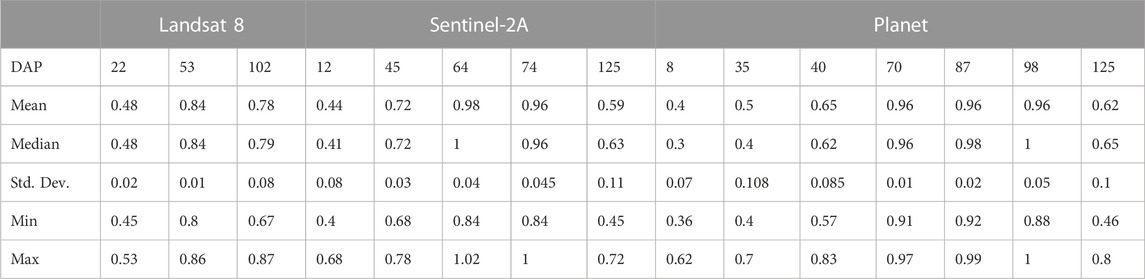
TABLE 5. Descriptive statistics for Kc values obtained from Landsat 8, Sentinel-2A, and Planet images for the 2022 growing season (field 3).
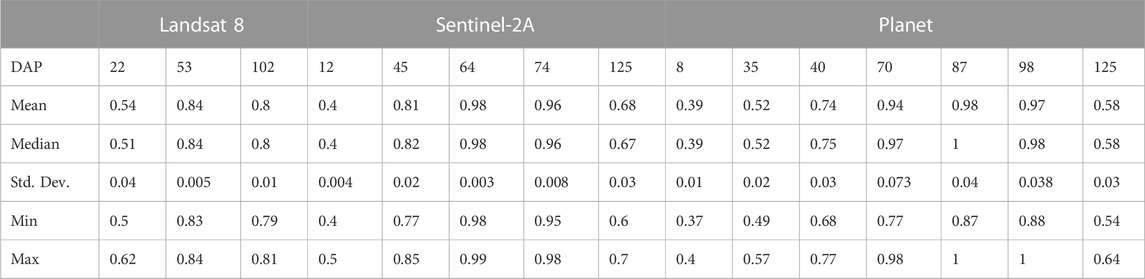
TABLE 6. Descriptive statistics for Kc values obtained from Landsat 8, Sentinel-2A, and Planet images for the 2022 growing season (field 4).
Unfortunately, some images with over 10% cloud cover were skipped since the variation in the temporal resolutions of the three satellites prevented them from being captured. Comparing data from the three satellites for dates of a similar overpass remains challenging. However, data from three satellites provided ample coverage for the whole season. For the two growing seasons, the time-series maps for one field from each year are presented in the paper, as there was no significant difference in the fields throughout one season. Figures 5 and 6 show spatial and temporal variability in Kc for field 1 (2021) and field 3 (2022), respectively. In Figure 6, at the initial growth stage (DAP 8, DAP 10, and DAP 35), the Kc values were minimum, which gradually increased at the development stage (DAP 40 and DAP 62). Afterward, in midseason (DAP 70, DAP 72, and DAP 77), the Kc values reached maximum (light to dark apple green). After all, at a late stage, Kc values started to decline again (DAP 98 and 101), with minimum values at DAP 120 and DAP 125. The maps generated from Planet imagery are smoother and more information-rich than those generated from Sentinel-2A and Landsat 8. This is undoubtedly due to the difference in spatial and temporal resolutions.
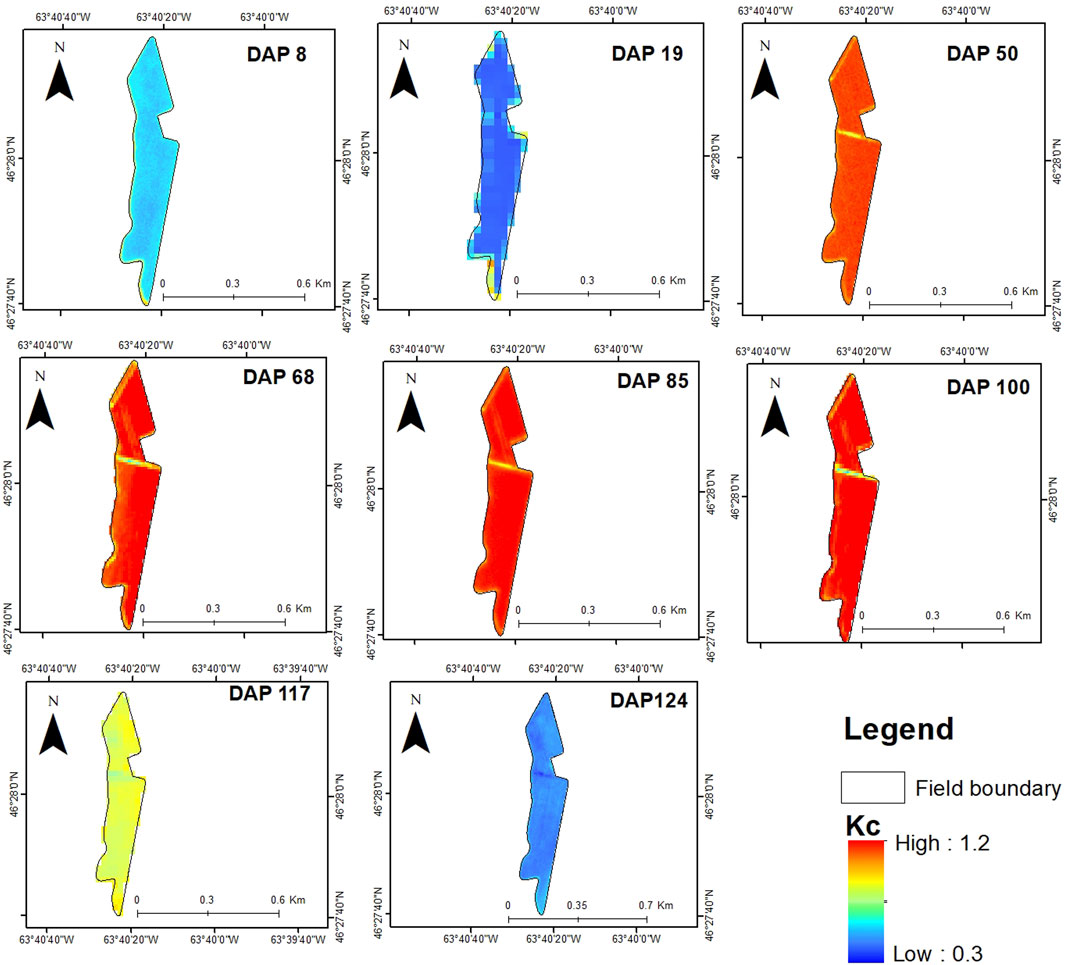
FIGURE 5. Kc time-series maps for the 2021 growth season, generated using Landsat 8 (DAP 19 and DAP 117), Sentinel-2A (DAP 68 and DAP 100), and Planet (DAP 8, DAP 50, DAP 85, and DAP 124) imagery for field 1.
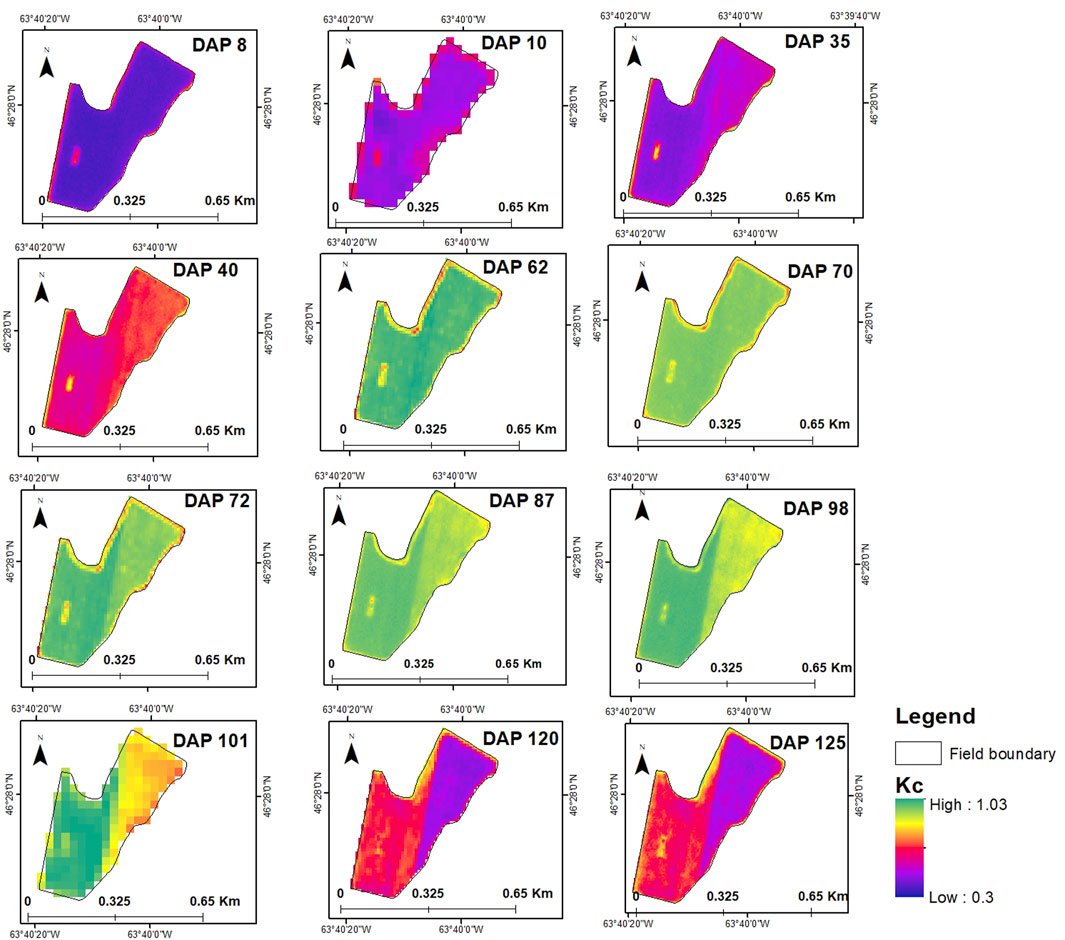
FIGURE 6. Kc time-series maps for the potato crop generated using Landsat 8 (DAP 10 and DAP 101), Sentinel-2A (DAP 62 and DAP 72 and DAP 120), and Planet (DAP 8, DAP 35, DAP 40, DAP 70, DAP 87, DAP 98, and DAP 125) imagery for field 3 during the 2022 growth season.
Figure 7 displays the linear relationship between Kc from the table and Kc estimated from Kc maps. The selected fields showed a significant correlation for the growing season of 2021, with R2 = 1, p < 0.05 (Landsat 8), R2 = 0.97, p < 0.05 (Sentinel-2A), and R2 = 0.9, p < 0.05 (Planet). For the growth season of 2022, Landsat 8 and Sentinel-2A showed a notable but statistically insignificant association, with R2 = 0.79, p > 0.05 and R2 = 0.64, p > 0.05, respectively. This could be caused by insufficient soil moisture, other crop characteristics, and climatic factors. For the 2022 season, the findings from Planet imagery showed a positive connection, with R2 = 0.72, p < 0.05.
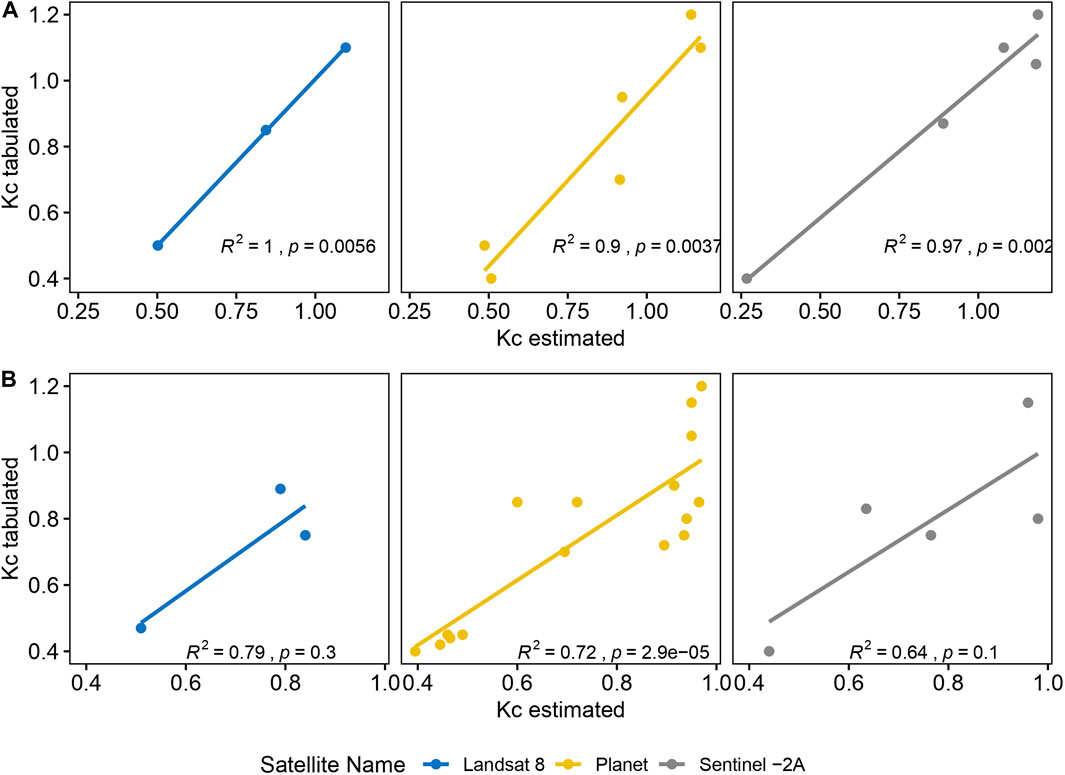
FIGURE 7. Relationship between Kc tabulated and Kc estimated for the two seasons. 2021 (A) and 2022 (B).
The field-scale ETc maps explain crop water requirement’s spatial and temporal variability at different growth stages. Farmers and water managers may identify regions of high or low water consumption within a field by developing ETc maps, which can help them better manage irrigation and water resources. ETc maps in a time series (Figure 8) explain evapotranspiration variability at different growth stages for field 1 during the 2021 season. DAP 8 and DAP 19 represent the initial stage (light to dark blue). At DAP 50, ETc (mm/day) values increased, and the development stage (green and yellow color) started. At midseason, the values reached maximum (DAP 68, DAP 85, and DAP 100) (orange color). The values declined again at a late stage (DAP 117 and DAP 124). For the 2022 season, Figure 9 shows the variation in evapotranspiration values for field 3. ETc (mm/day) values were lower at the initial stage (DAP 8, DAP 10, and DAP 35), blue to green, indicating that the crop transpires less water. The value started to increase at the development stage (DAP 40 and DAP 62) and reached its peak at the midseason stage (DAP 70, DAP 72, and DAP 87), shown in brown color. In the late season (DAP 98, DAP 101, DAP 120, and DAP 125), the values declined again (green to blue color).
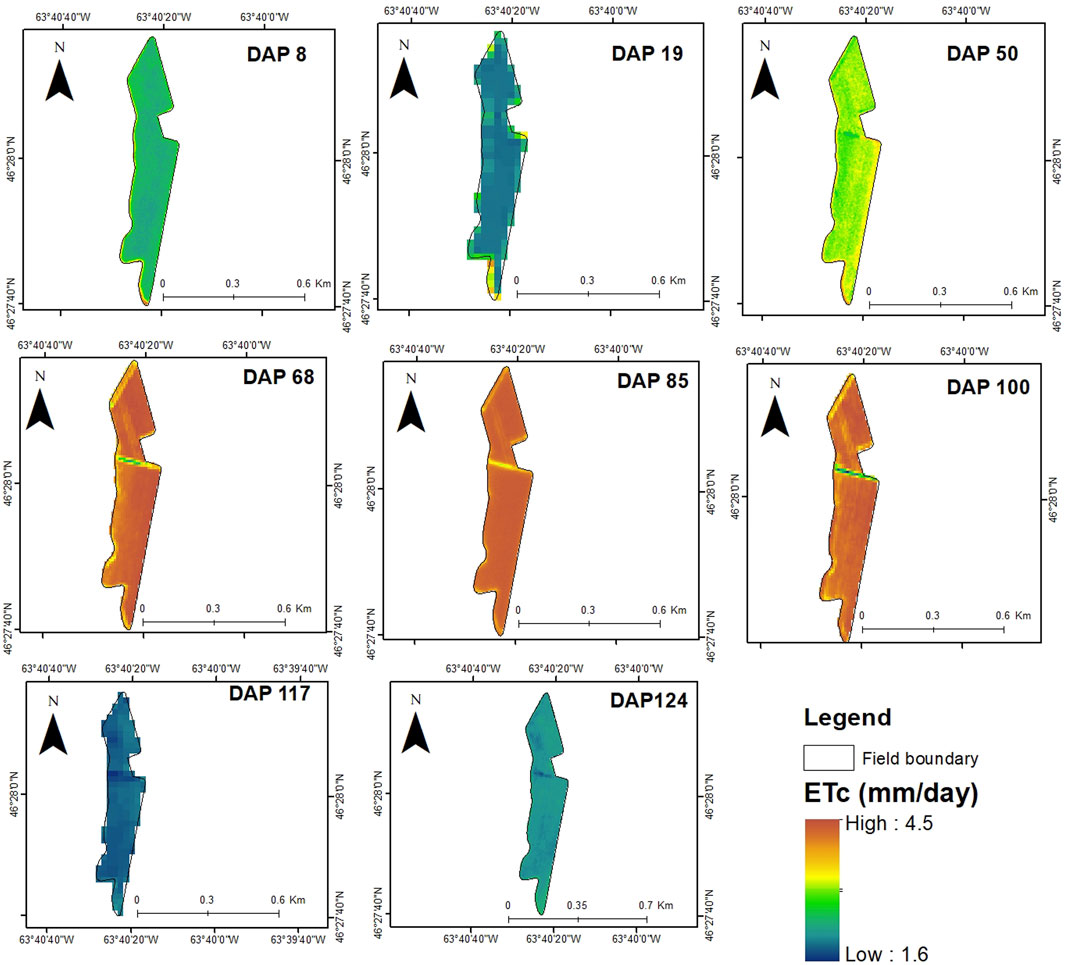
FIGURE 8. Potato ETc (mm/day) time-series maps for the 2021 growth season generated using Landsat 8 (DAP 19 and DAP 117), Sentinel-2A (DAP 68 and DAP 100), and Planet (DAP 8, DAP 50, DAP 85, and DAP 124) imagery for field 1.
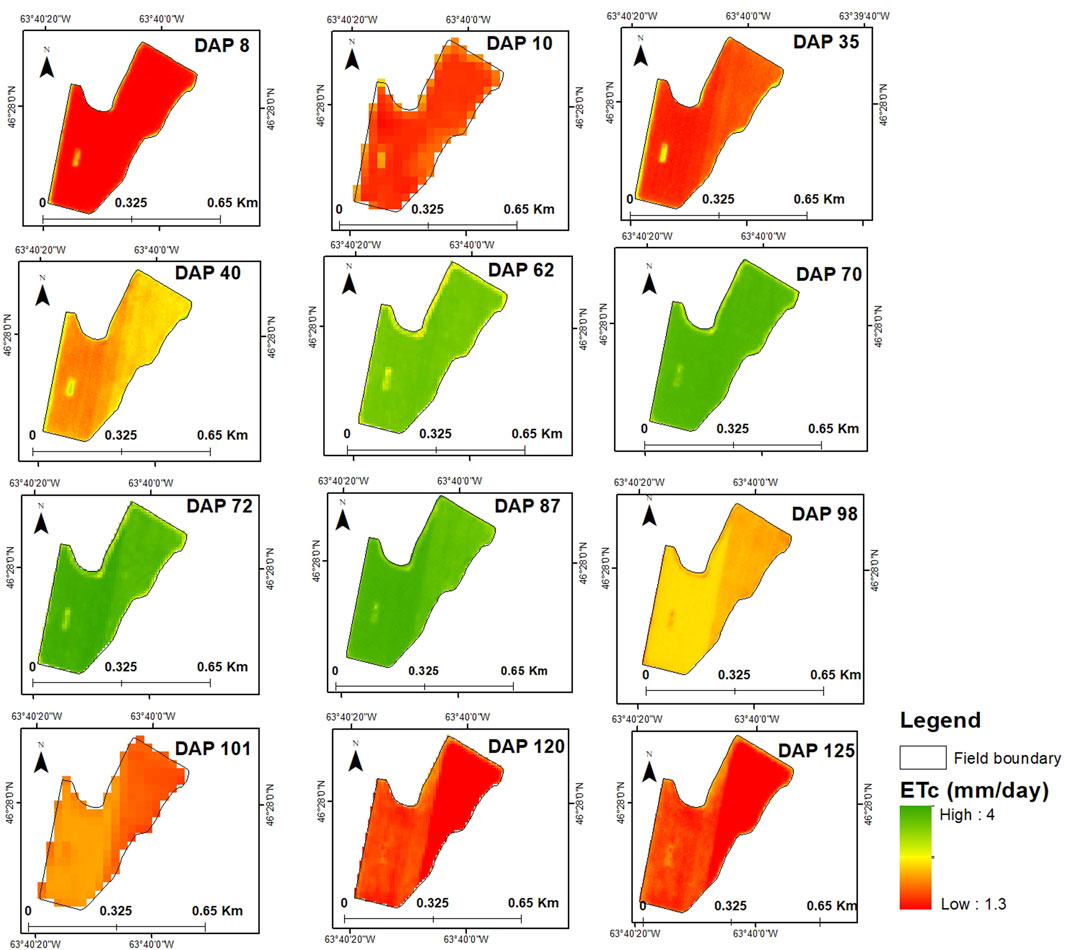
FIGURE 9. Potato ETc (mm/day) time-series maps for the 2022 growth season generated using Landsat 8 (DAP 10 and DAP 101), Sentinel-2A (DAP 62, DAP 72, and DAP 120), and Planet (DAP 8, DAP 35, DAP 40, DAP 70, DAP 87, DAP 98, and DAP 125) imagery for field 3.
Consequently, at the initial stage, water requirement is low as ETc values are minimum, and at midseason, water requirement is high to compensate for water loss because ETc is high. The comparison of average evapotranspiration values determined using different satellites for two growing seasons is shown in Table 7. ETc values were slightly lower in the 2022 season compared to 2021. The values at the development stage in 2021 (Landsat 8 and Sentinel-2A) and the midseason stage in 2022 (Landsat 8) are missing because no imagery was available on those stages as per the criteria.
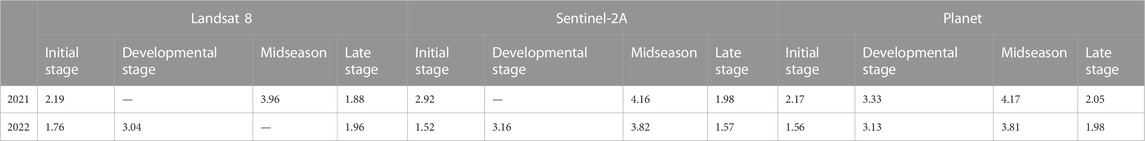
TABLE 7. Average values for ETc (mm/day) for Landsat 8, Sentinel-2A, and Planet at different potato growth stages, observed over 2 years (2021 and 2022).
This study employed and evaluated the vegetation index-based method to estimate ETc for the potato crop in PEI for two growing seasons. The use of satellite-based models to calculate crop evapotranspiration offers the possibility of simplifying and improving water management and irrigation scheduling. Notably, there is limited work addressing the implementation of such models using three different sensors in the context of PEI. Most of the previous analyses were based on traditional methods like the Hargreaves and Penman–Monteith methods. However, some studies have pointed out digital agriculture and the use of new technology (Afzaal et al., 2019; Zebarth et al., 2021), but there is still a lot to explore. It is essential to incorporate remote sensing-based crop monitoring with high spatial–temporal resolution for potato crops in Prince Edward Island.
In comparison to Planet NDVI data, Sentinel-2A and Landsat 8 data demonstrated a stronger alignment with FAO-recommended Kc for the 2021 season; these results are in agreement with Zebarth et al. (2021) who created a linear relationship between NDVI and Kc using remote sensing imagery for Leamington, Ontario, Canada. Their study assessed Planet and Sentinel-2A and 2B images for estimating the crop coefficient (Kc) and developed a connection between Kc and NDVI to calculate crop evapotranspiration. The accuracy of remote sensing-derived evapotranspiration estimations was confirmed by comparing them with evapotranspiration data obtained from the AquaCrop simulation model. The findings indicate that combining data from satellite imagery with metrological data can produce a more accurate estimate of crop water requirements. Singha and Swain (2022) reported a similar relationship as they studied rice and potato crops in India. In this study, the coefficient representing the relationship between NDVI and Kc for the 2022 season decreased significantly, notably for Sentinel-2A and Planet satellite imagery. This decrease in the coefficient might be linked to the influence of Hurricane Fiona, which hit Prince Edward Island (PEI) toward the end of September, right at the time of the potato-harvesting season. Indeed, it is imperative that the harvest must be taken out from the field before the occurrence of the first frost. However, the saturated conditions in the fields hampered the harvesting process, resulting in delayed potato extraction. Furthermore, as stated by authoritative sources, this weather phenomenon resulted in an issue of excessive moisture (Admin, 2022). The post-storm images from Sentinel-2A and Planet showed crop damage and poor NDVI. However, for Landsat 8, the study showed no statistically significant association between Kc and NDVI (p > 0.05), possibly due to limited variation in Kc or NDVI within the dataset. Overall, in the two growing seasons, the relationship between NDVI and Kc was linear because both NDVI and Kc values were lower at the beginning of the season, reached the maximum in the mid-stage, and declined afterward. The difference in R2 values from this relationship might be due to some variation in climatic conditions like the moisture of the soil surface because sufficient soil moisture promotes healthy vegetation and interacts with rainfall, temperature, and solar radiation, all of which affect plant development and the NDVI–Kc relationship (Duarte, 2022). A similar linear relationship is reported by Hassan et al. (2022). The Kc values estimated from this relationship can be a solid parameter for calculating crop evapotranspiration. Georgios et al. (2010) developed a potato crop coefficient based on the spectral vegetation index and found similar results. The Kc values estimated from the vegetation reflectance from NDVI maps showed the same evolution trend for both potato fields as FAO-suggested Kc. Similar results were reported by Paredes et al. (2018), Georgios et al. (2010), Allen et al. (2020), and Kadam et al. (2021).
The estimated Kc values and ETr were used to create field-scale ETc maps. Similar field-scale ETc maps for a variety of crops were reported by Vanino et al. (2018), Nocco et al. (2019), and Farg et al. (2012) who also found a similar trend of crop evapotranspiration in different crops. The peak evapotranspiration rates were observed at the midseason, while the lowest evapotranspiration rates were observed at the initial growth stage. When the satellite readings were analyzed, the correlation between Kc and NDVI was found to be positive for all three satellites. There is no discernible difference in R2 values across the three satellites in 2021; however, in 2022, Landsat 8 showed an insignificant relationship. Overall, the study revealed that the Sentinel-2A platform outperformed Landsat 8 and Planet. This is because a different number of images represented each growth stage, and the overpass dates were not the same. A good comparison may be established if the overpass dates are the same. However, owing to cloud cover, this remains a challenge. The findings show that crop water requirements vary significantly in space and time throughout the growing season, which recommends using a satellite-based process to check plants’ development conditions.
The use of vegetation indices generated from multispectral satellite images demonstrated its effectiveness in this study. However, it is critical to recognize certain limitations of multispectral sensors. One such limitation is its spatial resolution, which is generally in the meter range. This resolution inadequately addresses the demands of crops with clustered structures, such as vines and trees. Furthermore, as previously observed (Liou and Kar, 2014; Niu et al., 2019), the temporal limitations imposed by the infrequent satellite overpass might hamper thorough data collection. To address these constraints, our approach integrated the imagery from three sensors with different spatial and temporal resolutions. Futuristic research should emphasize the integration of drone images along with satellite imagery to increase the frequency of observations. Furthermore, modern data fusion techniques, such as BESS-STAIR (Jiang et al., 2020) and satellite data fusion with eddy covariance (Mbabazi et al., 2023), as well as the use of hyperspectral and thermal bands, have the potential to improve the approach (Ghaderizadeh et al., 2022). Furthermore, non-crop elements, such as soil type (Zamani et al., 2022), soil moisture, and background vegetation, can all alter NDVI readings, introducing noise into the ET calculation process. To address these issues and enhance the method’s universality, it is important to extend its application across diverse regions and crop types, ensuring its effectiveness in a broader context.
This study used a satellite-based vegetation index approach to create field-scale ETc (crop evapotranspiration) maps for potato farming in Prince Edward Island, Canada. The results of the study showed that for both growing seasons under consideration, there was a significant correlation between NDVI, which was obtained from three different satellite images, and Kc (crop coefficient) values obtained from the FAO manual. Results from the three sensors used in this study were real-time and showed slight fluctuations. Notably, Sentinel-2A surpassed all others during the 2022 season, whereas Landsat 8 produced statistically insignificant results. In addition, this study supported NDVI as a reliable indicator for measuring agricultural water stress, among other metrics considered. Notably, the field-scale ETc maps created for this study revealed different values for each developmental stage, with noticeably lower ETc levels at the beginning and higher ETc levels in the midseason. These maps help assess the variability in crop water consumption throughout the growing season.
According to our results, we may infer that ETc maps generated using multispectral remote sensing techniques are an excellent tool for precise crop water consumption estimation. The effective use of these maps can improve irrigation scheduling techniques, increasing water efficiency. Such improvements could provide significant advantages to the agriculture industry in Prince Edward Island.
The raw data supporting the conclusion of this article will be made available by the authors, without undue reservation.
FI: conceptualization, formal analysis, investigation, methodology, software, validation, visualization, writing–original draft, and writing–review and editing. AF: conceptualization, funding acquisition, project administration, resources, supervision, and writing–review and editing. XW: conceptualization, software, supervision, visualization, and writing–review and editing. FA: conceptualization, methodology, supervision, and writing–review and editing. HA: data curation, investigation, methodology, software, and writing–review and editing. TE: data curation, methodology, supervision, validation, and writing–review and editing. BA: formal analysis, methodology, supervision, and writing–review and editing. QZ: methodology, supervision, and writing–review and editing.
The author(s) declare that financial support was received for the research, authorship, and/or publication of this article. This research was funded by the Natural Science and Engineering Council of Canada, the Department of Agriculture and Land, the Government of Prince Edward, and the Prince Edward Island Potato Board.
The authors declare that the research was conducted in the absence of any commercial or financial relationships that could be construed as a potential conflict of interest.
The author(s) declared that they were an editorial board member of Frontiers, at the time of submission. This had no impact on the peer review process and the final decision
All claims expressed in this article are solely those of the authors and do not necessarily represent those of their affiliated organizations, or those of the publisher, the editors, and the reviewers. Any product that may be evaluated in this article, or claim that may be made by its manufacturer, is not guaranteed or endorsed by the publisher.
Abbas, F., Farooque, A. A., and Afzaal, H. (2020). Homogeneity in patterns of climate extremes between two cities—a potential for flood planning in relation to climate change. Water 12 (3), 782. doi:10.3390/w12030782
Admin, (2022). Storm aftermath threatens P.E.I. Potato farms | the western ProducerThe western producer. Available from: https://www.producer.com/news/storm-aftermath-threatens-p-e-i-potato-farms/ (Accessed April 05, 2023).
Afzaal, H., Farooque, A. A., Abbas, F., Acharya, B., and Esau, T. (2019). Groundwater estimation from major physical hydrology components using artificial neural networks and deep learning. Water 12 (1), 5. doi:10.3390/w12010005
Allen, R. G., Pereira, L. S., Raes, D., and Smith, M. (1998). Crop evapotranspiration-Guidelines for computing crop water requirements-FAO Irrigation and drainage paper 56. Fao, Rome 300 (9), D05109.
Allen, R. P., Robison, C. W., Huntington, J. L., Wright, J. D., and Kilic, A. (2020). Applying the FAO-56 dual kc method for irrigation water requirements over large areas of the western U.S. Trans. ASABE 63 (6), 2059–2081. doi:10.13031/trans.13933
Atzberger, C. (2013). Correction: atzberger, C. Advances in remote sensing of agriculture: context description, existing operational monitoring systems and major information needs. Remote sens. 2013, 5, 949–981. Remote Sens. 5 (8), 4124. doi:10.3390/rs5084124
Barrett, R., Robinson, A., Thornton, M., and VanderZaag, P. (2023). Potato production in the United States and Canada. Potato Prod. Worldw., 365–379. doi:10.1016/b978-0-12-822925-5.00009-8
Canada (2023). Canadian potato production. Available from: https://www150.statcan.gc.ca/n1/en/catalogue/22-008-X (Accessed March 15, 2023).
Daryanto, S., Wang, L., and Jacinthe, P.-A. (2017). Global synthesis of drought effects on cereal, legume, tuber and root crops production: a review. A Rev. 179, 18–33. doi:10.1016/j.agwat.2016.04.022
Duarte, (2022). Determination of crop coefficient (kc) based on machine learning NDVI time series models. Available from: http://hdl.handle.net/10071/27012 (Iscte-iul.pt.
Farg, E., Yasir Arafat, S. M., El-Wahed, M. S. A. A., and El-Gindy, A. M. (2012). Estimation of evapotranspiration ETc and crop coefficient kc of wheat, in south nile delta of Egypt using integrated FAO-56 approach and remote sensing data. J. Remote. Sens. Space Sci. 15 (1), 83–89. doi:10.1016/j.ejrs.2012.02.001
Farooque, A. A., Afzaal, H., Abbas, F., Bos, M., Maqsood, J., Wang, X., et al. (2021). Forecasting daily evapotranspiration using artificial neural networks for sustainable irrigation scheduling. Irrig. Sci. 40 (1), 55–69. doi:10.1007/s00271-021-00751-1
Georgios, P., Diofantos, H. G., Kyriacos, T., and Leonidas, T. (2010). Spectral vegetation indices from field spectroscopy intended for evapotranspiration purposes for spring potatoes in Cyprus. doi:10.1117/12.865126
Ghaderizadeh, S., Abbasi-Moghadam, D., Sharifi, A., Tariq, A., and Qin, S. (2022). Multiscale dual-branch residual spectral–spatial network with attention for hyperspectral image classification. IEEE J. Sel. Top. Appl. Earth Obs. Remote Sens. 15, 5455–5467. doi:10.1109/jstars.2022.3188732
Glenn, E. P., Christopher, , Hunsaker, D. J., and Nagler, P. L. (2011). Vegetation index-based crop coefficients to estimate evapotranspiration by remote sensing in agricultural and natural ecosystems. Hydrol. Process. 25 (26), 4050–4062. doi:10.1002/hyp.8392
Hashemi, M., and Ali Reza Sepaskhah, (2019). Evaluation of artificial neural network and Penman–Monteith equation for the prediction of barley standard evapotranspiration in a semi-arid region. Theor. Appl. Climatol. 139 (1-2), 275–285. doi:10.1007/s00704-019-02966-x
Ihuoma, S. O., and Madramootoo, C. A. (2021). Satellite observations of variability in evapotranspiration over an intensive tomato producing region of southern Ontario, Canada. doi:10.13031/irrig.2020-079
Ji, X. B., Chen, J. C., Zhao, W., Kang, E.-T., Jin, B. N., and Yang, H. (2017). Comparison of hourly and daily Penman-Monteith grass- and alfalfa-reference evapotranspiration equations and crop coefficients for maize under arid climatic conditions. Agric. Water Manag. 192, 1–11. doi:10.1016/j.agwat.2017.06.019
Jiang, C., Guan, K., Pan, M., Ryu, Y., Peng, B., and Wang, S. (2020). BESS-STAIR: a framework to estimate daily, 30 m, and all-weather crop evapotranspiration using multi-source satellite data for the US Corn Belt. Earth Syst. Sci. 24 (3), 1251–1273. doi:10.5194/hess-24-1251-2020
Koyo, P., Hu, J., and Amou, M. (2020). Analysis of spatiotemporal features of cassava evapotranspiration in Benin using integrated FAO-56 method and terra/MODIS data. J. Agric. Sci. 12 (8), 106. doi:10.5539/jas.v12n8p106
Liou, Y.-A., and Kar, S. K. (2014). Evapotranspiration estimation with remote sensing and various surface energy balance algorithms—a review. Energies 7 (5), 2821–2849. doi:10.3390/en7052821
Liu, Y., Zhang, S., Zhang, J., Tang, L., and Bai, Y. (2021). Using artificial neural network algorithm and remote sensing vegetation index improves the accuracy of the penman-monteith equation to estimate cropland evapotranspiration. Appl. Sci. 11 (18), 8649. doi:10.3390/app11188649
Mahmoud, S. H., and Gan, T. Y. (2019). Irrigation water management in arid regions of Middle East: assessing spatio-temporal variation of actual evapotranspiration through remote sensing techniques and meteorological data. Agric. Water Manag. 212, 35–47. doi:10.1016/j.agwat.2018.08.040
Mansaray, A. S., Dzialowski, A. R., Martin, M. S., Wagner, K., Gholizadeh, H., and Stoodley, S. H. (2021). Comparing PlanetScope to landsat-8 and sentinel-2 for sensing water quality in reservoirs in agricultural watersheds. Remote Sens. 13 (9), 1847. doi:10.3390/rs13091847
Maqsood, J., Farooque, A. A., Abbas, F., Esau, T., Wang, X., Acharya, B., et al. (2022). Application of artificial neural networks to Project reference evapotranspiration under climate change scenarios. Water Resour. Manag. 36 (3), 835–851. doi:10.1007/s11269-021-02997-y
Maselli, F., Chiesi, M., Angeli, L., Luca Fibbi, B. R., Romani, M., et al. (2020). An improved NDVI-based method to predict actual evapotranspiration of irrigated grasses and crops. Agric. Water Manag. 233, 106077. doi:10.1016/j.agwat.2020.106077
Mbabazi, D., Mohanty, B. P., and Gaur, N. (2023). High spatio-temporal resolution evapotranspiration estimates within large agricultural fields by fusing eddy covariance and Landsat based data. Agric. For. Meteorol. 333, 109417. doi:10.1016/j.agrformet.2023.109417
Mokhtari, A., Noory, H., Pourshakouri, F., Haghighatmehr, P., Afrasiabian, Y., Razavi, M., et al. (2019). Calculating potential evapotranspiration and single crop coefficient based on energy balance equation using Landsat 8 and Sentinel-2. ISPRS J. Photogramm. 154, 231–245. doi:10.1016/j.isprsjprs.2019.06.011
Moratiel, R., Bravo, R., Saa, A., Tarquis, A. M., and Almorox, J. (2020). Estimation of evapotranspiration by the food and agricultural organization of the united nations (FAO) penman–monteith temperature (PMT) and hargreaves–samani (HS) models under temporal and spatial criteria – a case study in duero basin (Spain). Nat. Hazards Earth Syst. Sci. 20 (3), 859–875. doi:10.5194/nhess-20-859-2020
Ndulue, E. L., and Sri Ranjan, R. (2021). Performance of the FAO Penman-Monteith equation under limiting conditions and fourteen reference evapotranspiration models in southern Manitoba. Theor. Appl. Climatol. 143 (3-4), 1285–1298. doi:10.1007/s00704-020-03505-9
Niu, H., Zhao, T., Tang, B. Z., and Chen, Y. (2019). Estimating evapotranspiration with UAVs in agriculture: a review. doi:10.13031/aim.201901226
Nocco, M. A., Zipper, S. C., Booth, E. G., Cummings, C., Loheide, S. P., and Kucharik, C. J. (2019). Combining evapotranspiration and soil apparent electrical conductivity mapping to identify potential precision irrigation benefits. Remote Sens. 11 (21), 2460. doi:10.3390/rs11212460
Paredes, P., D’Agostino, D., Assif, M., Todorovic, M., and Pereira, L. S. (2018). Assessing potato transpiration, yield and water productivity under various water regimes and planting dates using the FAO dual K c approach. Agric. Water Manag. 195, 11–24. doi:10.1016/j.agwat.2017.09.011
Pei Climate, , and Weather, (2022). Government of Prince edward Island. Available from: https://www.princeedwardisland.ca/en/information/environment-energy-and-climate-action/pei-climate-and-weather (Accessed March 15, 2023).
Romero Trigueros, C., Antonio, P., Juan José Alarcón, , Hunink, J. E., Serrano, D., Contreras, S., et al. (2017). Effects of saline reclaimed waters and deficit irrigation on Citrus physiology assessed by UAV remote sensing. Agric. Water Manag. 183, 60–69. doi:10.1016/j.agwat.2016.09.014
Senay, G. B., Friedrichs, M., Singh, R. K., and Naga Manohar Velpuri, (2016). Evaluating Landsat 8 evapotranspiration for water use mapping in the Colorado River Basin. Remote Sens. Environ. 185, 171–185. doi:10.1016/j.rse.2015.12.043
Singha, C., and Swain, K. C. (2022). Evaluating the NDVI based rice and potato YieldPrediction map using GIS geostatistical environment. doi:10.1109/icaect54875.2022.9807981
Tang, D., Qin, B., Feng, X., and Liu, T. (2015). Effective LSTMs for target-dependent sentiment classification. Available from: https://arxiv.org/abs/1512.01100 (Accessed May 23, 2023).
Vanino, S., Nino, P., Michele, C. D., Falanga Bolognesi, S., D'Urso, G., Di Bene, C., et al. (2018). Capability of Sentinel-2 data for estimating maximum evapotranspiration and irrigation requirements for tomato crop in Central Italy. Remote Sens. Environ. 215, 452–470. doi:10.1016/j.rse.2018.06.035
Virnodkar, S. S., Pachghare, V. K., Patil, V. B., and Jha, S.Kr. (2020). Remote sensing and machine learning for crop water stress determination in various crops: a critical review. Precis. Agric. 21 (5), 1121–1155. doi:10.1007/s11119-020-09711-9
Zamani, A., Sharifi, A., Felegari, S., Tariq, A., and Zhao, N. (2022). Agro climatic zoning of saffron culture in miyaneh city by using WLC method and remote sensing data. Agriculture 12 (1), 118. doi:10.3390/agriculture12010118
Keywords: crop evapotranspiration, irrigation scheduling, high-resolution imagery, sustainable agriculture, soil and water conservation
Citation: Imtiaz F, Farooque A, Wang X, Abbas F, Afzaal H, Esau T, Acharya B and Zaman Q (2023) Mapping crop evapotranspiration with high-resolution imagery and meteorological data: insights into sustainable agriculture in Prince Edward Island. Front. Remote Sens. 4:1274019. doi: 10.3389/frsen.2023.1274019
Received: 07 August 2023; Accepted: 29 September 2023;
Published: 18 October 2023.
Edited by:
Fulin Luo, Chongqing University, ChinaReviewed by:
Tan Guo, Chongqing University of Posts and Telecommunications, ChinaCopyright © 2023 Imtiaz, Farooque, Wang, Abbas, Afzaal, Esau, Acharya and Zaman. This is an open-access article distributed under the terms of the Creative Commons Attribution License (CC BY). The use, distribution or reproduction in other forums is permitted, provided the original author(s) and the copyright owner(s) are credited and that the original publication in this journal is cited, in accordance with accepted academic practice. No use, distribution or reproduction is permitted which does not comply with these terms.
*Correspondence: Aitazaz Farooque, YWZhcm9vcXVlQHVwZWkuY2E=
Disclaimer: All claims expressed in this article are solely those of the authors and do not necessarily represent those of their affiliated organizations, or those of the publisher, the editors and the reviewers. Any product that may be evaluated in this article or claim that may be made by its manufacturer is not guaranteed or endorsed by the publisher.
Research integrity at Frontiers
Learn more about the work of our research integrity team to safeguard the quality of each article we publish.