 Dorothy Menefee
 Trey O. Lee1
 Jiquan Chen
 Michael Abraha
- 1Grassland Soil and Water Research Laboratory, United States Department of Agriculture - Agricultural Research Service, Temple, TX, United States
- 2Landscape Ecology and Ecosystem Science (LEES), Michigan State University, East Lansing, MI, United States
- 3Soil and Water Management Research, United States Department of Agriculture - Agricultural Research Service, St. Paul, MN, United States
- 4Institute of Agriculture and Natural Resources, University of Nebraska-Lincoln, Lincoln, NE, United States
Introduction: Machine learning methods combined with satellite imagery have the potential to improve estimates of carbon uptake of terrestrial ecosystems, including croplands. Studying carbon uptake patterns across the U.S. using research networks, like the Long-Term Agroecosystem Research (LTAR) network, can allow for the study of broader trends in crop productivity and sustainability.
Methods: In this study, gross primary productivity (GPP) estimates from the Moderate Resolution Imaging Spectroradiometer (MODIS) for three LTAR cropland sites were integrated for use in a machine learning modeling effort. They are Kellogg Biological Station (KBS, 2 towers and 20 site-years), Upper Mississippi River Basin (UMRB - Rosemount, 1 tower and 12 site-years), and Platte River High Plains Aquifer (PRHPA, 3 towers and 52 site-years). All sites were planted to maize (Zea mays L.) and soybean (Glycine max L.). The MODIS GPP product was initially compared to in-situ measurements from Eddy Covariance (EC) instruments at each site and then to all sites combined. Next, machine learning algorithms were used to create refined GPP estimates using air temperature, precipitation, crop type (maize or soybean), agroecosystem, and the MODIS GPP product as inputs. The AutoML program in the h2o package tested a variety of individual and combined algorithms, including Gradient Boosting Machines (GBM), eXtreme Gradient Boosting Models (XGBoost), and Stacked Ensemble.
Results and discussion: The coefficient of determination (r2) of the raw comparison (MODIS GPP to EC GPP) was 0.38, prior to machine learning model incorporation. The optimal model for simulating GPP across all sites was a Stacked Ensemble type with a validated r2 value of 0.87, RMSE of 2.62 units, and MAE of 1.59. The machine learning methodology was able to successfully simulate GPP across three agroecosystems and two crops.
1 Introduction
The use of satellite-derived estimates of ecosystem productivity have become somewhat commonplace in ecosystem and agricultural sciences (Huang et al., 2018; Smith et al., 2019; Ai et al., 2020). Estimating plant growth has utility in a wide variety of ecological and agricultural applications, including carbon uptake estimates, yield forecasting, detection of plant pathologies, and detecting ecosystem changes (Steven, 1993; Kerr and Ostrovsky, 2003; Pettorelli et al., 2017). These estimates generally take advantage of the unique way that photosynthesizing plants reflect near infrared radiation (NIR), which can be easily detected with satellite and aerial sensors (Badgley et al., 2017; Baldocchi et al., 2020). Large networks of sites, such as the Long-Term Agroecosystem Research (LTAR) network, provide unique opportunities to analyze plant productivity across multiple collaborative sites over a long period of time, allowing for a better understanding of large-scale spatio-temporal trends. The LTAR network is a collaboration between 18 long-term agricultural research sites across the United States established by the United States Department of Agriculture (USDA) Agricultural Research Service (ARS) and collaborative land-grant universities. The overarching mission of the LTAR network is to provide sustainable solutions for food and fiber production that are currently facing challenges associated with changing climate and increasing resource demands. The LTAR network has been increasingly turning to technological solutions, including remote sensing, to serve as a large-scale indicator (Spiegal et al., 2018; Browning et al., 2021) and solve its pressing questions regarding agricultural sustainability (Kleinman et al., 2018; Boughton et al., 2021; Goodrich et al., 2021). The LTAR network includes a wide range of cropping systems, management practices, and land use histories. Studying the interactions of cropping system and management with carbon flux can be useful when determining best management practices in a variety of systems.
One commonly used satellite output is the Moderate Resolution Imaging Spectroradiometer (MODIS) Gross Primary Productivity (GPP) product. This output provides a measure of total carbon uptake via photosynthesis (GPP)—a major component of the carbon cycle in terrestrial ecosystems. MODIS is a passive sensing instrument aboard NASA’s Terra and Aqua satellites that collects spectral data among 36 bands with a temporal resolution of 1–2 days. The MODIS GPP estimate is a pre-processed data product available via NASA-based platforms (Maccherone, 2021). The GPP product derived from MODIS data uses a light-use efficiency-based model that is modulated by biome type. MODIS classifies all cropland into a single cropland biome. This method relates GPP to the light-use efficiency of photosynthesizing plants and the availability of light. The method is common for estimating GPP using remote sensing from a wide range of sensors beyond MODIS (Reeves et al., 2005; Running and Zhao, 2015; Huang et al., 2021).
Remote sensing estimates of GPP, such as the MODIS GPP product, have a number of advantages compared to ground-based methods, including lower cost, ease of use, and ability to estimate GPP in regions where ground-based instruments are impractical. However, the MODIS GPP estimate is prone to underestimation due to uncertainties associated with assumptions used in the method, cloud cover, coarse resolution, and others. Including the classification of all cropland as a single biome type is largely due to the limited spatial resolution (Tuner et al., 2006; Sims et al., 2008; Huang et al., 2018). For instance, a vulnerability of the MODIS GPP product is that the default scalars used in the calculation of the maximum light-use efficiency are not well measured and are lacking a distinction between C3 and C4 photosynthetic pathways (Tuner et al., 2006; He et al., 2013; Xin et al., 2015; Huang et al., 2021). Moreover, reports of uncertainty are common among the photosynthetically active radiation (PAR) absorption calculations used by MODIS (He et al., 2013; Cheng et al., 2014). Many authors have succeeded in improving the GPP estimates (more in-line with ground truth data) by modifying the efficiency parameters and PAR input parameters (Sims et al., 2008; Gilabert et al., 2015; Huang et al., 2018; Huang et al., 2021). The process of improving satellite estimates of GPP requires reliable ground truth data from in-situ carbon flux measurements.
The most common ground based GPP estimation method is the eddy covariance (EC) method (Novick et al., 2018; Hermes et al., 2019; Baldocchi, 2020). The EC method uses two rapid-response (i.e., 10 Hz) instruments, an infrared gas analyzer (IRGA) that measures the concentration of the gas of interest (in this case, CO2), and a sonic anemometer that measures the vertical wind speed. The covariance of the simultaneous measurements is gas flux, which in the case of CO2 is the net ecosystem CO2 exchange (NEE). GPP is then derived from net ecosystem exchange of CO2 (NEE) using a variety of flux partitioning methods (Reichstein et al., 2005; Wutzler et al., 2018). This method is widely used to estimate GPP due to its continuous measurement style and accuracy; however, the method has several key drawbacks. The instruments needed for the EC method are expensive, need regular maintenance, and require large flat areas with uniform vegetation for optimal function. Despite these challenges, EC instruments provide a strong control and an in-situ estimation of GPP. EC data is widely available through collaborative research efforts, such as LTAR, and through data-sharing networks, such as AmeriFlux or FLUXNET (Pastorello et al., 2020; Bond-Lamberty, 2018).
The in-situ GPP data bridges the gap between the EC GPP estimates and the MODIS GPP products. There have been numerous successes in bridging this gap using linear regression both to modify parameters used in the MODIS algorithm and to modify GPP outputs (Wang et al., 2012; Fu et al., 2014; Xin et al., 2015). Xin et al. (2015) modified the light use efficiency term using linear regression and in-situ measurements to modify MODIS efficiency terms. Kang et al. (2005) improved MODIS outputs using a cloud correction algorithm. The gap could be more thoroughly overcome through the introduction of more advanced modeling methods. Many models have been developed using MODIS GPP and meteorological data, with machine learning algorithms becoming more common in recent years (Joiner and Yoshida, 2020; Jung et al., 2020; Yu et al., 2021). Machine learning is a method of modeling that uses data to train algorithms that describe the data and allow for the prediction of new data points. This method is increasingly being used for simulating CO2 and other ecosystem gas fluxes (Yao et al., 2017; Knox et al., 2021; Reed et al., 2021; Shang et al., 2021; Talib et al., 2021). Yang et al. (2007) was able to improve MODIS GPP estimates using support vector machine learning. Similarly, Joiner and Yoshida (2020) estimated global GPP on a yearly time step using MODIS data and Neural Network modeling. Cui et al. (2021) used the support vector machine to improve gap filling and evapotranspiration estimates of EC data.
Here we construct a simple machine learning method by using EC data as a ground-truth (dependent) variable. Whereas the MODIS GPP alongside precipitation, temperature, crop, and agroecosystem serve as the independent variables. Using these variables and the AutoML machine learning function of the h2o package, the objectives of this study are to determine: 1) The feasibility of utilizing combined datasets across multiple LTAR sites to estimate GPP using machine learning algorithms, and 2) establish an estimation of GPP that can be used as part of a carbon balance proxy, to serve as a supporting indicator of the sustainability goals of the LTAR network.
2 Materials and methods
2.1 Site and EC data selection
The LTAR network has 18 sites of which 13 are solely or partly cropland sites (Figure 1). Despite the establishment of EC towers across the network, many are new, thus limiting the amount of data collected to date. Of the 13 LTAR cropland EC agroecoregions, three had enough EC data for use in machine learning algorithms. These three sites include the Kellogg Biological Station (KBS), the Platte River High Plains Aquifer (PRHPA), and the Upper Mississippi River Basin (UMRB) sites (Figure 1; Table 1). All of these sites are part of LTAR’s Common Experiment, where similar methods and management practices are used across multiple sites.
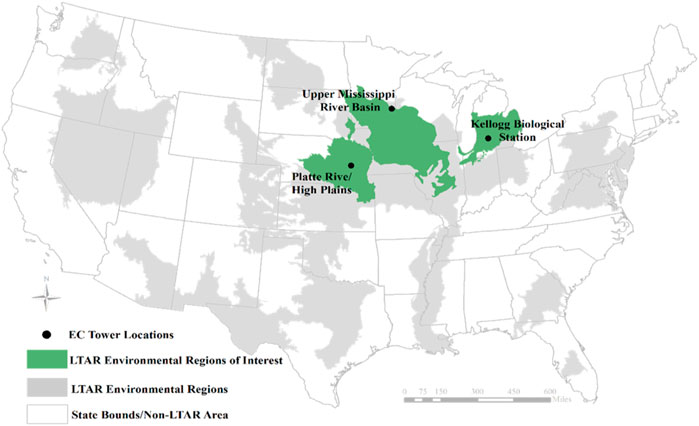
FIGURE 1. Spatial locations of the three agroecoregions used in this study, all within the Long-Term Agroecosystem Research (LTAR) network. Created using the LTAR network shapefile, published under CC0-1.0.
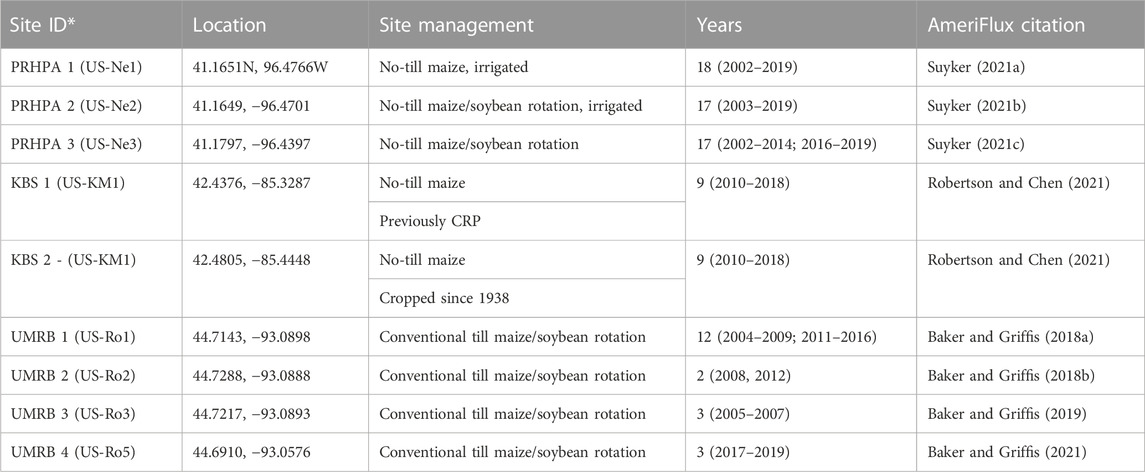
TABLE 1. Information for the 13 LTAR eddy covariance (EC) flux measurements sites. AmeriFlux site ID is provided in parentheses.
The KBS LTAR site is located near Battle Creek, Michigan, United States (42.4376, −85.3287) and is operated as an LTAR site through a partnership between USDA-ARS and Michigan State University (Bean et al., 2021). The average annual temperature is 9.9°C and the average annual precipitation is 1,027 mm. Two EC towers were established in 2009 and remain in operation. Since 2009 had a different crop system compared to the rest of the years, 2009 data was not used in this study. The EC towers are in two different fields; one has been cropland since 1938 and the other was converted from Conservation Reserve Program (CRP) perennial grassland to cropland in 2009. Both sites are managed as no-till with continuous rainfed maize (Abraha et al., 2019; Robertson and Chen, 2021). Each EC tower is equipped with a LI-7500 IRGA (LI-COR Biosciences, Lincoln, NE, United States) and a CSAT3 sonic anemometer (Campbell Scientific, Logan, UT, United States). Air temperature and precipitation were determined with ancillary instruments on the EC tower. Data was processed using the EdiRe system (University of Edinburgh, Edinburgh, Scotland, United Kingdom). This processing included flagging low-quality data, performing corrections for sonic temperature and humidity, planar fit coordinate rotation, and corrections for air density. These are typical corrections used in the processing of Eddy Covariance data (Abraha et al., 2019; Burba, 2022).
The PRHPA site is located near Omaha, Nebraska, United States (41.1651, −96.4766) and is operated under a partnership between USDA-ARS and the University of Nebraska-Lincoln and is part of the Platte River High Plains Aquifer agroecoregion (Bean et al., 2021). The average annual temperature is 10.1°C and the average precipitation is 790 mm. Three EC towers were established in 2001 and remain in operation. The three EC towers are in three no-till fields that are operated with the following production cycles: 1) Irrigated continuous maize; 2) irrigated maize/soybean rotation; and 3) rainfed maize/soybean (Suyker, 2021a; Suyker, 2021b; Suyker, 2021c). Irrigation managements was performed with a center-pivot. LI-7200 IRGA (LI-COR Biosciences) and R3-100 sonic anemometer (Gill Instruments, Hampshire, United Kingdom) were used at the site. On-site raw processing was completed using custom code and included typical corrections for EC data as discussed previously.
The UMRB site is located near Minneapolis-St. Paul, Minnesota, United States (44.7143, −93.0898) and is operated under a partnership between USDA-ARS and the University of Minnesota and is part of the Upper Mississippi River Basin agroecoregion (Bean et al., 2021). The average annual temperature is 6.4°C and the average annual precipitation is 879 mm. Three of the EC towers (UMRB 1, UMRB 2, and UMRB 3) were established in 2003 and were dismantled in 2016 when the site was developed. A new EC tower (UMRB 4) was established in a nearby site in 2017 and is still in operation. All tower sites were managed as rainfed maize/soybean rotation with chisel plow tillage (Baker and Griffis, 2019; Baker and Griffis, 2021). LI-7500 IRGA and CSAT3 sonic anemometer were used at the site. Raw data were processed on-site using custom code prior to data sharing. Data processing involved standard corrections applied to EC data as previously discussed. Air temperature and precipitation were measured at all three sites (KBS, PRHPA and UMRB) with ancillary instruments on the EC towers.
Missing EC (15.7%) data due to power outages, instrument maintenance and failure, and unfavorable weather conditions were gap-filled using an online R-based tool, REddyProc (https://www.bgc-jena.mpg.de/5622399/REddyProc; Version 75, Jena, Germany). REddyProc uses a moving-window-based algorithm to fill gaps in EC data and is one of the widely used methods (Reichstein et al., 2005; Wutzler et al., 2018). An average gap of 15.7% is relatively low compared to other eddy covariance datasets (Falge et al., 2001; Hui et al., 2004; Moffat et al., 2007) NEE fluxes were partitioned into GPP and Reco in REddyProc using a relationship between nighttime NEE and air temperature to estimate Reco, assuming nighttime NEE fluxes are equal to Reco. GPP was then calculated by adding Reco to NEE (Lloyd and Taylor, 1994; Reichstein et al., 2005). EC GPP will be referred to in this paper as GPPEC from here outwards.
2.2 MODIS data acquisition and processing
MODIS data were pulled from the MODIS/006/MOD17A2H collection (Running et al., 2015) through Google Earth Engine Code Editor (Gorelick et al., 2017). Quality control (QC) bits 5-7 provided a 5-level confidence quality score where “0” indicated the “very best possible” quality (e.g., absence of the clouds). Images with the value of “0” were used while the remaining scores were all masked. Once the desirable images were selected, they were saved to a list and exported to Google Drive. The imagery data were then subject to geospatial processing methods incorporating averaged zonal statistics representing the area of each individual field using ArcGIS Pro (ESRI, Redlands, CA, United States). The spatial resolution for this product is 1 km2. The typical eddy covariance tower has a flux footprint (radius) around 150–200 m2, giving it an effective spatial resolution that is similar to that of the MODIS product. Across the studied sites, the average EC flux location consisted of 1.05 MODIS pixels.
2.3 MODIS GPP algorithm
MODIS calculates GPP using a light-use efficiency-based model as follows:
where APAR is the absorbed photosynthetically active radiation (PAR) and ε is the coefficient of radiation use efficiency (Reeves et al., 2005; Running and Zhao, 2015). ε is calculated using the maximum ε, and terms for water, temperature stress, and other environmental factors that come from the Biome Specific Parameters Look Up Table (BPLUT, https://www.ntsg.umt.edu/files/modis/MOD17UsersGuide2015_v3.pdf). For this dataset, cropland BPLUT was used (Running and Zhao, 2015; Huang et al., 2021). APAR is calculated by modifying incoming PAR using cloud cover, aerosol interference, leaf area, day length, and incident angle (Running and Zhao, 2015). As the MODIS product is an 8-day sum, a daily value was obtained by dividing the value by 8.
2.4 Machine learning model
The h2o package (LeDell et al., 2021) provides the AutoML function, which is an automated, supervised machine learning algorithm. It trains the model by utilizing a variety of other algorithm types such as: Gradient Boosting Machines (GBM), Generalized Learning Models (GLM), and eXtreme Gradient Boosting Models (XGBoost). AutoML uses three pre-specified XGBoost GBM models, a fixed grid of GLMs, a default Random Forest (DRF), five pre-specified H2O GBMs, a near-default Deep Neural Net, and Extremely Randomized Forest (XRT), a random grid of XGBoost GBMs, a random grid of H2O GBMs, and a random grid of Deep Neural Nets (H2O AutoML, 2022). AutoML includes stacked ensembles, which is a type of algorithm that additionally trains with a second-level meta-learner to find the best combination of the base learners (LeDell and Poirier, 2020). The models were trained to predict the daily GPP values based on the combination of MODIS-derived daily GPP (MODIS GPP), Julian day of year (DOY), air temperature, precipitation, agroecoregion, and crop. While MODIS includes biome types, the biomes used by MODIS are very broad (i.e., cropland, grassland, deciduous forest) and all sites in this study fall into the cropland biome, including location that allows for more specific ecoregions to be included. This model was limited to only maize and soybean due to limited data availability for other crop types. Several algorithm types such as Random Forest, k-nearest neighbor, and XGBoost were trained separately and as part of AutoML’s stacked ensemble in R (LeDell and Poirier, 2020). For reproducibility, parameters such as “max_models” and “max_runtime” were set to 500 and unlimited, respectively. This allowed AutoML to generate 500 models for each run with no limitations on time and then select the best-performing ones overall as well as within each algorithm type. The best models were identified by Root Mean Square Error (RMSE) and Mean Absolute Error (MAE). It should be noted that XGBoost is not currently available on Windows, which is why MacOS was used in this step.
Cross-validation (CV) is used to understand how well a model will likely perform in an actual use-case scenario (Friedman et al., 2001). There are several available methods to use for CV, each having its own advantages and disadvantages (Arlot and Celisse, 2010). h2o AutoML uses K Fold CV by default, a method introduced by Geisser (1975), to provide a better estimate of how well the model will perform on new data. K Fold CV removes part of the training data and tests the model on the removed portion. The data is divided into k subsets, and then the training is repeated k times using a different combination of subsets each time. The accuracy metrics are averaged across all versions to produce the CV results. In our case, k = 5, which means that 80% of the data was used to predict on the remaining 20%. While the CV results can give a reasonably accurate view of model performance, we chose to keep some years separate from the training for an independent model validation. Only the validation results from this last step are utilized in this paper to provide a more accurate reflection of the models’ performance instead of the CV results that can sometimes appear inflated. The data were split three ways across entire years to ensure model robustness: 1) Models were trained on older years (2004–2015) and tested on recent years (2016–2019); 2) Models were trained on recent years (2006–2019) and tested on older years (2004–2005); and 3) Models were trained and tested on years selected at random (testing years: 2009, 2011, 2014, 2017). Due to the variability of observations between years, the number of years for each region were chosen to maintain as close to an 80:20 training/testing split as possible for a more realistic view of the model’s performance (see Saeb et al., 2017). A summary of all models run is included in the supplementary materials.
2.5 Statistical analyses
The statistical methods used for comparing modeled GPP to GPPEC were coefficient of determination (r2; Eq. 2), Root Mean Square Error (RMSE; Eq. 3), and Mean Average Error (MAE; Eq. 4). R-squared measures the amount of variability in the predicted variable that can be explained by the model with values ranging from 0 to 1. RMSE is the sum of the square of prediction error for each observation. MAE is the sum of the absolute value of error. We used r2 and RMSE to easily compare across models, while MAE was used for ease of communicability to the general public because it is in a format that is understood by the average farmer (i.e., gC m−2 day−1 as opposed to a root/squared value or something between 0 and 1 that may not be comparable across fields). These indices were calculated as follows:
where n is the number of data points, ŷ is the actual value (GPPEC), yi is the predicted value (modeled GPP), and ȳ is the mean value. Linear regression of the GPPMODIS and GPPEC was performed using SigmaPlot (Version 14.0, Systat Software, Berkshire, United Kingdom). Differences in model success between management practice and sites were determined by comparing MSE and MAE values.
3 Results and discussion
3.1 Comparison of GPPMODIS to GPPEC
The linear regressions between the GPPMODIS (prior to modeling) and GPPEC vary greatly among sites (Figure 2). The strongest correlation was found at the PRPHA site with maize; however, this could possibly be an artifact of greater data availability (17 years per EC tower versus 9 and 12 at KBS and UMRB, respectively) for that site/crop combination. Larger datasets, with increased data available for training, are associated with lower error than smaller datasets (e.g., Faber et al., 2016; Schmidt et al., 2017; Zhang and Ling, 2018). Across all sites, GPPMODIS has a tendency to underestimate GPP during the peak growing season and overestimate GPP in the seedling establishment and senescence phases. Underestimation was most pronounced at the peak of the growing season, often by > 100 gC per 8-day measurement period. Overestimation was most pronounced in the late spring just at the very beginning of the growing season with overestimations of around 50–60 gC per 8-day measurement period being common. Tuner et al. (2006) reported that GPPMODIS product tended to overestimate during low productivity and underestimate during high productivity (i.e., peak growing season) across multiple biomes including croplands. Other studies also found significant underestimation of GPPEC by the raw GPPMODIS product, often with similar magnitudes to our results (Wang et al., 2012; Tang et al., 2015; Huang et al., 2018).
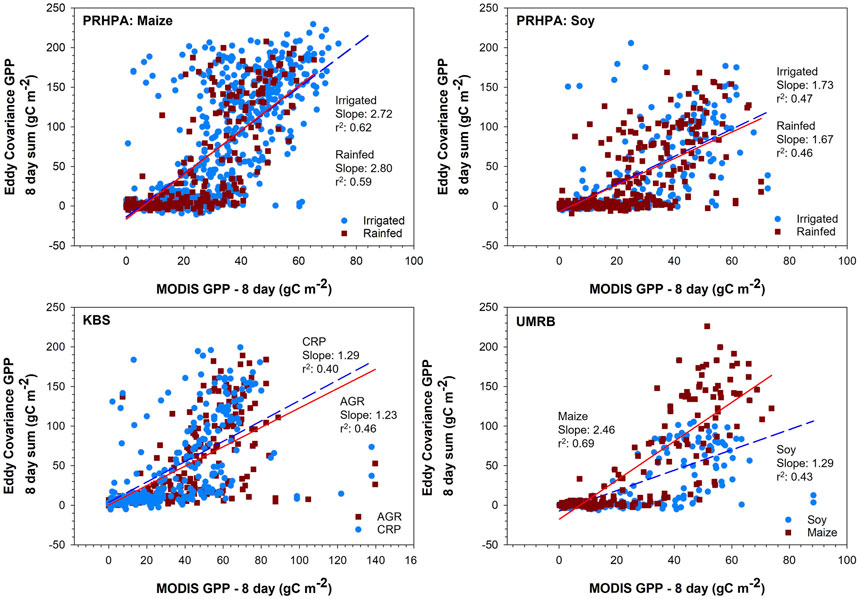
FIGURE 2. Relationship between the raw Moderate Resolution Imaging Spectroradiometer (MODIS) gross primary productivity (GPP) and eddy covariance GPP using linear regression at each site. The best fit lines use the same color scheme as the points that the regression is showing the relationship of. All slopes are significant to p < 0.0001. Platte River High Plains Aquifer (PRHPA) had 1,007 and 299, observations for irrigated and rainfed maize, respectively and 285 and 344 for irrigated and rainfed soy, respectively. Kellogg Biological Station (KBS) had 342 and 355 observations for AGR and CRP, respectively. UMRB had 303 and 349 observations for maize and soy, respectively.
A best fit line between GPPEC and GPPMODIS was determined for all sites as one dataset using linear regression (Figure 3). The r2 of the relationship with all sites pooled is not different from findings of sites being analyzed individually, potentially indicating a universal model for simulating GPP for all sites (i.e., toward a much greater utility than a model that works for one site alone). There are differences in the correlation between GPPEC and GPPMODIS between the maize and soybean crops, with a stronger correlation in soybean sites. The efficiency parameter in MODIS is based on C3 photosynthesis, which has been shown to lead to greater underestimation of GPP in C4-dominated systems (Wang et al., 2012; Running and Zhao, 2015; Huang et al., 2021). There were also differences between sites in the efficacy of the MODIS GPP at directly estimating crop GPP, which may be related to the coefficients used in the estimation. The coefficients (i.e., light use efficiency (ε), temperature response, vapor pressure response, etc.) used by MODIS were the same for all three sites, regardless of differences in climate (Running and Zhao, 2019).
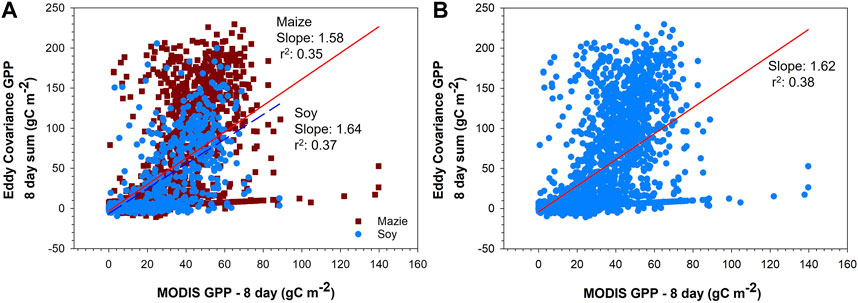
FIGURE 3. Linear regression of the raw Moderate Resolution Imaging Spectroradiometer (MODIS) gross primary productivity (GPP) and eddy covariance GPP at all sites as 8-day sums (A) for maize (red solid) and soybean (blue dashed), and (B) for both maize and soybean in one dataset with the best fit line in red. All slopes are significant to p < 0.0001. The total number of datapoints was 3,030 (2,186 for maize and 844 for soy).
3.2 Model results
All agroecoregion/crop combinations were analyzed first, individually, using the three data training/testing splits (Table 2). To re-iterate, all observations classified as the testing datasets were not included in the training datasets. Supervised machine learning has an unavoidable issue of overfitting, mostly due to the limits of training data or the constraints of algorithms that are too complicated and require an abundance of parameters (Ying, 2019). Training/validation data were kept separate in an effort to minimize overfitting, with only the validation results communicated here. At PRHPA, the maize models had an average validation r2 of 0.88, RMSE of 2.82 gC m−2 day−1, and MAE of 1.71 gC m−2 day−1; for soybean the average validation r2 was 0.78, RMSE was 2.61 gC m−2 day−1, and MAE was 1.73 gC m−2 day−1. For both crops combined at PRHPA the model success was similar to single crop models with an average r2 of 0.85, RMSE of 2.93 gC m−2 day−1, and MAE of 1.77 gC m−2 day−1. At UMRB, the maize only models had an average r2 of 0.86, a RMSE of 3.06 gC m−2 day−1, and a MAE of 2.0 gC m−2 day−1; with soybean only models the average r2 was 0.76, RMSE was 2.06 gC m−2 day−1, and MAE was 1.38 gC m−2 day−1. For both crops combined at UMRB the model success was similar to that of single crop models with an average r2 of 0.84, an RMSE of 2.6 gC m-2 day-1, and an MAE of 1.64 gC m-2 day-1. At KBS only maize was grown, and the models had an average validation r2 of 0.77, RMSE of 3.14 gC m-2 day-1, and MAE of 1.95 gC m-2 day-1. All best-fit models were Stacked Ensemble-type models, likely due to their second-level learning approach by utilizing what they learn from the base learners to inform the meta-algorithm or super learner.
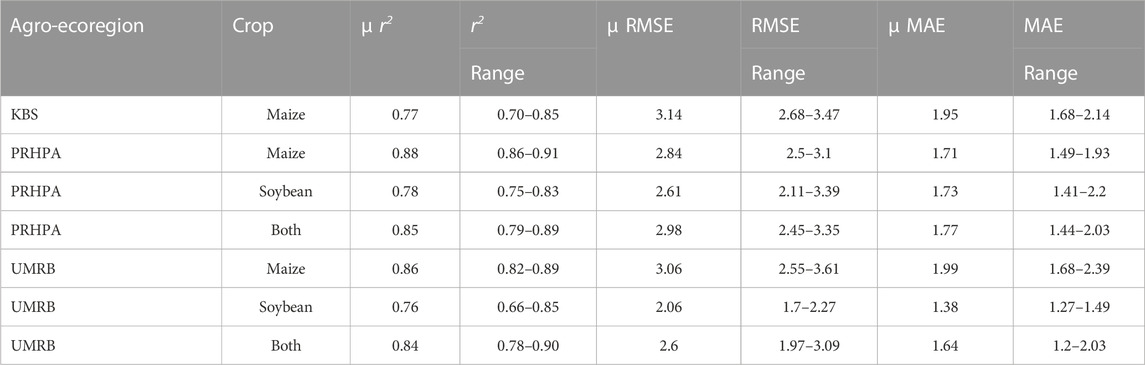
TABLE 2. The average results for machine learning modeling of individual agroecosystem GPP are shown below. Average is across the three temporal validation data splits. Units are gC m-2 day-1.
In both agroecosystems with maize and soy, the model success with both crops combined into a single dataset was similar to that of single crop models, indicating that this method can be used with multiple crops with different growth patterns and photosynthetic pathways in the same model. Model validation RMSE ranged from 2.06 to 3.14 gC m-2 day-1 depending on location and crop. Given that the typical maximum daily GPPEC was around 25–30 gC m-2, the observed error was considerably less than a day’s carbon update and was well within the range of expected values from other studies. Other remote sensing GPP modeling efforts (primarily linear regression) reported daily RMSE values ranging from 2.6 gC m-2 (Nguy-Robertson et al., 2015), 1.9 to 12.1 gC m-2 depending on efficiency term (Cheng et al., 2014), 0.5 to 2.0 gC m-2 depending on ecosystem and methodology (Gilabert et al., 2015), 3.8 gC m-2 (He et al., 2013), and 0.8 to 7.5 gC m-2 depending on site and methodology (Huang et al., 2021). The error range found here is well within the range reported by other studies, showing that this method is suitable for simulating cropland GPP.
3.3 Comparison of all site data
The models were then run with all site data combined into a single dataset (Table 3; Figure 4). When all agroecoregions and crops were combined into one dataset, the model validation r2 was 0.85, RMSE was 2.77 gC m-2 day-1, and MAE was 1.67 gC m-2 day-1. As a control, a model set where the only input was MODIS GPP was also created; this model was much weaker (r2: 0.52), showing that the addition of other variables (i.e., climate, location, crop) greatly improved model success. The error shown with the single dataset was within the range seen in individual datasets and similar those seen in other studies (Guo et al., 2023; He et al., 2013; Nguy-Robertson et al., 2015; Reed et el., 2021). Duan et al., 2021 found a similar error using Random Forest when modeling for rice (Oryza sativa), but was more accurate when modeling wheat (Triticum Aestivum). When looking at the regression between modeled and observed GPP, as shown in Figure 4, the slope of the relationship is close to 1.0. The slopes were similar across data splits, 1.01 for early year, 1.05 for late, and 0.96 for random, indicating a near 1:1 relationship between modeled and observed GPP. This 1:1 relationship further indicates that Stacked Ensemble machine learning can reliably estimate GPP across various data splits. However, it is worth noting that there was a greater spread of data points about the slope at higher GPP values (both with machine learning and in the original data comparison), indicating a potential oversaturation of the remote sensing data. While the combined dataset had more training data, it had two crops and three locations to model for, potentially complicating the modeling effort, as a result, it is performance was similar. Maize and soybean have very different growth habits and photosynthetic pathways, likely making best-fit models different for each crop. The MODIS17 product uses a light-use efficiency method but does not correct for differences in C3 and C4 photosynthetic pathways. In-situ measurements of light use efficiency have found considerably different efficiency values for maize and soybean due to differences in plant physiology, including canopy structure and photosynthesis biopathways (Gitelson et al., 2015; Xin et al., 2015; Gitelson et al., 2018). However, by including the crop type as a variable, the AutoML algorithms successfully distinguished between the two biopathways.

TABLE 3. The average results for combined agroecosystem/crop GPP modeling are shown below. Average is across the three temporal validation data splits. Units are gC m-2 day-1.
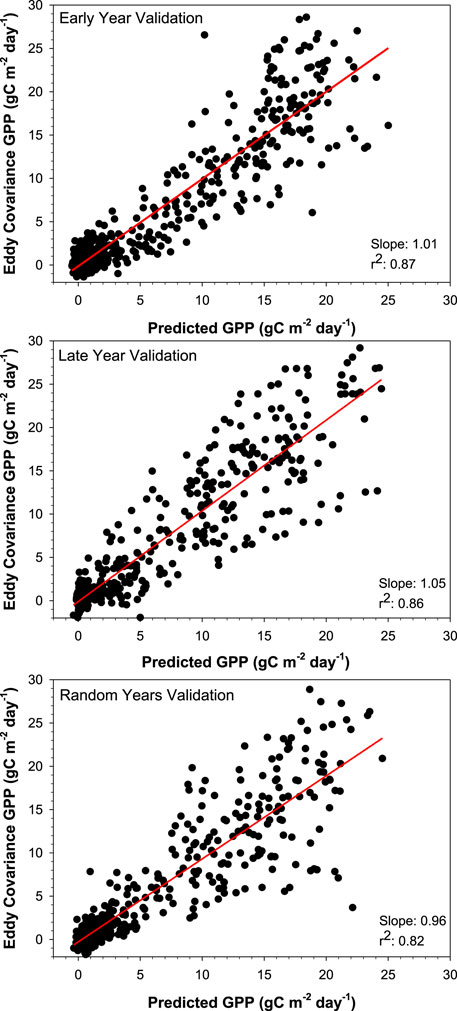
FIGURE 4. The relationship between machine learning predicted GPP and eddy covariance GPP is shown above. The top graph shows the model where the earlier years (2004–2005) were used as validation and the later years (2006–2019) were used as training (645 data points). The middle graph shows the model where the later years (2016–2019) were used as validation and the earlier years (2004–2015) were used as training (618 data points). The bottom graph is where random years were used for validation (2009, 2011, 2014, and 2017) with the remainder as training (574 data points).
As with analysis by agroecosystem, all best-fit models for the combined datasets were Stacked Ensemble-type models. As discussed previously, Stacked Ensemble is a machine learning method that combines multiple learning methods (i.e., GBM and XGBoost) by using the output of one model as the input for another (Rajadurai and Gandhi, 2020; Mohebbian et al., 2021). Stacked Ensemble is a robust approach that can work with many data types and uses (Zai and Chen, 2018; Rajadurai and Gandhi, 2020). Stacked Ensemble methods have been found to frequently outperform single models across many data types (Zhai and Chen, 2018; Chowhurdy et al., 2019; Singh et al., 2019; Jangam and Annavarapu, 2021).
3.4 Implications for future research
This study has provided insight into the potential of using machine learning methodology to estimate GPP using readily available inputs (MODIS GPP product, air temperature, precipitation, crop type, and agroecosystem) across the LTAR network and croplands. This framework has the potential to allow for network-wide estimations of carbon uptake across the Common Experiment and other sites, even where EC towers are not present, and to further network goals of understanding cropland carbon dynamics. Combined models (including multiple agroecoregions in the same model) can account for region-specific differences by using agroecosystem region as an input in the training phase. The combined model will allow for more large-scale carbon inventories without compromising on accuracy when compared to site and crop-specific models (combined model r2: 0.85 average site/crop-specific model r2: 0.82), likely owing to the greater pool of training data for larger models.
Croplands cover about 12% of the Earth’s ice-free land area (IPCC, 2019). Sustainable management on these lands can maintain or improve productivity while contributing to climate change mitigation and adaptation goals (Tang et al., 2015; IPCC, 2019; Browning et al., 2021). As a component of the carbon cycle, cropland GPP is an important indicator of productivity and sustainability, and its monitoring can contribute to furthering sustainability goals (Beer et al., 2010; Gilabert et al., 2015; Huang et al., 2018; Browning et al., 2021). GPP monitoring can also be valuable in understanding the short-term effects of extreme weather events on carbon dynamics, including droughts, floods, and intense storms (Ciais et al., 2005; Menefee et al., 2020; Yin et al., 2020). Given that few cropland sites have in-situ GPP monitoring, regional and global GPP estimates rely on remote sensing and modeling to estimate large-scale carbon uptake (Kalfas et al., 2011; Huang et al., 2018; Smith et al., 2019). This method of incorporating machine learning allows for a more flexible model that can apply to broad areas and pick up on trends not seen in process-based modeling (Beer et al., 2010; Jung et al., 2011; Xiao et al., 2014). Expanding this methodology to broader regions and more sites to create LTAR-wide carbon flux estimates is a future goal of this project.
Machine learning methods have already been widely used to successfully estimate global GPP on annual timesteps with various algorithm types (Beer et al., 2010; Jung et al., 2011; Xiao et al., 2014). Machine learning estimated global evapotranspiration, CH4 emissions, and NEE on global, field, and regional scales (Yao et al., 2017; Knox et al., 2021; Shang et al., 2021; Talib et al., 2021). Applying these methods to agricultural lands can quantify carbon cycle contributions from agriculture and determine best management practices for carbon sequestration. Practically any field of suitable size can leverage the power of machine learning by utilizing methods as described in this paper, which, given the wide accessibility of input data, should make this type of analysis feasible for any large-scale cropping system. The methods employed provide a simple solution that can be followed with minimal experience/knowledge with machine learning. However, further improvement of a given algorithm’s output via adjusting hyperparameters is limited to the range of values disclosed by the h2o package. Currently, the full range required for a sensitivity analysis is undisclosed by the h2o package. Data limitations from EC towers often arise due to the high costs of the equipment; the limited data can possibly result in commonly known issues of overfitting with machine learning. Nevertheless, the extensive reach and robustness of machine learning-based carbon models, as demonstrated here, make it an ideal method for future work in understanding cropland carbon uptake and climate interactions. Future steps aim to apply this methodology to more sites within the LTAR network. The LTAR network has contributed to our collective understanding of cropland biogeochemical cycling across the United States, and it is our hypothesis that the addition of machine learning methods will enhance these network analyses.
4 Conclusion
In this study, we showcased the applicability of machine learning to estimate GPP across LTAR croplands using MODIS satellite imagery, weather, and agroecoregion as input data. The MODIS GPP product, while correlated with in-situ GPP, frequently underestimated GPP during peak growing season and overestimated during seedling establishment and senescence. In simulating GPP at individual tower sites, model performance was best at sites with larger quantities of data available for model training. The machine learning methods also work well with all sites combined into one dataset, particularly for maize. Combined datasets provide more training data for the machine learning algorithm to work with and can thus improve model success over individual site-scale models. The success of machine learning at modeling GPP across three LTAR sites is a first step towards applying this methodology to the network as a whole.
Data availability statement
Publicly available datasets were analyzed in this study. This data can be found here: https://ameriflux.lbl.gov/sites/siteinfo/US-Ne1 https://ameriflux.lbl.gov/sites/siteinfo/US-Ne2 https://ameriflux.lbl.gov/sites/siteinfo/US-Ne3 https://ameriflux.lbl.gov/sites/siteinfo/US-KM1 https://ameriflux.lbl.gov/sites/siteinfo/US-KM2 https://ameriflux.lbl.gov/sites/siteinfo/US-Ro1 https://ameriflux.lbl.gov/sites/siteinfo/US-Ro2 https://ameriflux.lbl.gov/sites/siteinfo/US-Ro3 https://ameriflux.lbl.gov/sites/siteinfo/US-Ro5.
Author contributions
DM: Writing, results interpretation, and editing. TL: Machine learning work. KF: Remote sensing, results interpretation, and editing. JC: Eddy Covariance data. MA: Eddy Covariance data. JB: Eddy Covariance data. AS: Eddy Covariance data. All authors contributed to the article and approved the submitted version.
Funding
LTAR is supported by the USDA. This work was supported by the USDA-ARS Grassland Soil and Water Research Laboratory, Temple, TX, and supports the USDA-ARS-LTAR network.
Acknowledgments
This research was a contribution to the Long-Term Agroecosystem Research (LTAR) network. The USDA is an equal opportunity employer and provider.
Conflict of interest
The authors declare that the research was conducted in the absence of any commercial or financial relationships that could be construed as a potential conflict of interest.
Publisher’s note
All claims expressed in this article are solely those of the authors and do not necessarily represent those of their affiliated organizations, or those of the publisher, the editors and the reviewers. Any product that may be evaluated in this article, or claim that may be made by its manufacturer, is not guaranteed or endorsed by the publisher.
References
Abraha, M., Chen, J., Hamilton, S. K., and Robertson, G. P. (2019). Long-term evapotranspiration rates for rainfed corn versus perennial bioenergy crops in a mesic landscape. Hydrol. Process. 34, 810–822. doi:10.1002/hyp.13630
Abraha, M., Hamilton, S. K., Chen, J., and Robertson, G. P. (2018). Ecosystem carbon exchange on conversion of Conservation Reserve Program grasslands to annual and perennial cropping systems. Agric. For. Meteorology 253-254, 151–160. doi:10.1016/j.agrformet.2018.02.016
Ai, Z., Wang, Q., Yang, Y., Manevski, K., Yi, S., and Zhao, X. (2020). Variation of gross primary production, evapotranspiration and water use efficiency for global croplands. Agric. For. Meteorology 287, e107935. doi:10.1016/j.agrformet.2020.107935
Arlot, S., and Celisse, A. (2010). A survey of cross-validation procedures for model selection. Stat. Surv. 4, 40–79. doi:10.1214/09-SS054
Badgley, G., Field, C. B., and Berry, J. A. (2017). Canopy near-infrared reflectance and terrestrial photosynthesis. Sci. Adv. 3 (3), e1602244. doi:10.1126/sciadv.1602244
Baker, J., and Griffis, T. (2018a). AmeriFlux BASE US-ro1 Rosemount- G21. Ver 5.5. Berkeley, CA: AmeriFlux, hosted by the Lawrence Berkeley National Laboratory. doi:10.17190/AMF/1246092
Baker, J., and Griffis, T. (2018b). AmeriFlux BASE US-ro2 Rosemount- C7, ver. 1-5. AmeriFlux AMP. doi:10.17190/AMF/1418683
Baker, J., and Griffis, T. (2019). AmeriFlux BASE US-ro3 Rosemount- G19, ver. 4-5. AmeriFlux AMP. doi:10.17190/AMF/1246093
Baker, J., and Griffis, T. (2021). AmeriFlux FLUXNET-1F US-ro5 Rosemount I18_South, ver. 3-5. AmeriFlux AMP. doi:10.17190/AMF/1818371
Baldocchi, D. D. (2020). How eddy covariance flux measurements have contributed to our understanding of Global Change Biology. Glob. Change Biol. 26, 242–260. doi:10.1111/gcb.14807
Baldocchi, D. D., Ryu, Y., Dechant, B., Eichelmann, E., Hemes, K., Ma, S., et al. (2020). Outgoing near-infrared radiation from vegetation scales with canopy photosynthesis across a spectrum of function, structure, physiological capacity, and weather. J. Geophys. Res. Biogeosciences. 125, e2019JG005534. doi:10.1029/2019JG005534
Bean, A. R., Coffin, A. W., Arthur, D. K., Baffaut, C., Holifield Collins, C., Goslee, S. C., et al. (2021). Regional frameworks for the USDA long-term agroecosystem research network. Front. Sustain. Food Syst. 4, 612785. doi:10.3389/fsufs.2020.612785
Beer, C., Reichstein, M., Tomelleri, E., Ciais, P., Jung, M., Carvalhais, N., et al. (2010). Terrestrial gross carbon dioxide uptake: global distribution and covariation with climate. Science 329 (5993), 834–838. doi:10.1126/science.1184984
Bond-Lamberty, B. (2018). Data sharing and scientific impact in eddy covariance research. J. Geophys. Res. Biogeosciences. 123, 1440–1443. doi:10.1002/2018JG004502
Boughton, E. H., Bestelmeyer, B. T., Kleinman, P. J., Moglen, G. E., Spiegal, S., and Tsegaye, T. (2021). Long-term network research for the next agricultural revolution. Front. Ecol. Environ. 19 (8), 432–434. doi:10.1002/fee.2403
Browning, D. M., Russel, E. S., Ponce-Campos, G. E., Kaplan, N., Richardson, A. D., Seyednasrollah, B., et al. (2021). Monitoring agroecosystem productivity and phenology at a national scale: a metric assessment framework. Ecol. Indic. 131, e108147. doi:10.1016/j.ecolind.2021.108147
Chen, B., Chen, J. M., Baldocchi, D. D., Liu, Y., Wang, S., Zheng, T., et al. (2019). Including soil water stress in process-based ecosystem models by scaling down maximum carboxylation rate using accumulated soil water deficit. Agric. For. Meteorology 276-277, 107649. doi:10.1016/j.agrformet.2019.107649
Cheng, Y. B., Zhang, Q., Lyapustin, A. I., Wang, Y., and Middleton, E. M. (2014). Impacts of light use efficiency and fPAR parameterization on gross primary production modeling. Agric. For. Meteorology 189-190, 187–197. doi:10.1016/j.agrformet.2014.01.006
Chowdhury, A., Khaledian, E., and Broschat, S. (2019). Capreomycin resistance prediction in two species of Mycobacterium using a stacked ensemble method. J. Appl. Microbiol. 127, 1656–1664. doi:10.1111/jam.14413
Ciais, P., Reichstein, M., Viovy, N., Granier, A., Ogée, J., Allard, V., et al. (2005). Europe-wide reduction in primary productivity caused by the heat and drought in 2003. Nature 437, 529–533. doi:10.1038/nature03972
Cui, X., Goff, T., Cui, S., Menefee, D., Wu, Q., Rajan, N., et al. (2021). Predicting carbon and water vapor fluxes using machine learning and novel feature ranking algorithms. Sci. Total Environ. 775, e145130. doi:10.1016/j.scitotenv.2021.145130
Dai, S. Q., Li, H., Xiong, J., Ma, J., Guo, H. Q., Xiao, X., et al. (2018). Assessing the extent and impact of online data sharing in eddy covariance flux research. J. Geophys. Res. Biogeosciences. 123, 129–137. doi:10.1002/2017JG004277
Duan, Z., Yang, Y., Zhou, S., Gao, Z., Zong, L., Fan, S., et al. (2021). Estimating gross primary productivity (GPP) over rice–wheat-rotation croplands by using the random forest model and eddy covariance measurements: upscaling and comparison with the MODIS product. Remote Sens. 13 (21), 4229. doi:10.3390/rs13214229
Faber, F. A., Lindmaa, A., Lilienfeld, O. A. v., and Armiento, R. (2016). Machine learning energies of 2 million elpasolite (ABC2D6) crystals. Phys. Rev. Lett. 117, 135502. doi:10.1103/PhysRevLett.117.135502
Falge, E., Baldocchi, D. D., Olson, R., Anthoni, P., Aubinet, M., Bernhofer, C., et al. (2001). Gap-filling strategies for defensible annual sums of net ecosystem exchange. Agric. For. Meteorol. 107, 43–69. doi:10.1016/S0168-1923(00)00225-2
Friedman, J., Hastie, T., and Tibshirani, R. (2001). “The elements of statistical learning,” in Springer series in statistics (Berlin: Springer). doi:10.1007/b94608
Fu, X., Tang, C., Zhang, X., Fu, J., and Jiang, D. (2014). An improved indicator of simulated grassland production based on MODIS NDVI and GPP data: a case study in the Sichuan province, China. Ecol. Indic. 40, 102–108. doi:10.1016/j.ecolind.2014.01.015
Geisser, S. (1975). The predictive sample reuse method with applications. J. Amer. Stat. Assoc. 70, 320–328. doi:10.1080/01621459.1975.10479865
Ghimire, B., Riley, W. J., Koven, C. D., Mu, M., and Randerson, J. T. (2016). Representing leaf and root physiological traits in CLM improves global carbon and nitrogen cycling predictions. J. Adv. Model. Earth Syst. 8 (2), 598–613. doi:10.1002/2015MS000538
Gilabert, M. A., Moreno, A., Maselli, F., Martínez, B., Chiesi, M., Sánchez-Ruiz, S., et al. (2015). Daily GPP estimates in Mediterranean ecosystems by combining remote sensing and meteorological data. ISPRS J. Photogrammetry Remote Sens. 102, 184–197. doi:10.1016/j.isprsjprs.2015.01.017
Gitelson, A. A., Arkebauer, T. J., and Suyker, A. E. (2018). Convergence of daily light use efficiency in irrigated and rainfed C3 and C4 crops. Remote Sens. Environ. 217, 30–37. doi:10.1016/j.rse.2018.08.007
Gitelson, A. A., Peng, Y., Arkebauer, T. J., and Suyker, A. E. (2015). Productivity, absorbed photosynthetically active radiation, and light use efficiency in crops: implications for remote sensing of crop primary production. J. Plant Physiology 177, 100–109. doi:10.1016/j.jplph.2014.12.015
Goodrich, D. C., Heilman, P., Anderson, M., Baffaut, C., Bonta, J., Bosch, D., et al. (2021). The USDA-ARS Experimental Watershed Network: evolution, lessons learned, societal benefits, and moving forward. Water Resour. Res. 57, e2019WR026473. doi:10.1029/2019WR026473
Gorelick, N., Hancher, M., Dixon, M., Ilyushchenko, S., Thau, D., and Moore, R. (2017). Google earth engine: planetary-scale geospatial analysis for everyone. Remote Sens. Environ. 202, 18–27. doi:10.1016/j.rse.2017.06.031
Guo, R., Chen, T., Chen, X., Yuan, W., Liu, S., He, B., et al. (2023). Estimating global GPP from the plant functional type perspective using a machine learning approach. J. Geophys. Res. Biogeosciences 128, e2022JG007100. doi:10.1029/2022JG007100
H2O AutoML (2022). Automatic machine learning. Avaliable At: http://docs.h2o.ai/h2o/latest-stable/h2o-docs/automl.html.
He, M., Zhou, Y., Ju, W., Chen, J., Zhang, L., Wang, S., et al. (2013). Evaluation and improvement of MODIS gross primary productivity in typical forest ecosystems of East Asia based on eddy covariance measurements. J Res 18, 31–40. doi:10.1007/s10310-012-0369-7
Hemes, K., Chamberlain, S. D., Eichelmann, E., Anthony, T., Valach, A., Kasak, K., et al. (2019). Assessing the carbon and climate benefit of restoring degraded agricultural peat soils to managed wetlands. Agric. For. Meteorology 268, 202–214. doi:10.1016/j.agrformet.2019.01.017
Huang, K., Xia, J., Wang, Y., Ahlström, A., Chen, J., Cook, R. B., et al. (2018a). Enhanced peak growth of global vegetation and its key mechanisms. Nat. Ecol. Evol. 2, 1897–1905. doi:10.1038/s41559-018-0714-0
Huang, X., Ma, M., Wang, X., Tang, X., and Yang, H. (2018b). The uncertainty analysis of the MODIS GPP product in global maize croplands. Front. Earth Sci. 12, 739–749. doi:10.1007/s11707-018-0716-x
Huang, X., Xiao, J., Wang, X., and Ma, M. (2021). Improving the global MODIS GPP model by optimizing parameters with FLUXNET data. Agric. For. Meteorology 300, e108314. doi:10.1016/j.agrformet.2020.108314
Hui, D., Wan, S., Su, B., Katul, G., Monson, R., and Luo, Y. (2004). Gap-filling missing data in eddy covariance measurements using multiple imputation (MI) for annual estimations. Agric. For. Meteorology 121 (1-2), 93–111. doi:10.1016/S0168-1923(03)00158-8
Jangam, E., and Annavarapu, C. S. R. (2021). A stacked ensemble for the detection of COVID-19 with high recall and accuracy. Comput. Biol. Med. 135, e104608. doi:10.1016/j.compbiomed.2021.104608
Joiner, J., and Yoshida, Y. (2020). Satellite-based reflectances capture large fraction of variability in global gross primary production (GPP) at weekly time scales. Agric. For. Meteorology 291, e108092. doi:10.1016/j.agrformet.2020.108092
Jung, M., Reichstein, M., Margolis, H. A., Cescatti, A., Richardson, A. D., Arain, M. A., et al. (2011). Global patterns of land-atmosphere fluxes of carbon dioxide, latent heat, and sensible heat derived from eddy covariance, satellite, and meteorological observations. J. Geophys. Res. 116, G00J07. doi:10.1029/2010JG001566
Jung, M., Schwalm, C., Migliavacca, M., Walther, S., Camps-Valls, G., Koirala, S., et al. (2020). Scaling carbon fluxes from eddy covariance sites to globe: synthesis and evaluation of the FLUXCOM approach. Biogeosciences 17, 1343–1365. doi:10.5194/bg-17-1343-2020
Kalfas, J. L., Xiao, X., Vanegas, D. X., Verma, S. B., and Suyker, A. E. (2011). Modeling gross primary production of irrigated and rain-fed maize using MODIS imagery and CO2 flux tower data. Agric. For. Meteorology 151 (12), 1514–1528. doi:10.1016/j.agrformet.2011.06.007
Kang, S., Running, S. W., Zhao, M., Kimball, J. S., and Glassy, J. (2005). Improving continuity of MODIS terrestrial photosynthesis products using an interpolation scheme for cloudy pixels. Int. J. Remote Sens. 26 (8), 1659–1676. doi:10.1080/01431160512331326693
Kerr, J. T., and Ostrovsky, M. (2003). From space to species: ecological applications for remote sensing. Trends Ecol. Evol. 18 (6), 299–305. doi:10.1016/S0169-5347(03)00071-5
Kleinman, P. J. A., Spiegal, S., Rigby, J. R., Goslee, S. C., Baker, J. M., Bestelmeyer, B. T., et al. (2018). Advancing the sustainability of US agriculture through long-term research. J. Environ. Qual. 47, 1412–1425. doi:10.2134/jeq2018.05.0171
Knauer, J., Werner, C., and Zaehle, S. (2015). Evaluating stomatal models and their atmospheric drought response in a land surface scheme: a multibiome analysis. J. Geophys. Res. Biogeosciences 120, 1894–1911. doi:10.1002/2015JG003114
Knox, S. H., Bansal, S., McNicol, G., Schafer, K., Sturtevant, C., Ueyama, M., et al. (2021). Identifying dominant environmental predictors of freshwater wetland methane fluxes across diurnal to seasonal time scales. Glob. Change Biol. 27 (15), 3582–3604. doi:10.1111/gcb.15661
LeDell, E., Gill, N., Aiello, S., Fu, A., Candel, A., Click, C., et al. (2021). h2o: R interface for the 'H2O' Scalable machine learning platform. Avaliable At: https://CRAN.R-project.org/package=h2o.
LeDell, E., and Poirier, S. (2020). H2O AutoML: scalable automatic machine learning,” in 7th ICML Workshop on Automated Machine Learning (AutoML) (Virtual: International Conference on Machine Learning), 1–16. Available at: https://www.automl.org/wp-content/uploads/2020/07/AutoML_2020_paper_61.pdf.
Llyod, J., and Taylor, J. A. (1994). On the temperature dependence of soil respiration. Funct. Ecol. 8 (3), 315–323. doi:10.2307/2389824
Lobell, D. B., and Asner, G. P. (2002). Moisture effects on soil reflectance. Soil Sci. Soc. Am. J. 66, 722–727. doi:10.2136/sssaj2002.7220
Menefee, D., Rajan, N., Cui, S., Bagavathiannan, M., Schnell, R., West, J., et al. (2020). Carbon exchange of a dryland cotton field and its relationship with PlanetScope remote sensing data. Agric For. Meteorol. 294, 108130. doi:10.1016/j.agrformet.2020.108130
Moffat, A. M., Papale, D., Reichstein, M., Hollinger, D. Y., Richardson, A. D., Barr, A. G., et al. (2007). Comprehensive comparison of gap-filling techniques for eddy covariance net carbon fluxes. Agric. For. Meteorology 147 (3-4), 209–232. doi:10.1016/j.agrformet.2007.08.011
Mohebbian, R. M., Walia, E., Habibullah, M., Stapleton, S., and Wahid, K. A. (2021). Classifying MRI motion severity using a stacked ensemble approach. Magn. Reson. Imaging 75, 107–115. doi:10.1016/j.mri.2020.10.007
Mzuku, M., Khosla, R., and Reich, R. (2015). Bare soil reflectance to characterize variability in soil properties. Commun. Soil Sci. Plant Analysis 46 (13), 1668–1676. doi:10.1080/00103624.2015.1043463
Nguy-Robertson, A., Suyker, A., and Xiao, X. (2015). Modeling gross primary production of maize and soybean croplands using light quality, temperature, water stress, and phenology. Agric. For. Meteorology 213, 160–172. doi:10.1016/j.agrformet.2015.04.008
Novick, K. A., Biederman, J. A., Desai, A. R., Litvak, M. E., Moore, D. J. P., Scott, R. L., et al. (2018). The AmeriFlux network: a coalition of the willing. Agric. For. Meteorology 249, 444–456. doi:10.1016/j.agrformet.2017.10.009
Pettorelli, N., Bühne, H. S. t., Tulloch, A., Dubois, G., Macinnis-Ng, C., Queirós, A. M., et al. (2017). Satellite remote sensing of ecosystem functions: opportunities, challenges and way forward. Remote Sens. Ecol. Conservation 4 (2), 73–93. doi:10.1002/rse2.59
Pastorello, G., Trotta, C., and Canfora, E. (2020). The FLUXNET2015 dataset and the ONEFlux processing pipeline for eddy covariance data. Sci. Data 7, 225. doi:10.1038/s41597-020-0534-3
Qi, J., Chehbouni, A., Huete, A. R., Kerr, Y. H., and Sorooshian, S. (1994). A modified soil adjusted vegetation index. Remote Sens. Environ. 48 (2), 119–126. doi:10.1016/0034-4257(94)90134-1
Rajadurai, H., and Gandhi, U. (2020). A stacked ensemble learning model for intrusion detection in wireless network. Neural Comput. Applic 34, 15387–15395. doi:10.1007/s00521-020-04986-5
Reed, D. E., Poe, J., Abraha, M., Dahlin, K. M., and Chen, J. (2021). Modeled surface-atmosphere fluxes from paired sites in the upper Great Lakes region using neural networks. J. Geophys. Res. Biogeosciences 126, e2021JG006363. doi:10.1029/2021JG006363
Reeves, M. C., Zhao, M., and Running, S. W. (2005). Usefulness and limits of MODIS GPP for estimating wheat yield. Int. J. Remote Sens. 26 (7), 1403–1421. doi:10.1080/01431160512331326567
Reichstein, M., Falge, E., Baldocchi, D., Papale, D., Aubinet, M., Berbigier, P., et al. (2005). On the separation of net ecosystem exchange into assimilation and ecosystem respiration: review and improved algorithm. Glob. Chang. Biol. 11, 1424–1439. doi:10.1111/j.1365-2486.2005.001002.x
Robertson, G. P., and Chen, J. (2021). AmeriFlux BASE US-KM1 KBS marshall farms corn, ver 3-5. Berkeley, CA: AmeriFlux, hosted by the Lawrence Berkeley National Laboratory. doi:10.17190/AMF/1647439
Rondeaux, G., Steven, M., and Baret, F. (1996). Optimization of soil-adjusted vegetation indices. Remote Sens. Environ. 55 (2), 95–107. doi:10.1016/0034-4257(95)00186-7
Running, S., Mu, Q., and Zhao, M. (2015). “MOD17A2H MODIS/Terra gross primary productivity 8-day L4 global 500m SIN grid V006,” in NASA EOSDIS land processes DAAC (Sioux Falls, South Dakota: United States Geological Survey (USGS)). doi:10.5067/MODIS/MOD17A2H.006
Running, S. W., and Zhao, M. (2019). User’s guide daily GPP and annual NPP (MOD17A2/A3) and year-end gap-filled (MOD17A2HGF/A3HGF) products NASA earth observing system MODIS land algorithm. Avaliable At: https://lpdaac.usgs.gov/documents/495/MOD17_User_Guide_V6.pdf.
Running, S. W., and Zhao, M. (2015). User’s guide daily GPP and annual NPP (MOD17A2/A3) products NASA earth observing system MODIS land algorithm. Avaliable At: https://www.ntsg.umt.edu/files/modis/MOD17UsersGuide2015_v3.pdf.
Saeb, S., Lonini, L., Jayaraman, A., Jayaraman, A., Mohr, D. C., and Kording, K. P. (2017). The need to approximate the use-case in clinical machine learning. Gigascience 6 (5), 1–9. doi:10.1093/gigascience/gix019
Schmidt, J., Shi, J., Borlido, P., Chen, L., Botti, S., and Margues, M. A. L. (2017). Predicting the thermodynamic stability of solids combining density functional theory and machine learning. Chem. Mater. 29 (12), 5090–5103. doi:10.1021/acs.chemmater.7b00156
Shang, K., Yao, Y., Liang, S., Zhang, Y., Fisher, J. B., Chen, J., et al. (2021). DNN-MET: a deep neural networks method to integrate satellite-derived evapotranspiration products, eddy covariance observations and ancillary information. Agric. For. Meteorology 308–309, 108582. doi:10.1016/j.agrformet.2021.108582
IPCC (2019). “Summary for policymakers,” in Climate Change and Land: an IPCC special report on climate change, desertification, land degradation, sustainable land management, food security, and greenhouse gas fluxes in terrestrial ecosystems. Editors P. R. Shukla, J. Skea, E. Calvo Buendia, V. Masson-Delmotte, H. O. Pörtner, D. C. Robertset al. (Geneva, Switzerland: IPCC (Intergovernmental Panel on Climate Change)).
Sims, D. A., Rahman, A. F., Cordova, V. D., El-Masri, B. Z., Baldocchi, D. D., Bolstad, P. V., et al. (2008). A new model of gross primary productivity for North American ecosystems based solely on the enhanced vegetation index and land surface temperature from MODIS. Remote Sens. Environ. 112 (4), 1633–1646. doi:10.1016/j.rse.2007.08.004
Singh, S. K., Bejagam, K. K., An, Y., and Deshmukh, S. A. (2019). Machine-learning based stacked ensemble model for accurate analysis of molecular dynamics simulations. J. Phys. Chem. 123 (24), 5190–5198. doi:10.1021/acs.jpca.9b03420
Smith, W. K., Fox, A. M., MacBean, N., Moore, D. J. P., and Parazoo, N. C. (2019). Constraining estimates of terrestrial carbon uptake: new opportunities using long-term satellite observations and data assimilation. New Phytol. 225 (1), 105–112. doi:10.1111/nph.16055
Spiegal, S., Bestelmeyer, B. T., Archer, D. W., Augustine, D. J., Boughton, E. H., Boughton, R. K., et al. (2018). Evaluating strategies for sustainable intensification of US agriculture through the Long-Term Agroecosystem Research network. Environ. Res. Lett. 13, 034031. doi:10.1088/1748-9326/aaa779
Steven, M. D. (1993). Satellite remote sensing for agricultural management: opportunities and logistic constraints. ISPRS J. Photogrammetry Remote Sens. 48 (4), 29–34. doi:10.1016/0924-2716(93)90029-M
Suyker, A. (2021a). AmeriFlux BASE US-Ne1 Mead - irrigated continuous maize site, Ver. 11-5. Berkeley, CA: AmeriFlux, hosted by the Lawrence Berkeley National Laboratory. doi:10.17190/AMF/1246084
Suyker, A. (2021b). AmeriFlux BASE US-Ne2 Mead - irrigated maize-soybeanbean rotation site, Ver. 11-5. AmeriFlux AMP. doi:10.17190/AMF/1246085
Suyker, A. (2021c). AmeriFlux BASE US-Ne3 Mead - rainfed maize-soybeanbean rotation site, Ver. 11-5. AmeriFlux AMP. doi:10.17190/AMF/1246086
Suyker, A. E., and Verma, S. B. (2012). Gross primary production and ecosystem respiration of irrigated and rainfed maize–soybean cropping systems over 8 years. Agric. For. Meteorology 165, 12–24. doi:10.1016/j.agrformet.2012.05.021
Talib, A., Desai, A. R., Huang, J., Griffis, T. J., Reed, D. E., and Chen, J. (2021). Evaluation of prediction and forecasting models for evapotranspiration of agricultural lands in the Midwest U.S. U.S. J. Hydrology 600, 126579. doi:10.1016/j.jhydrol.2021.126579
Tang, X., Ding, Z., Li, H., Li, X., Luo, J., Xie, J., et al. (2015). Characterizing ecosystem water-use efficiency of croplands with eddy covariance measurements and MODIS products. Ecol. Eng. 85, 212–217. doi:10.1016/j.ecoleng.2015.09.078
Tuner, D. P., Ritts, W. D., Cohen, W. B., Gower, S. T., Running, S. W., Zhao, M., et al. (2006). Evaluation of MODIS NPP and GPP products across multiple biomes. Remote Sens. Environ. 102 (3-4), 282–292. doi:10.1016/j.rse.2006.02.017
Van der Laan, M. J., Polley, E. C., and Hubbard, A. E. (2007). Super learner. Stat. Appl. Genet. Mol. Biol. 6 (1), Article25. doi:10.2202/1544-6115.1309
Wang, X., Ma, M., Li, X., Song, Y., Tan, J., Huang, G., et al. (2012). Validation of MODIS-GPP product at 10 flux sites in northern China. Int. J. Remote Sens. 34 (2), 587–599. doi:10.1080/01431161.2012.715774
Wutzler, T., Lucas-Moffat, A., Migliavacca, M., Knauer, J., Sickel, K., Šigut, L., et al. (2018). Basic and extensible post-processing of eddy covariance flux data with REddyProc. Biogeosciences 15, 5015–5030. doi:10.5194/bg-15-5015-2018
Xiao, J., Ollinger, S. V., Frolking, S., Hurtt, G. C., Hollinger, D. Y., Davis, K. J., et al. (2014). Data-driven diagnostics of terrestrial carbon dynamics over North America. Agric. For. Meteorology 197, 142–157. doi:10.1016/j.agrformet.2014.06.013
Xin, Q., Broich, M., Suyker, A., Yu, Le, Y., and Gong, P. (2015). Multi-scale evaluation of light use efficiency in MODIS gross primary productivity for croplands in the Midwestern United States. Agric. For. Meteorology 201, 111–119. doi:10.1016/j.agrformet.2014.11.004
Xu, L., and Baldocchi, D. D. (2003). Seasonal trends in photosynthetic parameters and stomatal conductance of blue oak (Quercus douglasii) under prolonged summer drought and high temperature. Tree Physiol. 23 (13), 865–877. doi:10.1093/treephys/23.13.865
Yang, F., Ichii, K., White, M. A., Hashimoto, H., Michaelis, A. R., Votava, P., et al. (2007). Developing a continental-scale measure of gross primary production by combining MODIS and AmeriFlux data through Support Vector Machine approach. Remote Sens. Environ. 110 (1), 109–122. doi:10.1016/j.rse.2007.02.016
Yao, Y., Liang, S., Li, X., Chen, J., Liu, S., Jia, K., et al. (2017). Improving global terrestrial evapotranspiration estimation using support vector machine by integrating three process-based algorithms. Agric. For. Meteorology 242, 55–74. doi:10.1016/j.agrformet.2017.04.011
Yin, Y., Byrne, B., Liu, J., Wennberg, P., Davis, K. J., Magney, T., et al. (2020). Cropland carbon uptake delayed and reduced by 2019 Midwest floods. AGU Adv. 1, e2019AV000140. doi:10.1029/2019AV000140
Ying, X. (2019). An overview of overfitting and its solutions. J. Phys. Conf. Ser. 1168, 022022. doi:10.1088/1742-6596/1168/2/022022
Yu, T., Zhang, Q., and Sun, R. (2021). Comparison of machine learning methods to up-scale gross primary production. Remote Sens. 13 (13), 2448. doi:10.3390/rs13132448
Zhai, B., and Chen, J. (2018). Development of a stacked ensemble model for forecasting and analyzing daily average PM2.5 concentrations in Beijing, China. Sci. Total Environ. 635, 644–658. doi:10.1016/j.scitotenv.2018.04.040
Zhang, Q., Cheng, Y. B., Lyapustin, A. I., Wang, Y., Xiao, X., Suyker, A., et al. (2014). Estimation of crop gross primary production (GPP): I. impact of MODIS observation footprint and impact of vegetation BRDF characteristics. Agric. For. Meteorology 191, 51–63. doi:10.1016/j.agrformet.2014.02.002
Keywords: machine learning, gross primary productivity, eddy covariance, agroecosystems, remote sensing
Citation: Menefee D, Lee TO, Flynn KC, Chen J, Abraha M, Baker J and Suyker A (2023) Machine learning algorithms improve MODIS GPP estimates in United States croplands. Front. Remote Sens. 4:1240895. doi: 10.3389/frsen.2023.1240895
Received: 15 June 2023; Accepted: 09 October 2023;
Published: 02 November 2023.
Edited by:
Liangxiu Han, Manchester Metropolitan University, United KingdomCopyright © 2023 Menefee, Lee, Flynn, Chen, Abraha, Baker and Suyker. This is an open-access article distributed under the terms of the Creative Commons Attribution License (CC BY). The use, distribution or reproduction in other forums is permitted, provided the original author(s) and the copyright owner(s) are credited and that the original publication in this journal is cited, in accordance with accepted academic practice. No use, distribution or reproduction is permitted which does not comply with these terms.
*Correspondence: Dorothy Menefee, ZG1lbmVmZWVAdGFybGV0b24uZWR1