 Sude Gul Yel1*Esra Tunc Gormus2
- 1Department of Land Registry and Cadastre, Artvin Coruh University, Artvin, Türkiye
- 2Department of Geomatics Engineering, Karadeniz Technical University, Trabzon, Türkiye
Classification of tree species provides important data in forest monitoring, sustainable forest management and planning. The recent developments in Multi Spectral (MS) and Hyper Spectral (HS) Imaging sensors in remote sensing have made the detection of tree species easier and accurate. With this systematic review study, it is aimed to understand the contribution of using the Multi Spectral and Hyper Spectral Imaging data in the detection of tree species while highlighting recent advances in the field and emphasizing important directions together with new possibilities for future inquiries. In this review, researchers and decision makers will be informed in two different subjects: First one is about the processing steps of exploiting Multi Spectral and HS images and the second one is about determining the advantages of exploiting Multi Spectral and Hyper Spectral images in the application area of detecting tree species. In this way exploiting satellite data will be facilitated. This will also provide an economical gain for using commercial Multi Spectral and Hyper Spectral Imaging data. Moreover, it should be also kept in mind that, as the number of spectral tags that will be obtained from each tree type are different, both the processing method and the classification method will change accordingly. This review, studies were grouped according to the data exploited (only Hyper Spectral images, only Multi Spectral images and their combinations), type of tree monitored and the processing method used. Then, the contribution of the image data used in the study was evaluated according to the accuracy of classification, the suitable type of tree and the classification method.
1 Introduction
Tree species information is an indispensable resource for managing forest ecosystems. Forests are the most effective fighters of global warming, which is why we need them more than ever. The need for tree species knowledge for the sustainable management of forests is timeless. With the rapid increase in population in our developing and consuming world, the need for forests and forest products is increasing. Therefore, whether natural forests or industrially grown forests, they all need sustainable management (Hycza et al., 2018). Species recalculations may also be needed after future forest crop planning, deforestation as a result of illegal cutting, damage to forests as a result of fires or natural disasters (Xi et al., 2021; Zagajewski et al., 2021). The determination of tree species is carried out by the local forest administrations by preparing stand maps with classical methods based on land surveys. However, there are easy and less costly ways to detect tree species, which is a constant need, compared to conventional methods (Immitzer et al., 2012). In 1998, the first studies on tree species detection with hyperspectral images (AVIRIS) were made by (Martin et al., 1998). Today, hyperspectral images are still used for this purpose. Recent spectral innovations in hyperspectral and multispectral imaging methods have led to their frequent use in studies on tree species detection. Vegetation calculations have been facilitated by the use of red edge bands, which are used to measure the level of chlorophyll, which gives the plant its green color, especially in multispectral images. The phenological differences between plants are calculated with the help of these red edge bands and it has been widely used in tree species determination (Grabska et al., 2019). Tree detection was carried out by using seasonal tree phenology differences with time series analyzes on multi-temporal multispectral images that are served free of charge (Grabska et al., 2019; Xi et al., 2021). Hyperspectral images already had high spectral resolution due to the large number of narrow bands they contained, but the low spatial resolution made it difficult to detect individual tree species. These difficulties have been overcome with the pan sharpening method, which has been frequently applied recently by Lassalle et al. (2022) and Ferreira et al. (2020).
With the help of free satellite images and open source applications, tree species can be detected almost inexpensively. With the help of unmanned aerial vehicles or planes, tree species detection studies can be carried out in a more up-to-date and less tiring way than field studies (Hati et al., 2021; Yang et al., 2022). With hyperspectral and multispectral images, individual tree identifications can be made as well as stand-based species mapping (Ferreira et al., 2020; Grabska et al., 2020). With the without restraint development of technology, the increase in artificial intelligence applications has also contributed to remotely sensed images (Bolyn et al., 2022).
The use of machine learning, deep learning, newly produced algorithms and plant indices with remotely sensed images has increased the classification accuracy (Xi et al., 2021; Yang et al., 2022) Although review studies have been carried out for tree species detection in the past years, due to the recent developments in classification and satellite images, a compilation study in this area has been required (Fassnacht et al., 2016).
A systematic review was made by examining the articles written in English published in peer-reviewed journals containing technological developments and methods that have occurred in recent years. In this review study we prepared for the determination of tree species; we used recent studies that have exploited hyperspectral images, multispectral images, and their combination (Hycza et al., 2018; Rumora et al., 2020; Abbas et al., 2021; Hati et al., 2021; Yang et al., 2022).
During the literature review, articles on tree species detection with multispectral and hyperspectral images between the years 2012–2022 were selected. The search was conducted on 20 November 2022 by searching for the phrases “Tree type detection, tree species classification” in SCI journals and excluding systems other than Hyperspectral and Multispectral imaging systems (like LIDAR, SAR).
As all the methods, bands, algorithms and plant indices used in these studies were different according to the types of forests (Xi et al., 2021; Yang et al., 2022). For this reason, we evaluated these methods according to the forest types.
In this review, we have classified the studies on tree species detection as six forest types to make it more understandable. Rainforests are also considered as tropical forests, however, we have considered the two forest types differently due to the differences in the species they contain and the reason that not every tropical tree species will be a rain forest. Forests are grouped as; Mangrove forests (Hati et al., 2021), Tropical forests (Ferreira et al., 2016), Rainforests (La Rosa et al., 2021), Boreal forests (Grabska et al., 2020), and Temperate forests (Persson et al., 2018; Hościło and Lewandowska, 2019).
In this study, 17 articles which use only MS images (Javan et al., 2021; Xi et al., 2021; Wang et al., 2022) 13 articles which use only HS images (Franklin and Ahmed, 2018; Hycza et al., 2018; Abbas et al., 2021) and 4 articles which use fusion of both images (Hati et al., 2021; Yang et al., 2022) for the detection of tree species were reviewed as shown in Figure 1.
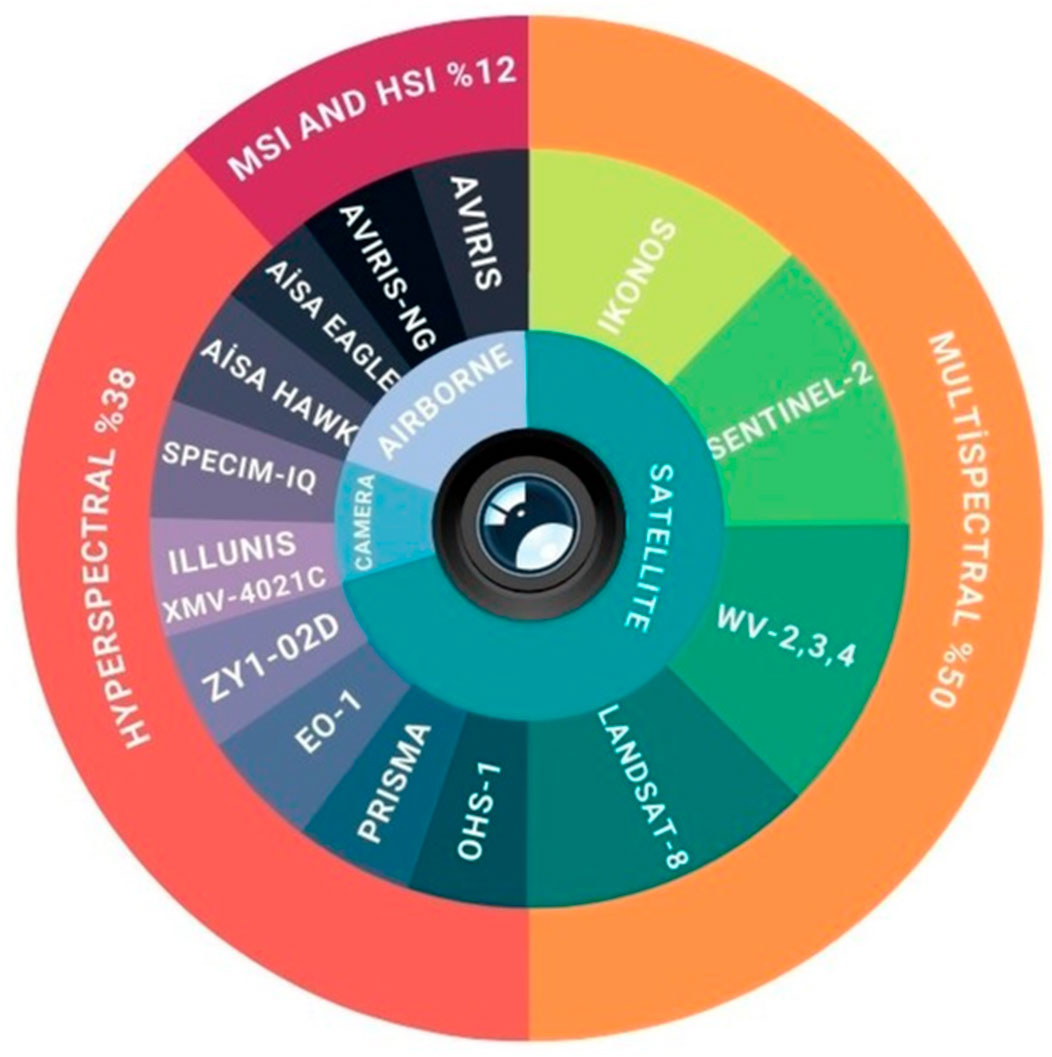
FIGURE 1. Satellite and sensor types used in the studies.
As a result of the examinations, detailed information is given about the pre-processing steps (atmospheric correction, size reduction, etc.), classification methods (machine learning, deep learning, different plant indices) and methods used in accuracy assessment (majority class assessment, species composition assessment, etc.) in the following sections.
2 Detection of tree species: Forests and approaches
2.1 Forest types
In this review, we evaluated the studies in 4 different types. These are Boreal, Temperate, Subtropical and Tropical forests. Since the tree species in the forests show different characteristics, they also contain different spectral values in terms of absorption and retroreflection of sunlight. Boreal forests are forests spread in the north of the world with their cold-resistant structures. Boreal forests, which can withstand even very cold climatic conditions, contain fewer trees in terms of species. They are generally more shade tolerant and have narrow crowns that absorb sunlight even at the lowest angle. Boreal forests generally contain the following types of trees; Pines (Pinus) and spruces (Picea), larch (Larix) and birch (Betula), aspen (Populus) and willow (Salix) (Landsberg and Waring, 2014) Tropical forests are also often referred to as rainforests, but not all tropical forests are always wet. They are generally found in the Amazon in the northern half of South America, where temperatures are high, in the forests of Central Africa and the forests of Southeast Asia (Landsberg and Waring, 2014). In this compilation study, trees were classified within the forest community in which they are generally located. However, since not every tropical tree will be included in a rainforest and a separate tree identification study has been carried out, it has been classified as a separate forest type (La Rosa et al., 2021). Species found in temperate forests; oak, beech, fir, maple, elm, chestnut and cedar. These trees are often used commercially because they are straight and tall. Mangroves live in coastal areas in the tropics and subtropics. Due to its ecological characteristics, it is an important resource for the use of wood, its use in medicine, aquaculture and even ecotourism. Mangroves are trees that are under threat due to intense storms, floods, heavy human use (Mafaziya Nijamdeen et al., 2023). In the classification we make as other forests, there are trees that can grow in many places that are not specifically included in such forests or that are mentioned in a small number of studies. Among the studies that made tree detection with multispectral (MSI) and hyperspectral (HSI) images, which we examined within the scope of the review, the tree species found in Boreal forests were determined the most as shown in Figure 2.
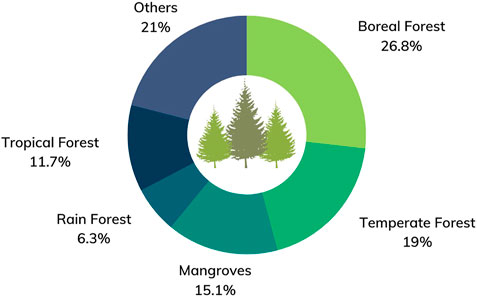
FIGURE 2. Forest types and percentages of trees classified in the studies examined.
In the articles reviewed, tree detection was done in two ways, individual and forest stands (Ferreira et al., 2019; Grabska et al., 2020). Stand maps created by authorized institutions and organizations may become out of date in a short time. However, forest inventory information or stand maps may not be sufficient in determining the tree species to be used for forest monitoring. In such cases, tree detection with remotely sensed images ensures that the data is kept up-to-date. Among the studies we examined, the number of studies that made individual tree detection was less than the number of studies that made stand-based detection due to classification difficulties. While hyperspectral images (HSI) were used more in individual tree detection, multispectral images (MSI) were used more in stand-based detections (Figure 3).
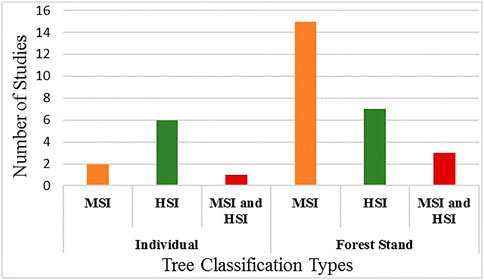
FIGURE 3. Tree detection studies at individual and tree crown level.
3 Remote sensing of trees: Instruments and methodologies
3.1 Detecting trees by satellite-sensor and cameras
The data used for tree species detection in remote sensing typically include aerial or satellite imagery, including high-resolution multispectral or hyperspectral imagery, Light Detection and Ranging (LiDAR) data, and thermal imagery. These data types provide information on the reflectance, radiance, structure, and temperature of the Earth’s surface, which can be used to identify and distinguish different tree species based on their unique spectral, structural, and thermal signatures.
However, these data have advantages and disadvantages compared to each other. While LIDAR is a great invention for detecting tree species, it is costly to use. Although Hyperspectral Images are successful in crown detection thanks to their high spectral resolution, they are easier to process and use than multispectral data due to their size. In this study, we examined what has been done in tree detection and how it can be improved with low cost, high resolution, multispectral and hyperspectral data that we can analyze on a global scale.
Hyperspectral images are obtained through hyperspectral remote sensing technology. This technology uses specialized sensors on satellites, aircraft, or unmanned aerial vehicles (UAVs) to capture data across a wide range of the electromagnetic spectrum, including visible light, near-infrared, and shortwave infrared. The data captured by these sensors is divided into many narrow spectral bands, typically around 10–30 nm wide, to provide detailed information about the reflectance properties of different materials in the scene. This data is then processed to form an image, where each pixel represents the reflectance values for a specific location in the scene across all of the spectral bands. There are various hyperspectral remote sensing platforms and sensors available, each with different specifications and capabilities. The choice of platform and sensor depends on the specific requirements of the study, such as the desired spatial and spectral resolution, the size of the area to be covered, and the cost constraints.
The important feature of satellite images in tree detection is their spatial and spectral resolutions. The spectral resolution of the trees will be important for the accuracy of the spectral response, and the spatial resolution will be important for the comparison of these trees with the training data during classification. High-resolution images allowed individual tree detection and even the separation of leaves from these trees (Grabska et al., 2019).
However, not every satellite image has both of these advantages at the same time. Since it is not possible for satellite images to have high spectral and spatial resolution at the same time, users found the solution in pansharpening. They also increased the spatial resolution of hyperspectral images with a high number of spectral bands and suitable for tree detection by using panchromatic bands (for example,: (Pu and Landry, 2012; Ferreira et al., 2019; Lassalle et al., 2022).
MS images from different satellites such as Landsat, IKONOS, Quickbird, and Sentinel have been frequently used in the classification of tree species. Among the main reasons why these systems are preferred is that they provide free images at more frequent times than other systems (LIDAR, Unmanned Aerial Vehicle). Another reason for preference is the bands they have regarding SWIR, tissue properties and plant indices (Figure 4).
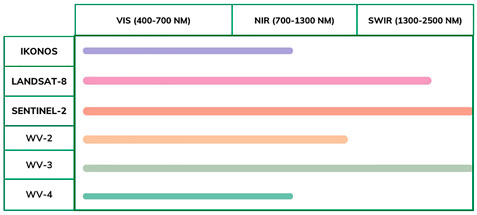
FIGURE 4. Satellites with multispectral sensors used in the studies and their spectral properties.
When these bands are used together with various classification methods, they provide great convenience to the user in both single image and instant tree detection (Xi et al., 2021). By making use of the phenological cycles of trees, species identification can be made with images of a tree taken on more than one date and season. The seasonal yellowing of leaves in deciduous trees allows each tree to give a different spectral reflection and facilitates detection. In a stand where deciduous and evergreen trees are mixed, species identification can be made by making use of the defoliation seasons (Grabska et al., 2019). The main difficulty in species identification studies with the help of time series is to identify evergreen trees among themselves. Hyperspectral images are also frequently used in the classification of tree species. The authors preferred these images because they provide deeper information. There are many studies on tree detection with unmanned aerial vehicle, camera or satellite images. Hyperspectral images have mostly been used for individual crown classification and species identification in mangrove forests. Authors have preferred to use hyperspectral image in their studies according to the depth of the study and the desired classification sensitivity with the cost of spatial resolution.
3.2 General operation steps
The most basic workflow applied in identifying and mapping tree species is given in Figure 5. Of course, these are not the limited options here, and they will be discussed in detail in the following parts of the study. The most basic issue in a tree detection study is to choose the image that suits your study. There are two important questions to ask when choosing an image; “How would the spectral characteristics of this image help me solve my problem?”, “Is the spatial resolution of this selected image suitable for my intended sensitivity?”. For example, while higher spectral resolution hyperspectral images are often used in individual crown detection processes, there is a need to increase the spatial resolution of the image at the same time. Therefore, it is aimed to increase the spatial resolution of the hyperspectral image with the pan-sharpening method. In stand-based species identification studies, high spectral resolution is ignored and free-to-use hyperspectral images are frequently used.
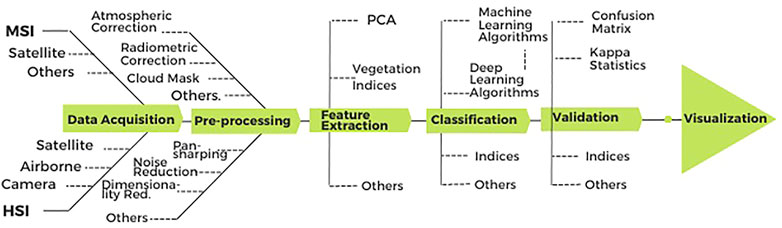
FIGURE 5. Tree type classification and visualalization workflow.
We can list the workflow in general as follows, of course, the methods are not limited to these. With the advances in hyperspectral and multispectral image processing, these methods are also being renewed day by day. The methods we describe in this article are limited to the papers we have reviewed that perform tree species detection with existing hyperspectral and multispectral images.
Data acquisition: Acquire hyperspectral or multispectral data (or both) of the study area using a remote sensing instrument.
Pre-processing: Perform necessary preprocessing steps on the both data, such as atmospheric correction, noise reduction, and radiometric correction. Many operations such as size reduction for hyperspectral data and cloud masking for multispectral data can also be added to this step depending on the data type.
Feature extraction: Extract relevant features from the corrected hyperspectral and multispectral data. This can include calculating vegetation indices, principle component analysis (PCA), and transforming the data into the wavelength domain.
Classification: Use machine learning algorithms such as decision trees, random forests, and support vector machines to classify tree types based on extracted features, or use deep learning algorithms such as U-net, AlexNet, which is seen as a subset of machine learning. These are just a few of the most up-to-date methods, of course, traditional methods or different algorithms that are being developed can also be used.
Validation: Validate the accuracy of the classification results using an independent dataset or by applying an accuracy assessment technique, such as confusion matrix or k-fold cross-validation.
Visualization: Create maps and visualizations to display the results of the tree species classification.
4 Review of tree classification studies
4.1 Tree detection with MSI, HSI
Data providing MS image and containing visible (VIS), near infrared (NIR) and short-wave infrared (SWIR) bands provide detailed information, making it very easy to distinguish between different tree species. In particular, their multi-time availability makes them preferable for tree detection. When tree detection studies conducted with multispectral images since 2012 were examined, it was seen that most of them benefited from multi-temporal images (Persson et al., 2018; Immitzer et al., 2019; Grabska et al., 2020; Xi et al., 2021). We classified the bands used in the studies we review within the scope of the review study into 3 main types. These are VIS (400–700 nm), NIR (700–1300 nm) and SWIR (1300–2500 nm). The information on how often the tapes are used alone and together in studies can be found in Figure 6.
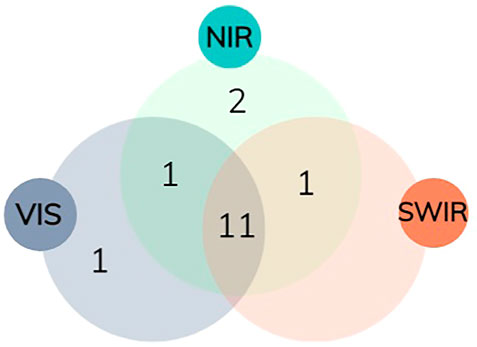
FIGURE 6. Venn diagram of the use of multispectral sensor bands alone or together in studies.
Leaves absorb light due to the chlorophyll they contain. The way the incoming photons are distributed in the mesophyll within the leaf depends on the structure of the leaf. Due to the lignin molecule, cellulose and nitrogen it contains, more reflection is expected in the SWIR band, but unfortunately this is not possible in living leaves. Because the water contained in living leaves reduces the reflection. However, since there is no water in the dry leaves, they will show more reflection in the SWIR band (Persson et al., 2018).
This makes it easy to distinguish between deciduous and evergreen trees using multi-time images.
Sentinel-2 has a wider stripe width than other multispectral image providers. In this way, it does not take long for him to visit the same place again. Cloud-free image capture becomes easier with more frequent visits. It facilitates tree species identification thanks to its three red edge bands (Vegetation Red Edge), which are used to measure chlorophyll levels. This explains the reason why it is most preferred in studies with time series analysis (Hościło and Lewandowska, 2019; Immitzer et al., 2019; Grabska et al., 2020).
The high resolution of the panchromatic band of the VHR sensors of the WV-3 satellite provides clear visualization of individual tree crowns. Thanks to the SWIR bands, the canopies can be easily detected. For this reason, Ferreira et al. (2019) preferred the WV-3 satellite to detect individual trees in tropical forests. Immitzer et al. (2012) produced spectral signatures for 10 tree species in his study in Austrian forests and as a result reflection values of broad-leaved tree species in the Red Edge and NIR bands were higher than those of conifers. Cypresses were the conifer tree with the highest reflectance value in the NIR band, followed by fir, larch, yellow pine, and spruce. While NIR bands can make the distinction between broadleaf and coniferous trees sharper, it has not been successful enough in determining the subspecies among themselves.
One of the most important reasons for using hyperspectral images for tree species detection is that it can distinguish two different subspecies of the same species from each other thanks to its high spectral resolution (Hati et al., 2021). In studies to detect tree species, it has been seen that hyperspectral data are obtained by different platforms and sensors such as unmanned aerial vehicles (UAV), aircraft, terrestrial cameras, satellites (Hycza et al., 2018; Abbas et al., 2021; Hati et al., 2021; La Rosa et al., 2021). The use of hyperspectral images obtained from unmanned aerial vehicles has become increasingly applicable in the field of forestry. Because unmanned aerial vehicles are safer compared to aircraft, flight plans can be adjusted more flexibly and the cost is lower (Franklin and Ahmed, 2018). Due to the chemical content of the trees, it is normal for each of them to give a different reflection in different bands, these reflections allow us to distinguish between individual tree crowns as well as stand-based tree discrimination. These distinctions are often not clearly detectable with broadband multispectral images. However, individual tree crowns can be distinguished sharply thanks to the narrow bands of hyperspectral images (Hycza et al., 2018).
Sensors are selected in accordance with the classification character. For example, a higher spectral resolution sensor is needed to distinguish between two different tree species that give very close spectral reflections (Richter et al., 2016).
AVIRIS-NG data, the successor of AVIRIS, was used in the mangrove species detection study. AVIRIS-NG is a joint project of the Indian Space Research Organization (ISRO) and NASA and provides detailed data from many different parts of India (Hati et al., 2021).
La Rosa et al. (2021), on the other hand, carried out a study of tree species determination in dense forest areas with a CMOSIS CMV400 sensor camera with bands in the range of 500 nm and 900 nm attached to a Quadcopter Unmanned Aerial Vehicle (UAV). Specim brand Finnish imaging products are one of the most commonly used imaging systems in the article we reviewed. A handheld camera named Specim IQ of this system, Eagle and Hawk sensors of AISA imaging systems, one of the aerial systems, were used separately and together in tree species detection studies (Hycza et al., 2018; Abbas et al., 2021). Collecting spectral signatures from tree leaves, Harrison et al. (2018) used the Agilent 4100 ExoScan FTIR (Fourier transform infrared) portable spectrometer to determine the diffuse reflection spectrum of leaves.
Because urban landscapes contain so many species, classification is more difficult compared to other stand forests. Therefore, it is necessary to take advantage of the high spectral resolution of hyperspectral images. For this purpose, AVIRIS satellite images were also used to detect trees of urban forests at the single tree level (Xiao et al., 2004). The bands around 970 nm were removed because they were in the transition region between the sensors and had low signal content. The bands below 400 nm and above 2400 nm are excluded from the image because they are noise bands. Studies were carried out in the remaining bands between 450–2400 nm. Vaglio Laurin et al. (2016) who has exploited the AISA Eagle sensor, has removed noisy bands in the range of 400–450 nm and 900–1000 nm. Due to the low signal, he removed the bands between 759–766 in the range of 450–900 nm and worked with 186 bands in this range (Figure 7).
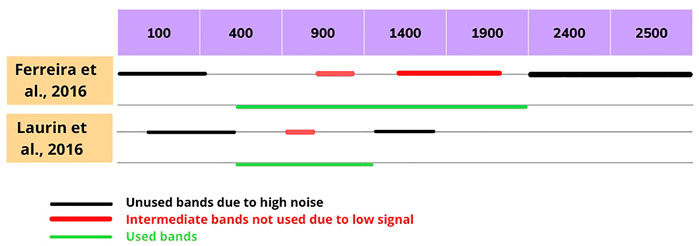
FIGURE 7. Bands extracted and used in hyperspectral images.
A minimum noise fraction (MNF) has been applied to eliminate or reduce each pixel market. They retained the MNF components, where the crowns were noise-free and clearly visible. After this transformation, it was converted to its original scale in order to calculate vegetative indexes.
Hyperspectral and multispectral images as well as simultaneous aerial photographs were used to determine the crowns precisely. The simulation was done by considering the hyperspectral band gaps to be used while simulating the Wv-3 data. These bands were simulated with Spectral Response Functions (SRF) (Vaglio Laurin et al., 2016).
4.1.1 Pre-processing methods
After leaving the Sun, solar radiation travels to the Earth and from there to the satellite sensor. During this journey, it is affected by some factors such as radiation absorption and scattering by gases and aerosols, causing the reflection values to be different from what they are (López-Serrano et al., 2016). In some classification processes, when training samples and data are taken over the same satellite image, correction is not required, but when using multi-time data, since the atmospheric effect on the two data will be different, it becomes necessary to make corrections (Song et al., 2001).
Improvements should be made in studies involving detailed classification, such as tree species detection, because atmospheric effects increase spectral confusion between two different tree species (Pu and Landry, 2012). Most satellite instrument providers perform their own atmospheric correction deployment. For example, while the European Space Agency (ESA) provided its own atmospheric correction for Sentinel-2, the National Aeronautics and Space Administration (NASA) also introduced Ledaps and LaSRC corrections for its satellite mission Landsat (Rumora et al., 2020). Among the studies we reviewed, atmospheric correction of Sentinel-2 images was done with the Sen2Cor plug-in provided by ESA (Wessel et al., 2018; Immitzer et al., 2019; Axelsson et al., 2021; Xi et al., 2021). Atmospheric effects of WV-2, WV-3 and IKONOS satellite images were corrected with DigitalGlobe (Pua and Landry, 2012; Ferreira et al., 2019). Corrections of some satellite images were also made with FLAASH using the Envi module.
Another problem after these fixes is cloudy weather conditions. Whatever our classification problem, one of our most fundamental problems is cloud-covered satellite images. For this reason, while the studies are carried out, cloudy weather is chosen where there is no cloud as much as possible or there is little enough to not prevent classification (Grabska et al., 2019). Images from previous or following years can also be used instead of images that cannot be obtained without a cloud (Xi et al., 2021). Removing non-forest areas from forest areas before classification shortens the classification process.
For this purpose, the normalized difference vegetation index (NDVI) and other vegetation indices were used (Pu and Landry, 2012). These indices also have the ability to reduce atmospheric problems (Xi et al., 2021). In addition to vegetation indices, machine learning methods were also used to apply forest masks (Grabska et al., 2019). Pan sharpening is a method applied to increase the spatial resolution of spectrally rich multispectral images (Wang et al., 2022). There are many types of algorithms categorized as Component Replacement (CS-based), Multiple Resolution Analysis (MRA), Variational Optimization-based (VO), and Hybrid (Javan et al., 2021). Among the studies we reviewed, three tree-detection studies pan-sharpened the multispectral images it used (Pu and Landry, 2012; Ferreira et al., 2019; Lassalle et al., 2022). This method is especially preferred for tree crown detection because it provides a clearer image compared to the unsharpened image (Pu and Landry, 2012). Ferreira et al. (2019) combined the images he used with the relevant bands to be used in tree detection using the Gram-Schmidt transform. He explained that the reason for choosing this method is that images with low spatial resolution preserve their spectral values and that it is beneficial in tree detection studies done before.
The Nearest Neighbor Diffusion (NNDiffuse) algorithm pan-sharpen images by exploiting the spectral response of neighboring pixels based on spectral mix analysis. Lassalle et al. (2022) sharpened the bands to be used in images taken from WV-3 and WV-4 satellites using the Nearest Neighbor Diffusion (NNDiffuse) algorithm in ENVI® (L3Harris Geospatial, Boulder, CO, United States of America). Pu and Landry (2012) used FieldSpec®3, Analytical Spectral Devices on site and took spectral measurements from the locations they identified with IKONOS and WV-2. Using these measurements, he calibrated the ground reflection and applied a pan-sharpening between the respective bands. Hyperspectral data contains a large number of correlated data. Sometimes this is perceived as an advantage, but sometimes it increases the noise. Increasing the number of spectral bands also introduces computational complexity. This is also known as the curse of dimensionality. According to this phenomenon, the increase in the number of bands causes an exponential increase in the training data (Dabiri and Lang, 2018). Therefore, one of the most basic preprocessing steps of hyperspectral data is size reduction and noise reduction. Principal component analysis (PCA) is widely used to achieve these (Hycza et al., 2018). Hati et al. (2021) made the atmospheric correction of the data received from the AVIRIS-NG sensor on the model he developed using the Aerosol Optical Depth (AOD) and absorption depth values. He manually removed the bands he found bad from the data. The larger the data, the longer and more laborious it will be to process, thus reducing the size of the data with Principal Component Analysis (PCA). Radiometric and dark signal correction was made with the help of Hyperspectral Imager software of the images of the CMOSIS CMV400 sensor mounted on the UAV vehicle (Abbas et al., 2021). Radiometric correction and georeferencing of hyperspectral data acquired with SPECIM imaging systems were performed with the CaliGeo Pro application integrated with ENVI (Richter et al., 2016). After atmospheric and geographical corrections are made, forest and non-forest masking should be applied to the data to reduce the size of the data to be processed and to protect it from misclassification. These masking processes can be done by manually processing the training data from satellite images with machine learning methods (Hycza et al., 2018), by taking the coordinates of trees with terrestrial acquisition techniques (Jing et al., 2012) or by making use of forest inventories (Richter et al., 2016) can be done.
An Augmented Linear Mixing Model (ALMM) is a type of hyperspectral unmixing technique that can contribute to tree species identification studies by improving the accuracy and robustness of the analysis. Hyperspectral unmixing is the process of estimating the fractional abundance of endmember spectra present in a hyperspectral image. This information can be used to identify different tree species based on their unique spectral signatures. The ALMM approach addresses the issue of spectral variability, which occurs when the same tree species can have different spectral signatures due to variations in factors such as age, physiology, or environmental conditions. The ALMM approach models this spectral variability by augmenting the traditional linear mixing model with additional information, such as spectral libraries or prior knowledge of the species, to improve the accuracy and robustness of the unmixing results (Hong et al., 2018). Although not used in the studies we reviewed, By using the ALMM approach, researchers can obtain more accurate and reliable information on the spectral signatures of different tree species, which can improve the accuracy and robustness of tree species identification studies in remote sensing.
4.1.2 Multi-sensor fusion
The combined use of hyperspectral and multispectral images contributed to tree species detection studies. In the studies, band combinations of multispectral and hyperspectral sensors were made and used together by comparing the accuracy rates provided by both platforms (Ferreira et al., 2016; Hati et al., 2021; Yang et al., 2022). Some adaptations have to be made for the combined use of hyperspectral and multispectral sensor data. For this, hyperspectral data simulates multispectral bands by spectral resampling. Narrow band gaps used in hyperspectral data are adapted to multispectral images by filtering (Ferreira et al., 2016).
Yang et al. (2022) tried to choose cloud-free images as much as possible and therefore kept the data diversity very much.
Hati et al. (2021) also conducted a mangrove species detection study, and for this study Landsat-8, Sentinel-2 multispectral imaging systems, Hyperion, AVIRIS hyperspectral imaging systems were used. In order to make uniform patch detections, samples were taken with a hand-held spectroradiometer (ASD FieldSpec®) in the study area, as well as the satellite platforms it uses. As a result of these examples, the average product created a patch spinning and used it for classification.
450–2400 nm wavelength hyperspectral (SPECIM, Aisa) and simulated multispectral data (WW-3) were used to distinguish and map tree species in tropical seasonal semi-deciduous forests. In addition to these, vegetation indices were also used to identify individual tree species (Ferreira et al., 2016).
The combined use of multispectral and hyperspectral data provides great advantages in tree species detection. Some of the articles we reviewed used these two data for comparison, while others used them together by simulating methods such as Spectral Response Functions (SRF) (Vaglio Laurin et al., 2016). Spectral Response Functions (SRFs) refer to the sensitivity of a remote sensing instrument to different wavelengths of light. SRFs describe how much energy a sensor detects at each wavelength in the electromagnetic spectrum and are used to convert the raw digital numbers (DNs) obtained from the sensor into physical units, such as reflectance (D’Odorico et al., 2013).
CoSpace method, which is a method that we have not encountered in reviwed studies, is also seen as a promising approach in tree species detection. The CoSpace method, which is a method of using multispectral and hyperspectral data together, involves finding the information shared among the data and projecting both sources into a common subspace. This allows the information from both sources to be effectively combined, resulting in improved classification performance. It enables the effective use of both hyperspectral and multispectral data, and reduces the dimensionality of the data, making it easier to process and analyze (Hong et al., 2019). The use of CoSpace in tree classification is a promising approach that has the potential to provide improved results compared to using either source alone.
4.2 Classification methods
4.2.1 Machine learning
The machine learning algorithms used in the reviewed articles are as in Figure 8.
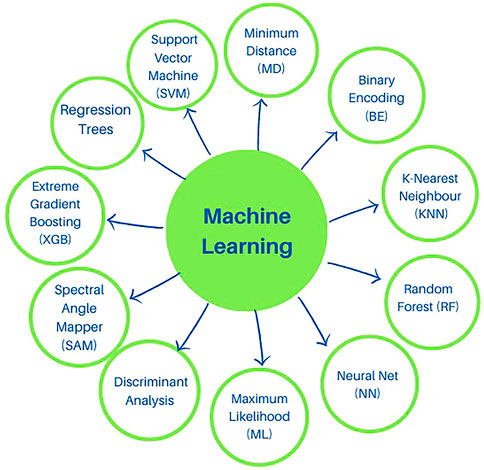
FIGURE 8. Machine learning algorithms used in articles.
Support Vector Machine (SVM); It is one of the most commonly used supervised learning algorithms for classification and regression solutions. The main purpose in support vector machines is to assign the new data obtained to the class it belongs to. For this, we need to produce the best lines and decision lines that separate the classes from each other. The best decision class here is the hyperplane.
Objects are assigned to their new classes based on their proximity and distance from the hyperplane. In order to create this plane, support vectors in extreme states are selected (Mountrakis et al., 2011). Since the SVM algorithm finds the best decision hyperplane in multidimensional data, it is a reliable method used in the detection of tree species.
When we classify big data, whether it is a tree detection or a land surface classification, most of the time the data cannot be classified in a linear way (Xi et al., 2021).
Random Forest (RF); contains many decision trees. These trees are trained with training examples to solve the classification problem. Training samples consist of percentage 70 randomly selected data from the total number of samples. Trees are used as large as possible, and classification is made according to the majority of votes. RF is robust against overfitting, insensitive to noise. It is a frequently preferred method in tree species classification and can be applied successfully. In order for the algorithm to give more reliable results in big data, the most important parameters should be selected. For this, the mean decrease in accuracy (MDA) is used (Xi et al., 2021).
Maximum likelihood (ML); It is a decision rule based on the conditional probabilities of different classes (Axelsson et al., 2021). It is a parametric supervised classification algorithm, based on Bayesian equation. Data of unknown class is assigned to the corresponding class by calculating the probability of belonging. It gives more accurate results for normally distributed data compared to other parametric classifications (Otukei and Blaschke, 2010).
Extreme Gradient Boosting (XGB); In this method, which is a gradient tree increment method, it predicts the new member class in an additive way after each classification. Its additiveness helps it correct previous classification errors and make more accurate decisions. The final classification that takes place is the most dominant, as all trees have additive growth. The limitation of overfitting is the most important feature that caused it to be selected for classification (Georganos et al., 2018).
Linear Discriminant Analysis (LDA); It is a supervised learning technique that works by finding a linear transformation matrix. Thanks to the criteria in the method, the distance between class means and variances are minimized (Bandos et al., 2009). Although this analysis method gives good results, some disadvantages of classical discriminant analysis arise when it comes to multispectral hyperspectral images. It is not an expert at handling badly located data. Due to the curse of dimensionality, HSI cannot succeed in processing. The application of data reduction methods can also lead to the elimination of necessary data. The method assumes that the data samples have a Gaussian distribution and share equal covariances across all classes, but this is unfortunately not always possible for HSI. Therefore, classification boundaries can be difficult to find. Many new approaches have been proposed to overcome these difficulties of the classical method (Chen et al., 2018).
Maximum Likelihood (ML); It is a method that maximizes the number of classes in the training data and the distance between these classes to find the hyperplane that separates the classes from each other. Misclassifications are minimized thanks to this method (Vaglio Laurin et al., 2016).
Minimum Distance (MD); It is a method that calculates the Euclidean distance of the pixels to be classified to the average vector consisting of the average of the end pixels. In this method, each pixel whose class is to be defined is assigned to the group with the closest distance. Its bad feature is that pixels that are equidistant or whose distance cannot be calculated are not classified.
K- Nearest Neighbor (k-NN); It is a method that calculates the distance metric and the number of nearest neighbors k) and assigns the pixel whose class is tried to be found to the correct class according to the weights of the neighbors. Euclidean distance is often used as a distance metric. Because it can be used in multi-class data, it is frequently used to produce contiguous estimates of forest features (Meng et al., 2007; Chirici et al., 2016).
Spectral Angle Mapper; It is a supervised classification technique that calculates the spectral angle similarity between the pixel in the training set and the pixel whose class is sought. SAM is often used in classification problems because it is simple and fast to implement. Suppresses shadow effects to bring out the reflection properties of the target. This makes it a powerful classifier (Petropoulos et al., 2013).
Regression Tree; It is a non-parametric method based on the preparation of a binary decision tree created with training data samples. It needs big training data sample to get good results. In decision trees, complex classification problems are divided into simpler al problems. The user is involved in the process because he can interfere with the nodes of the tree (Bittencourt and Clarke, 2003).
4.2.2 Deep learning
Deep learning, which is a sub-step of machine learning in our developing world (Figure 9), is a system that imitates our brain with the help of artificial neural networks.

FIGURE 9. Artificial Intelligence, Machine Learning and Deep Learning relationship.
With the help of this system, classification problems in remote sensing data can be solved. Compared to classical neural network models, DL, which has more cascading neural layers, was more successful in revealing complex relationships (Kattenborn et al., 2021). Convolutional neural network (CNN); They are arranged in layers and have neurons that can learn sequential representations. Weights and biases are used to connect neurons between layers. It has hidden layers to match the input properties with the output properties. These layers must contain at least one convolutional layer to take advantage of the patterns. Convolutional layers contain many filters. The number of these filters gives us the CNN depth. The layer used as input in one layer can be the output data of another layer. Thus, as a result of many operations between layers, classification accuracy increases compared to classical methods. The first input layer is hyperspectral or multispectral images, while the last output layer is their versions classified according to tree types. CNN, which is designed to learn spatial features, is frequently used in studies due to its success in revealing spatial features, whether in determining individual tree crowns or in stand-based tree species detection studies (Kattenborn et al., 2021; Gazzea et al., 2022). CNN layers such as convolutional or pooling layers can be combined in different ways to solve the problem. These combinations are defined as CNN architecture. There are numerous CNN architectures. The architectures used in the detection of tree species are listed below.
Conv1D architecture; It is a one-dimensional (1D) convolutional neural network model. It uses the convolution kernel to grasp the temporal pattern or shape of the inputs. In this model, which has more than one convolutional layer, features are removed gradually. Activation functions are used to speed up the training process and prevent overfitting. It is very convenient to be used in the time series method (Xi et al., 2021).
AlexNet; It is a two-dimensional (2D) CNN model. It consists of five convolutional and three full layers. It collects images in different classes using the Softmax classifier. It drops units from the neural network by applying the drop function to remove overfitting (Xi et al., 2021).
Long Short-Term Memory (LSTM); It is a model from the family of Recurrent neural networks. Due to its structure, it repeats a lot, thanks to these repetitions, the input information can be kept inside for a long time.
UNet architecture; It is one of the most common methods used for image segmentation, which includes two ways as encoder and decoder. The encoder consists of convolution and pooling units, while the decoder consists of transpose convolutions. Since it was first used in 2015, many new versions have been adapted to improve accuracy. One of them Unet++ has two big variants compared to the classical method. In tree detection processes, especially when hyperspectral images are used, the training data is inserted into the training piecemeal, not in bulk, in order to train the weights of the architecture. The Unet++ model aims to reduce overfitting and strengthen model generalization by making weight adjustments (Bolyn et al., 2022).
DeepLabv3+ architecture; It is an improved version of the DeepLabv3 architecture used for segmentation by adding a decoder. This decoder greatly improves segmentation results. DeepLabv3+ based Multi-Task Encoder-Decoder (MT-EDv3) architecture has also been used in tree species detection studies on the basis of crown (La Rosa et al., 2021; Lassalle et al., 2022).
Residual Networks (Resnet); There are many new versions of these architectures, which are widely used in image processing, with changes on them. It has hundreds of layers much deeper. There are jumps over some layers (La Rosa et al., 2021).
3-D CNN; It is a three-dimensional convolutional neural network used to capture spatial and temporal information. When used with hyperspectral data, the entire image is not inserted into the layer as the input layer, instead the pixel cubes enter the training (the curse of dimensionality). It is often the preferred method to prevent excessive loss of login information. Here, the number of layers is related to the spatial dimension of the cube (Zhang et al., 2020).
Graph Convolutional Networks, which is a relatively new deep learning technique that we have not encountered in studies on tree species detection, is specially designed to process graphically structured data. In the context of tree detection, GCN can be used to model the relationships between pixels in a remote sensing image, where each pixel is represented as a node in a graph. By convolving the graph structure, GCN can learn to extract meaningful features that are indicative of the presence of trees in the image. To implement GCN for tree detection, the first step is to convert the remote sensing image into a graph structure. This can be done by constructing a graph where each pixel is a node and the edges represent the relationships between pixels. For example, the edges can represent the spatial proximity or color similarity between pixels. Next, the graph is convolved using multiple GCN layers, where each layer aggregates information from its neighbors to update the node representations (Zhang et al., 2019). The final node representations can then be fed into a classifier to make the final tree detection decision. In addition to the GCN layers, other techniques such as multi-scale feature extraction and attention mechanisms can also be incorporated to improve the performance of the tree detection system (Wan et al., 2019). For example, multi-scale feature extraction can help capture the different scales of tree structures in the image, while attention mechanisms can help focus on the most important parts of the image. In conclusion, GCN is a powerful technique for tree detection in remote sensing images, as it can handle the graph-structured data in a natural way and extract meaningful features for the task. By combining GCN with other techniques, it is possible to build a robust and accurate tree detection system that can help in mapping and tracking the growth and distribution of trees.
SpectralSWIN method aims to extract features without distorting spectral information. It proposes a transformer backbone using the swin-spectral module (SSM) to handle spatial and spectral features simultaneously. In the study, the application was made on two different data sets and it was seen that it was more successful than the commonly used classification methods (Ayas and Tunc-Gormus, 2022).
4.3 Evaluation of the review results
The results obtained from the studies we examined in this review study are explained by grouping them according to the tree type, material used and classification method accuracy. Since accuracies were calculated by different methods between studies, F1 scores and user accuracies (UA) are shown here to avoid confusion. Apart from these, the authors’ work can be consulted for detailed information (product matrix, manufacturer’s accuracy, etc.).
When we first look at the table of pine, supruce, larch, birch and poplar species that we have classified within the Boreal forest type (Figure 10); The highest accuracy for pine and spruce was obtained by UA scores of 0.96, 0.99 (Grabska et al., 2019). The highest accuracy for larches and poplar was found by Xi et al. (2021) with F1 scores of 0.85–0.87. The highest accuracy for Birch was obtained by Illarionova et al. (2021) with an F1 score of 0.91.
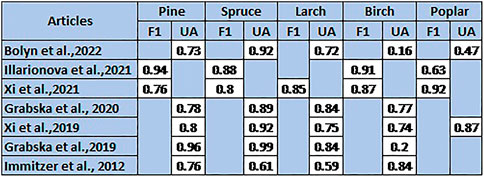
FIGURE 10. Comparison of classification accuracies of boreal forest trees.
When these high accuracy materials and classification methods are compared, it is seen that all of them use MSI but use different classification methods. This showed how the classification method made a difference in the accuracy of tree species detection (Figure 11).
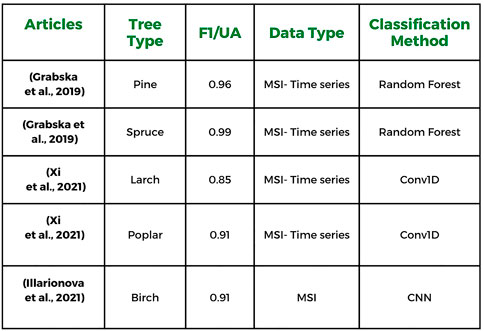
FIGURE 11. Data and classification methods used in tree species detection with the highest accuracy (Boreal Forest).
When we examined the accuracies for the Temperate forest type, the highest accuracy was obtained by Hościło and Lewandowska (2019) with 0.91 and 0.93 F1 scores for Oak and Beech. The highest accuracy for Fir was found by Grabska et al. (2020) with a UA score of 0.85 (Figure 12).
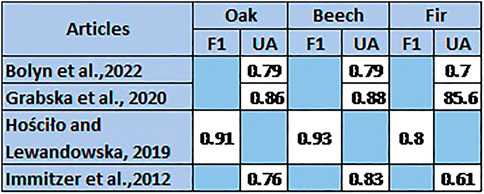
FIGURE 12. Comparison of classification accuracies of temperate forest trees.
Although three researchers used the same methods and materials, one achieved higher accuracy in both species (Figure 13).
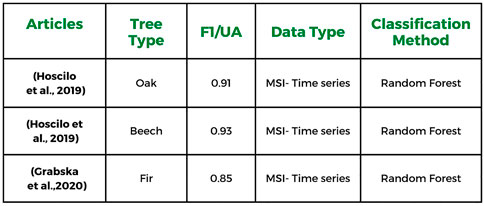
FIGURE 13. Comparison of classification accuracies of temperate forest trees.
He explained the reason for this Hościło and Lewandowska (2019) by fusing the multi-time sentinel-2 data with the topographic data of the land, especially the elevation data.
When we look at the species identification studies in mangrove forests, F1 scores with which we can compare the accuracy are not given in the articles, so the truth table of these studies was not prepared. However, when we reviewed the studies, Hati et al. (2022) used hyperspectral images to distinguish between mangrove species and determined pure mangrove classes with the SAM classification method (Avicennia alba, Avicennia marina, Avicennia officinalis, Excoecaria agallocha, Pheonix paludosa, Aegialitis rotundifolia and Heritiera). Thanks to AVIRIS’s 5 m spatial and 5 nm spectral resolution, it was able to distinguish between the two species with ease. He was even able to distinguish the levels of a single species in different ages. The effects of classical machine learning classification techniques (RF, SVM, etc.) and advanced CNN models on the mangrove type were also examined and it was seen that they were more successful in advanced CNN classification (La Rosa et al., 2021).
In mangrove mapping, La Rosa et al. (2021) conducted species identification studies on the basis of individual crowns. As a result of his studies, he succeeded in separating the crown from the areas without a crown, but the method they proposed could not provide the expected success in species identification.
Unlike others, Yang et al. (2022) used mangrove vegetation indices. On hyperspectral images, Mangrove Recognition Index (MRI), Mangrove Index (MI), Normalized Difference Mangrove Index (NDMI), Mangrove Probability Vegetation Index (MPVI), Mangrove Recognition Index (CMRI), Submerged Mangrove Recognition Index (SMRI), Mangrove Forest Index (MFI) and similar classifications have been carried out. In the same region, the same data were classified by SVM and compared with index classification. As a result of this comparison, it has been reported that the classification made with SVM results in less pixel missing than indices.
Ferreira et al. (2019) tried to determine the effect of humidity by taking images in wet and dry seasons in a study he carried out in a tropical forest. However, there was no big difference in average accuracies. The main hypothesis of they study, SWIR positively determined the effect of tapes on tree depiction. The average accuracy of the classification was 7.9 percent higher in the SWIR band than in the NIR band. By including the SWIR band in the classification, it made positive improvements in all species except one. The average accuracy of the Cecropia hololeuca type decreased slightly, not even 1 percent.
5 Conclusion
As a result of the articles examined, it has been observed that the contributions of multispectral and hyperspectral images are quite high in stand-based classification and individual tree species determination. Hyperspectral images have made positive contributions especially in the detection of individual tree species and in the detection of multiple subspecies of the same species. Multispectral images, on the other hand, have been frequently used by researchers as they are free and easily available and have made significant contributions to the literature. While machine learning algorithms are very common in publications, deep learning classification algorithms are relatively rare in the literature. The contribution of developing machine learning technologies to tree species detection has been observed to be quite high. It is expected that deep learning algorithms, which give more precise results, will find more space in the literature in the future.
It is inevitable that another factor affecting the results as well as the selected image type and classification method is the preprocessing steps. For this reason, researchers who will carry out tree species determination studies should give importance to the pre-processing steps at least as much as other factors. According to the results of two researchers who carried out tree species detection studies using the same sensor type, same forest type and same classification method; It may be misleading to use only the spectral reflections of trees while detecting. It has been observed that not ignoring the connection of the forest with the topography and therefore including the topography criterion in the species determination studies will increase the classification accuracy.
Although machine learning methods and deep learning methods used in classification studies are promising, advanced methods such as Graph Convolutional Networks are expected to be applied in classification. It is expected that state-of-the-art applications such as the use of the CoSpace method in the fusion of more than one sensor and the An Augmented Linear Mixing Model (ALMM) for healthier creation of spectral signatures will be included in new studies.
Author contributions
All authors listed have made a substantial, direct, and intellectual contribution to the work and approved it for publication.
Conflict of interest
The authors declare that the research was conducted in the absence of any commercial or financial relationships that could be construed as a potential conflict of interest.
Publisher’s note
All claims expressed in this article are solely those of the authors and do not necessarily represent those of their affiliated organizations, or those of the publisher, the editors and the reviewers. Any product that may be evaluated in this article, or claim that may be made by its manufacturer, is not guaranteed or endorsed by the publisher.
References
Abbas, S., Peng, Q., Wong, M. S., Li, Z., Wang, J., Ng, K. T. K., et al. (2021). Characterizing and classifying urban tree species using bi-monthly terrestrial hyperspectral images in Hong Kong. ISPRS J. Photogrammetry Remote Sens. 177, 204–216. doi:10.1016/j.isprsjprs.2021.05.003
Axelsson, A., Lindberg, E., Reese, H., and Olsson, H. (2021). Tree species classification using sentinel-2 imagery and bayesian inference. Int. J. Appl. Earth Observation Geoinformation 100, 102318. doi:10.1016/j.jag.2021.102318
Ayas, S., and Tunc-Gormus, E. (2022). Spectralswin: A spectral-swin transformer network for hyperspectral image classification. Int. J. Remote Sens. 43, 4025–4044. doi:10.1080/01431161.2022.2105668
Bandos, T. V., Bruzzone, L., and Camps-Valls, G. (2009). Classification of hyperspectral images with regularized linear discriminant analysis. IEEE Trans. Geoscience Remote Sens. 47, 862–873. doi:10.1109/tgrs.2008.2005729
Bittencourt, H. R., and Clarke, R. T. (2003). “Use of classification and regression trees (cart) to classify remotely-sensed digital images,” in Igarss 2003. 2003 IEEE international geoscience and remote sensing symposium. Proceedings (IEEE cat. No. 03CH37477) (IEEE), 6, 3751–3753.
Bolyn, C., Lejeune, P., Michez, A., and Latte, N. (2022). Mapping tree species proportions from satellite imagery using spectral–spatial deep learning. Remote Sens. Environ. 280, 113205. doi:10.1016/j.rse.2022.113205
Chen, M., Wang, Q., and Li, X. (2018). Discriminant analysis with graph learning for hyperspectral image classification. Remote Sens. 10, 836. doi:10.3390/rs10060836
Chirici, G., Mura, M., McInerney, D., Py, N., Tomppo, E. O., Waser, L. T., et al. (2016). A meta-analysis and review of the literature on the k-nearest neighbors technique for forestry applications that use remotely sensed data. Remote Sens. Environ. 176, 282–294. doi:10.1016/j.rse.2016.02.001
Dabiri, Z., and Lang, S. (2018). Comparison of independent component analysis, principal component analysis, and minimum noise fraction transformation for tree species classification using apex hyperspectral imagery. ISPRS Int. J. Geo-Information 7, 488. doi:10.3390/ijgi7120488
D’Odorico, P., Gonsamo, A., Damm, A., and Schaepman, M. E. (2013). Experimental evaluation of sentinel-2 spectral response functions for ndvi time-series continuity. IEEE Trans. Geoscience Remote Sens. 51, 1336–1348. doi:10.1109/tgrs.2012.2235447
Fassnacht, F. E., Latifi, H., Stereńczak, K., Modzelewska, A., Lefsky, M., Waser, L. T., et al. (2016). Review of studies on tree species classification from remotely sensed data. Remote Sens. Environ. 186, 64–87. doi:10.1016/j.rse.2016.08.013
Ferreira, M. P., de Almeida, D. R. A., de Almeida Papa, D., Minervino, J. B. S., Veras, H. F. P., Formighieri, A., et al. (2020). Individual tree detection and species classification of amazonian palms using uav images and deep learning. For. Ecol. Manag. 475, 118397. doi:10.1016/j.foreco.2020.118397
Ferreira, M. P., Wagner, F. H., Aragão, L. E., Shimabukuro, Y. E., and de Souza Filho, C. R. (2019). Tree species classification in tropical forests using visible to shortwave infrared worldview-3 images and texture analysis. ISPRS J. photogrammetry remote Sens. 149, 119–131. doi:10.1016/j.isprsjprs.2019.01.019
Ferreira, M. P., Zortea, M., Zanotta, D. C., Shimabukuro, Y. E., and de Souza Filho, C. R. (2016). Mapping tree species in tropical seasonal semi-deciduous forests with hyperspectral and multispectral data. Remote Sens. Environ. 179, 66–78. doi:10.1016/j.rse.2016.03.021
Franklin, S. E., and Ahmed, O. S. (2018). Deciduous tree species classification using object-based analysis and machine learning with unmanned aerial vehicle multispectral data. Int. J. Remote Sens. 39, 5236–5245. doi:10.1080/01431161.2017.1363442
Gazzea, M., Kristensen, L. M., Pirotti, F., Ozguven, E. E., and Arghandeh, R. (2022). Tree species classification using high-resolution satellite imagery and weakly supervised learning. IEEE Trans. Geoscience Remote Sens. 60, 1–11. doi:10.1109/tgrs.2022.3210275
Georganos, S., Grippa, T., Vanhuysse, S., Lennert, M., Shimoni, M., and Wolff, E. (2018). Very high resolution object-based land use–land cover urban classification using extreme gradient boosting. IEEE geoscience remote Sens. Lett. 15, 607–611. doi:10.1109/lgrs.2018.2803259
Grabska, E., Frantz, D., and Ostapowicz, K. (2020). Evaluation of machine learning algorithms for forest stand species mapping using sentinel-2 imagery and environmental data in the polish carpathians. Remote Sens. Environ. 251, 112103. doi:10.1016/j.rse.2020.112103
Grabska, E., Hostert, P., Pflugmacher, D., and Ostapowicz, K. (2019). Forest stand species mapping using the sentinel-2 time series. Remote Sens. 11, 1197. doi:10.3390/rs11101197
Harrison, D., Rivard, B., and Sanchez-Azofeifa, A. (2018). Classification of tree species based on longwave hyperspectral data from leaves, a case study for a tropical dry forest. Int. J. Appl. earth observation geoinformation 66, 93–105. doi:10.1016/j.jag.2017.11.009
Hati, J. P., Chaube, N. R., Hazra, S., Goswami, S., Pramanick, N., Samanta, S., et al. (2022). Mangrove monitoring in lothian island using airborne hyperspectral aviris-ng data. Adv. Space Res. doi:10.1016/j.asr.2022.05.063
Hati, J. P., Samanta, S., Chaube, N. R., Misra, A., Giri, S., Pramanick, N., et al. (2021). Mangrove classification using airborne hyperspectral aviris-ng and comparing with other spaceborne hyperspectral and multispectral data. Egypt. J. Remote Sens. Space Sci. 24, 273–281. doi:10.1016/j.ejrs.2020.10.002
Hong, D., Yokoya, N., Chanussot, J., and Zhu, X. X. (2018). An augmented linear mixing model to address spectral variability for hyperspectral unmixing. IEEE Trans. Image Process. 28, 1923–1938. doi:10.1109/tip.2018.2878958
Hong, D., Yokoya, N., Chanussot, J., and Zhu, X. X. (2019). Cospace: Common subspace learning from hyperspectral-multispectral correspondences. IEEE Trans. Geoscience Remote Sens. 57, 4349–4359. doi:10.1109/tgrs.2018.2890705
Hościło, A., and Lewandowska, A. (2019). Mapping forest type and tree species on a regional scale using multi-temporal sentinel-2 data. Remote Sens. 11, 929. doi:10.3390/rs11080929
Hycza, T., Stereńczak, K., and Bałazy, R. (2018). Potential use of hyperspectral data to classify forest tree species. N. Z. J. For. Sci. 48, 18–13. doi:10.1186/s40490-018-0123-9
Illarionova, S., Trekin, A., Ignatiev, V., and Oseledets, I. (2021). Tree species mapping on sentinel-2 satellite imagery with weakly supervised classification and object-wise sampling. Forests 12, 1413. doi:10.3390/f12101413
Immitzer, M., Atzberger, C., and Koukal, T. (2012). Tree species classification with random forest using very high spatial resolution 8-band worldview-2 satellite data. Remote Sens. 4, 2661–2693. doi:10.3390/rs4092661
Immitzer, M., Neuwirth, M., Böck, S., Brenner, H., Vuolo, F., and Atzberger, C. (2019). Optimal input features for tree species classification in central Europe based on multi-temporal sentinel-2 data. Remote Sens. 11, 2599. doi:10.3390/rs11222599
Javan, F. D., Samadzadegan, F., Mehravar, S., Toosi, A., Khatami, R., and Stein, A. (2021). A review of image fusion techniques for pan-sharpening of high-resolution satellite imagery. ISPRS J. photogrammetry remote Sens. 171, 101–117. doi:10.1016/j.isprsjprs.2020.11.001
Jing, L., Hu, B., Noland, T., and Li, J. (2012). An individual tree crown delineation method based on multi-scale segmentation of imagery. ISPRS J. Photogrammetry Remote Sens. 70, 88–98. doi:10.1016/j.isprsjprs.2012.04.003
Kattenborn, T., Leitloff, J., Schiefer, F., and Hinz, S. (2021). Review on convolutional neural networks (cnn) in vegetation remote sensing. ISPRS J. Photogrammetry Remote Sens. 173, 24–49. doi:10.1016/j.isprsjprs.2020.12.010
La Rosa, L. E. C., Sothe, C., Feitosa, R. Q., de Almeida, C. M., Schimalski, M. B., and Oliveira, D. A. B. (2021). Multi-task fully convolutional network for tree species mapping in dense forests using small training hyperspectral data. ISPRS J. Photogrammetry Remote Sens. 179, 35–49. doi:10.1016/j.isprsjprs.2021.07.001
Landsberg, J., and Waring, R. (2014). Forests in our changing world: New principles for conservation and management. Washington, DC, USA): Island Press.
Lassalle, G., Ferreira, M. P., La Rosa, L. E. C., and de Souza Filho, C. R. (2022). Deep learning-based individual tree crown delineation in mangrove forests using very-high-resolution satellite imagery. ISPRS J. Photogrammetry Remote Sens. 189, 220–235. doi:10.1016/j.isprsjprs.2022.05.002
López-Serrano, P. M., Corral-Rivas, J. J., Díaz-Varela, R. A., Álvarez González, J. G., and López-Sánchez, C. A. (2016). Evaluation of radiometric and atmospheric correction algorithms for aboveground forest biomass estimation using landsat 5 tm data. Remote Sens. 8, 369. doi:10.3390/rs8050369
Mafaziya Nijamdeen, T., Ephrem, N., Hugé, J., Kodikara, K. A. S., and Dahdouh-Guebas, F. (2023). Understanding the ethnobiological importance of mangroves to coastal communities: A case study from southern and north-western Sri Lanka. Mar. Policy 147, 105391. doi:10.1016/j.marpol.2022.105391
Martin, M., Newman, S., Aber, J., and Congalton, R. (1998). Determining forest species composition using high spectral resolution remote sensing data. Remote Sens. Environ. 65, 249–254. doi:10.1016/S0034-4257(98)00035-2
Meng, Q., Cieszewski, C. J., Madden, M., and Borders, B. E. (2007). K nearest neighbor method for forest inventory using remote sensing data. GIScience Remote Sens. 44, 149–165. doi:10.2747/1548-1603.44.2.149
Mountrakis, G., Im, J., and Ogole, C. (2011). Support vector machines in remote sensing: A review. ISPRS J. Photogramm. Remote Sens. 63 (3), 247–259. doi:10.1016/j.isprsjprs.2010.11.001
Otukei, J. R., and Blaschke, T. (2010). Land cover change assessment using decision trees, support vector machines and maximum likelihood classification algorithms. Int. J. Appl. Earth Observation Geoinformation 12, S27–S31. doi:10.1016/j.jag.2009.11.002
Persson, M., Lindberg, E., and Reese, H. (2018). Tree species classification with multi-temporal sentinel-2 data. Remote Sens. 10, 1794. doi:10.3390/rs10111794
Petropoulos, G. P., Vadrevu, K. P., and Kalaitzidis, C. (2013). Spectral angle mapper and object-based classification combined with hyperspectral remote sensing imagery for obtaining land use/cover mapping in a mediterranean region. Geocarto Int. 28, 114–129. doi:10.1080/10106049.2012.668950
Pu, R., and Landry, S. (2012). A comparative analysis of high spatial resolution ikonos and worldview-2 imagery for mapping urban tree species. Remote Sens. Environ. 124, 516–533. doi:10.1016/j.rse.2012.06.011
Richter, R., Reu, B., Wirth, C., Doktor, D., and Vohland, M. (2016). The use of airborne hyperspectral data for tree species classification in a species-rich central European forest area. Int. J. Appl. Earth Observation Geoinformation 52, 464–474. doi:10.1016/j.jag.2016.07.018
Rumora, L., Miler, M., and Medak, D. (2020). Impact of various atmospheric corrections on sentinel-2 land cover classification accuracy using machine learning classifiers. ISPRS Int. J. Geo-Information 9, 277. doi:10.3390/ijgi9040277
Song, C., Woodcock, C. E., Seto, K. C., Lenney, M. P., and Macomber, S. A. (2001). Classification and change detection using landsat tm data: When and how to correct atmospheric effects? Remote Sens. Environ. 75, 230–244. doi:10.1016/S0034-4257(00)00169-3
Vaglio Laurin, G., Puletti, N., Hawthorne, W., Liesenberg, V., Corona, P., Papale, D., et al. (2016). Discrimination of tropical forest types, dominant species, and mapping of functional guilds by hyperspectral and simulated multispectral sentinel-2 data. Remote Sens. Environ. 176, 163–176. doi:10.1016/j.rse.2016.01.017
Wan, S., Gong, C., Zhong, P., Du, B., Zhang, L., and Yang, J. (2019). Multiscale dynamic graph convolutional network for hyperspectral image classification. IEEE Trans. Geoscience Remote Sens. 58, 3162–3177. doi:10.1109/tgrs.2019.2949180
Wang, Z., Ma, Y., and Zhang, Y. (2022). Review of pixel-level remote sensing image fusion based on deep learning. Inf. Fusion 90, 36–58. doi:10.1016/j.inffus.2022.09.008
Wessel, M., Brandmeier, M., and Tiede, D. (2018). Evaluation of different machine learning algorithms for scalable classification of tree types and tree species based on sentinel-2 data. Remote Sens. 10, 1419. doi:10.3390/rs10091419
Xi, Y., Ren, C., Tian, Q., Ren, Y., Dong, X., and Zhang, Z. (2021). Exploitation of time series sentinel-2 data and different machine learning algorithms for detailed tree species classification. IEEE J. Sel. Top. Appl. Earth Observations Remote Sens. 14, 7589–7603. doi:10.1109/jstars.2021.3098817
Xiao, Q., Ustin, S., and McPherson, E. (2004). Using aviris data and multiple-masking techniques to map urban forest tree species. Int. J. Remote Sens. 25, 5637–5654. doi:10.1080/01431160412331291224
Yang, G., Huang, K., Sun, W., Meng, X., Mao, D., and Ge, Y. (2022). Enhanced mangrove vegetation index based on hyperspectral images for mapping mangrove. ISPRS J. Photogrammetry Remote Sens. 189, 236–254. doi:10.1016/j.isprsjprs.2022.05.003
Zagajewski, B., Kluczek, M., Raczko, E., Njegovec, A., Dabija, A., and Kycko, M. (2021). Comparison of random forest, support vector machines, and neural networks for post-disaster forest species mapping of the krkonoše/karkonosze transboundary biosphere reserve. Remote Sens. 13, 2581. doi:10.3390/rs13132581
Zhang, B., Zhao, L., and Zhang, X. (2020). Three-dimensional convolutional neural network model for tree species classification using airborne hyperspectral images. Remote Sens. Environ. 247, 111938. doi:10.1016/j.rse.2020.111938
Keywords: tree species classification, hyper spectral imagery (HSI), multi spectral imagery (MSI), machine learning, deep learning, mangroves, forest
Citation: Yel SG and Tunc Gormus E (2023) Exploiting hyperspectral and multispectral images in the detection of tree species: A review. Front. Remote Sens. 4:1136289. doi: 10.3389/frsen.2023.1136289
Received: 02 January 2023; Accepted: 14 March 2023;
Published: 27 March 2023.
Edited by:
Elfatih Mohamed Abdel-Rahman, University of Khartoum, SudanReviewed by:
Ilkka Pölönen, University of Jyväskylä, FinlandDanfeng Hong, Aerospace Information Research Institute (CAS), China
Copyright © 2023 Yel and Tunc Gormus. This is an open-access article distributed under the terms of the Creative Commons Attribution License (CC BY). The use, distribution or reproduction in other forums is permitted, provided the original author(s) and the copyright owner(s) are credited and that the original publication in this journal is cited, in accordance with accepted academic practice. No use, distribution or reproduction is permitted which does not comply with these terms.
*Correspondence: Sude Gul Yel, c3VkZWd5aWxkaXpAYXJ0dmluLmVkdS50cg==