 Susan M. Jarvis
 Nancy DiMarzio
 Karin Dolan
95% of researchers rate our articles as excellent or good
Learn more about the work of our research integrity team to safeguard the quality of each article we publish.
Find out more
ORIGINAL RESEARCH article
Front. Remote Sens. , 06 September 2022
Sec. Acoustic Remote Sensing
Volume 3 - 2022 | https://doi.org/10.3389/frsen.2022.941838
This article is part of the Research Topic Acoustic Remote Sensing of Cetacean and Pinniped Populations View all 13 articles
Beaked whales, like many other odontocetes, produce bouts of very rapid clicking that serve as a homing signal just prior to a prey capture attempt. For Blainville’s and Cuvier’s beaked whales (Mesoplodon densirostris, Md, and Ziphius cavirostris, Zc, respectively) these homing sequences have been dubbed “buzzes.” Buzz clicks have both a structure that is markedly different from and a source level that is significantly lower than the foraging clicks produced by these animals. To date, most of the studies of beaked whale echolocation behavior, especially buzz production, have relied on analysis of data from acoustic recording tags placed on vocal animals. While tag data has allowed detailed description of the dive cycles and foraging behavior of the tagged animals, providing invaluable ground truth for other passive acoustic monitoring studies, it is of limited quantity. Tagging beaked whales is difficult and the spatial and temporal coverage of tagged animals remains sparse. Growing numbers of bottom-moored and bottom-mounted sensors are being used for passive acoustic monitoring and for the study of Md and Zc behavior and distribution. Buzzes from Md and Zc are detectable on such remote sensors and these buzz data can augment higher order studies, such as those on beaked whale habitat use and population health, as detected buzzes can serve as a proxy for prey capture attempts.
Beaked whales (family Ziphiidae) are known to make deep foraging dives in search of meso- and bathy-pelagic prey (Santos, et al., 2001). In the course of these deep dives the animals produce both searching (foraging) clicks and homing pulses (buzzes) with the latter being made just prior to a prey capture attempt (Tyack, et al., 2006; Madsen et al., 2013). To date, most of the studies of beaked whale echolocation behavior, especially buzz production, have relied on analysis of data from animal-borne acoustic recording tags (Johnson & Tyack, 2003). Analysis of tag data has illuminated many details of beaked whale diving behavior, from the depth and duration of dives and the duration of vocal activity to the effective biosonar beam pattern, adjustments to acoustic gaze, and prey selection (Johnson, et al., 2004; Zimmer et al., 2005; Johnson and Madsen, 2006; Tyack et al., 2006; Madsen et al., 2013; Vance, et al., 2021). The tag data indicate that Blainville’s (Mesoplodon densirostris, Md) and Cuvier’s (Ziphius cavirostris, Zc) beaked whales generate buzzes within the context of deep foraging dives. They usually buzz frequently during these dives, with Md and Zc producing an average of approximately 29 and 30 buzzes per dive, respectively (Tyack, et al., 2006).
The Marine Mammal Monitoring on Navy Ranges (M3R) system performs automated passive acoustic monitoring of marine mammal vocalizations as received on widely spaced, bottom-mounted hydrophones at the U.S. Navy’s major undersea ranges (Jarvis et al., 2014). Each of these deep-water facilities provides nearly continuous access to between 91–189 wide-bandwidth sensors. M3R has included a class-specific support vector machine (CS-SVM) classifier capable of real-time automated detection and classification of foraging clicks from Md and Zc as well as from sperm whales (Physeter macrocephalus, Pm) and from several types of dolphins since 2010 (Jarvis et al., 2008; Jarvis, 2012). The CS-SVM classifier was updated in 2014 to add classes specifically for Md and Zc buzz clicks. We believe the CS-SVM buzz classifier is the first algorithm developed to automatically detect beaked whale buzzes on remote hydrophones. Its incorporation into M3R offers a unique opportunity to study buzz production over geographically large (1,200 + km2) areas.
A major challenge for remote detection of buzzes is that the source level (SL) of buzz clicks is approximately 20 dB lower than the SL for foraging clicks (Johnson and Madsen, 2006). Since buzz clicks have a much lower source level than foraging clicks, the detection threshold of the buzz classifier must be set correspondingly lower. Running the buzz classifier, with its very low threshold, continuously can cause an unacceptably high number of false alarms. To mitigate this problem, CS-SVM buzz classifier purposefully uses dive context to control its execution. The buzz classifier is launched, within its own process, only after the start of an Md or Zc foraging click-train has been detected. The buzz classifier process then runs for 30 min, the approximate average vocal period of an Md dive, before automatically stopping. This configuration of the buzz CS-SVM launched by the foraging click CS-SVM was fielded at both the Atlantic Undersea Test and Evaluation Center (AUTEC) and at the Southern California Ani-submarine Warfare Range (SOAR) in July 2014. Here, we present a manual review of approximately 36 h of Md buzz detections from AUTEC as well as a more extensive automated study of 3 years of Zc buzz detections at SOAR. During both study periods only a fraction of the anticipated number of buzzes per dive were detectable on the remote hydrophones. However, buzzes were detected during dives across the entire range area in both cases. As buzzes are a precursor to prey capture or, at least, prey capture attempts, they are direct evidence of feeding. Being able to monitor feeding over large spatio-temporal scales may better inform population-level health models (e.g. Moretti, et al., 2014; Cox, et al., 2006; DeRuiter, et al., 2013).
Md and Zc are both medium-sized oceanic whales that live in small mixed composition groups of about 2–4 animals (Baird, et al., 2006; Falcone, et al., 2009; Marques, et al., 2019; Barlow, et al., 2006; MacLeod, et al., 2006) and are usually found in deep offshore waters. Both species also execute regular, breath-hold dives to hunt for mesopelagic and bathypelagic squid and fish (Santos, et al., 2001) using echolocation (Tyack, et al., 2006; Madsen, et al., 2013). Md and Zc frequently dive to depths over 1,000 m (Tyack, et al., 2006) during dives lasting 45 min or more. Zc tagged near SOAR hold the records for both longest (137.5 min) and deepest (2992 m) mammal dives ever recorded (Schorr et al., 2014). During their deep dives Md and Zc emit two distinct types of click waveforms, foraging clicks (Baumann-Pickering, et al., 2013) and buzz clicks (Figure 1). A period of foraging clicks prefaces each buzz and this pattern repeats approximately 30 times per dive, on average (Madsen et al., 2013). Sound production in both Md and Zc is highly directional with an estimated main lobe beam width of approximately 20–30° and significant side lobe suppression (Zimmer, et al., 2005; Zimmer, et al., 2008; Shaffer et al., 2013). Essentially Md and Zc search their environment with an acoustic flashlight where a narrow beam ensonifies finite swaths ahead of the animal along the axis of its melon (Zimmer et al., 2005). From the perspective of an omnidirectional bottom-mounted receiver, the sounds sweep through its hearing radius as the animal searches. The amplitude of the received clicks increase and decrease in response. Over a grid of hydrophones such as AUTEC or SOAR we see the foraging clicks from a diving Zc or Md “move” from one hydrophone to its neighbors as the animal’s main response axis turns away from one toward the other. Frequently the loudest received clicks are not necessarily received on the hydrophone closest to the animal but on the one most directly in line with the main lobe of its biosonar. Therefore, we must consider the ensemble of clicks received by the local group of hydrophones when trying to detect beaked whale dive events.
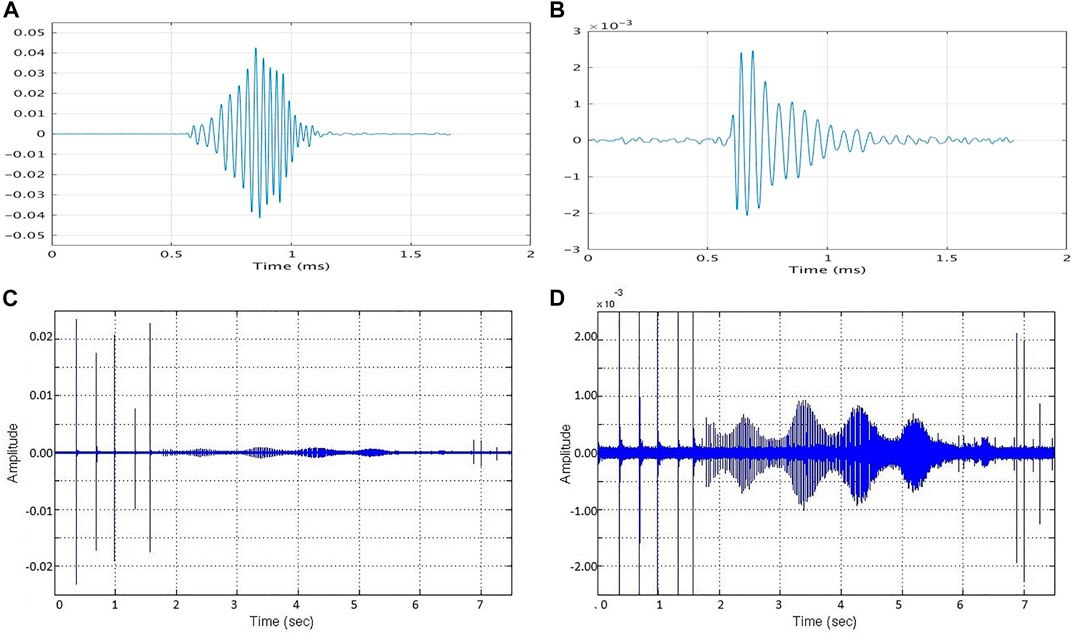
FIGURE 1. (A) A Md foraging click and (B) a Md buzz click as received by a bottom-mounted hydrophone at AUTEC. (C,D) A Md foraging click train transitioning to a buzz also received on bottom mounted hydrophone at AUTEC. Changes in amplitude during foraging and within the buzz and are due to relative orientation of the animal’s head to the hydrophone.
Output reports from the CS-SVM classifier archived at two Navy Ranges, AUTEC and SOAR, were analyzed for this study. AUTEC, which is located in the Tongue of the Ocean off Andros Island, Bahamas, has 91 broadband hydrophones arranged in a roughly 48 km × 24 km grid. Fourteen of the hydrophones are spaced approximately 2 km apart while the remaining 75 are spaced approximately 4 km apart (Figure 2A). The total instrumented range area is approximately 1,200 km2. SOAR is located in the San Nicolas Basin, west of San Clemente Island, California. The range has 153 broadband hydrophones available but the CS-SVM classifier was running on only the newest 89 hydrophones at the time of the study. The spacing of the SOAR hydrophones is depth dependent (from approximately 3.5–5 km) and the total area of coverage is approximately 1700 km2 (Figure 2B). The signal conditioning method for acoustic data is the same at both sites.
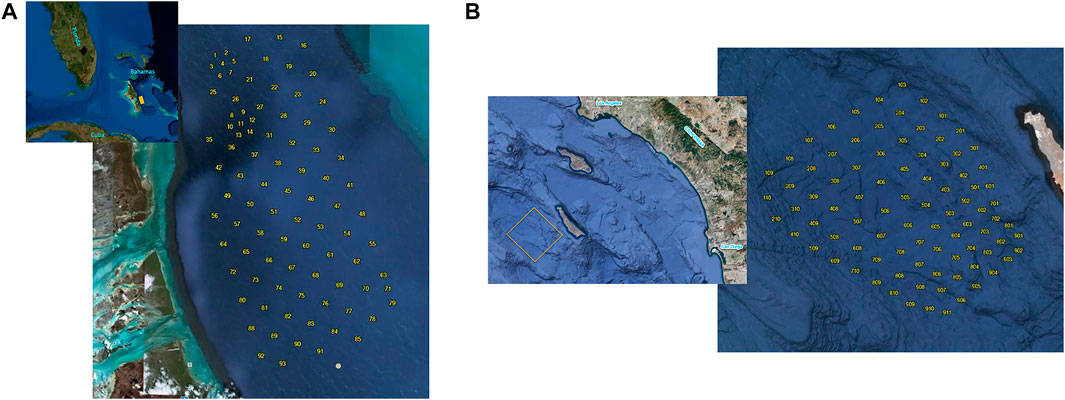
FIGURE 2. (A) Layout of bottom-mounted hydrophones at AUTEC. Spacing between hydrophones 15 through 91 is approximately 4 km. Spacing between hydrophones 1 to 14 is approximately 2 km. The CS-SVM classifier was not running on hydrophones 8 to 14 during the study window. (B) Layout of bottom-mounted SOAR hydrophones used in the study. Spacing between hydrophones varies with depth from approximately 3.5–5 km.
Analog data from each hydrophone are digitized using a sampling frequency of 96 kHz and passed to a dedicated processing stream. The digitized data for that hydrophone are high pass filtered and a time-domain energy detector is used to detect arriving clicks. If the peak of a click is above the noise-variable threshold (NVT) then a 2.67 ms (256 samples at 96 kHz) long snippet of the time series about the peak is sent to the CS-SVM classifier for feature extraction then the feature vector is input to the CS-SVM decision functions. During the study, the CS-SVM was configured with the following classes: 1) Md foraging clicks, 2) Zc foraging clicks, 3) Sperm whale foraging clicks, 4) generalized dolphin clicks. Since the data input from each hydrophone is a continuous, real-time stream, which can contain clicks from multiple animals of the same or different species, the CS-SVM classifies each click it sees individually. The NVT is typically set to ride 20 dB above the time-varying average noise level calculated using an exponential average (Jarvis et al., 2014). A buzz classifier is launched on the data stream from a given hydrophone only when 80% of clicks detected on that hydrophone over the last 20 s are classified as either Md or Zc. The buzz classifier process then runs for 30 min, the approximate vocal period of an Md dive (Tyack, et al., 2006), before automatically stopping. The NVT for the buzz classifier is set only 6 dB above the average noise level. To further reduce the likelihood of false buzz detections and better match the known amplitude characteristics of buzz clicks, a maximum peak amplitude threshold is also used. The peak value of clicks considered by the buzz classifier must be less than ½ of the average of the local foraging click peaks seen prior to the buzz. That is, the received peak of a candidate buzz click must be a minimum of 6 dB below the local foraging peaks (METEOR Team, 2014). Output reports from the classifier (i.e. detection reports), as well as other M3R data like spectrogram and localization data, from each hydrophone are written to a central archive on a large (∼3 TB) external hard disk drive. When the archive drives at the ranges are full they are replaced and the archive files they contain are transferred to permanent storage on M3R’s petabyte-capable data server in Newport, RI.
The M3R systems at each Navy range collect archives of detection reports nearly continuously. The archive data analyzed in this study include 36 h of archives recorded 8–10 July 2014 at AUTEC and a set of archives collected over 3.5 years at SOAR (Table 1). To identify click trains that are indicative of foraging dives, archive data are post-process through M3R’s click train processor (CTP) program. CTP generates click trains for each detection algorithm and class (TYP) on a per-hydrophone (HYD) basis. Two beaked whale classes are considered by the CTP. Md foraging clicks are designated as class number 1 and Zc foraging clicks are class number 2. A click-train is started when a click is detected, and clicks of that detector type and class are added to the click-train until at least 180 s (timeout (TMO)) pass without additional detections. At this point, if the click train has at least five clicks (click requirement (RQ)), a click train report is generated; otherwise the click train is discarded. The click train report includes the hydrophone number, detector type (CS-SVM is type 17) and class (Md = 1, Zc = 2), the start and stop times for the click-train, the total number of clicks in the click-train (CNT), and the ICI. An example of the unfiltered CTP output for archives from SOAR is shown in Table 2, with the CS-SVM Zc detections (TYP 17:02) highlighted in blue.
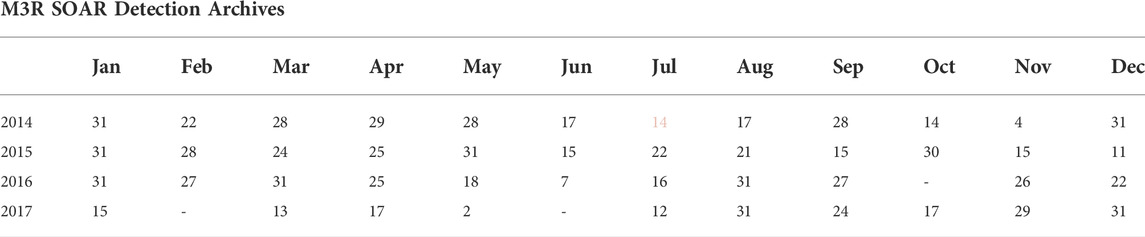
TABLE 1. The number of days per month during which M3R archives containing CS-SVM classifier output were collected at SOAR. The CS-SVM beaked whale buzz click classifier was installed in July, 2014 (pink).
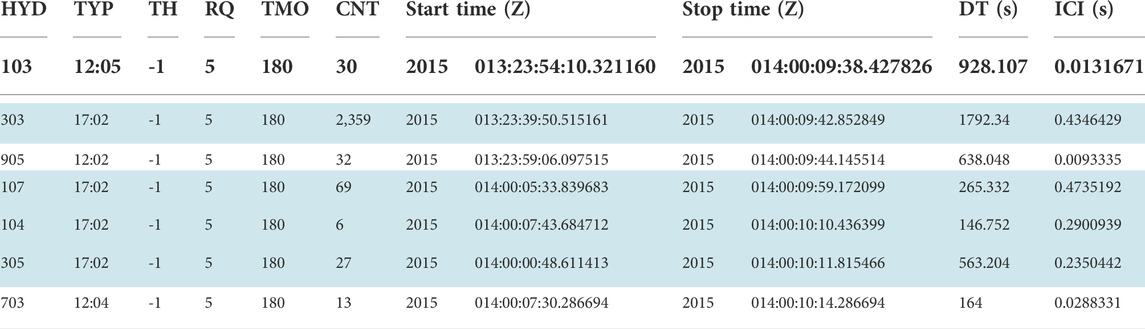
TABLE 2. Unfiltered CTP output from SOAR from January 2015 with CS-SVM Zc click trains (TYP 17:02) highlighted in blue. The columns from left to right are hydrophone number (HYD), algorithm type and class (TYP), minimum click threshold (TH, unused here), required number of detections to save a click train (RQ), number of seconds without detection that causes click train to close (TMO), number of clicks in the train (CNT), Start and Stop (Year, Day:HH:MM:SS.S), duration of train (DT), estimated interclick interval (ICI).
The per-hydrophone click trains identified by CTP are then associated with other click trains on nearby hydrophones to form group dives using our auto-grouper (AG) program. The CTP trains are first filtered for desired type and class (e.g. CS-SVM Md and Zc are types 17:1 and 17:2, respectively), then for a user-selectable ICI range (0.23–0.40 s for Md and 0.35–0.75 s for Zc), followed by duration (click trains must be less than 60 min long and contain a minimum of 300 foraging clicks). Finally, the candidate click trains are sorted by start time. The AG algorithm uses the CTP output to form groups by first identifying trains from the set of filtered click trains with the highest click counts, and then adding to their groups click trains from nearby hydrophones with successively smaller click counts. The set of neighboring hydrophones generated for each hydrophone include all hydrophones within a fixed radius (usually ∼6 km) of the center hydrophone. The radius selected is based on both range to visual Zc observations at SOAR (DiMarzio & Jarvis, 2016; Moretti, et al., 2010) and calculated hearing radius for Md clicks at AUTEC (Ward et al., 2011).
Buzzes are identified using the buzz train processor (BTP) algorithm. The BTP works in much the same way as the CTP. It identifies buzz events by applying a set of heuristic rules to the buzz click detection reports received over time on a given hydrophone. The BTP requires a minimum of five buzz click detections to start and the buzz must be less than 6 seconds long (Tyack, et al., 2006; Madsen et al., 2013). The amplitude of buzz clicks received varies with whale’s motion and received amplitude (Figure 1D) can fall below the NVT during the buzz. Therefore, any buzz clicks received on a hydrophone within a given 6 s window are grouped into one buzz. There also must be a minimum of 10 s without buzz click detections between successive buzzes. This is to guard against buzz classifier false positives caused by distant dolphin clicks. In general, dolphin clicking tends to be continuous over durations much longer than a buzz. Once the times of candidate buzzes are identified, they are compared to the start and stop times for group dives (AG output) on that hydrophone. Only BTP buzz events that occur during an identified group dive are counted.
CS-SVM classifier detection reports, including CS-SVM buzz classifier reports, were extracted from approximately 36 h of M3R AUTEC archives from 8–10 July 2014. These archives were collected just after the buzz classifier was deployed at AUTEC. Md foraging click detections were grouped into click trains and groups using the rules of the CTP and AG processes discussed above. The detections from the groups were plotted and the dives manually reviewed and validated. Figure 3 shows an example of output of the CS-SVM classifier showing an Md foraging click train as received on hydrophone 64 and neighbouring hydrophones. Blue dots indicate the time of Md foraging click detections on a given hydrophone (listed on vertical axis). Magenta squares indicate the first and last clicks in a click train according to the rules of the CTP. Initially we also reviewed Zc foraging click detections (both Md and Zc have been visually verified at AUTEC) but the number of dives detected during the study period was low and several of these were detected only on edge hydrophones. Such edge phone detections are not typically included in dive counting analysis because the animals are likely off the range proper with their heads pointing in the direction of the receiving edge hydrophone.
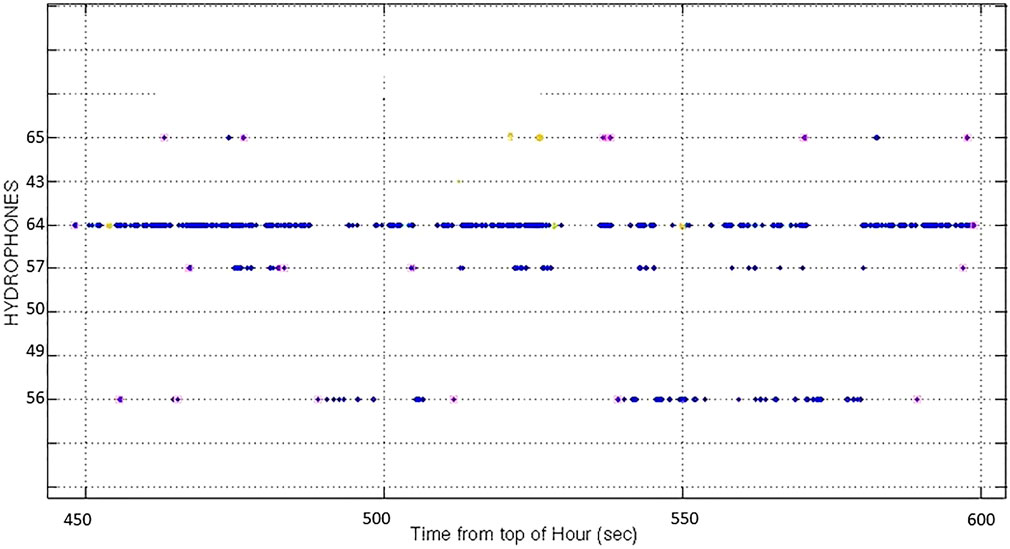
FIGURE 3. Output of AUTEC CS-SVM classifier showing a Md click train as received on hydrophone 64 and neighbouring hydrophones. Blue dots indicate the time of Md foraging click detections on a given hydrophone (listed on vertical axis). Magenta squares indicate the first and last clicks in a click train according to the rules on the CTP. According to the rules of the AG, these trains would be joined together to form a single group dive.
Figure 4 shows the CS-SVM classifier detections versus time from a single hydrophone. Here, again, blue dots are Md foraging clicks and blue x’s are Md buzz click detections. The black dots represent generalized dolphin detections. In Figure 4A these are most likely false positives and only Md are present. However, Figure 4B shows a case where there likely was dolphin activity and buzz detections persist after the foraging click detections stop. These buzz detections are viewed as false positives and fail the rules of the BTP. Figure 4C shows detection of a long buzz on hydrophone 64. The three clumps of buzz detections are grouped as one buzz because they occur within the same 6-s window. The 5 s gap between foraging clicks suggests that only a fraction of the clicks in the buzz were detectable on the bottom-mounted hydrophone. Still, the buzz event, itself, was detected.

FIGURE 4. (A) Output of AUTEC CS-SVM classifier from hydrophone 56 showing rhythmic Md foraging clicks (blue dots) and then two buzz detections (blue x’s). Black dots are false positives from the generalized dolphin class. (B) Output of AUTEC CS-SVM classifier from hydrophone 56 from a different hour during the study. Again, blue dots are Md foraging clicks, black dots are generalized dolphin clicks and blue x’s are buzz click detections. Notice that buzz detections continue after Md foraging click detections. These are most likely false positives caused by dolphin clicks. In this case, CTP, AG and BTP rules were not met and no buzzes were identified. (C) A close-up of Md foraging clicks (blue dots) transitioning to a long buzz detection (blue x’s).
A total of 78 Md group dives containing 258 buzzes were identified within the 36 h manual analysis window. Buzzes were detected in 61 of the group dives. The BTP rules identified an average of 3.321 buzzes per foraging dive over all Md dives (high 19, low 0) and 4.246 buzzes per dive in the dives with buzzes (Table 3). This is a small fraction of the expected number (∼29) of buzzes produced per dive as reported from acoustic tag data, but buzzes were detected on 45 of 91 hydrophones across the entire range area during the study window. The most buzzes per dive were detected during group dives that occurred over hydrophones 1 to 7. Adjacent hydrophones within this hexagonal array, dubbed Whiskey-1, are only 2 km apart vice 4 km apart elsewhere on the range. Of the 14 Md group dives that had 5 + detected buzzes, six occurred over the Whiskey-1 array. Note that the CS-SVM classifier was not running on hydrophones 8–14 during the study period.
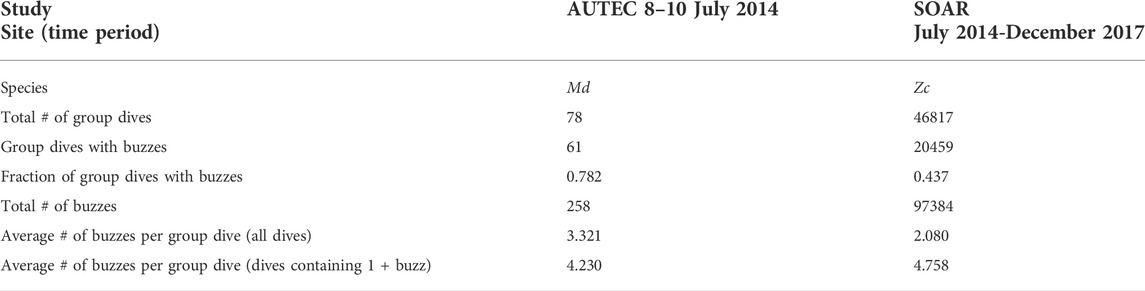
TABLE 3. Summary of buzz detection at AUTEC and SOAR.
M3R SOAR archives collected over approximately 3.5 years from July 2014 through December 2017 (Table 1) were batch processed through the CTP and AG processes and Zc group dives identified as part of a separate study on the long-term spatio-temporal distribution and habitat use of Ziphius at SOAR (DiMarzio & Jarvis, 2016). These archives where subsequently processed through the BTP to isolate potential buzzes according to the following rules: minimum of 5 clicks per buzz, buzz duration less than 6 s long, 10 s timeout between buzzes. The times of candidate buzzes were then compared to the start and stop times of group dives output by AG. Only buzzes that occurred within a group dive were retained (Figure 5). ICI, as calculated from the CS-SVM report times for foraging clicks and buzz clicks can provide an interesting visualization of vocal part of a foraging dive cycle (Figure 6).
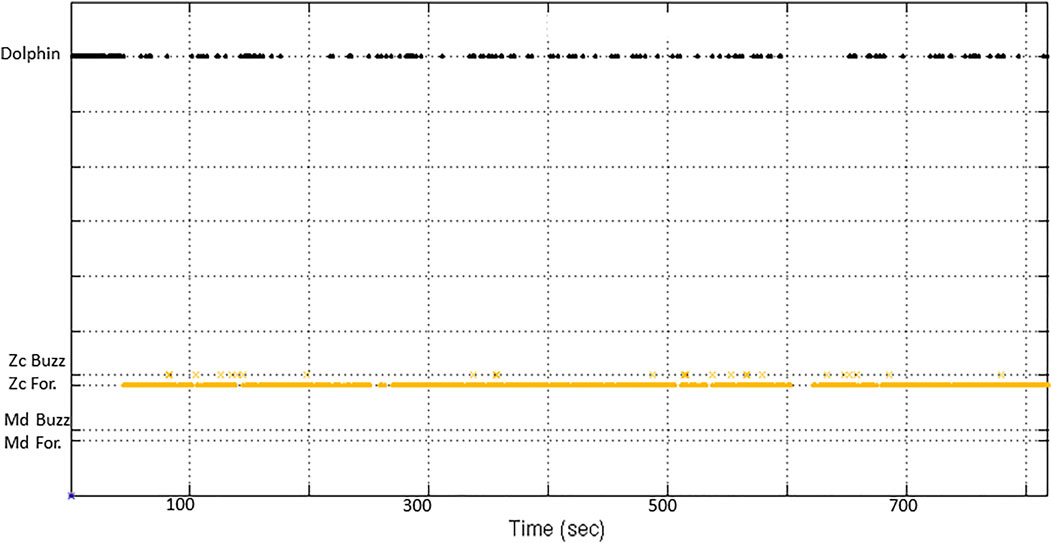
FIGURE 5. Output of CS-SVM classifier versus time for SOAR hydrophone 908. Orange dots are Zc foraging click detections and orange x’s are Zc buzz click detections. Black dots are generalized dolphin click detections.
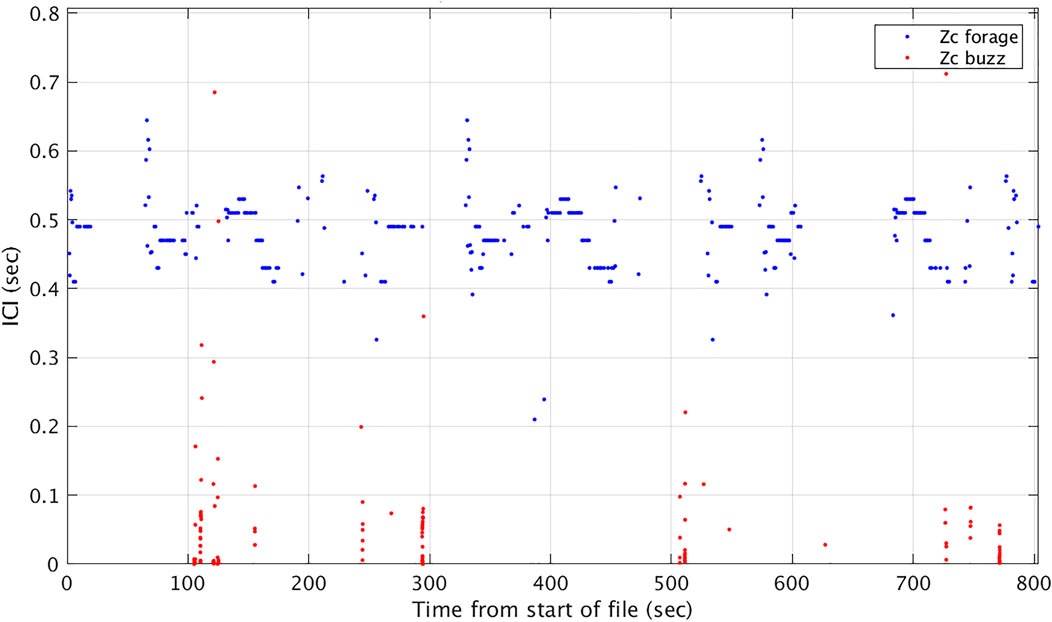
FIGURE 6. ICI calculated from CS-SVM Zc foraging click detection reports and CS-SVM buzz click detection reports from SOAR hydrophone 609 versus time. Abrupt changes in ICI highlight the buzzes.
During the study period, 46817 Zc group dives and 97384 buzzes were detected, an average of 2.080 buzzes per dive. However, only 43.7% of the group dives contained buzz detections (as compared with 78.2% of dives at AUTEC). Within those dives, 4.758 buzzes were detected per dive (Table 3). The start times of the Zc group dives are fairly uniformly distributed across time. This agrees with the available tag data that undisturbed Zc forage in regular cycles both night and day (Schorr, et al., 2014; Falcone, et al., 2017). A slight diel pattern was (qualitatively) noted in the average number of group dives detected across the study period with somewhat fewer dives recorded during local night of 6 p.m. to 6 a.m. (0200-1400Z). The number of buzzes per dive followed a similar slightly diel pattern (Figure 7). This is not surprising as buzz detection is constrained to occur only during identified group dives. Only a small fraction of the expected number of buzzes (∼30 on average) produced per Zc foraging dive were detected, but buzz events were detected across the entire SOAR range area within the study period (Figure 8).
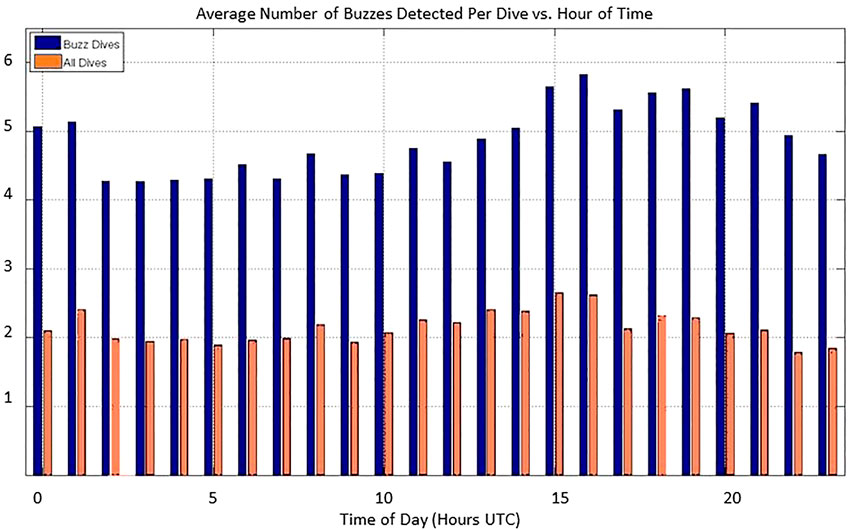
FIGURE 7. Average number of buzzes detected per group foraging dive versus time of day (Z). Local night of 6 p.m. to 6 a.m. corresponds to 0200-1400Z. Averages formed over entire study period from July 2014 to December 2017. Orange bars are the average over all group dives and blue bars represent the average over dives during which buzzes were detected.
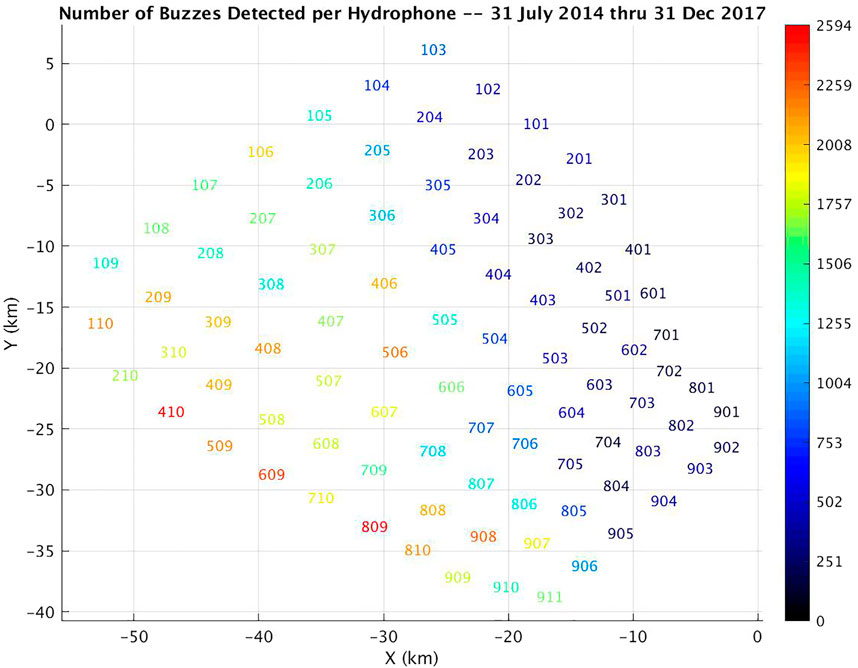
FIGURE 8. Number of buzzes detected per hydrophone at SOAR from 31 July 2014 to 31 December 2017.
The detection of sound underwater is governed by the sonar equation (Eq. 1). Here, SL is the source level of the sound, TL is the transmission loss experienced by the sound as it travels from source to receiver, NL is the ambient noise level at the receiver, AR is the array gain of the receiver, DI is the directivity index of the source, DT is the detection threshold, and SNR is the received signal-to-noise ratio. All quantities are in decibels. If SNR exceeds DT then the sound is detected.
SNR = SL–TL–NL + AR + DI(θ) > DT (1) (Burdic, 1984).
TL is a function of the range (R) from the source to the receiver. In deep-water environments like SOAR and AUTEC, spherical spreading tends to predominate and TL increases with the square of the range (i.e. TL = 20log(R)). For fixed SL and ambient noise conditions, TL and receive DI(θ) determine whether the signal is detectable. As discussed above, Md and Zc buzzes are highly directive with as much as 30 dB suppression away from the main response axis (Shaffer et al., 2013). This results in the variation of received click amplitude shown in Figures 1C,D. Range determines whether the clicks are detectable. Note that AR for the omnidirectional hydrophones at AUTEC and SOAR is 0 dB.
Table 3 shows a summary of the buzz detections at both SOAR and AUTEC during the study periods. A higher percentage of the group dives detected at AUTEC included buzz detections than the group dives detected at SOAR. There are several possible reasons for this. One is that AUTEC tends to be quieter, at least qualitatively, than SOAR. The isolating environment within the Tongue of the Ocean means that ambient levels are typically lower. Additionally, there is generally much less biologic activity, particularly dolphin activity, at AUTEC than at SOAR. Lower NL translate to a higher received SNR and increased detectability for signals of a given SL. Another reason that AUTEC has a higher percentage of group dives with buzzes is that several of the dives detected were over the Whiskey-1 array, which has 2 km inter-hydrophone spacing. The closer hydrophones means that the TL experienced by a click is less than the TL to more distantly spaced hydrophones. This make it more likely that both foraging clicks and buzz clicks would be detected on those hydrophones. Additionally, Md have also shown fidelity to the Whiskey-1 area over time (Thomas, et al., 2015). Although less than half of the group dives detected at SOAR contained buzzes, the average number of buzzes per dive for group dives containing buzzes is similar at AUTEC (4.230 buzzes/dive) and SOAR (4.758 buzzes/dive). This most likely means that the combination of animal range to the hydrophone and ambient noise levels are favorable enough to allow buzz detection only about 44% of the time at SOAR but that the SL of the Zc and Md foraging and buzz clicks at both locations are comparable.
The average number of group dives (thus the number of buzzes detected) per hour of the day at SOAR is largely uniform although slightly fewer group dives per were detected during the night (Figure 7). Depth recording tags placed on Zc at SOAR show no particular diel pattern to forage dive start times (Schorr, et al., 2014; Falcone, et al., 2017). If the animals dive at the same rate day and night, then any apparent diel behavior observed is most likely an artifact of the group dive detection process. According to Eq. 1, detectability is controlled by the range from animal to the hydrophone (R) and by the received noise level, NL. While it is hard to imagine that Zc were always farther away from the hydrophones at night over 3.5 years, it is possible that the received NL and thus the detector characteristics are different at nighttime versus daytime. When evaluated in the lab, the CS-SVM Zc forage click class correctly classified 98.8% of the test data and misclassified 1.2% (Jarvis, 2012). Similarly, the generalized dolphin class correctly classified approximately 98.5% of the test data and misclassified approximately 1.5%. Recall that the CS-SVM classifier must classify each click it sees in real-time maintaining a local history of only 20–30 s used for ICI estimation. SOAR is home to a large number of dolphins of various species, dominated by common dolphins (Delphinus delphis). While Zc foraging shows no strong diel pattern, the feeding patterns of dolphins are diel. Figure 9 shows the number of raw CS-SVM detection reports for Zc forage clicks, for Zc buzz clicks and for generalized dolphin clicks versus time since 00:00:00Z 15 January 2015. The raw number of generalized dolphin click detections is more than an order of magnitude larger at night (hours 2–14 and 27–34). A ten-fold increase in dolphin activity over time can be expected to cause a ten-fold increase in false positives. We postulate that this huge increase in detections from dolphin clicks (both true and false positives) is obscuring identification of some Zc group dives at night by causing CTP, AG and BTP heuristics to fail on some of those dives. One possible way to confirm and adapt for this is by calculating group dive detection statistics and buzz detections statistics for daytime and nighttime separately and applying different CTP and AG rules depending on time of day. This work has not yet been done.
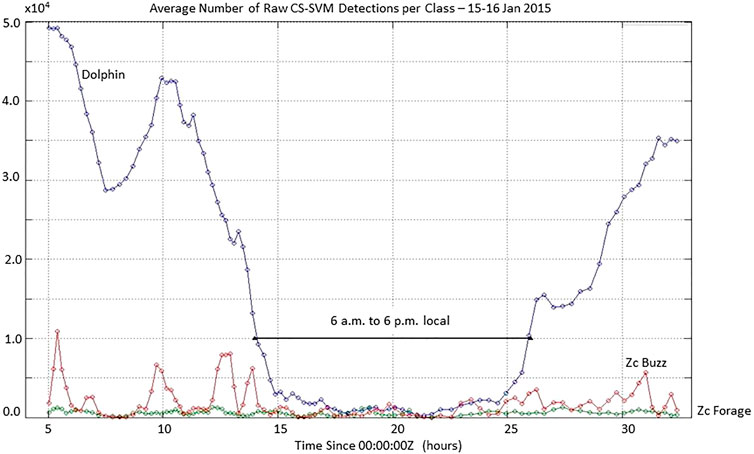
FIGURE 9. Number of raw CS-SVM click detections per class over a 29 h period on 15–16 January 2015 shows an over 10 fold increase in dolphin click activity at night which may obscure the identification of some Zc group dives and buzzes at night.
Another possible reason that buzzes were detected during fewer dives at SOAR than at AUTEC is that the signal characteristics of at least some buzzes at SOAR differ from the training data (Warren, et al., 2017) used to train the buzz click CS-SVM. The buzz classifier training data were derived exclusively from recordings of Md and Zc made at AUTEC. No recordings containing buzzes were available from SOAR at the time. Figure 10 shows a Md buzz recorded at AUTEC and two Zc buzzes recorded at SOAR during the study periods. Notice that the SOAR Zc buzz in Figures 10E,F is at a higher frequency (centered at above 40 kHz) than the either the AUTEC Md buzz in Figures 10A,B (centered below 25 kHz) or the other SOAR Zc buzz in Figures 10C,D (centered at approximately 25 kHz). While both the buzzes in Figures 10A–D were automatically detected, the buzz in Figures 10E,F was not detected by the buzz CS-SVM. We do not currently know the prevalence of the higher frequency Zc buzz at SOAR as no acoustic tag data are available from the study period. Regardless, now that we have both tags on and acoustic recordings of Zc dives made at SOAR, these data can be used to study the relative occurrence of the higher frequency buzzes and augment the Zc buzz classifier training set. Preferably, two buzz training sets, one specific to AUTEC and one specific to SCORE, should be generated and used to train site-specific buzz classifiers. This work is on going.
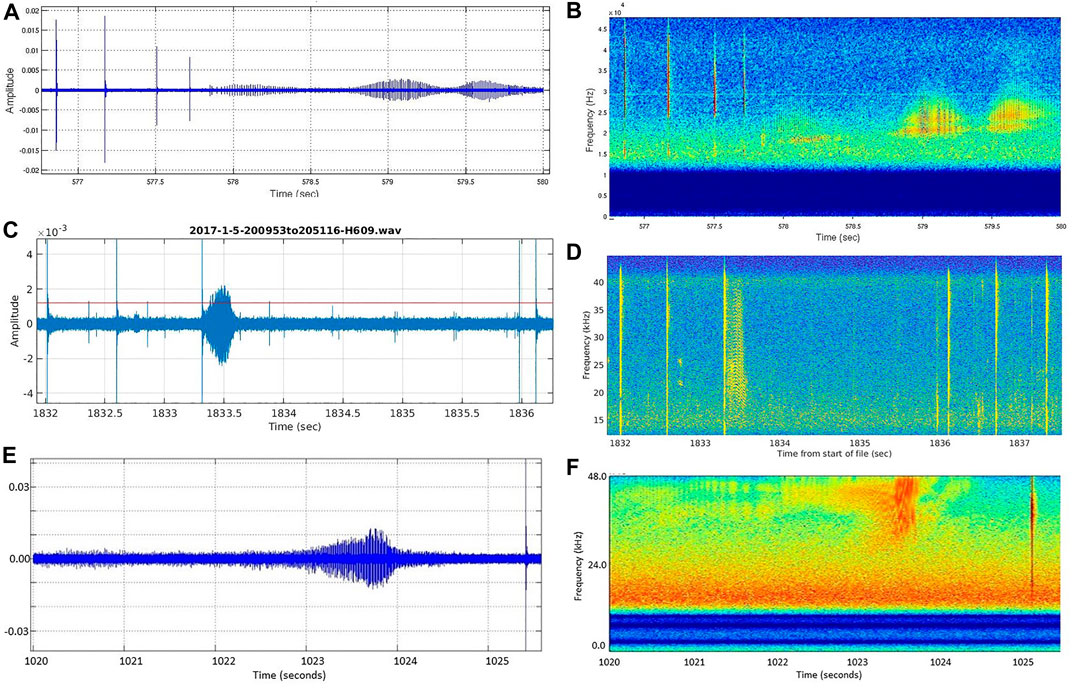
FIGURE 10. (A,B) Md buzz recorded at AUTEC on 8 July 2014 and (C,D) Zc buzz recorded at SOAR on 5 January 2017 are at lower frequency than (E,F) Zc buzz recorded at SOAR on 8 January 2016.
We appreciate that having such large, well-instrumented areas is something unique to Navy ranges. However, the ability to detect beaked whale buzzes, or homing pulses from other odontocetes, is not limited to these sites. Any bottom-mounted sensor or field of sensors is likely to be able to detect some fraction of the buzzes emitted from animals diving within its hearing radius. Detection of buzzes can augment the information provided foraging dive detection regardless of the number of sensors available or area of coverage.
Archived output from the M3R CS-SVM classifier was used to conduct manual review of approximately 36 h of Md buzz detections from AUTEC and an automated review of 3.5 years of Zc buzz detections from SOAR. The AUTEC data indicates that the CS-SVM classifier detected 258 Md buzzes across 78 Md foraging dives, an average of 3.321 buzzes per Md foraging dive. Of the dives containing buzz detections, 4.230 buzzes per dive were identified. The more extensive study of Zc buzz detection at SOAR was conducted using data collected over almost 3.5 years. During this period, 46817 Zc group dives and 97384 buzzes were detected, an average of 2.080 buzzes per dive. However, only 43.7% of the SOAR group dives contained buzz detections. Within those dives, 4.758 buzzes were detected per dive. At both sites, only a small fraction of the number of buzzes likely produced per dive were detected. Given the low probability of detection of buzzes on the remote hydrophones, one must be cautious about extrapolating too much from these data. However, buzzes were detected within group dives across the entire range, within the study periods, at both AUTEC and SOAR. As buzzes are a precursor to prey capture or, at least, prey capture attempts, they are direct evidence of feeding. Monitoring buzz reception, even with limitations, over large spatio-temporal scales can establish expected baselines of observed activity and allow us to identify deviation from that baseline. Being able to monitor feeding over such large spatio-temporal scales may help to inform higher order studies such as population-level health models.
The datasets presented in this article are not readily available because; Data has not been publicly released. Requests to access the datasets should be directed to c3VzYW4ubS5qYXJ2aXMuY2l2QHVzLm5hdnkubWls.
All authors contributed equally to the fieldwork and M3R maintenance efforts through which the data were collect. ND developed the methodology and conducted the analysis for Zc foraging group dive characterisation at SOAR. KD was responsible for data base management and most of preliminary data processing. SJ conducted the software development, data processing and analysis for buzz identification. RM developed much of the software used in the collection and post processing of M3R archives. SJ and ND were the primary authors of the initial draft, but all authors contributed to the review and editing of the manuscript.
The analysis of buzz production at SOAR was funded through the Naval Undersea Warfare Center 219R program (Neil DuBois). Modification of the CS-SVM to include beaked whale buzz classifier was funded through Department of Defense Test Resource Management Center Advanced Instrumentation Science and Technology program (George Shoemaker, Executing Agent). Funding for the maintenance and operation of M3R systems at AUTEC and SOAR, where the data were collected, has been provided by Living Marine Resources Program (Anurag Kumar, Mandy Shoemaker, Danielle Kitchen), Commander U.S. Pacific Fleet Environmental Readiness Division N46 (Mr. Chip Johnson), and the Office of Naval Research Code 32 (Mr. Michael Weise).
We would like to thank Glen Devrow and Thomas Leo for their support of M3R efforts at AUTEC We also thank D. J. Greenhough, Doug Greenhough, Gary Miladelaroca, Dean Yamashita and Gary Duckworth for their support of M3R data collection at SOAR.
The authors declare that the research was conducted in the absence of any commercial or financial relationships that could be construed as a potential conflict of interest.
All claims expressed in this article are solely those of the authors and do not necessarily represent those of their affiliated organizations, or those of the publisher, the editors and the reviewers. Any product that may be evaluated in this article, or claim that may be made by its manufacturer, is not guaranteed or endorsed by the publisher.
Baird, R. W., Webster, D. L., McSweeney, D. J., Ligon, A. D., Schorr, G. S., and Barlow, J. (2006). Diving Behaviour of Cuvier’s (Ziphius Cavirostris) and Blainville’s (Mesolpodon Densirostris) Beaked Whales in Hawai’i. Can. J. Zool. 84, 1120–1128. doi:10.1139/z06-095
Barlow, J., Ferguson, M., Perrin, W. F., Ballance, L. T., Gerrodette, T., Joyce, G., et al. (2006). Abundance and Densities of Beaked and Bottlenose Whales (Family Ziphiidae). J. Ceracean Res. Manage. 7 (3), 263–270.
Baumann-Pickering, S., McDonald, M., Simonis, A., Berga, A., Merkens, K., Olsen, E., et al. (2013). Species-specific Beaked Whale Echolocation Signals. J. Acoust. Soc. Am. 134 (3), 2293–2301. doi:10.1121/1.4817832
Cox, T. M., Ragen, T. J., Read, A. J., Vos, E., Baird, R. W., Balcomb, K., et al. (2006). Understanding the Impacts of Anthropogenic Sound on Beaked Whales. J. Cetacean Res Manage. 7 (3), 177–187.
DeRuiter, S. L., Southall, B. L., Calambokidis, J., Zimmer, W. M. X., Sadykova, D., Falcone, E. A., et al. (2013). First Direct Measurements of Behavioural Responses by Cuvier’s Beaked Whales to Mid-frequency Active Sonar. Biol. Lett. 9, 20130223. doi:10.1098/rsbl.2013.0223
DiMarzio, N., and Jarvis, S. (2016). Temporal and Spatial Distribution and Habitat Use of Cuvier’s Beaked Whales on the U. S. Navy’s Southern California Anti-submarine Warfare Range (SOAR): Data Preparation.
Falcone, E. A., Schorr, G. S., Watwood, S. L., DeRuiter, S. L., Zerbini, A. N., Andrews, R. D., et al. (2017). Diving Behaviour of Cuvier’s Beaked Whales Exposed to Two Types of Military Sonar. R. Soc. open Sci. 4, 170629. doi:10.1098/rsos.170629
Falcone, E. A., Schorr, G. S., Douglas, A. B., Calambokidis, J., Henderson, E., McKenna, M. F., et al. (2009). Sighting Characteristics and Photo Identification of Cuvier’s Beaked Whales (Ziphius Cavirostris) Near San Clemente Island, California: a Key Area for Beaked Whales and the Military? Mar. Biol. 156, 2631–2640. doi:10.1007/s00227-009-1289-8
Jarvis, S., DiMarzio, N., Morrissey, R., and Moretti, D. (2008). A Novel Multi-Class Support Vector Machine Classifier for Automated Classification of Beaked Whales and Other Small Odontocetes. Can. Acoust. 36 (1), 34–40.
Jarvis, S. M. (2012). A Novel Method for Multi-Class Classification Using Support Vector Machines. Doctoral Dissertation (Dartmouth: University of Massachusetts).
Jarvis, S. M., Morrissey, R. P., Moretti, D. J., DiMarzio, N. A., and Shaffer, J. A. (2014). Marine Mammal Monitoring on Navy Ranges (M3R): A Toolset for Automated Detection, Localization and Monitoring of Marine Mammals in Open Ocean Environments. Mar. Technol. Soc. J. 48 (1), 5–20. doi:10.4031/mtsj.48.1.1
Johnson, M., Madsen, P. T., Zimmer, W. M. X., Aguilar de Soto, N., and Tyack, P. L. (2004). Beaked Whales Echolocate on Prey. Proc. Biol. Sci. 271, S383–S386. doi:10.1098/rsbl.2004.0208
Johnson, M., Madsen, P. T., Zimmer, W. M. X., de Soto, N. A., and Tyack, P. L. (2006). Foraging Blainville's Beaked Whales (Mesoplodon Densirostris) Produce Distinct Click Types Matched to Different Phases of Echolocation. J. Exp. Biol. 209, 5038–5050. doi:10.1242/jeb.02596
Johnson, M. P., and Tyack, P. L. (2003). A Digital Acoustic Recording Tag for Measuring the Response of Wild Marine Mammals to Sound. IEEE J. Ocean. Eng. 28 (1), 3–12. doi:10.1109/JOE.2002.808212
MacLeod, C. D., Perrin, W. F., Pitman, R., Barlow, J., Ballance, L., D’Amico, A., et al. (2006). Known and Inferred Distributions of Beaked Whale Species (Cetacea: Ziphiidae). J. Cetacean Res. Manage. 7 (3), 271–286.
Madsen, P. T., Aguilar de Soto, N., Arranz, P., and Johnson, M. (2013). Echolocation in Blainville’s Beaked Whales (Mesoplodon Desirostris). J. Comp. Physiol. A 199, 451–469. doi:10.1007/s00359-013-0824-8
Marques, T. A., Jorge, P. A., Mourino, H., Thomas, L., Moretti, D. J., Dolan, K., et al. (2019). Estimating Group Size from Acoustic Footprint to Improve Blainville’s Beaked Whale Abundance Estimation. Appl. Acoust. 156, 434–439. doi:10.1016/j.apacoust.2019.07.042
METEOR Team (2014). Marine Mammal Effects from T & E on Ocean Ranges (METEOR) FinalReport, Test Resource Management Center, Advanced Instrumentation System Technology, Dr. George Shoemaker (george.shoemaker@navy.Mil). Exec. Agent.
Moretti, D., Marques, T., Thomas, L., DiMarzio, N., Dilley, A., Morrissey, R., et al. (2010). A Dive Counting Density Estimation Method for Blainville’s Beaked Whale (Mesoplodon Densirostris) Using a Bottom-Mounted Hydrophone Field as Applied to a Mid- Frequency Active (MFAS) Sonar Operation. Appl. Acoust. 71 (11), 1036–1042. doi:10.1016/j.apacoust.2010.04.011
Moretti, D., Thomas, L., Marques, T., Thomas, L., Harwood, J., Dilley, A., et al. (2014). A Risk Function for Behavioral Disruption of Blainville’s Beaked Whales (Mesoplodon Densirostris) from Mid-frequency Active Sonar. PLOS ONE 9 (12), e116555. doi:10.1371/journal.pone.0116555
Santos, M. B., Pierce, G. J., Herman, J., Lopez, A., Guerra, A., Mente, E., et al. (2001). Feeding Ecology of Cuvier’s Beaked Whale (Ziphius Cavirostris): a Review with New Information on the Diet of This Species. J. Mar. Biol. Assoc. U. K. 81, 687–694. doi:10.1017/s0025315401004386
Schorr, G. S., Falcone, E. A., Moretti, D. J., and Andrews, R. D. (2014). First Long-Term Behavioral Records from Cuvier’s Beaked Whales (Ziphius Cavirostris) Reveal Record-Breaking Dives. PLoS ONE 9 (3), e92633. doi:10.1371/journal.pone.0092633
Shaffer, J. A., Moretti, D., Johnson, M., Jarvis, S., and Tyack, P. (2013). Effective Beam Pattern of Blainville's Beaked Whale (Mesoplodon Densirostris) and Implications for Passive Acoustic Monitoring. J. Acoust. Soc. Am. 133 (3), 1770–1784. doi:10.1121/1.4776177
Thomas, L., Marques, T., Shaffer, J. A., Baggenstoss, P., Claridge, D., and Dunn, C. (2015). Beaked Whale Group Deep Dive Behavior from Passive Acoustic Monitoring. Available at https://apps.dtic.mil/sti/citations/AD1014320.
Tyack, P. L., Johnson, M., Aguilar de Soto, N., Sturlese, A., and Madsen, P. T. (2006). Extreme Diving of Beaked Whales. J. Exp. Biol. 209, 4238–4253. doi:10.1242/jeb.02505
Vance, H., Madsen, P. T., Aguilar deSoto, N., Wisniewska, D. M., Ladegaard, M., Hooker, S., et al. (2021). Echo-Locating Toothed Whales Used Ultra-fast Echo-Kinetic Responses to Track Elusive Prey. eLife 0, 68825. doi:10.7554/elife.69925
Ward, J., Jarvis, S., Moretti, D., Morrissey, R., DiMarzio, N., Johnson, M., et al. (2011). Beaked Whale (Mesoplodon Densirostris) Passive Acoustic Detection in Increasing Ambient Noise. J. Acoust. Soc. Am. 141 (3), 662–669. doi:10.1121/1.3531844
Warren, V. E., Marques, T. A., Harris, D., Thomas, L., Tyack, P. L., Aguilar de Soto, N., et al. (2017). Spatio-temporal Variation in Click Production Rates of Beaked Whales: Implications for Passive Acoustic Density Estimation. J. Acoust. Soc. Am. 129 (2), 1962–1974. doi:10.1121/1.4978439
Zimmer, W. M. X., Johnson, M. P., Madsen, P. T., and Tyack, P. L. (2005). Echolocation Clicks of Free-Ranging Cuvier’s Beaked Whales (Ziphius Cavirostris). J. Acoust. Soc. Am. 117, 3919–3927. doi:10.1121/1.1910225
Keywords: beaked whale buzzes, beaked whale dive behavior, class-specific support vector machine, automated buzz detection, passive acoustic monitoring. (Min.5-Max. 8)
Citation: Jarvis SM, DiMarzio N, Watwood S, Dolan K and Morrissey R (2022) Automated detection and classification of beaked whale buzzes on bottom-mounted hydrophones. Front. Remote Sens. 3:941838. doi: 10.3389/frsen.2022.941838
Received: 11 May 2022; Accepted: 25 July 2022;
Published: 06 September 2022.
Edited by:
Simone Baumann-Pickering, University of California, United StatesReviewed by:
Charlotte Dunn, Bahamas Marine Mammal Research Organisation (BMMRO), BahamasCopyright © 2022 Jarvis, DiMarzio, Watwood, Dolan and Morrissey. This is an open-access article distributed under the terms of the Creative Commons Attribution License (CC BY). The use, distribution or reproduction in other forums is permitted, provided the original author(s) and the copyright owner(s) are credited and that the original publication in this journal is cited, in accordance with accepted academic practice. No use, distribution or reproduction is permitted which does not comply with these terms.
*Correspondence: Susan M. Jarvis, c3VzYW4ubS5qYXJ2aXMuY2l2QHVzLm5hdnkubWls
Disclaimer: All claims expressed in this article are solely those of the authors and do not necessarily represent those of their affiliated organizations, or those of the publisher, the editors and the reviewers. Any product that may be evaluated in this article or claim that may be made by its manufacturer is not guaranteed or endorsed by the publisher.
Research integrity at Frontiers
Learn more about the work of our research integrity team to safeguard the quality of each article we publish.