 María Daniela Rivarola
 Jacob Dein
 Daniel Simberloff
 Hannah Victoria Herrero
95% of researchers rate our articles as excellent or good
Learn more about the work of our research integrity team to safeguard the quality of each article we publish.
Find out more
ORIGINAL RESEARCH article
Front. Remote Sens. , 08 June 2022
Sec. Remote Sensing Time Series Analysis
Volume 3 - 2022 | https://doi.org/10.3389/frsen.2022.901463
This article is part of the Research Topic Women in Remote Sensing: 2022 View all 16 articles
Protected areas (PAs) remain the most important tool to prevent biodiversity loss and habitat degradation worldwide, but the formal creation of a PA constitutes only the first step. In recent decades, concerns about PA effectiveness have arisen, and several PAs have been evaluated using different methods. Results show that while some PAs are achieving their conservation goals, others have been less effective. Particularly, assessing broadscale outcomes is a method that allows us to monitor change over time at a large scale, using remote sensing data. In this study, we evaluated the effectiveness of Nahuel Huapi National Park, with particular attention to its three protection categories: Strict Natural Reserve (SNR), National Park (NP), and National Reserve (NR) (IUCN categories Ia, II, and VI respectively). We compared changes in Normalized Difference Vegetation Index (NDVI) among sites in these categories and between them and neighboring unprotected areas, over the period 2000–2020. Overall, habitat degradation was low, and we found no difference among the four categories evaluated. Nevertheless, a greening process has been conspicuous in the entire area, with higher values both in the SNR and in the unprotected area. We propose possible explanations as we consider variables such as dominant tree species, precipitation, temperature, elevation, and wildfires. This study supports the importance of NHNP at the regional and national levels, particularly its SNR areas.
Some consider the biodiversity loss occurring nowadays to be the worst biological disaster since the last mass extinction 65 million years ago (Soulé, 1987). Although protecting certain areas or ecosystems is not enough to stop and reverse this trend, the creation of protected areas (PAs) remains one of the most important measures in conservation biology (Hunter & Gibbs, 2007), as shown by the fact that protected area coverage rapidly achieved the goal of 17% of land and inland water protected set by the Convention of Biological Diversity in 2010 (CBD, 2010; WDPA, 2021).
Establishing a PA is the first step toward ecosystem conservation; however, creating a PA does not by itself guarantee its effectiveness at achieving its conservation and management goals. The need to assess PA effectiveness has been widely noted, resulting in a growing number of studies addressing the outcome from different perspectives (Bruner et al., 2001; Nagendra, 2008; Leverington et al., 2010a; Coad et al., 2015; Barnes et al., 2016; Barnes et al., 2017; Coad et al., 2019). Leverington et al. (2010a) summarized different approaches used to assess PA effectiveness as follows: Coverage–studies biodiversity representation within PAs, also known as Gap Analysis (Scott et al., 1993; Armenteras & Villareal, 2003; Chape et al., 2005; Rodríguez-Cabal et al., 2008); Broadscale Outcomes–compares environmental changes within and outside protected areas, generally using remotely sensed data (Nagendra et al., 2013; Herrero et al., 2016); Protected Area Management Effectiveness Assessments (PAME)—uses the scoring framework developed by the IUCN (Hockings, 2003; Coad et al., 2015) or a similar approach; and lastly, Detailed Monitoring–generally reports animal population trends, vegetation conditions, or socioeconomic impacts of a particular PA (Barnes et al., 2016; Geldmann et al., 2018). These different approaches are complementary, as each addresses the outcome from a singular perspective (Hockings et al., 2006).
The term “protected area” comprises areas known by different names, often referring to different types of management. The International Union for Conservation of Nature (IUCN) recognizes six management categories organized from more to less strict as follows: Ia-Strict nature reserve, Ib-Wilderness area, II-National Park, III-Natural monument or feature, IV-Habitat/species management area, V-Protected landscape or seascape, and VI-Protected area with sustainable use of natural resources (Dudley, 2013). While extractive use is forbidden or minimal in categories from I to IV, the restrictions are reduced in categories V and VI. The idea that a stricter management category will yield better habitat preservation has been widely explored in a variety of environments, with contrasting results. A study conducted in Bolivia, Costa Rica, Indonesia, and Thailand found that, although deforestation was generally lower inside the strictest PAs, it was unclear whether this outcome was related to the management category or instead to the remote location of most of the strict PAs (Ferraro et al., 2013). The Royal Chitwan National Park in Nepal allows use by and involvement of local residents, while Celaque National Park in Honduras has a more traditional management approach in which local residents do not participate in this endeavor. Although deforestation rate was lower inside both PAs, the regeneration and conservation of the buffer zones surrounding the PAs were better where local residents were involved, suggesting that regulated use of PAs could be more effective in the long run (Nagendra et al., 2004). Fire incidence in tropical forest located in strict PAs in Latin America and Asia was lower than in the unprotected area; however, multi-use PAs in these continents sustained an even lower fire incidence (Nagendra, 2008).
While most studies looked at entire units belonging to one particular management category, the division of a PA into zones with differing categories of protection has been less studied (Hull et al., 2011). A common management approach is subdividing a PA into more than one management category, resulting in more strictly regulated areas surrounded by less regulated categories acting as buffer zones between the most highly protected area and the unprotected area (Geneletti & van Duren, 2008). This is the situation in Nahuel Huapi National Park (NHNP), located in the northern portion of the temperate forests in Patagonia, Argentina. This protected area, originally created in 1922 as National Park (formerly Southern National Park, then Nahuel Huapi National Park; NP category II IUCN), was later subdivided into National Reserve (NR; category VI IUCN) and Strict Nature Reserve (SNR; category I IUCN) (Rivarola et al., 2021a). The National Reserve was established in 1970 as a buffer zone between the National Park (west) and the unprotected area (east); furthermore, most of the private properties that existed at the time were included in this new (lower) category, allowing for regulated extractive use. Finally, in 1990 pristine and remote areas within the National Park were declared Strict Nature Reserve with no human intervention allowed (Martin & Chehébar, 2001; Rivarola et al., 2021a). NHNP has one city and two small towns on its borders, accounting for a total population of approximately 170,000 people. This region had a low human population density for most of the 20th century, a situation that changed in the 1980s. The population growth rate between 1980 and 1991 reached 101.58%, and it peaked again between 2001 and 2005 (74%), resulting in an unplanned and unregulated urbanization expansion in which social and economic inequity are evident, pressing on natural resources in a complex manner (Madariaga, 2007).
The economic development of this region was historically based on agriculture, livestock, and logging but later switched to tourism, the main source of income nowadays (Schlüler, 1994; Nuñez & Vejsbjerg, 2010). Three biomes are protected by NHNP: high Andes, Patagonian temperate forests, and steppe, with Patagonian temperate forests accounting for the largest extent (Monjeau et al., 2005). These forests have been isolated from other temperate forests since the mid-Tertiary Period (Axelrod et al., 1991; Villagrán and Hinojosa, 1997), and, as a result, 90% of the woody species are endemic (Arroyo et al., 1996) and the region is characterized by one of the highest known rates of plant-animal mutualisms (Aizen & Escurra, 1998). Despite the existence of multiple PAs incorporating Patagonian forests in Chile and Argentina (Armesto et al., 1998; Burkart, 2005), more than 1/3 of the Patagonian forests have been lost since the arrival of Europeans in the 19th century (Tecklin et al., 2002). The assessment of NHNP effectiveness in preserving its biodiversity is crucial. Integral and pluralistic approaches are needed in order to assess PA performance (Caro et al., 2009). Three of the effectiveness assessment methods suggested by Leverington et al. (2010a) have been implemented in this PA. The first was a PAME assessment that found that NHNP management falls in the fairly satisfactory category (Rusch, 2002). Secondly, a coverage study concluded that the hotspot of Patagonian biodiversity is not fully covered by the current PAs (Rodríguez-Cabal et al., 2008). Lastly, a detailed monitoring of the small mammal community of NHNP concluded that there is no clear evidence that a stricter category preserves this community better, with the exception of the endemic marsupial Dromiciops gliroides (Rivarola et al., 2021b). The fourth type of PA effectiveness assessment, broadscale outcome, has not yet been performed, and it is the main goal of the present study.
Ecological applications of satellite remote sensing (SRS) can potentially improve environmental management by providing verifiable and standardized data at a large temporal and spatial scale (Pettorelli et al., 2014). For decades, access to SRS data was very expensive, limiting its use in many countries and regions. The shift toward free SRS databases provided the opportunity for better and wider use of these data (Woodcock et al., 2008). Concomitantly, advances in processing methods have allowed such data to be used in a more comprehensive manner (Hansen & Loveland, 2012). An increasing number of studies have used SRS to assess PA broadscale outcomes, facilitating the evaluation of large areas that would not have been possible to assess from the ground (Nagendra et al., 2004; Buchanan et al., 2008; Wiens et al., 2009). Among all sensors, Landsat provides the longest consistently calibrated data set registering surface changes since 1972 (Markham & Helder, 2012), providing an excellent source of data for habitat monitoring, allowing detection of habitat fragmentation and disturbances in PAs (Nagendra et al., 2013).
Several vegetation indices have been developed in order to draw inferences about vegetation structure, photosynthetic capacity, and leaf water content among other ecological data. Normalized Difference Vegetation Index (NDVI) is the most widely used index and is defined as the ratio of the difference between the spectral reflectance in near-infrared (NIR) and the red (RED) wavelengths divided by the sum of both, where NIR and RED are the light reflected by the vegetation in the NIR and RED wavelength bands, respectively (Gandhi et al., 2015; Yengoh et al., 2016). This index is based on the fact that chlorophyll absorbs RED, while the mesophyll disperses NIR (Pettorelli et al., 2005), and its values range between −1 and +1, where negative values correspond to unvegetated areas (Myneni et al., 1995). This index is highly sensitive to changes in canopy photosynthetic activity, and such changes can be used as an early warning of habitat modification (Leisher et al., 2013; Nagendra et al., 2013). In terrestrial ecosystems, the amount and distribution of vegetation directly influence the abundance and distribution of resident and migrant animals; thus, NDVI is a valuable tool not only for assessing photosynthetic activity but also to infer overall ecosystem status at a large spatial and temporal scale (Pettorelli et al., 2005). Time series analysis of NDVI has been used to assess PA effectiveness, allowing researchers to differentiate between seasonal and yearly changes (Waylen et al., 2014; Herrero et al., 2016; Southworth et al., 2016; Herrero et al., 2020).
The research reported here explores vegetation status of NHNP among its three protection categories along with a neighboring unprotected area. We aimed to assess the effectiveness of the three levels of protection in the NHNP during the 21st century by comparing NDVI time series from 2000 to 2020 of areas under each level of protection to that for “matching” (or “apples-to-apples”) unprotected areas in order to reduce variation associated with different land characteristics (Joppa & Pfaff, 2011). Variation in NDVI can be associated with variables including land cover, precipitation, temperature, and elevation; therefore, we incorporated these factors in our analysis. Using NDVI as a comprehensive metric for all change in vegetation aimed to identify overall trends while serving to suggest influential land change processes for further analysis.
Nahuel Huapi National Park is located between parallels 40° 08′ 18″ and 41° 35′ 19″ South and longitudes 71°50′ 52″ and 71° 04’ 45” West (Figure 1). It is bordered in the west by Chile, in the north by Lanín National Park, in the east by the Patagonian steppe (a small area of which is included within NR), and in the south by the Manso river. Its total area of 7,172.61 km2 is subdivided into different management categories. The eastern 2,253.8 km2 are designated National Reserve (NR), IUCN category VI. This area contains several private properties, where authorized livestock and logging are frequent. Furthermore, this category allows more intensive use and the development of infrastructure related to tourism (hotels, sky resorts). The western 4,918.81 km2 are designated National Park (NP), IUCN category II (WDPA, 2021). There are fewer private properties in this region, and although livestock and logging are forbidden by law in a category II PA, these activities are still common. More extensive use is also allowed, such as campsites and low-impact developments. In 1990, pristine areas within the National Park were declared Strict Nature Reserve (SNR, IUCN category Ia), covering 755.25 km2; and later in 1994, a new subdivision of the NP was proclaimed Wilderness Natural Reserve (WNR, IUCN category Ib). Information regarding the decision process that led to selection of those areas to be included under the strictest category level is unavailable, other than that they were pristine areas, remotely located, with difficult or no ground access. Consequently, several are located at higher elevations (where conflicts with human uses are minimal) or in areas accessible only by boat. This category does not allow any use, other than patrolling and scientific research (Rivarola et al., 2021a). In this study, we investigated NR, NP, and SNR, insofar as we lacked access to spatial data that included WNR. Additionally, we evaluated 2,423.8 km2 of unprotected area located south of the Manso river, using the same NHNP longitudinal range (Figure 1).

FIGURE 1. Map of Nahuel Huapi National Park. Levels of protection indicated by different colors.
NHNP lies within the Valdivian Ecoregion, where High Andean, Patagonian Forests, and Steppe biomes are represented (Burkart et al., 1999). It has a mean annual precipitation of 1,800 mm, with a marked west-east gradient (from above 2,000 mm to approximately 200 mm) owing to the shadow effect of the Andes Mountains (Cabrera, 1976). Most of the NHNP is covered by forest dominated by evergreen or deciduous species of the genus Nothofagus (N. pumilio—Lenga, N. antarctica—Ñire, N. dombeyi—Coihue, N. betuloides—Guindo, and N. nitida—Coihue de Chiloé) and Araucaria araucana (Araucaria) in the northern area, and Austrocedrus chilensis—cypress along the eastern fringe in the ecotone between forest and steppe (Cabrera, 1976).
To quantify NDVI change in the study area in relation to significant environmental variables, we collected satellite imagery, precipitation, and temperature data from available remote sensing products from years 2000–2020, leveraging the resources of Google Earth Engine (Gorelick et al., 2017). While limited remote sensing data are available before 2000, sufficient data available starting in year 2000 allowed us to analyze vegetation change one decade after the strict reserves were first established. In addition to remote sensing data, we also acquired fire history (Mermoz et al., 2005), land cover provided from CIEFAP (Centro de Investigación y Extensión Forestal Andino Patagónico), and tourism data from APN (Administración de Parques Nacionales).
We created cloudless composites using Landsat data by selecting the “greenest” pixel from all scenes captured between December 1 and March 1 of each summer season. We selected only summer data because the presence of evergreen and deciduous forests prevents us from evaluating photosynthetic activity in fall and winter, while frequent presence of snow during the spring would also bias our analysis. The greenest pixel was taken to be that with the highest NDVI, which we computed for each available scene during each season. At least 25 scenes were available for each season.
Composites before 2013 were created using Landsat 7 scenes (Landsat 7 Collection 1 Tier 1 TOA Reflectance courtesy of the U.S. Geological Survey), and composites 2013 and after were created using Landsat 8 (Landsat 8 Collection 1 Tier 1 TOA Reflectance courtesy of the U.S. Geological Survey).
Selecting the greenest pixel allowed for the best interseason NDVI comparisons. However, while the method works well for creating cloudless composites in areas with vegetation present, pixels containing clouds are often selected over areas with low NDVI values, such as water bodies, urban areas, and areas above the tree line. Because these areas contained little vegetation (e.g., sparse ground vegetation growing above the tree line) or no vegetation (water bodies, rocks, bare ground), they were irrelevant to our analysis, and we masked them from the resulting composites to exclude them from analysis. The mask was taken from land cover data provided to us by CIEFAP (Centro de Investigación y Extensión Forestal Andino Patagónico) and shown in Figure 2.

FIGURE 2. Land cover of NHNP and neighboring area.
We collected precipitation data within the study area from the Global Precipitation Measurement (GPM) Integrated Multi-satellitE Retrievals for GPM (IMERG) dataset (Huffman et al., 2019). IMERG provides total precipitation for every month at 0.1 × 0.1° (approximately 11.1 × 11.1 km) spatial resolution and calibrates multiple satellite estimates with ground sources.
We collected temperature data within the study area from the MOD11A1 V6 product derived from data collected by satellites equipped with the Moderate Resolution Imaging Spectroradiometer (MODIS) instrument (Wan et al., 2015). The data provide daily (one daytime and one nighttime) land surface temperature estimates at 1 × 1 km resolution. We computed the mean daytime temperature for every year (Jan 1st-December 31st) for use in analysis.
We calculated the mean NDVI per austral summer from 2000 to 2020 at each level of protection (SNR, NP, NR, Unprotected). We evaluated the synergistic effect of protection and time on changes in mean NDVI using an analysis of covariance (ANCOVA), followed by a post hoc Bonferroni adjustment test. Level of protection and years (2000–2020) were the categorical and continuous variables, respectively. Since differences in NDVI among the levels of protection do not necessarily mean healthier vegetation, but rather could be related to differences in dominant species cover (e.g., NP mostly dominated by N. dombeyi vs. NR mostly dominated by A. chilensis), precipitation, elevation, or temperature, in a second step we selected random points in each of the Unprotected, NR, NP, and SNR levels. Using the available data regarding dominant species cover across NHNP (Margutti & Arosteguy, 2019), we selected 25 random points per area dominated by one of the four most common dominant tree species: N. dombeyi, N. antarctica, N. pumilio, and A. chilensis, accounting for a total of 100 random points each for NP, NR and Unprotected area, and 75 random points for SNR, because no area is dominated by A. chilensis within this category (Figure 2). For these 375 random points we extracted the elevation, and their NDVI values, temperature, and precipitation from 2000 to 2020.
For each random point we ran a linear regression in which we evaluated NDVI change over time, resulting in a total of 375 linear regressions. From each linear regression, we extracted the slope, as it provided us with information regarding the general trend of NDVI change per level of protection. Lastly, we ran an ANOVA test to evaluate if the slopes (indicating NDVI change over time) varied among the four levels of protection, followed by a Tukey HSD test.
Nothofagus dombeyi, N. antarctica, N. pumilio, and A. chilensis respond differently to disturbances such as wildfire, drought, livestock, and windstorm (Raffaele et al., 2014). To investigate if these species experienced a different trend among the levels of protection, we ran a two-way ANOVA test, grouping by level of protection and dominant species and using as dependent variable the 375 slopes from the random points mentioned above, followed by a Bonferroni test.
Previous studies have indicated that precipitation plays an important role in determining NDVI (Herrero et al., 2020). Other characteristics, such as elevation and temperature, might also affect the NDVI values. In order to reduce the number of physical variables used to explain changes in NDVI, we used Pearson’s product-moment correlation to evaluate the correlation between precipitation and elevation (t = 2.16, df = 7,810, p-value = 0.03) and correlation between precipitation and temperature (t = −36.20, df = 7,810, p-value=<1.1e-16). We ran a linear regression to evaluate if annual precipitation in the studied area affected its NDVI. We transformed NDVI values using a Box-Cox transformation to satisfy the normality assumption, then evaluated by ANCOVA whether different levels of protection differed in annual precipitation.
To identify areas where changes in NDVI over the 20-year period were more notable, we filtered those pixels where values changed by more than 1 standard deviation (1 SD = 0.05) in both positive and negative directions. We ran a linear regression to evaluate if increases in NDVI were related to the level of protection, and we ran a second linear regression to analyze the relation between NDVI decreases and level of protection. As mentioned above, total area differs among levels of protection. To standardize the measure among them, we used the percent of area (of each level of protection) where NDVI changed by more than 1 SD. While an increase in NDVI is associated with vegetation growth, this does not necessarily mean that natural vegetation is thriving; in fact, several undesired landscape modifications can induce that change, such as land abandonment and agriculture expansion (Pan et al., 2018). On the other hand, a decrease in NDVI in areas dominated by a particular tree species could reflect disturbances with negative effects on that species. To investigate this situation further, we conducted an ANOVA test to evaluate if decreases in NDVI were related to the type of forest.
We performed the statistical analyses using R 4.0.3 (R Core Team, 2014).
The study area is highly visited during the summer months, when the risk of wildfire is higher owing to low seasonal precipitation. Campsites distributed in NP, NR, and in the neighboring unprotected area receive thousands of visitors, increasing the risk of wildfires. We performed a colocation analysis to determine if fires were more likely to occur near designated campsites. Colocation analysis yields a colocation quotient for each fire centroid, where values less than 1 indicate isolation and values greater than 1 indicate spatial correlation (Leslie & Kronenfeld, 2011). We performed the analysis using the Spatial Statistics toolbox in ESRI ArcGIS Pro version 2.8 using the four nearest neighbors. Fire data were provided by INIBIOMA (Instituto de Investigaciones en Biodiversidad y Medioambiente) and campsite data were provided by NHNP.
We performed an ANCOVA to determine the effect of level of protection on NDVI after controlling for time (years). There was a statistically significant difference in NDVI between the groups (F (3,91) = 170.43, p < 0.0001). Mean NDVI in the Strict Nature Reserve (0.724 ± 0.003) significantly exceeded that in the National Park (0.711 ± 0.003), Unprotected area (0.707 ± 0.003), and National Reserve (0.642 ± 0.003), p < 0.001 (Figure 3).
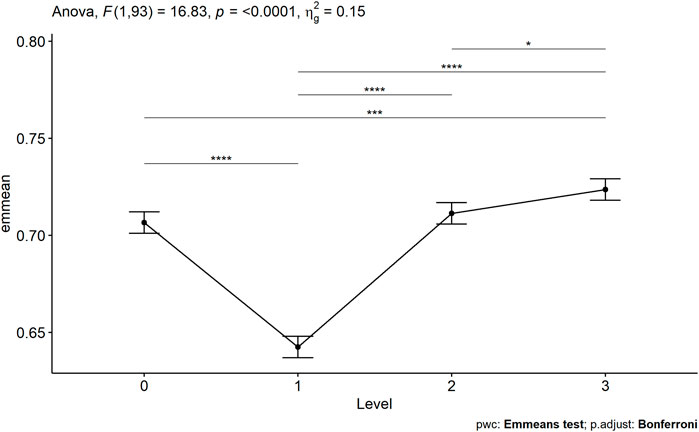
FIGURE 3. Variation in mean NDVI at different levels of protection (0: Unprotected area, 1: National Reserve, 2: National Park, 3: Strict Nature Reserve). Horizontal lines on top indicate statistical differences between levels of protection (pairs).
Linear regressions based on the 375 random points showed an overall NDVI increase over time (Figure 4). We analyzed differences in slope among protection categories by ANOVA. The greening process (NDVI increase over time) was significantly higher in the unprotected area than in the Natural Reserve (p = 0.022), the National Park (p = 0.01), and the Strict Nature Reserve (p = 0.03) (Figure 5).
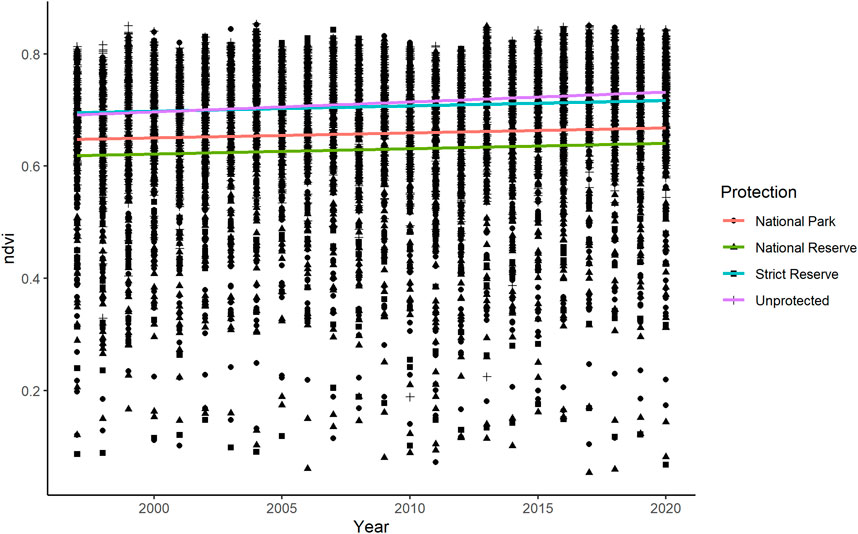
FIGURE 4. NDVI values over time recorded for a total of 375 random points equally distributed among the four levels of protection and four dominant tree species (Nothofagus dombeyi, N. antarctica, N. pumilio, and Austrocedrus chilensis).
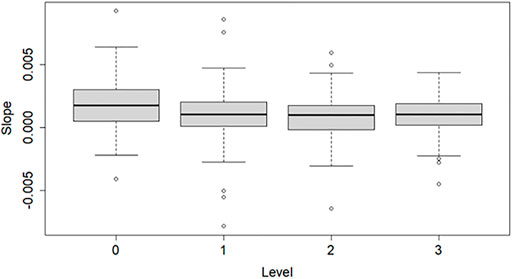
FIGURE 5. Comparison of the NDVI increases over time, indicated as positive slope values, among the different levels of protection (DF = 3, 368, F = 4.366, p = 0.005). 0: unprotected area, 1: National Reserve, 2: National Park, and 3: Strict Nature Reserve.
We further investigated if dominant tree species had a different trend of NDVI change over time in each protection category with a two-way ANOVA. The interaction term between level of protection and dominant tree species was not significant (DF = 8, 357, F = 0.283, p = 0.971), indicating that the tree species did not follow different trends over time in different protection categories (Figure 6). Nevertheless, the “Group” term indicated that different species did follow a different trend without accounting for the protection level (DF = 3, 357, F = 4.036, p = 0.008). We then computed a pairwise comparison using a Bonferroni test and found that the trend of NDVI change over time was more pronounced in N. dombeyi than in N. pumilio (p = 0.0009), with no differences among the other species.
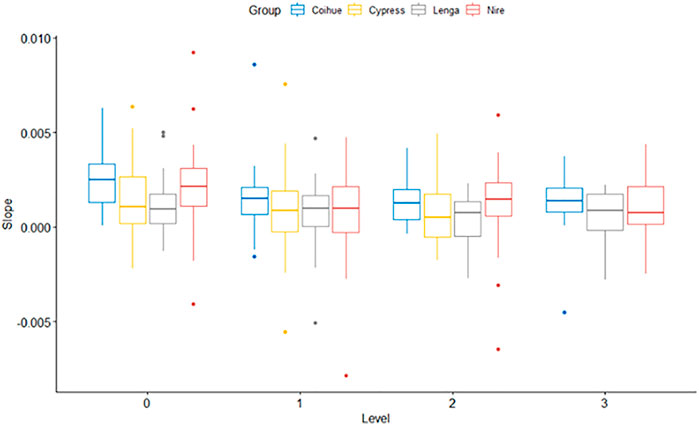
FIGURE 6. Comparison among the NDVI increases over time, indicated as positive slope values, for each of the four most common dominant tree species, among the different levels of protection. 0: unprotected area, 1: National Reserve, 2: National Park, and 3: Strict Nature Reserve.
Precipitation and temperature were negatively correlated (t = −36.198, df = 7,810, p-value < 2.2e-16, r = −0.38), and areas with higher temperature had lower NDVI. On the other hand, precipitation and elevation were positively correlated (t = 2.1616, df = 7,810, p-value = 0.03, r = 0.02). We further analyzed the effects of precipitation on NDVI, since it was the physical variable that explained the highest fraction of the variation. We found a positive correlation between annual precipitation and NDVI (F (1,82) = 17.87, p = 6.1e-05). We conducted an ANCOVA in order to determine if annual precipitation has changed in the studied area, and furthermore, if this change is consistent among the different levels of protection. We found an overall decrease in annual precipitation (F (1,79) = 38.428, p = 2.42e-08), although this decrease differed among levels of protection (F (3,79) = 21.469, p = 2.88e-10) (Figure 7). In addition, a post-hoc Bonferroni analysis showed that estimated mean annual precipitation in the National Reserve was significantly lower than in the other three categories and that the estimated mean precipitation in the Strict Nature Reserve was higher than in the unprotected area (Table 1; Figure 8).
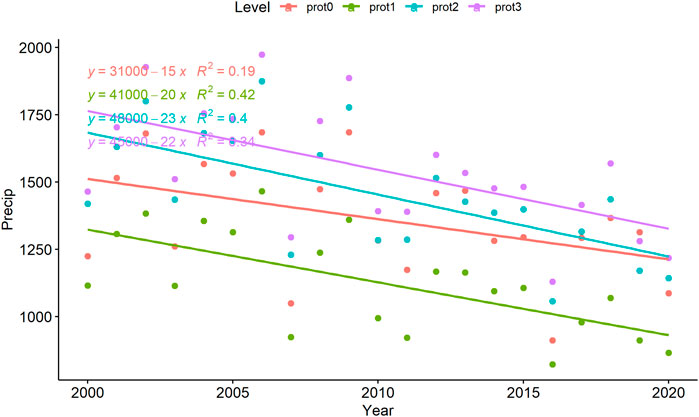
FIGURE 7. Annual precipitation change for each level of protection. prot0: unprotected area, prot1: National Reserve, prot2: National Park, prot3: Strict Nature Reserve.
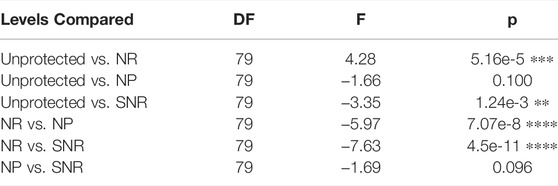
TABLE 1. Results from a Bonferroni test indicating differences between changes in annual precipitation at each protection category. Statistical significance is indicated by ∗.
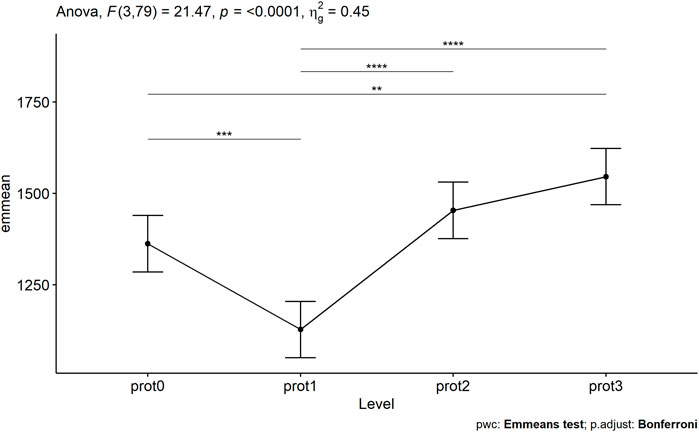
FIGURE 8. Estimated mean annual precipitation for each level of protection based on 20 years of precipitation data (period 2000–2020). Statistical differences among the protection categories are indicated with *. prot0: unprotected area, prot1: National Reserve, prot2: National Park, prot3: Strict Nature Reserve. Horizontal lines on top indicate statistical differences between levels of protection (pairs).
Areas where NDVI changed by more than 1 standard deviation (both positive and negative) are indicated in Figure 9. The percent of greening areas in the unprotected area significantly exceeded that in the NR (Adj. R-squared = 0.435, F (4, 91) = 19.26, p = 1.666e-11), while no significant differences with and among the other categories were found (Figure 10). On the contrary, the same analysis applied to percent of areas with a decreased NDVI yielded no relationship with years or level of protection (Adj. R-squared = 0.001, F (4, 91) = 1.039, p = 0.392) (Figure 11).

FIGURE 9. Map with areas with NDVI increase (blue) and decrease (yellow) in the period 2000–2020.
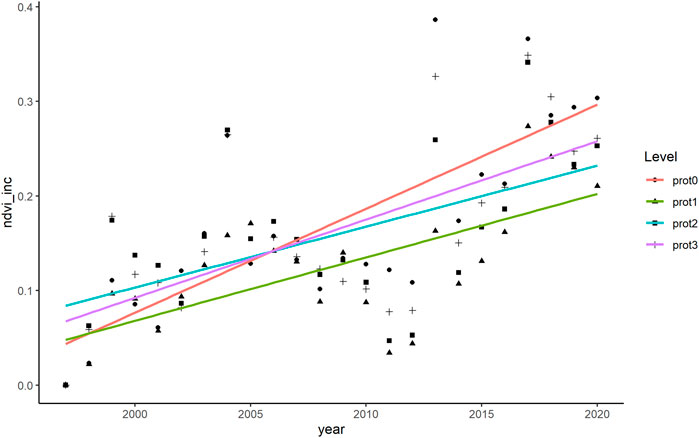
FIGURE 10. Percent of area with an increase in NDVI, per level of protection, over time. prot0: unprotected area, prot1: National Reserve, prot2: National Park, prot3: Strict Nature Reserve.
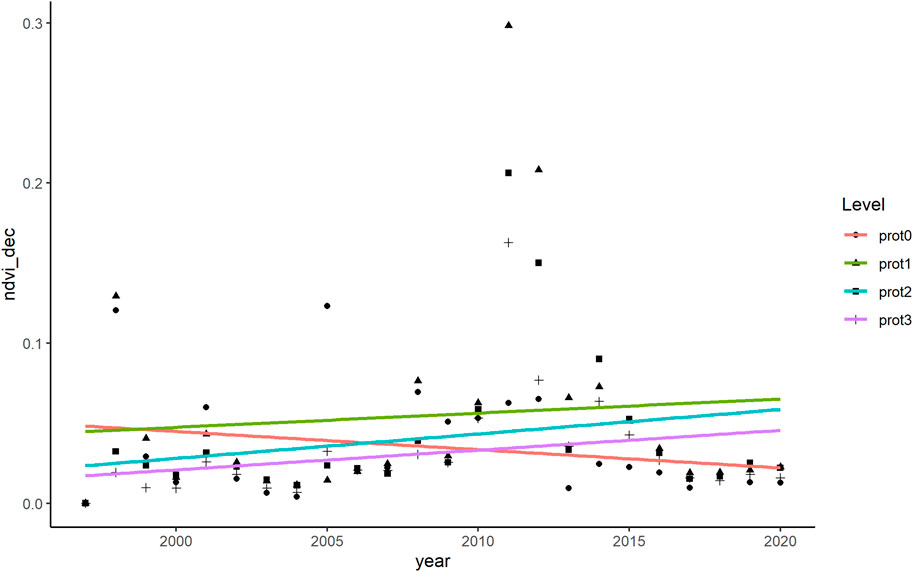
FIGURE 11. Percent of area with a decrease in NDVI, per level of protection, over time. prot0: unprotected area, prot1: National Reserve, prot2: National Park, prot3: Strict Nature Reserve.
To evaluate if negative changes in NDVI were more frequent in forests dominated by a particular tree species, we conducted an ANOVA. We found a significant difference between the number of pixels with a decreased NDVI and the type of forest (F (4,15) = 3.922, p = 0.023). Forests dominated by N. pumilio contained larger proportional areas with a decreased NDVI than did mixed forests (p = 0.0339) and forests dominated by shrub species (p = 0.026) (Figure 12).
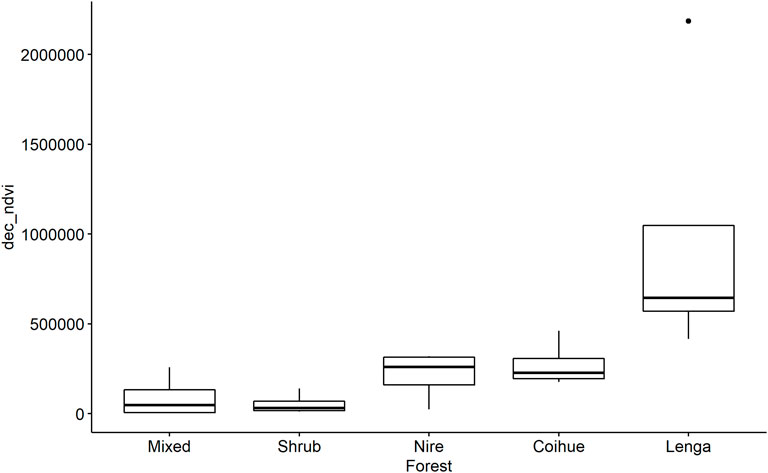
FIGURE 12. Total number of pixels where NDVI decreased over a 20-year period for each type of forest.
As shown in Figure 13 and Table 2, colocation analysis suggests that some fires were more likely to occur near campsites than if they were randomly distributed. However, none of the quotients are statistically significant, which could be due to the low number of both fires (n = 23) and campsites (n = 28). Overall, approximately 1.7% of the land within the study area burned between 2000 and 2020.

FIGURE 13. Fires and campsites within the study area.

TABLE 2. Colocation Analysis Summary: relation between wildfires and campsites.
Remote sensing data provide an excellent opportunity to evaluate land surface changes over time at different scales, from local to global assessments, and they have been widely used to evaluate fragmentation and degradation within protected areas (Nagendra et al., 2013). Leisher et al. (2013) analyzed land and forest degradation in 1,788 PAs in Latin America between 2004 and 2009, concluding that the rate of degradation increased from 0.04 to 0.10% per year, resulting in 1,097,618 ha degraded. They evaluated 166 Argentinean PAs, concluding that almost 20% of them have experienced land and forest degradation, despite having a funding level three times the average for the Latin American countries (US$ 8.60 versus US$ 2.50 per hectare). In this study, we evaluated in detail the conservation status of the oldest and one of the largest of the Argentinean PAs, Nahuel Huapi National Park (NHNP). The second NHNP Management Plan published in 2019 (Margutti & Arosteguy, 2019) highlighted the importance of unifying the criteria used to subdivide the PA following its formal and legal delimitation between different conservation categories (Strict Nature Reserve, Wilderness Natural Reserve, National Park, National Reserve; IUCN categories Ia, Ib, II and VI respectively) rather than by zoning categories based on its uses, as the first management plan proposed (Gil et al., 1986). Because the strictest category was created in 1990, our study spanning from 2000 to 2020 provides the best up-to-date evidence at a broad scale regarding the effectiveness of this high conservation category. NDVI values were consistently higher in the SNR compared to the other protection categories and the unprotected area with an assessment based on the average NDVI per category per year.
This result would provide an optimistic assessment of the effectiveness of the strictest category. However, differences in area, location (affecting precipitation, temperature, elevation), and dominant tree species among the protection categories might bias our understanding of differences among them in effectiveness. To address this problem, we re-evaluated NDVI changes based on the selection of 375 random points, with an equal representation of different dominant tree species among the four levels. Surprisingly, with this second analysis, the unprotected area shows the highest values of NDVI, which differ statistically from those values reported in the three categories inside the PA. A common approach is to compare vegetation inside and outside PAs. However, the border of a PA may coincide with a natural change in habitat type leading to misinterpretation regarding the effectiveness of such a PA (Mas, 2005; Joppa & Pfaff, 2011; Ferraro et al., 2013). We purposely selected as unprotected area the neighboring southern region based on landscape, climatic conditions, and floral similarities with the PA, since the eastern area transitions into steppe and the western area is in a different nation, Chile. Finally, NDVI values within NHNP coincided with the levels of protection (NDVI values SNR > NP > NR).
The general NDVI change trend was positive for all four categories. We found similar results with both assessments (average NDVI per category and using 375 pixel values). The observation of increasing NDVI values agrees with the greening phenomenon reported globally (Zhu et al., 2016). However, interpreting positive NDVI changes remains challenging because no rigorous method has yet been validated (Leisher et al., 2013). Greener does not necessarily mean better conserved. Seasonal or annual changes in NDVI could be associated with an increase in leaf size, number of leaves per plant, plant density, and crop grown per year, but it can also reflect replacement of natural ecosystems by agricultural lands, or non-native species colonization after disturbances (Piao et al., 2020). We selected the widespread NDVI as a comprehensive metric to assess overall vegetation trends between levels of protection. Established land change detection algorithms, such as LandTrendr (Kennedy et al., 2018) and CCDC (Arévalo et al., 2020), for example, could be used to study specific land change processes, such as forest degradation/regeneration (e.g., Piffer et al., 2022), in more detail. However, algorithms designed to detect abrupt changes may not identify land change processes, such as the spread of invasive species or global greening. In the case of NHNP, no forest has been replaced by agricultural land, but rather more gradual land change processes of livestock grazing and spread of non-native species were identified as main threats to the PA, along with the more abrupt disturbances of logging and wildfire (Margutti & Arosteguy, 2019). While a compelling body of evidence depicts negative effects associated with non-native plant species in NHNP (Simberloff et al., 2002; Nuñez, 2008; Svriz et al., 2013; Franzese & Ghermandi, 2014), where 25% of the plant species are non-native (Raffaele et al., 2014), further studies are needed to evaluate if this colonization is related to the increased NDVI values reported here. Furthermore, introduced animals impact forest structure and regeneration in NHNP (Barrios-Garcia & Simberloff, 2013; Nuñez et al., 2013; Rodríguez-Cabal et al., 2013; Martin-Albarracin et al., 2015). Land change processes can interact to produce complex outcomes. For example, the combination of cattle and wildfires negatively affected regeneration of Nothofagus dombeyi - Austrocedrus chilensis mixed forests in NHNP, facilitating a post-fire transition from forest to bamboo-dominated shrubland (Blackhall et al., 2008), which could increase NDVI values (Franco et al., 2020). Specific studies addressing this question are needed and could be aided by land cover classification in combination with established land change detection algorithms.
We found a positive relationship between NDVI and precipitation, supporting previous findings (Herrero et al., 2020). Furthermore, the variation in precipitation among the levels of protection resembles the differences found among their NDVI values (SNR > NP > Outside > NR, see Figure 3 and Figure 8), suggesting that precipitation might be the cause of these differences in NDVI rather than levels of protection. However, mean annual precipitation fluctuated over time across this region, but the overall trend manifests a decreasing pattern. Precipitation therefore cannot explain the increasing NDVI trend.
In addition to identifying the general greening pattern explained above, we further investigated this process by extracting pixels where the NDVI changed more than 1 SD during the period studied. The unprotected area accounted for a larger increase compared to the NR, while this difference was not evident between unprotected and NP, unprotected and SNR, or within the three levels of protection inside NHNP. As stated above, interpretation of increasing NDVI is difficult; however, as a similar pattern or tendency was observed inside and outside the PA, the greening process could be a consequence of a global phenomenon such as climate change and increased CO2 (Ogunkoya et al., 2021), further exacerbated in the unprotected area where extensive livestock and logging are common.
Negative NDVI change could be more easily related to degradation and habitat fragmentation (Morton et al., 2005; Leisher et al., 2013). We found no evidence that degradation was more extensive in the unprotected area compared to that in areas under any level of protection. However, during the year 2012 there was a peak in the percentage of area with a negative NDVI change inside the PA (NR ∼ 30%, NP ∼ 20%, SNR ∼16%), but this value remained low in the unprotected area (∼5%). This result could be explained by the massive ash deposit as consequence of the Puyehue-Cordón Caulle volcanic eruption that dispersed about 100 million metric tons of ash, covering 7.5 million ha in Patagonia (Wilson et al., 2013). While the central and northern areas of NHNP were severely affected by ash deposition, the southern portion of NHNP and the unprotected area evaluated in this study remained free of ash. The area more severely affected by ash deposition (Bignami et al., 2014) coincides with the yellow area observed in the NW section of Figure 9.
Fragmentation or degradation were more striking in areas dominated by Nothofagus pumilio (both inside and outside the PA) compared to areas dominated by mixed forests and shrublands. Nothofagus pumilio forests are distributed at high elevations along approximately 3,000 km of the southern Andes Mountain chain (Mathiasen & Premoli, 2010). A previous study found a positive correlation between N. pumilio growth and precipitation, and a negative correlation with mean annual temperature (Lara et al., 2005). Severe droughts in the 20th century following relatively wet and cool years have been associated with a persistent decline in N. pumilio growth, suggesting that current and future trends with lower precipitation and higher temperatures associated with climate change would further promote the decline of these forests (Rodríguez-Catón et al., 2016). Furthermore, wildfires have historically affected forests of N. pumilio by direct burning (Veblen et al., 2003) and also by reducing root ectomycorrhizal colonization after fire (Longo et al., 2011).
Wildfires in the region are common between September and April, with record numbers in January and February, due to the combination of low precipitation and high temperatures during the austral summer. The causes of most of these wildfires remain unknown owing to lack of trained personnel and low budgets. However, human activities are thought to be closely related to their occurrence (Monjeau et al., 2005; Margutti & Arosteguy, 2019). Although tourists arrive in NHNP throughout the year, more than 23% of the total annual visitation occurs during the summer months (Área Técnica y Estadística, 2015). Campsites are distributed in NP, NR, and the unprotected area, and camping during summer is one of the favorite activities for both residents and tourists. Since the establishment of campsites within the PA is regulated by the APN (National Park Administration), we explored if the locations of wildfires were associated with the authorized campsites. We used available data (date, location, and area burnt) for 22 wildfires that occurred between 1999 and 2015 within NHNP. Although we found no relationship between these two variables, it is important to notice that there were a total of 239 fires recorded in this period, most of which (150) affected less than 0.5 ha (Margutti & Arosteguy, 2019), and no location data were available, so we could not include such data in our analysis. Furthermore, illegal campfires are common across the region, and the low number of personnel and lack of appropriate vehicles make it difficult for authorities to prevent them (Rivarola et al., 2021a). On the other hand, the combination of the current trend of warmer and drier summers following unusually dry springs (phenomena associated with La Niña events), uncommon electrical storms during the summer, and the massive accumulation of fuel material in the forests constitutes a permanent threat for these forests, across all levels of protection. The remote and isolated location of most SNR areas makes them particularly vulnerable to fires, since ground access is difficult, preventing prompt response to many fires, resulting in thousands of hectares affected. On 7 December 2021, lighting ignited a wildfire in the southern area of NHNP, within the SNR. The initial, small fire could not be controlled because firefighters could not access the area. The wildfire is spreading and remains active at the time this manuscript is being written, 1.5 months after the initiation of the fire. It is estimated that more than 6,000 ha of pristine native forests within NHNP (both in SNR and NP) have been burned (ADN, 2022; Sala de Noticias, 2022).
Effectiveness assessments should be performed regularly, using multiple and complementary approaches, which would provide crucial information to update management plans as needed, and ultimately, would secure PA conservation goals. The inclusion of PA protection categories, reports regarding effectiveness assessments implemented in those PAs with multiple categories, and current and past management plans within WDPA (the global databases on PAs) would allow a consistent evaluation at the local and global scale. Effective management of PAs is essential to conserve natural ecosystems. Their role in ecosystem services and preserving biodiversity goes beyond the limits of a PA, and they constitute a substantial fraction of a country’s national capital, supporting national sustainable development and human well-being (Bovarnick et al., 2010). The Argentinean PA system has a long history, and despite political and economic instability in the country, the general trend of PA establishment and management by the APN is promising (Rivarola et al., 2021a). Weaknesses and threats were well identified in the latest management plan for NHNP, and general and specific goals were established for both the short and the long term. This study provides new information that stakeholders in NHNP could take into account to better assess the conditions and changes occurring in this PA and act accordingly. NHNP is an emblematic PA at the national and international level, and its successful management would benefit not only the natural ecosystems represented in the area but also people who are directly or indirectly connected to this PA.
The raw data supporting the conclusions of this article will be made available by the authors, without undue reservation.
MR developed the idea, obtained local data, did the literature review, analyzed the data, created the graphs, and wrote the manuscript. JD obtained, cleaned, and organized the data, and made the maps. DS revised and edited the manuscript. HH provided ideas, revised and edited the manuscript.
The authors declare that the research was conducted in the absence of any commercial or financial relationships that could be construed as a potential conflict of interest.
All claims expressed in this article are solely those of the authors and do not necessarily represent those of their affiliated organizations, or those of the publisher, the editors and the reviewers. Any product that may be evaluated in this article, or claim that may be made by its manufacturer, is not guaranteed or endorsed by the publisher.
Adn, S. U. R. (2022). ADN Sur Agencia de Noticias. Chubut, Argentina: Comodoro Rivadavia. https://www.adnsur.com.ar.Río Negro: el incendio cerca del Lago Steffen ya afectó unas 5.438 hectáreas
Aizen, M., and Escurra, C. (1998). High Incidence of Plant-Animal Mutualisms in the Woody Flora of the Temperate Forest of Southern South America: Biogeographical Origin and Present Ecological Significance. Ecol. Austral 8, 217–236.
Arévalo, P., Bullock, E. L., Woodcock, C. E., and Olofsson, P. (2020). A Suite of Tools for Continuous Land Change Monitoring in Google Earth Engine. Front. Clim. 2, 576740. doi:10.3389/fclim.2020.576740
Armenteras, D., Gast, F., and Villareal, H. (2003). Andean Forest Fragmentation and the Representativeness of Protected Natural Areas in the Eastern Andes, Colombia. Biol. Conserv. 113, 245–256. doi:10.1016/s0309-1740(03)00100-110.1016/s0006-3207(02)00359-2
Armesto, J. J., Rozzi, R., Smith-Ramírez, C., and Arroyo, M. T. K. (1998). Conservation Targets in South American Temperate Forests. Science 282, 1271–1272. doi:10.1126/science.282.5392.1271
Arroyo, M. T. K., Riveros, M., Peñaloza, A., Cavieres, L., and Faggi, A. M. (1996). “Phytogeographic Relationships and Regional Richness Patterns of the Cool Temperate Rainforest Flora of Southern South America,” in High-Latitude Rainforests and Associated Ecosystems of the West Coast of the Americas: Climate, Hydrology, Ecology, and Conservation. Editor R. G. Lawfordet al. (New York, NY: Springer New York), 134–172. doi:10.1007/978-1-4612-3970-3_8
Axelrod, D. I., Kalin Arroyo, M. T., and Raven, P. H. (1991). Historical Development of Temperate Vegetation in the Americas. Rev. Chil. Hist. Nat. 64, 413–446.
Barnes, M. D., Craigie, I. D., Dudley, N., and Hockings, M. (2017). Understanding Local-Scale Drivers of Biodiversity Outcomes in Terrestrial Protected Areas. Ann. N.Y. Acad. Sci. 1399, 42–60. doi:10.1111/nyas.13154
Barnes, M. D., Craigie, I. D., Harrison, L. B., Geldmann, J., Collen, B., Whitmee, S., et al. (2016). Wildlife Population Trends in Protected Areas Predicted by National Socio-Economic Metrics and Body Size. Nat. Commun. 7, 1–9. doi:10.1038/ncomms12747
Barrios-Garcia, M. N., and Simberloff, D. (2013). Linking the Pattern to the Mechanism: How an Introduced Mammal Facilitates Plant Invasions. Austral Ecol. 38, 884–890. doi:10.1111/aec.12027
Bignami, C., Corradini, S., Merucci, L., de Michele, M., Raucoules, D., De Astis, G., et al. (2014). Multisensor Satellite Monitoring of the 2011 Puyehue-Cordon Caulle Eruption. IEEE J. Sel. Top. Appl. Earth Obs. Remote Sens. 7 (7), 2786–2796.
Blackhall, M., Raffaele, E., and Veblen, T. T. (2008). Cattle Affect Early Post-fire Regeneration in a Nothofagus Dombeyi-Austrocedrus Chilensis Mixed Forest in Northern Patagonia, Argentina. Biol. Conserv. 141, 2251–2261. doi:10.1016/j.biocon.2008.06.016
Bovarnick, A., Fernandez Baca, J., Galindo, J., and Negret, H. (2010). Financial Sustainability of Protected Areas in Latin America and the Caribbean: Investment Policy Guidance. New York, NY and Arlington, VA: United Nations Development Program (UNDP) and The Nature Conservancy (TNC).
Bruner, A. G., Gullison, R. E., Rice, R. E., and da Fonseca, G. A. B. (2001). Effectiveness of Parks in Protecting Tropical Biodiversity. Science 291, 125–128. doi:10.1126/science.291.5501.125
Buchanan, G. M., Butchart, S. H. M., Dutson, G., Pilgrim, J. D., Steininger, M. K., Bishop, K. D., et al. (2008). Using Remote Sensing to Inform Conservation Status Assessment: Estimates of Recent Deforestation Rates on New Britain and the Impacts upon Endemic Birds. Biol. Conserv. 141, 56–66. doi:10.1016/j.biocon.2007.08.023
Burkart, R. (2005). “Las Áreas Protegidas de la Argentina,” in La Situación Ambiental Argentina 2005. Editors A. Brown, U. Martinez Ortiz, M. Acerbi, and J. Corcuera (Buenos Aires, Argentina: Administracion de Parques Nacionales), 399–431.
Burkart, R., Barbaro, N. O., Sanchez, R. O., and Gomez, D. A. (1999). in Eco-Regiones de la Argentina (Buenos Aires, Argentina: Presidencia de la Nacion), 45. Administracion de Parques Nacionales, S. d. R. N. y. D. S.
Caro, T., Gardner, T. A., Stoner, C., Fitzherbert, E., and Davenport, T. R. B. (2009). Assessing the Effectiveness of Protected Areas: Paradoxes Call for Pluralism in Evaluating Conservation Performance. Divers. Distributions 15, 178–182. doi:10.1111/j.1472-4642.2008.00522.x
CBD (2010). Decision Adopted by the CoP to the CBD at its 10th Meeting (UNEP/CBD/COP/DEC/X/2. Montreal: Secretariat of the CBD.
Chape, S., Harrison, J., Spalding, M., and Lysenko, I. (2005). Measuring the Extent and Effectiveness of Protected Areas as an Indicator for Meeting Global Biodiversity Targets. Phil. Trans. R. Soc. B 360, 443–455. doi:10.1098/rstb.2004.1592
Coad, L., Leverington, F., Knights, K., Geldmann, J., Eassom, A., Kapos, V., et al. (2015). Measuring Impact of Protected Area Management Interventions: Current and Future Use of the Global Database of Protected Area Management Effectiveness. Phil. Trans. R. Soc. B 370, 20140281. doi:10.1098/rstb.2014.0281
Coad, L., Watson, J. E., Geldmann, J., Burgess, N. D., Leverington, F., Hockings, M., et al. (2019). Widespread Shortfalls in Protected Area Resourcing Undermine Efforts to Conserve Biodiversity. Front. Ecol. Environ. 17, 259–264. doi:10.1002/fee.2042
Dudley, N. (2013). Guidelines for Applying Protected Area Management Categories Including IUCN WCPA Best Practice Guidance on Recognising Protected Areas and Assigning Management Categories and Governance Types. Gland: IUCN, 86.
Estadística, Á. T. Y. (2015). Temporada Estival Enero Y Febrero, Comparación Anual. San Carlos de Bariloche: Secretaría Municipal de Turismo, 16.
Ferraro, P. J., Hanauer, M. M., Miteva, D. A., Canavire-Bacarreza, G. J., Pattanayak, S. K., and Sims, K. R. E. (2013). More Strictly Protected Areas Are Not Necessarily More Protective: Evidence from Bolivia, Costa Rica, Indonesia, and Thailand. Environ. Res. Lett. 8, 025011. doi:10.1088/1748-9326/8/2/025011
Franco, M. G., Mundo, I. A., and Veblen, T. T. (2020). Field-validated Burn-Severity Mapping in North Patagonian Forests. Remote Sens. 12, 214. doi:10.3390/rs12020214
Franzese, J., and Ghermandi, L. (2014). Early Competition between the Exotic Herb Rumex acetosella and Two Native Tussock Grasses with Different Palatability and Water Stress Tolerance. J. Arid Environ. 106, 58–62. doi:10.1016/j.jaridenv.2014.03.004
Gandhi, G. M., Parthiban, S., Thummalu, N., and Christy, A. (2015). Ndvi: Vegetation Change Detection Using Remote Sensing and GIS - A Case Study of Vellore District. Procedia Comput. Sci. 57, 1199–1210. doi:10.1016/j.procs.2015.07.415
Geldmann, J., Coad, L., Barnes, M. D., Craigie, I. D., Woodley, S., Balmford, A., et al. (2018). A Global Analysis of Management Capacity and Ecological Outcomes in Terrestrial Protected Areas. Conserv. Lett. 11, e12434. doi:10.1111/conl.12434
Geneletti, D., and van Duren, I. (2008). Protected Area Zoning for Conservation and Use: A Combination of Spatial Multicriteria and Multiobjective Evaluation. Landsc. Urban Plan. 85, 97–110. doi:10.1016/j.landurbplan.2007.10.004
Gil, J., Malvarez, I., and Martín, C. (1986). Plan de Manejo del Parque Nacional Nahuel Huapi. Editor A. d. P. Nacionales (Bariloche - Argentina: APN).
Gorelick, N., Hancher, M., Dixon, M., Ilyushchenko, S., Thau, D., and Moore, R. (2017). Google Earth Engine: Planetary-Scale Geospatial Analysis for Everyone. Remote Sens. Environ. 202, 18–27. doi:10.1016/j.rse.2017.06.031
Hansen, M. C., and Loveland, T. R. (2012). A Review of Large Area Monitoring of Land Cover Change Using Landsat Data. Remote Sens. Environ. 122, 66–74. doi:10.1016/j.rse.2011.08.024
Herrero, H., Southworth, J., and Bunting, E. (2016). Utilizing Multiple Lines of Evidence to Determine Landscape Degradation within Protected Area Landscapes: A Case Study of Chobe National Park, Botswana from 1982 to 2011. Remote Sens. 8, 623. doi:10.3390/rs8080623
Herrero, H., Southworth, J., Muir, C., Khatami, R., Bunting, E., and Child, B. (2020). An Evaluation of Vegetation Health in and Around Southern African National Parks during the 21st Century (2000-2016). Appl. Sci. 10, 2366. doi:10.3390/app10072366
Hockings, M., Stolton, S. U. E., Leverington, F., Dudley, N., Courrau, J., and Valentine, P. (2006). Evaluating Effectiveness. A Framework for Assessing Management Effectiveness of Protected Areas. Gland, Switzerland and Cambridge, UK: IUCN The World Conservation Union.
Hockings, M. (2003). Systems for Assessing the Effectiveness of Management in Protected Areas. BioScience 53, 823. doi:10.1641/0006-3568(2003)053[0823:sfateo]2.0.co;2
Huffman, G. J., Stocker, E. F., Bolvin, D. T., Nelkin, E. J., and Tan, J. (2019). GPM IMERG Final Precipitation L3 1 Month 0.1 Degree X 0.1 Degree V06. Greenbelt, MD: Goddard Earth Sciences Data and Information Services Center (GES DISC.
Hull, V., Xu, W., Liu, W., Zhou, S., Viña, A., Zhang, J., et al. (2011). Evaluating the Efficacy of Zoning Designations for Protected Area Management. Biol. Conserv. 144, 3028–3037. doi:10.1016/j.biocon.2011.09.007
Hunter, M. L., and Gibbs, J. P. (2007). Fundamentals of Conservation Biology. Maden, MA, USA: Blackwell Publishing.
Joppa, L. N., and Pfaff, A. (2011). Global Protected Area Impacts. Proc. R. Soc. B 278, 1633–1638. doi:10.1098/rspb.2010.1713
Kennedy, R., Yang, Z., Gorelick, N., Braaten, J., Cavalcante, L., Cohen, W., et al. (2018). Implementation of the LandTrendr Algorithm on Google Earth Engine. Remote Sens. 105, 691. doi:10.3390/rs10050691
Lara, A., Villalba, R., Wolodarsky-Franke, A., Aravena, J. C., Luckman, B. H., and Cuq, E. (2005). Spatial and Temporal Variation in Nothofagus Pumilio Growth at Tree Line along its Latitudinal Range (35°40′-55° S) in the Chilean Andes. J. Biogeogr. 32, 879–893. doi:10.1111/j.1365-2699.2005.01191.x
Leisher, C., Touval, J., Hess, S., Boucher, T., and Reymondin, L. (2013). Land and Forest Degradation inside Protected Areas in Latin America. Diversity 5, 779–795. doi:10.3390/d5040779
Leslie, T. F., and Kronenfeld, B. J. (2011). The Colocation Quotient: A New Measure of Spatial Association between Categorical Subsets of Points. Geogr. Anal. 43, 306–326. doi:10.1111/j.1538-4632.2011.00821.x
Leverington, F., Costa, K. L., Pavese, H., Lisle, A., and Hockings, M. (2010a). A Global Analysis of Protected Area Management Effectiveness. Environ. Manag. 46, 685–698. doi:10.1007/s00267-010-9564-5
Longo, M. S., Urcelay, C., and Nouhra, E. (2011). Long Term Effects of Fire on Ectomycorrhizas and Soil Properties in Nothofagus Pumilio Forests in Argentina. For. Ecol. Manag. 262, 348–354. doi:10.1016/j.foreco.2011.03.041
Madariaga, M. (2007). Interacción entre ambiente y población en San Carlos de Bariloche. Bariloche, Rio Negro, Argentina: INTA, 40.
Margutti, L., and Arosteguy, C. (2019). “Plan de Gestión del Parque Nacional Nahuel Huapi,” in San Carlos de Bariloche. Editor A. d. P. Nacionales.
Markham, B. L., and Helder, D. L. (2012). Forty-year Calibrated Record of Earth-Reflected Radiance from Landsat: A Review. Remote Sens. Environ. 122, 30–40. doi:10.1016/j.rse.2011.06.026
Martin, C. E., and Chehébar, C. (2001). The National Parks of Argentinian Patagonia - Management Policies for Conservation, Public Use, Rural Settlements, and Indigenous Communities. J. R. Soc. N. Z. 31, 845–864. doi:10.1080/03014223.2001.9517680
Martin-Albarracin, V. L., Nuñez, M. A., and Amico, G. C. (2015). Replacement of Native by Non-native Animal Communities Assisted by Human Introduction and Management on Isla Victoria, Nahuel Huapi National Park. PeerJ 3, e1328. doi:10.7717/peerj.1328
Mas, J.-F. (2005). Assessing Protected Area Effectiveness Using Surrounding (Buffer) Areas Environmentally Similar to the Target Area. Environ. Monit. Assess. 105, 69–80. doi:10.1007/s10661-005-3156-5
Mathiasen, P., and Premoli, A. C. (2010). Out in the Cold: Genetic Variation of Nothofagus Pumilio (Nothofagaceae) Provides Evidence for Latitudinally Distinct Evolutionary Histories in Austral South America. Mol. Ecol. 19, 371–385. doi:10.1111/j.1365-294X.2009.04456.x
Mermoz, M., Kitzberger, T., and Veblen, T. T. (2005). Landscape Influences on Occurrence and Spread of Wildfires in Patagonian Forests and Shrublands. Ecology 86, 2705–2715. doi:10.1890/04-1850
Monjeau, A., Nazar Anchorena, S., Montoni, V., Marquez, J., Alcalde, D., D'Iorio, A., et al. (2005). Perfil del Área Protegida Argentina: Parque Nacional Nahuel Huapi. Available at: http://www.parkswatch.org/parkprofile.php?l=eng&country=arg&park=nhnp.
Morton, D. C., DeFries, R. S., Shimabukuro, Y. E., Anderson, L. O., Del Bon Espírito-Santo, F., Hansen, M., et al. (2005). Rapid Assessment of Annual Deforestation in the Brazilian Amazon Using MODIS Data. Earth Interact. 9, 1–22. doi:10.1175/ei139.1
Myneni, R. B., Hall, F. G., Sellers, P. J., and Marshak, A. L. (1995). The Interpretation of Spectral Vegetation Indexes. IEEE Trans. Geosci. Remote Sens. 33, 481–486. doi:10.1109/TGRS.1995.874602910.1109/36.377948
Nagendra, H. (2008). Do parks Work? Impact of Protected Areas on Land Cover Clearing. AMBIO A J. Hum. Environ. 37, 330–337. doi:10.1579/06-r-184.1
Nagendra, H., Lucas, R., Honrado, J. P., Jongman, R. H. G., Tarantino, C., Adamo, M., et al. (2013). Remote Sensing for Conservation Monitoring: Assessing Protected Areas, Habitat Extent, Habitat Condition, Species Diversity, and Threats. Ecol. Indic. 33, 45–59. doi:10.1016/j.ecolind.2012.09.014
Nagendra, H., Tucker, C., Carlson, L., Southworth, J., Karmacharya, M., and Karna, B. (2004). Monitoring Parks through Remote Sensing: Studies in Nepal and Honduras. Environ. Manag. 34, 748–760. doi:10.1007/s00267-004-0028-7
Nuñez, M. A. (2008), Experiments on Multiple Factors Affecting Pinaceae Invasions on Isla Victoria, Nahuel Huapi National Park, Argentina. Ecology and Evolutionary Biology, PhD. Diss. Knoxville, TN: University of Tennessee, 102.
Nuñez, M. A., Hayward, J., Horton, T. R., Amico, G. C., Dimarco, R. D., Barrios-Garcia, M. N., et al. (2013). Exotic Mammals Disperse Exotic Fungi that Promote Invasion by Exotic Trees. PLoS One 8, e66832. doi:10.1371/journal.pone.0066832
Nuñez, P., and Vejsbjerg, L. (2010). Tourism between Economic Activity and Social Right, 19. Nahuel Huapi National Park, 1934930–1955945.Estud. Perspect. Tur.
Ogunkoya, A., Kaplan, J., Whitlock, C., Nanavati, W., Roberts, D. W., and Poulter, B. (2021). Drivers of Recent Forest Cover Change in Southern South America Are Linked to Climate and CO2. Landsc. Ecol. 36, 3591–3606. doi:10.1007/s10980-021-01330-7
Pettorelli, N., Laurance, W. F., O'Brien, T. G., Wegmann, M., Nagendra, H., Turner, W., et al. (2014). Satellite Remote Sensing for Applied Ecologists: Opportunities and Challenges. J. Appl. Ecol. 51, 839–848. doi:10.1111/1365-2664.12261
Pettorelli, N., Vik, J. O., Mysterud, A., Gaillard, J.-M., Tucker, C. J., and Stenseth, N. C. (2005). Using the Satellite-Derived NDVI to Assess Ecological Responses to Environmental Change. Trends Ecol. Evol. 20, 503–510. doi:10.1016/j.tree.2005.05.011
Piao, S., Wang, X., Park, T., Chen, C., Lian, X., He, Y., et al. (2020). Characteristics, Drivers and Feedbacks of Global Greening. Nat. Rev. Earth Environ. 1, 14–27. doi:10.1038/s43017-019-0001-x
Piffer, P. R., Rosa, M. R., Tambosi, L. R., Metzger, J. P., and Uriarte, M. (2022). Turnover Rates of Regenerated Forests Challenge Restoration Efforts in the Brazilian Atlantic Forest. Environ. Res. Lett. 17 (4), 045009. doi:10.1088/1748-9326/ac5ae1
R Core Team (2014). R: A Language and Environment for Statsitical Computing. Vienna, Austria: R Foundation for Statistical Computing.
Raffaele, E., de Torres Curth, M., Morales, C. L., and Kitzberger, T. (2014). Ecologia e Historia Natural de la Patagonia Andina. Ciuddad Autonoma de Buenos Aires, Argentina: Fundacion de Historia Natural Felix de Azara.
Rivarola, M. D., Simberloff, D., and Leppanen, C. (2021a). History of Protected Areas in Argentina: A Seesaw of Shifting Priorities and Policies in a Developing Country. Environ. Hist. camb 27, 515–548. doi:10.3197/096734019X15740974883825
Rivarola, M. D., Simberloff, D., and Leppanen, C. (2021b). Nahuel Huapi National Park, Argentina: Conservation Effectiveness Assessment through Monitoring Small Mammal Communities. PARKS 27, 15–26. doi:10.2305/iucn.ch.2021.parks-27-2mdr.en
Rodríguez‐Catón, M., Villalba, R., Morales, M., and Srur, A. (2016). Influence of Droughts on Nothofagus Pumilio Forest Decline across Northern Patagonia, Argentina. Ecosphere 7, e01390. doi:10.1002/ecs2.1390
Rodríguez-Cabal, M. A., Barrios-Garcia, M. N., Amico, G. C., Aizen, M. A., and Sanders, N. J. (2013). Node-by-node Disassembly of a Mutualistic Interaction Web Driven by Species Introductions. Proc. Natl. Acad. Sci. U.S.A. 110, 16503–16507. doi:10.1073/pnas.1300131110
Rodríguez-Cabal, M. A., Nuñez, M. A., and Martínez, A. S. (2008). Quantity versus Quality: Endemism and Protected Areas in the Temperate Forest of South America. Austral Ecol. 33, 730–736. doi:10.1111/j.1442-9993.2008.01841.x
Rusch, V. (2002). Estado de Situacion de las Areas Protegidas de la porcion Argentina de la Ecoregion Valdiviana. Argentina: Fundacion Vida Silvestre ArgentinaWWF, 98.
Sala de Noticias (2022). Incendios en Bariloche: ya hay más de 6.000 hectáreas afectadas y esperan la ayuda de la lluvia. El Noticiero Digital. Available at: https://elnoticierodigital.com.ar.
Schlüler, R. G. (1994). San Carlos de Bariloche: Costos y beneficios del ecoturismo. Estud. Perspect. Tur. 3, 149–196.
Scott, J. M., Davis, F., Csuti, B., Noss, R., Butterfield, B., Groves, C., et al. (1993). Gap Analysis: A Geographic Approach to Protection of Biological Diversity. Wildl. Monogr., 3–41.
Simberloff, D., Relva, M. A., and Nuñez, M. (2002). Gringos en el bosque: introduced tree invasion in native Nothofagus/Austrocedrus forest. Biol. Invasions 4, 35–53. doi:10.1023/a:1020576408884
Soulé, M. E. (1987). History of the Society for Conservation Biology: How and Why We Got Here. Conserv. Biol. 1, 4–5. doi:10.1111/j.1523-1739.1987.tb00001.x
Southworth, J., Zhu, L., Bunting, E., Ryan, S. J., Herrero, H., Waylen, P. R., et al. (2016). Changes in Vegetation Persistence across Global Savanna Landscapes, 1982-2010. J. Land Use Sci. 11, 7–32. doi:10.1080/1747423X.2015.1071439
Svriz, M., Damascos, M. A., Zimmermann, H., and Hensen, I. (2013). The Exotic Shrub Rosa Rubiginosa as a Nurse Plant. Implications for the Restoration of Disturbed Temperate Forests in Patagonia, Argentina. For. Ecol. Manag. 289, 234–242. doi:10.1016/j.foreco.2012.09.037
Tecklin, D., Vila, A. R., and Palminteri, S. (2002). A Biodiversity Vision for the Valdivian Temperate Rain Forest Ecoregion of Chile and Argentina. Washington, D.C: WWF.
UNEP-WCMC and IUCN (2022). Protected Planet: The World Database on Protected Areas (WDPA) and World Database on Other Effective Area-Based Conservation Measures (WD-OECM). Cambridge, UK: UNEP-WCMC and IUCN.
UNEP-WCMC (2017). Protected Planet. Base de datos mundial sobre la efectividad del manejo de áreas protegidas Manual del usuario 1.0. Cambridge, UK: UNEP-WCMC. Available at: http://wcmc.io/GD-PAME_User_Manual_ES.
Veblen, T. T., Kitzberger, T., Raffaele, E., and Lorenz, D. C. (2003). “Fire History and Vegetation Changes in Northern Patagonia, Argentina,” in Fire and Climatic Change in Temperate Ecosystems of the Western Americas. Editor T. T. Veblenet al. (New York, NY: Springer New York), 265–295.
Wan, Z., Hook, S., and Hulley, G. (2015). NASA EOSDIS Land Processes DAAC.MOD11A1 MODIS/Terra Land Surface Temperature/Emissivity Daily L3 Global 1km SIN Grid V006 [Data Set]
Waylen, P., Southworth, J., Gibbes, C., and Tsai, H. (2014). Time Series Analysis of Land Cover Change: Developing Statistical Tools to Determine Significance of Land Cover Changes in Persistence Analyses. Remote Sens. 6, 4473–4497. doi:10.3390/rs6054473
Wiens, J., Sutter, R., Anderson, M., Blanchard, J., Barnett, A., Aguilar-Amuchastegui, N., et al. (2009). Selecting and Conserving Lands for Biodiversity: The Role of Remote Sensing. Remote Sens. Environ. 113, 1370–1381. doi:10.1016/j.rse.2008.06.020
Wilson, T., Stewart, C., Bickerton, H., Baxter, P., Outes, A. V., Villarosa, G., et al. (2013). Impacts of the June 2011 Puyehue-Cordón Caulle Volcanic Complex Eruption on Urban Infrastructure. Agric. public health 2012, 88. Institute of Geology and Nucelar Sciences; GNS Science.
Woodcock, C. E., Allen, R., Anderson, M., Belward, A., Bindschadler, R., Cohen, W., et al. (2008). Free Access to Landsat Imagery. Science 320, 1011. doi:10.1126/science.320.5879.1011a
Yengoh, G. T., Dent, D. L., Olsson, L., Tengberg, A. E., and Tucker, C. (2016). Future Trends, and Practical Considerations. ChamNew York: Springer International Publishing AG.Use of the Normalized Difference Vegetation Index (NDVI) to Assess Land Degradation at Multiple Scales: Current Status
Keywords: conservation, NDVI, protection categories, temperate forest, time series analysis
Citation: Rivarola MD, Dein J, Simberloff D and Herrero HV (2022) Assessing Protected Area Zoning Effectiveness With Remote Sensing Data: The Case of Nahuel Huapi National Park, Argentina. Front. Remote Sens. 3:901463. doi: 10.3389/frsen.2022.901463
Received: 22 March 2022; Accepted: 18 May 2022;
Published: 08 June 2022.
Edited by:
Gabriel Pereira, Universidade Federal de São João del-Rei, BrazilReviewed by:
Yosio Edemir Shimabukuro, National Institute of Space Research (INPE), BrazilCopyright © 2022 Rivarola, Dein, Simberloff and Herrero. This is an open-access article distributed under the terms of the Creative Commons Attribution License (CC BY). The use, distribution or reproduction in other forums is permitted, provided the original author(s) and the copyright owner(s) are credited and that the original publication in this journal is cited, in accordance with accepted academic practice. No use, distribution or reproduction is permitted which does not comply with these terms.
*Correspondence: María Daniela Rivarola, bXJpdmFyb2xAdm9scy51dGsuZWR1
Disclaimer: All claims expressed in this article are solely those of the authors and do not necessarily represent those of their affiliated organizations, or those of the publisher, the editors and the reviewers. Any product that may be evaluated in this article or claim that may be made by its manufacturer is not guaranteed or endorsed by the publisher.
Research integrity at Frontiers
Learn more about the work of our research integrity team to safeguard the quality of each article we publish.