 Hussain J. Nasiha
 Ziwei Wang
 Fernanda Giannini
 Maycira Costa
- 1Department of Geography, University of Victoria, Victoria, BC, Canada
- 2Institute of Oceanography, Federal University of Rio Grande, Rio Grande, Brazil
The validation of ocean color satellite retrievals generally relies on analyzing match-ups between in situ measurements and satellite retrievals. These analyses focus on the quality of the satellite data, however, of the same importance is the quality of the in situ data. Here, we present the spatial variability of in situ above-water reflectance (Rrs(0+)) within the spatial resolution of different ocean color satellites—300, 900, 1500, and 3000 m spatial resolutions, mimicking Sentinel 3 OLCI and MODIS-Aqua satellites, and possible 3 × 3 and 5 × 5 windows. Radiometric data was acquired with autonomous radiometric sensors installed in the British Columbia Ferry Services Inc. vessel “Queen of Alberni” from May to September 2019, crossing the optically dynamic waters of the Strait of Georgia, Canada. The dataset followed optimal geometry of acquisition and processing, including corrections for skylight radiance signals, ship superstructure, the non-isotropic distribution of the water-leaving radiances, and quality control. A total of 33,073 spectra at full resolution, corresponding to 10 days, were considered for the analysis presented here. The results showed that, overall, the subpixel variability increased as the spatial resolution of the sensor or the window size increased, mainly in a linear fashion. Specifically, spatial variability of Rrs(0+) was the largest (∼18% and 68% for 900 and 3000 m pixel resolution, respectively) in Near Field Plume Interface waters, followed by in the Ocean Water Interface (∼28% and 35%, respectively), thus indicating spatial heterogeneity of interface waters. Further, we found that the estuarine waters showed higher subpixel Rrs(0+) variability (∼8% and 16% for 900 and 3000 m, respectively) compared with plume and oceanic waters. We showed that the high spatial variability in Rrs(0+) was primarily associated with the spatial dynamics of the optical water constituents, thus limiting the use of these datasets as Fiducial Reference Measurements and for validation of satellite-derived atmospherically corrected reflectance. We suggest that spatial variability of the in situ Rrs(0+) should also be considered in the selection criteria for good match-up data, especially for data acquired in coastal dynamic systems. As a result, it will advocate for the exclusion of interface or transition water pixel grids in order to avoid compromising the statistical result of satellite validation.
1 Introduction
The coastal oceans are highly impacted by climate change stressors, including sea-level rise, warming oceans, ocean acidification, and human activities, leading to eutrophication in coastal regions (Haines et al., 2006; He and Silliman, 2019). In recent decades, the importance and requirement of coastal ocean monitoring systems have been well recognized for the understanding of coastal dynamics and management. Ocean color satellite observations have allowed unparalleled synoptic observations of the biogeochemical variability of the ocean, allowing for a better understanding of ocean dynamics and management (e.g., Boss et al., 2004; Boss et al., 2019; Woźniak and Stramski, 2004; Loisel et al., 2006; Platt et al., 2008; Moore et al., 2009; Dierssen and Randolph, 2013; Sathyendranath et al., 2017; Dutkiewicz et al., 2019). However, the effectiveness of the satellite-derived observations, especially for dynamic coastal waters, requires validation of the different retrievals, including atmospherically corrected reflectance values and reflectance-based biogeochemical variables, such as chlorophyll concentration (Chla) and total suspended matter (TSM) (e.g., Moore et al., 1999; Nechad et al., 2010; Blondeau-Patissier et al., 2014; Shanmugam et al., 2018; Nasiha et al., 2019; Balasubramanian et al., 2020; Giannini et al., 2021; Tilstone et al., 2021). Coastal and estuarine waters are optically more complex as a result of the additional influences of river discharge rich in terrestrial suspended particulates, re-suspended sediments, Colored Dissolved Organic Matter (CDOM), which vary independently of the phytoplankton assemblage (IOCCG, 2000; Davis et al., 2007; Mélin et al., 2007; Loos and Costa, 2010; Blondeau-Patissier et al., 2014; Loos et al., 2017; Phillips and Costa, 2017).
Given this optical complexity, validation is the process of determining the spatial and temporal error fields of a given biological or geophysical data product (Bailey and Werdell, 2006). The satellite match-ups are essential for proper vicarious calibration of sensors, atmospheric correction of top of atmosphere measured radiance or reflectance, and, consequently, accurate retrievals of biogeochemical products (Zibordi et al., 2015a; Zibordi et al., 2015b; Tilstone et al., 2021). In general, these analyses focus on the quality of satellite data; however, the quality of the in situ data is equally important (Tilstone et al., 2021). The quality of ocean color products depends on many factors influenced by various artifacts such as cloud shadows, terrestrial aerosols, exceptional plankton blooms, shallow water with bottom reflection (IOCCG, 2019). Similarly, in situ measurements may have inherent uncertainties including spatial variability, temporal mismatch of satellite overpass, the impact of waves (Zaneveld et al., 2001; Zibordi et al., 2004; D’Alimonte et al., 2013), sensor tilt and self-shading (Gordon and Ding, 1992; Zibordi and Ferrari, 1995; Shang et al., 2017), ship perturbations due to a deployment superstructure (Doyle and Zibordi, 2002; Wang and Costa, 2018; Wang and Costa, 2022), and data processing considering bidirectional effects [Bidirectional Reflectance Distribution Function (BRDF)] of radiometric quantities as a function of illumination and viewing geometries, among others (Park and Ruddick, 2005; Lee et al., 2011; Wang and Costa, 2022).
In situ Rrs(0+) measurements are estimated from radiometric parameters such as downwelling irradiance (Ed), sky radiance (Li), and upward radiance (Lt) and followed by wind correction (Mobley, 1999). For Rrs(0+) data satellite match-up analysis, Ed, Li, and Lt measurements from in situ point stations, located approximately at the centre of the satellite image pixel, are used for validation. The lower temporal and spatial resolution of the imagery acquisition may lead to mismatches between in situ and satellite measured data, especially in coastal waters with riverine inputs where spatial heterogeneity may happen at fine spatial scales (Moses et al., 2016). The uncertainty sources linked to in situ measurements are associated with the spatial representativeness of the in situ observation within the spatial resolution of the imagery (Mélin and Franz, 2014; Pahlevan et al., 2016). For coastal waters, the spatial scales of the variability of the in situ measurements and the variability within the pixel resolution (or average window used) of the satellite imagery have to be considered (Mahadevan and Campbell, 2002; Moses et al., 2016; Barnes et al., 2019).
This paper aims at addressing the Rrs(0+) spatial variability of coastal waters within the spatial resolution of different ocean color satellites. Here we evaluate an in situ Rrs(0+) data set (N = 33073) acquired with an autonomous set of radiometers (Satlantic Inc./Sea-Bird–Solar Tracker, SAS–ST) in the Strait of Georgia (SoG) waters, Canada, at 300, 900, 1500, and 3000 m spatial resolutions, mimicking Sentinel 3 OLCI and MODIS—Aqua satellites, and possible 3 × 3 and 5 × 5 windows. We look at 1) the spatial variability of in situ Rrs(0+) within transitional water boundaries and 2) the spatial variability of Rrs(0+) of different water masses in SoG. Estimates of spatial variability in transitional boundaries and water masses provide quantitative guidance for defining the criterion for using in situ Rrs(0+) for satellite data match-up analysis in ocean color research. Our premise is that highly varying optical constituents at transitional boundaries between river plume, salt wedge estuary, and oceanic waters lead to larger spatial variability of in situ Rrs(0+), contributing significantly to the differences observed between satellite and field data. This may have significant consequences on uncertainties of satellite match-up analysis, which is used to validate atmospheric corrected Rrs(0+) and vicarious calibration. Quantifying the uncertainty contributions from spatial variability of coastal water heterogeneity will assist in increasing the quality of data used for satellite validation purposes.
2 Methods
2.1 Study Area
The Strait of Georgia (SoG) is a constituent part of the Salish Sea, between Vancouver Island and the extreme southwestern mainland coast of British Columbia, Canada (Figure 1). It is a narrow passage, measuring 222 km long and 28 km wide on average, in the north-eastern Pacific Ocean (Harrison et al., 1983; Masson and Peña, 2009). The average depth is 155 m, whereas the maximum depth is approximately 420 m. The Fraser River is the primary freshwater input to the central basin of the Strait, with a maximum discharge in June exceeding 11,000 m3/s (Thomson, 1981), and the peak discharge period being from June to July (Pawlowicz et al., 2017). Snow-melt constitutes about two-thirds of the total runoff, with heavy terrestrial input, which leads to density stratification in the basin region (Johannessen et al., 2006; Loos and Costa, 2010; Halverson and Pawlowicz, 2011). The river runoff creates an estuarine water circulation with strong salinity entrainment in the region that produces a net transport of salt from the saline ocean water to the overlying brackish layer. The horizontal salinity distribution varies greatly depending on the season and distance from the mouth of the Fraser River (Halverson and Pawlowicz, 2011). The general outflows to the Pacific happen through the Juan de Fuca Strait in the south and the Johnstone Strait in the north (Figure 1).
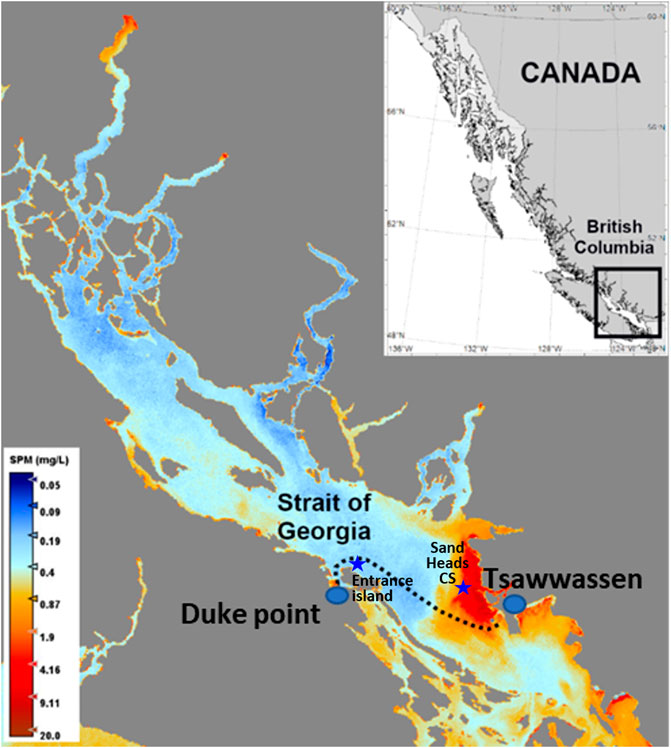
FIGURE 1. Study area map of the Strait of Georgia plotted from Sentinel-3a, 8-day average of 6–13 April 2020, showing Suspended Particulate Matter (SPM) distribution in the strait. The dotted line shows the cruise transact of the Queen of Alberni between Duke Point (Vancouver Island) and Tsawwassen (Vancouver). Location of meteorological stations: Entrance Island and Sands Head CS are indicated.
The seasonality and spatial dynamics of the SoG waters are largely influenced by the Fraser River discharge and ocean productivity. Generally, the region has a mean primary productivity of about 280 ± 20 g C m−2 yr−1 (Harrison et al., 1983; Sutton et al., 2013; Johannessen et al., 2021). In the frontal areas of the Fraser River plume, the productivity is still higher due to the reloaded nutrients supplied by the river, and high chlorophyll concentrations have been reported in the waters closer to the Fraser River discharge (Loos and Costa, 2010; Phillips and Costa, 2017). Seasonally, these waters show chlorophyll-a concentrations typically ranging from <1.0 mg m−3 in the winter to >15.0 mg m−3 during spring/summer and fall blooms (Suchy et al., 2019; Esenkulova et al., 2021).
Optically, the SoG waters are also seasonally highly dynamic as a result of the ocean productivity and high loads of fine inorganic particles and dissolved organic matter discharged into the Strait (Johannessen et al., 2006; Loos and Costa, 2010; Phillips and Costa, 2017). The biogeochemistry of the riverine waters with increasing turbidity levels results in wavelength dependent high scattering in the visible wavelengths (Loos and Costa, 2010; Phillips and Costa, 2017) and, consequently, high reflectance in the longer wavelengths from 550 to 700 nm (Komick et al., 2009; Wu et al., 2014; Carswell et al., 2017; Phillips and Costa, 2017; Giannini et al., 2021). The estuarine circulation causes the mixing of the riverine and oceanic waters, resulting in more optically variable waters with spectrally dependent scattering and absorption (Loos and Costa, 2010; Phillips and Costa, 2017). As a result, relative lower reflectance in the longer 550–700 nm wavelengths is observed due to dominant light absorption. The ocean water exhibits a seasonal dominance of light absorption caused by CDOM and phytoplankton, resulting in the lowest overall reflectance signal relative to riverine and estuarine waters (Carswell et al., 2017; Phillips and Costa, 2017; Giannini et al., 2021).
The cruise transect (Figure 1) includes oceanic water from the Strait of Georgia and estuarine and plume waters resulting from the Fraser River discharge (Halverson and Pawlowicz, 2011; Loos et al., 2017; Pawlowicz et al., 2017; Travers-Smith et al., 2021). The Fraser River discharge into the Strait forms a seaward extent of freshwater plume mass, bounded by a zone of strong flow convergence resulting in a salinity front. Hence, it develops a brackish surface layer (termed as estuarine waters in this study) between the freshwater plume region and oceanic waters of SoG (Stronach 1977; Thomson 1981; McCabe et al., 2008; Halverson and Pawlowicz, 2011). The estuarine water spread consists of a near-field plume interface (NFPI) and an oceanic water interface (OWI). Entrainment begins at NFPI, leading to significant variability in salinity. The mixing occurs until the oceanic water interface, where salinity variability is lesser than NFPI, in general. These two interfaces explain the transitional water boundaries (Poggioli and Horner-Devine, 2018; Ward et al., 2020). These transitional waters are characterized by highly dynamic bio-physical and hydro-morphologic conditions, resulting in high sub-pixel variability of in situ Rrs(0+).
2.2 Data Acquisition and Processing
Radiometric data used for this study was acquired from shipborne autonomous radiometric sensors aboard the British Columbia Ferry Services Inc. vessel “Queen of Alberni” from May to September 2019. The data collection was part of the research program “Ferry Ocean Color Observation Systems” (FOCOS). The ship sails at a speed of about 10 m/s from Duke Point (Nanaimo) to Tsawwassen (Vancouver), over a transact length of 45 km (Figure 1). A set of three hyperspectral radiometers (SAS-ST) were installed on the BC ferry on a customized platform designed by Ocean Networks Canada (ONC). The SAS-ST was installed at 14 m above the water surface on the ferry platform (Figure 2). The hyperspectral radiometers collect data in the wavelength range of 350–798 nm, whereas the data analysis is presented in the optical range of 400–700 nm. The spectral resolution and spectral sampling interval are 1 nm. The above-water measurements include total upwelling sea surface radiance (Lt(λ)), sky radiance (Li(λ)), and downwelling irradiance (Ed(λ)). Considering the speed of the ferry and the frequency of data acquisition for the sensors, we estimated individual measurements at a spatial resolution of 13 m. The sensors were factory calibrated by the manufacturers (Seabird/Satlantic, Inc.) before deployment, and bi-weekly cleaning of the lenses was conducted.
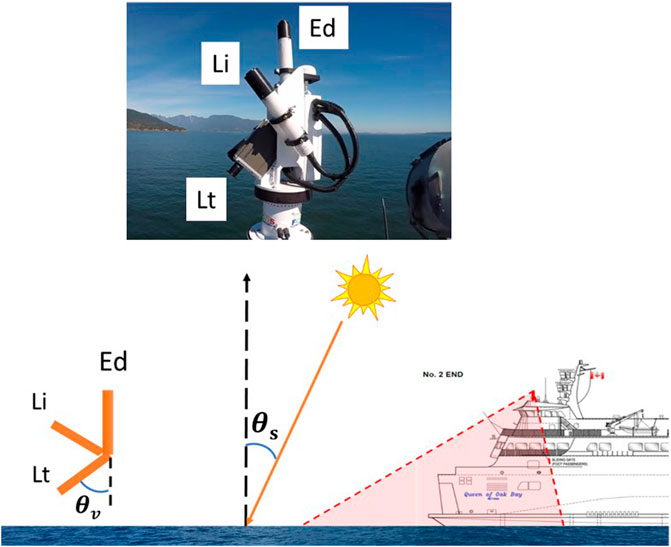
FIGURE 2. The autonomous radiometer SAS-Solar Tracker is installed on the deck of the ferry, Queen of Alberni. Downwelling irradiance (Ed), sky radiance (Li) and total radiance (Lt) radiometric sensors are shown. θv = 50° is the sensor viewing zenith angle and θs = 30° is the low sun elevation angle (data acquisition occurs only above θs value).
As per the recommendations from Mobley (1999), the Li(λ) sensor was aligned away from the sun to avoid direct sunglint. The inbuilt motor base of SAS-ST enables the sensor unit to keep at a viewing-sun azimuth, φv, of 120 ± 5° following Hooker and Morel (2003). The Lt(λ) was kept at a viewing angle of 45° (Satlantic, 2016). For the autonomous data collection, we fixed the geometry and acquisition angles based on the ferry’s sailing speed and direction (the ferry sails East), the ship heading, the ship structure and shadowing, and the time of day (Giannini et al., 2021).
The radiometric data was measured, stored on an onboard computer, and transferred to the Oceans Networks Canada server during each ferry sailing. Hence, the near real-time radiometric data collected by SAS-ST can be downloaded from ONC’s Oceans 2.0 portal (https://data.oceannetworks.ca/DataSearch) with the data collection date and time. The PySciDON (Python Scientific Framework for Development of Ocean Network applications; Satlantic, 2010; Vandenberg et al., 2017) framework was used to process the data, including specific calibration files associated with the raw data and flags, such as meteorological (cloudy/rainy conditions), sensor rotator angle, and Sun azimuth angle.
The remote sensing reflectance
where
The framework also addresses ship superstructure influence on Rrs(0+) calculation. The ship’s superstructure (ship wall) influences the above-water radiometry by introducing signal to the radiance field measured by the sea viewing sensor (Lt). The adopted methods for ship superstructure signal contribution to Rrs(0+) are fully explained in Giannini et al. (2021) and Wang and Costa (2022), following methods by Hooker and Morel (2003). After the calibration, application of flags and correction factors, the data is binned considering either time or latitude/longitude resolutions.
2.2.1 Ferrybox Data
The salinity, turbidity, chlorophyll and CDOM datasets used in this study were measured in situ by the “Ferrybox” system, which was installed and maintained by Ocean Networks Canada (ONC) (Travers-Smith et al., 2021; Owens et al., 2022). Salinity (PSU) was measured with a SeaBird SBE45 thermosalinograph, Chl-a concentration (mg m−3) with a WET Labs ECO Triplet fluorometer, and CDOM fluorescence (ppb) and turbidity (NTU) were acquired with a WETLabs ECO Triplet BBFL2 sensor. The Ferrybox system is located below the main deck, 10 m from the bow, and the sampling depth was approximately 2 m (Halverson and Pawlowicz, 2011; Wang and Costa, 2022).
The Ferrybox data, including turbidity, chlorophyll, CDOM, and salinity, were implemented with ONC’s comprehensive process-oriented quality assurance (QA) and product-oriented data quality control (QC) models (Owens et al., 2022). After the pre-deployment testing of oceanographic instruments, automated quality testing was carried out, including QA/QC-related checks, in real-time or delayed, performed via automated quality control procedures while the instrument was deployed. QC of turbidity, chlorophyll and CDOM data includes automatic delayed-mode testing and manual review. The QA/QC test model supports spike detection and gradient steepness tests. For the specific data considered in this study, chlorophyll, CDOM, and salinity datasets were processed with QC flags 1, or 2, representing “data passed all QC tests” and “data probably good,” respectively. Among different QC flags, turbidity data is listed with flag 8, which stands for interpolated values, whereas interpolated data exclusively uses clean data (all values have QC flag 1).
Surface current velocity data used in this study were also acquired by ONC using CODAR systems installed at location the Westshore Coal Terminal station (VCOL), Georgina Point(VGPT), Iona (VION), Point Atkinson (VATK).
2.3 Data Quality Control
After data acquisition and processing, the entire 2019 dataset was evaluated for quality. The total continuous deployment days of SAS-ST installed on the Queen of Alberni ferry was 116, from May to September 2019. The ferry runs from Duke Point to Tsawwassen daily at local time, 7.45 a.m.–9.45 a.m.; 12.45 p.m.–2.45 p.m.; and 5.45 p.m.–7.45 p.m. The evening trip data collection was excluded from further analysis due to the low sun elevation angle (<30°), and the morning and noon trip data were further evaluated based on the Ed and Lt data.
Figure 3 shows the Rrs(0+) for the morning and noon trips on June 16, 2019, as an example along with the data acquisition geometry of the SAS-ST sensor. As shown in Figure 3C for the noon trip data on June 16, 2019 for a specific data point, the rotator angle is at +30°, keeping the sensor plane at 120° from the sun azimuth, whereas the ship’s heading is East at 303.5° (Figure 3C). This geometry allows for excellent data quality (Figure 3A). For the morning trip (Figure 3D), the rotator plane is at −10° from home orientation, an extreme angle to keep the sensor at 120° azimuth from the Sun. Since the sensor plane could not go beyond the pre-defined backward limit (−10°), the derived Rrs(0+) data was erroneous, as shown in Figure 3B, likely measuring the ship structure. Beyond the issues related to the acquisition geometry, the morning trips also exhibited issues with low irradiance and radiance signals (Figure 4). The lower downwelling irradiance (<92 Wm−2 nm−1 at 480 nm) (Figure 4B) and Lt (<18000 Wm−2 nm−1 Sr−1) (Figure 4D) in the morning data collection due to the lower sun elevation angle (<30°) led to erroneous estimations in the derived Rrs(0+) compared to the noon trip (Figures 4A,C). Given the lower irradiance and radiance signal combined with the less optimal acquisition geometry, data acquired on the morning trips was filtered out, with only noon trip data from ∼12.30 p.m. to 2.30 p.m. being adequate for further analysis.
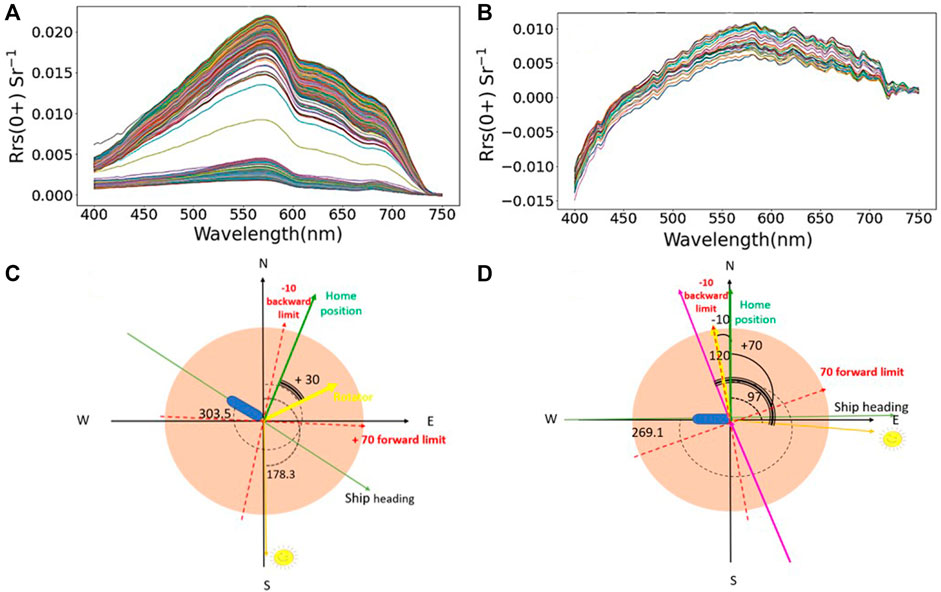
FIGURE 3. Rrs(0+) data quality assurance (QA) analysis results for the data measured by SAS-ST installed on ferry Queen of Alberni on 16 June 2019. Plot showing Rrs(0+) data for (A) noon trip; (B) morning trip data collection, and corresponding geometry with angle of acquisition for, (C) noon trip and (D) morning trip.
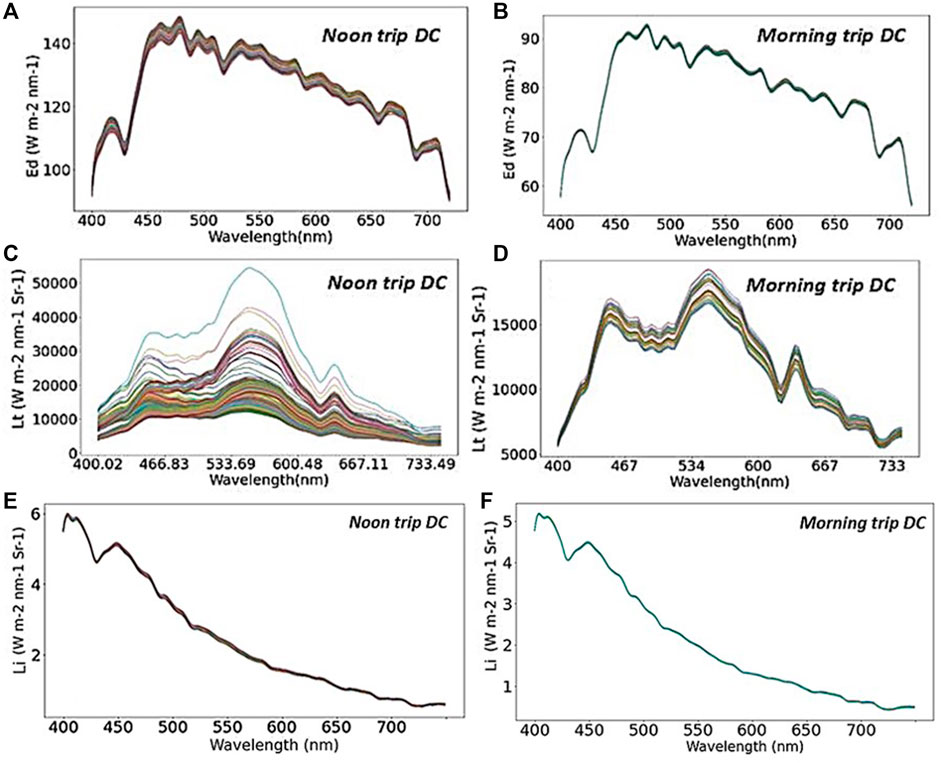
FIGURE 4. Comparison of radiometric quantities—downwelling irradiance (Ed) (A,B), total sea surface radiance (Lt) (C,D), sky radiance (Li) (E,F) for morning trip and noon trip data collection by SAS-ST installed on the ferry Queen of Alberni on 16 June 2019.
We selected only days with clear sky conditions for the data acquired during the noon trips. The data set was processed in PySciDON (Section 2.2), and the correction factors were defined as follows:
1) ρs factor to address skylight radiance signal contributions to the above water signal (Mobley, 1999). ρs factors for the selected days ranged between 0.0361 and 0.0636, corresponding to a range of wind speed 4–13 m s−1, derived from Canadian government meteorological stations: longitude from −123.80° to −123.63° used wind speed from Entrance Island (Environment and Climate Change Canada 2021a), while −123.63° to −123.25° used wind speed values from Sands Head Island (Environment and Climate Change Canada 2021b).
2) The ship’s superstructure signal contribution to Rrs(0+) was defined according to Wang and Costa (2018) and Giannini et al. (2021), following methods by Hooker and Morel (2003). The ship superstructure correction factor for the Queen of Alberni ferry was 0.00005 (Giannini et al., 2021).
After all the required corrections, the selected data was checked for the tilt angles due to the ferry’s stability. The standard deviation in the tilt of the ferry was ±4°, indicating high-quality data. The low tilt angles (pitch and roll) are due to the stable platform, influenced by the large size of the ferry and environmental conditions of the SoG. The final dataset was subjected to BRDF correction to minimize the non-isotropic distribution of the water-leaving radiances in optically complex waters. This followed methods by Lee et al. (2011) and Talone et al. (2018) and was implemented with Python code by Wang and Costa (2022).
2.4 Spatial Analysis of Rrs(0+) at Different Spatial Grid Sizes
After data reduction for quality control and deriving Rrs(0+), the spatial variability of Rrs(0+) was evaluated considering the subpixel variability within the pixel resolution of two ocean color satellites, Sentinel 3 OLCI and MODIS Aqua, and commonly used pixel boxes for match-up validation analysis (Mahadevan and Campbell, 2002; Werdell et al., 2007; Barnes et al., 2019; Giannini et al., 2021). A pixel box is generally defined to account for the spatial variability of the biogeochemical information and because the satellite sensor navigation may not be accurate to the pixel (Patt, 2002). As part of a match-up analysis, the median or average (with additional statistical rules, including thresholds for the coefficient of variance) of satellite-derived Rrs(0+) (or biogeochemical retrieval) within a pixel box is calculated and evaluated against a co-located in situ measurement of Rrs(0+) (or in situ biogeochemical concentration) (e.g., Patt, 2002; Mahadevan and Campbell, 2002; Werdell et al., 2007; Moses et al., 2016; Giannini et al., 2021). As recently highlighted by Barnes et al. (2019), the uncertainties associated with the in situ data should be considered in the validation approach. Here, we use in situ Rrs(0+) continuously measured every 2 s from a ferry at a speed of approximately 10 m/s to define the Rrs(0+) variability within the pixel grid resolution (PGR) of 300 m (pixel resolution of Sentinel 3 OLCI), 900 m (3 × 3 PGR and similar to MODIS Aqua), 1500 m (5 × 5 PGR), and 3000 m (3 × 3 PGR, commonly used for MODIS Aqua).
The radiometric SAS-ST data was used at full resolution without binning during data processing. The cruise track of ∼45 km was segmented into various PGRs based on the distance between geocoordinates. Every PGR consists of a number of spectra with respect to the pixel window size. For instance, the number of spectra yielded into each PGR was on average as follows: PGR 300, 900, 1500, and 3000 m yielded 15, 44, 73, and 140 individual spectra, respectively. For these PGRs, and considering the length of the ferry run, the total number of pixel windows was approximately 1605, 536, 321, and 161, respectively. For the simulation of PGR, we considered a fixed-width grid size, estimated from the distance between the geographical coordinates of the ferry transact using the cosine-haversine formula (Robusto, 1957). Note that the number of pixel windows for the PGR slightly varies due to the occasional inappropriate viewing geometry of the sensor. For example, on 2 September 2019, we found that no data were recorded for the location between 49.216°; −123.81° to 49.216°; −123.808 due to issues related to the rotator angle of the sensor plane. Given these occasional issues, we excluded the pixel windows with less than 75% of the average number of spectra corresponding to the pixel grid.
After defining the PGRs and individual spectrum associated with each pixel window, the average and coefficient of variance of Rrs(0+) for each pixel window were calculated. The coefficient of variation within a PGR (CVΔ) was calculated as follows:
where
This study specifically analyzed the Rrs(0+) variability associated with transitional water boundaries between the Fraser River plume and estuarine waters and estuarine and oceanic waters. We further extended the analysis to define the spatial variability for different water masses: plume, estuarine, and oceanic, to account for its contribution to the uncertainties associated with in situ Rrs(0+) measurements.
2.5 Classification of Water Types in SoG
We classified the water masses along the cruise transect into three types: oceanic, estuarine, and plume waters, following a regional salinity-based criterion (Halverson and Pawlowicz, 2011; Travers-Smith et al., 2021), as follows:
Here SRef is the mean salinity calculated for every transect in the region influenced mainly by oceanic waters (Travers-Smith et al., 2021), this corresponds to a transect length of 5 km near Vancouver Island. The estimated Sthresh for oceanic waters was defined as above 25 psu, and waters with salinity lower than Sthresh were classified as under riverine influence. The riverine waters (Sthresh < 25 psu) were further classified into estuarine waters with higher entrainment and mixing (15–24.9 psu), and plume waters (<15 psu).
3 Results and Discussion
This study demonstrates the spatial variability of in situ Rrs(0+) in dynamic coastal waters, an important issue to be addressed for match-up analysis aiming to validate, for instance, atmospheric correction of satellite-derived Rrs(0+) (e.g., Mahadevan and Campbell, 2002; Bissett et al., 2004; Mahadevan 2004; Bailey and Werdell, 2006; Werdell et al., 2007; Aurin et al., 2013; Brando et al., 2016; Carswell et al., 2017; Barnes et al., 2019; Cazzaniga et al., 2021; Giannini et al., 2021; Tilstone et al., 2021; Zibordi et al., 2021). The analysis is based on a dataset of Rrs(0+) acquired aboard the BC ferry, Queen of Alberni, in 2019, in clear sky conditions and with optimal geometry of acquisition and processing protocols (Wang and Costa, 2018; Giannini et al., 2021; Wang and Costa, 2022). The results are presented in two sections: (1) Rrs(0+) variability along the cruise transect considering transitional waters; and (2) Rrs(0+) variability for different water masses: oceanic, estuarine, and plume waters.
3.1 Rrs(0+) Variability Along the Cruise Transect: Transitional Waters
To illustrate the significant Rrs(0+) variability of the transitional waters (NFPI and OWI), we show the variability of Rrs(0+), associated with salinity and biogeochemical variables for 2 days, 2 September and 22 August 2019, but omitted the analysis for the other 8 days of the dataset since the results were very similar. For these 2 days, Figures 5, 6 show Rrs(0+) spatial variability measured on an entire ferry run between Vancouver Island (Duke Point) and the Vancouver mainland (Tsawwassen) at Band 3, Band 5 and Band 6 of Sentinel OLCI. The central wavelength of Sentinel OLCI sensor bands 3, 5, and 6 is 442.5, 510, and 560 nm, respectively. For 2 September 2019 (Figure 5), in general, as PGR increased, so did the Rrs(0+) within pixel variability, expressed as CVΔ, with the larger variability ranging from about 30% to 70% for 300–3000 m, respectively. Specifically, at 300 m PGR, the mean subpixel variability was about 3.58%, 3.29%, 3.52% (Band 3 (442.5 nm), Band 5 (510 nm) and Band 6 (560 nm) of Sentinel 3–OLCI), except for a few pixel grids. The exceptional large variability was observed for higher PGR in similar pixel locations (∼49.066; −123.422 and 49.1692, −123.598); the salinity data revealed the NFPI and OWI waters at these locations, respectively (Figure 5B).
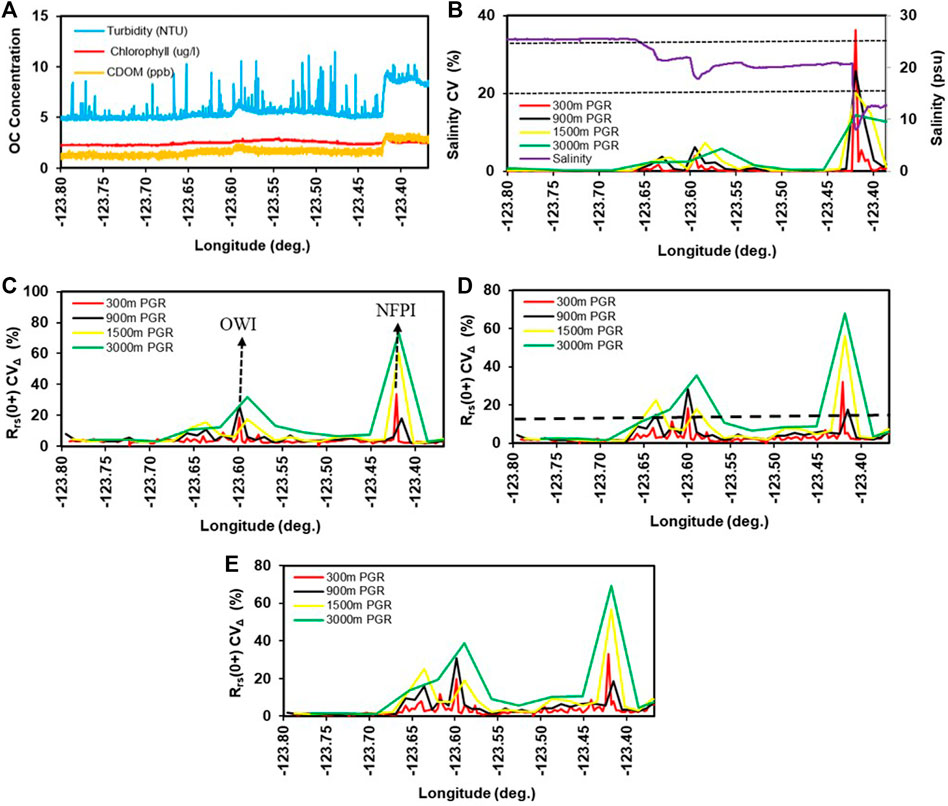
FIGURE 5. Spatial variability analysis plot for the SoG waters along cruise transact on 2 September 2019. (A) Optical component (OC) concentration–turbidity, chlorophyll and CDOM; (B) corresponding salinity variability and salinity (psu). Salinity thresholds at 25 psu and 15 psu were indicated with dotted lines; Rrs(0+) coefficient of variability [Rrs(0+) CVΔ (%)] at different PGR 300, 900, 1500, 3000 m for, (C) Band 3 (442.5 nm), (D) Band 5 (510 nm) and Band 6 (560 nm) (E) of Sentinel 3a, OLCI sensor. Rrs(0+) CVΔ threshold value, 15% is indicated in the subplot (D) as a dotted line.
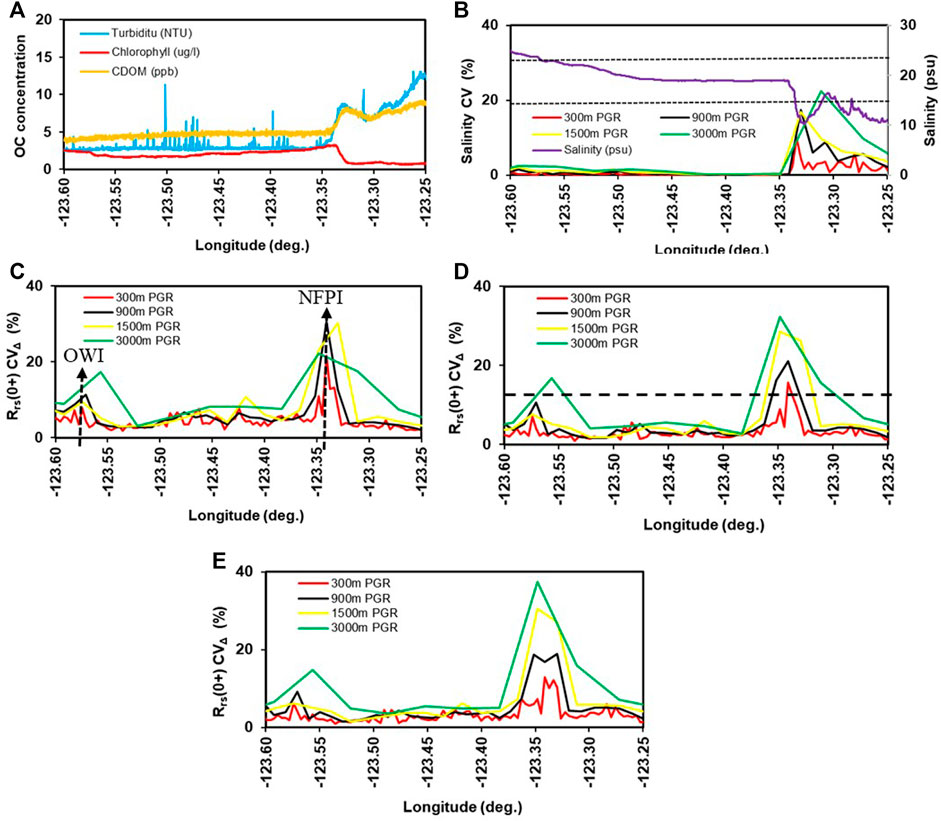
FIGURE 6. Spatial variability analysis plot for the SoG waters along a cruise transaction on 22 August 2019. (A) Optical component (OC) concentration–turbidity, chlorophyll and CDOM; (B) corresponding salinity variability and salinity (psu). Salinity thresholds at 25 and 15 psu were indicated with dotted lines; Rrs(0+) coefficient of variability [Rrs(0+) CVΔ (%)] at different PGR 300, 900, 1500, 3000 m for, (C) Band 3 (442.5 nm), (D) Band 5 (510 nm) and Band 6 (560 nm) (E) of Sentinel 3a, OLCI sensor. Rrs(0+) CVΔ Rrs(0+) CVΔ threshold value, 15% is indicated in the subplot (D) as a dotted line.
For NFPI, at 300 m PGR, the salinity variability was 36%, and for higher PGRs, the salinity variability was estimated as 26% (for 900 m), 20% (for 1500 m), and 14% (for 3000 m) (Figure 5B). This large variability in salinity values in NFPI waters indicates the presence of different water masses within the PGR, that is, high spatial heterogeneity, resulting in the highest Rrs(0+) CVΔ (Bands 5) for each PGR, 33%, 18%, 56%, and 68%, for 300, 900, 1500, and 3000 m, respectively. For other locations along the track with lower CVΔ, the subpixel salinity variability was comparatively lower than 1%. For OWI, the salinity variability is comparatively lower than that at NFPI, but still considerable. For different PGR, salinity variability in OWI pixel was estimated as 4% (for 300 m), 6% (for 900 m), 7% (for 1500 m), and 6% (for 3000 m). At 300 m PGR, the variability in Rrs(0+) for OWI PGR was estimated as 20% (for Bands 3, 5, and 6), that is, slightly lower than the CVΔ for the NFPI waters; for 900, 1500, and 3000 m, Rrs(0+) varied by about 28%, 18%, and 35%, respectively.
In these transitional waters, the Rrs(0+) variability results from the high spatial variability of the optical water constituents, which increases as PGR increases. Chla, turbidity, and CDOM exhibited greater variability than non-transitional waters (Figure 5A).
For instance, for the NFPI, turbidity, CDOM, and Chla varied from 5.15 to 8.83 NTU, 1.34–3.35 ppb, 2.47–2.98 µg L−1, respectively, and for OWI, 5.21–6.08 NTU, 1.45–2.23 ppb, and 2.49–2.72 µg L−1, respectively. The range of variability was more pronounced for turbidity and CDOM at NFPI; this was expected due to the entrainment of the plume and oceanic waters, which have different optical properties (Loos and Costa, 2010; Phillips and Costa, 2017: Doxaran et al., (2016)). For non-transitional waters, the mean values of turbidity, CDOM, and Chla were 5.13 NTU, 1.41 ppb, and 2.28 µg L−1, with much lower variability (∼7.4%, 11.0 %, and 4.8% for turbidity, CDOM, and Chla, respectively). According to the CODAR data, a high surface current velocity of 80 cm s−1 was observed at the NFPI site on 2 September 2019.
Similar transitional waters and associated variability were identified on August22, 2019 (Figure 6); however, their locations varied due to tide, current, and river discharge conditions. NFPI was identified at the pixel centered at coordinates 49.039° and −123.341° with a salinity variability of about 11%, corresponding to a subpixel variability in Rrs(0+) of approximately 27% (Band 3—442.5 nm), 16% (Band 5—510 nm), and 32% (Band 6—560 nm) for 300 m resolution. For other locations along the track with lower Rrs(0+) CVΔ, the subpixel salinity variability was generally <1%, whereas the subpixel salinity variability of the NFPI was as high as 18% (for 900 m PGR), 17% (for 1500 m PGR), and 22% (for 3000 m PGR), associated with Rrs(0+) variability of 21%, 29%, and 32%, respectively, at Band 5. For these waters, similar to the NFPI for 2 September, the optical constituent concentrations showed large ranges; turbidity ranged from 3.23 to 8.30 NTU, CDOM from 5.02 to 7.71 ppb, Chla from 2.82 to 0.852 µg L−1. For the OWI waters, centered at coordinates 49.142° and −123.589°, the lower turbidity (Figure 6A) indicated an oceanic dominated water mass, which generally shows lower spatial Rrs(0+) variability (see next section). At 300 m PGR, the salinity variability was lower than 1% and associated with a lower Rrs(0+) variability of 4%. Still, for this day, relatively higher Rrs(0+) variability was observed for larger-scale resolutions; for 900, 1500, and 3000 m pixel grid resolution, the subpixel variability was 8%, 11%, and 17%, respectively, for Band 5 (Figure 6D). Non-transitional waters generally showed similar Rrs(0+) variability as OWI, which was associated with lower variability of optical water constituents for each water mass. For example, oceanic waters showed mean values of turbidity, CDOM, and Chla of 2.71 NTU, 4.46 ppb, and 1.75 µg L−1, respectively, whereas non-transitional waters showed values of 2.82 NTU, 4.69 ppb, and 2.07 µg L−1, respectively. The mean surface current velocity at the NFPI site (49.039° and −123.341°) on August 22, 2019 was 50 cm s−1, which is higher than current velocities corresponding to other waters of the measurement transact.
In summary, specifically for the Salish Sea but similar to many coastal waters worldwide, the NFPI generally exhibited larger Rrs(0+) variability than OWI. At 900 m (commonly used as a 3 × 3 window for validations of OLCI; Zibordi et al., 2018; Mograne et al., 2019; Kyryliuk and Kratzer, 2019; Giannini et al., 2021) and 3000 m GPR (commonly used as a 3 × 3 window for validations of MODIS-Aqua; Bailey and Werdell, 2006; Carswell et al., 2017; Hilborn and Costa, 2018), the variability associated with the in situ Rrs(0+) for NFPI can be higher than 30%. This higher Rrs(0+) variability is especially true for the longer wavelengths, illustrated here as Band 6 (of Sentinel 3–OLCI–560 nm), which tends to show relatively higher differences between in situ and satellite-derived Rrs(0+) when compared with longer visible wavelengths (e.g., Barnes et al., 2019; Tilstone et al., 2021; Zibordi et al., 2021; Giannini et al., 2021).
We suggest that the spatial variability of the in situ Rrs should also be considered in the selection criteria for good match-up data, especially for data acquired in coastal waters. The spatial variability of in situ data within the pixel of the satellite image is not considered in the present protocols because the data is limited to the pixel size of the satellite (e.g., 300 m × 300 m, 1000 m × 1000 m). Within these areas, we show a large variability of Rrs, especially in the transitional and estuarine waters.
In this study, the defined threshold of the coefficient of variance in situ Rrs(0+) is 15%, which is within the range suggested in the literature. Generally, the CV threshold values are defined for the pixel box considering the variability of satellite products within the pixel grid box size centered on the location of the in situ measurement, the time difference between in situ and satellite overpass, and the fraction of valid retrievals from the satellite pixel grid box. Mélin and Franz (2014) defined a satellite-derived Rrs CV threshold in the range of 15%–20%, which is further recommended by IOCCG (2019). In principle, CV thresholds should be considered for both satellite pixel data and in situ data for an improved satellite validation process. For instance, Bailey and Werdell (2006) have defined a Lwn(λ) CV threshold of 15% for a 5 × 5 pixel grid box of Sea-Viewing Wide Field-of View Sensor (SeaWiFS) imagery and a CV threshold of 5% for the in situ Lwn(λ). Similarly, Zibordi et al. (2009), defined a Lwn(λ) CV threshold of 20% for a 3 × 3 pixel grid box of satellite imagery data and, using temporal in situ Lwn(λ) data from the AERONET-OC site (Acqua Alta Oceanographic Tower - AAOT), the authors defined a CV threshold between 5% and 8% for Lwn(λ) measurements. The examples above define the CV thresholds for in situ measurement based only on the temporal variability of these measurements, and do not consider the spatial variability.
In general, the spatial variability of geophysical products is effectively considered for spaceborne remote sensors, whereas the CV of the pixel box is evaluated (Bailey and Werdell, 2006; Zibordi et al., 2009; IOCCG, 2019), while in the case of in situ measurements, the spatial variability is not adequately characterized. This is a result of often insufficient spatially continuous Rrs in situ data in relation to the spatial resolution or pixel box of the satellite imagery. This study specifically evaluated the uncertainties associated with the spatial variability of above-water in situ Rrs in a dynamic coastal region. The adopted CV threshold value of 15% is in-line with the values suggested in the literature for uncertainties associated with temporal variability of in situ data (Zibordi et al., 2009) and satellite pixel (or pixel box) data (Bailey and Werdell, 2006). This present study is based on high spatial resolution data, which allowed us to analyze the in situ spatial variabilities of reflectance measurements. Hence, this study recommendation will allow for enhanced quality of satellite validation procedures. We recommend the consideration of the spatial variability of in situ Rrs(0+) measurements and excluding the measurements where the spatial variability, represented by the CV, is greater than 15% within the scale distance of the pixel grid considered for the satellite validation match up analysis.
The inclusion of in situ Rrs(0+) for these interface waters may lead to high uncertainties for satellite validation statistics. For example, Giannini et al. (2021) highlighted issues related to the quality of Rrs(0+) match-ups (in situ vs. Sentinel-3 OLCI) due to the movement of water masses in this dynamic coastal system. Therefore, for dynamic coastal regions, especially under the influence of river discharge, it is recommended to consider, if available, the spatial variability of salinity as a guideline to define the acceptance of in situ Rrs(0+) as a match-up.
Given the difficulties in acquiring continuous Rrs in situ data, we also recommend using the salinity threshold of >5% to identify the water masses with potentially significant variability in Rrs(0+), which are generally observed in transitional or interface water regions. As expected, we observed that the greater salinity variability in the transitional or interface waters is proportionate to the greater variability in reflectance of the same water mass. Hence, the salinity threshold can be used as a proxy to identify the recommended CV threshold value for Rrs(0+) in constructing the matchup data set.
Salinity data is readily available for our sampling strategy because it is collected continuously with the Ferrybox system (Travers-Smith et al., 2021). This is likely the situation with many research cruise ships (e.g., Koponen et al., 2007; Slade et al., 2010; Westberry et al., 2010; Tilstone et al., 2021). However, spatially continuous salinity data may not always be available with other forms of sampling strategy, for instance, Rrs(0+) data collected from fixed platforms such as AERONET-OC (Zibordi et al., 2021). We recommend that pixel grids with salinity variability higher than 5% should be considered as a transitional water interface pixel (NFPI or OWI) for our sampling conditions in the Salish Sea. As such, in situ Rrs(0+) for these regions will be excluded for satellite match-up analysis (for all considered PGR 300, 900, 1500, and 3000 m) to minimize uncertainties associated with validation of satellite-derived atmospherically corrected Rrs(0+).
3.2 Rrs(0+) Variability for the Different Water Masses: Oceanic, Estuarine, and Plume Waters
After defining the Rrs(0+) variability for the transitional waters, NFPI and OWI, we evaluated the spectral homogeneity of the different water masses. For each water type, we calculated the average Rrs(0+) variability [denotes as
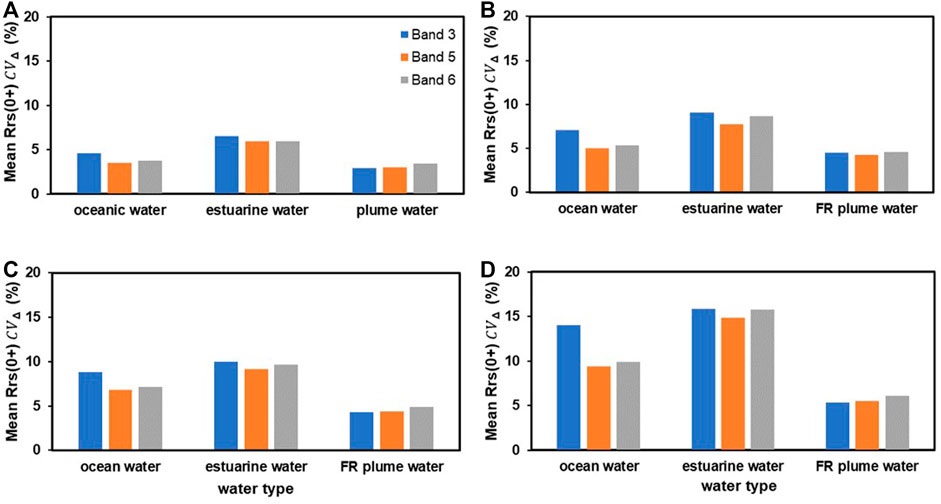
FIGURE 7. Comparison of mean coefficient of variability in remote sensing reflectance Rrs(0+) (CVΔ) for oceanic, estuarine, and plume waters with regard to pixel grid resolutions of (A) 300, (B) 900, (C) 1500, and (D) 3000 m for the SoG waters along the cruise track.
The relationship between the different pixel ground resolutions and the Rrs(0+) variability within each PGR, defined by
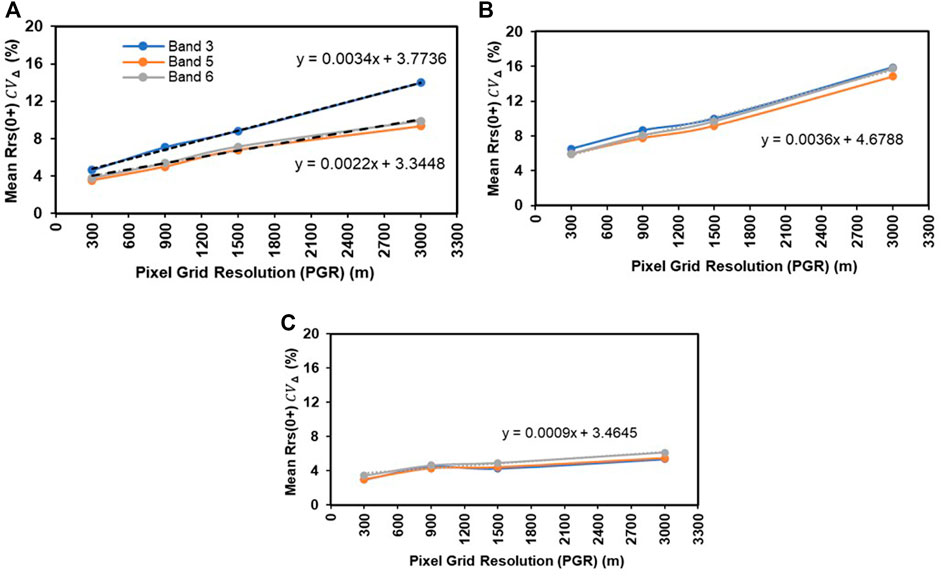
FIGURE 8. Mean Rrs(0+) CVΔ versus pixel grid resolution from 300 to 3000 m for, (A) oceanic, (B) estuarine, and (C) plume waters for Band 3 (442.5 nm), Band 5 (510 nm), and Band 6 (560 nm) of the Sentinel 3a, OLCI sensor.
The
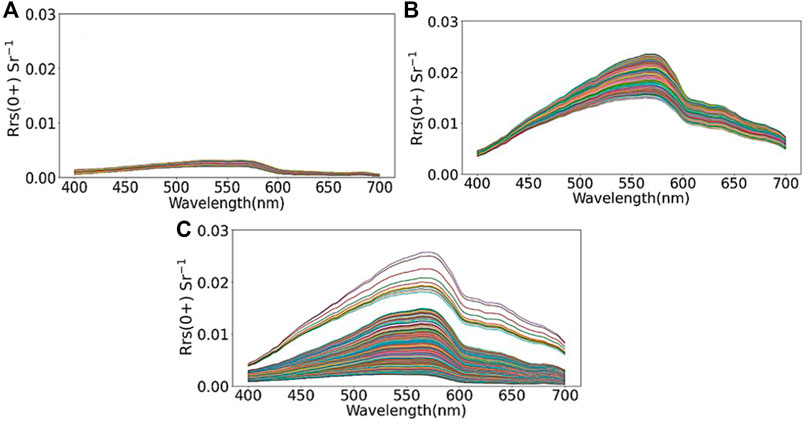
FIGURE 9. Rrs(0+) spectra measured on 2 September 2019 for (A) oceanic waters (Min; Max; SD; Mean = 0.0019; 0.0029; 0.00017; 0.0021 Sr−1 (B) plume waters (0.0131; 0.0186; 0.0013; 0.0165 Sr−1, respectively) and (C) estuarine waters (0.0021; 0.0199; 0.0021; 0.0058 Sr−1, respectively). The descriptive statistics shown are for Sentinel 3 OLCI Band 5 or 510 nm.
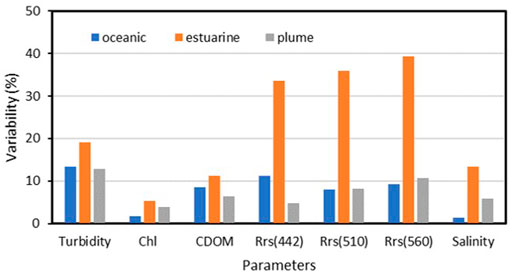
FIGURE 10. Variability (CV) analysis of Rrs(0+) at Band 3 (442.5 nm), Band 5 (510 nm) and Band 6 (560 nm), Turbidity, Chlorophyll, CDOM, and salinity parameters for oceanic, estuarine, and plume waters on 2 September 2019 SoG waters. The analysis shown at 300 m high resolution PGR.
The varying ranges of optical constituents were a result of the seasonal dynamics of this region, where during the spring freshet, the Fraser River plume is rich in particulate inorganic and dissolved organic matter, and the dominant phytoplankton bloom happens in the spring and summer seasons (Johannessen et al., 2006; Loos and Costa, 2010; Allen and Wolfe, 2013; Phillips and Costa, 2017; Suchy et al., 2019). It is noticeable that the plume waters were well mixed, demonstrated by the lower variability of the optical water constituents and salinity (Figure 10). Further, specifically for the plume waters, the high turbidity, which is generally associated with high inorganic particulate scattering (Loos and Costa, 2010; Phillips and Costa, 2017; Giannini et al., 2021), resulted in the highest and least variable Rrs(0+). Shelf circulation, the dilution rate of river-borne materials, and transport processes within the plume lead to stratified-shear mixing (Horner-Devine et al., 2015). Horizontal advection, transport of buoyancy, and momentum of Fraser River waters contribute to the well-mixed plume waters. Previous studies reported highly intense turbulence mixing in the near field region of the plume of the Fraser River (Moum et al., 1995; MacDonald and Geyer, 2004). The turbulent kinetic energy dissipation rate is observed to be as high as 10–4–10–3 m2 s−3 (MacDonald et al., 2007; McCabe et al., 2008; Kilcher et al., 2012; Horner-Devine et al., 2015). Wind and wave forcing also have a vital role in active mixing in the entire plume region (Houghton et al., 2009). Houghton et al. (2009) have shown that the salt fluxes vary from approximately 5 × 10⁻⁵ kg m s−1 during low wind conditions to 3 × 10⁻⁴ kg m s−1 for high winds (12 m s−1). For our observation period (May to September, 2019), high wind conditions (4–13 m s−1) dominated, causing well-mixing of the plume of water. These plume waters form a strong vertical stratification at around 5–7 m depth, depending on the tide and season (Halverson and Pawlowicz, 2011), resulting in a highly scattered and homogenous surface layer (Loos and Costa, 2010). Hence, the homogenous surface layer of the Fraser River plume waters caused lower variability in turbidity or total suspended matter, which consequently resulted in lower Rrs(0+) CVΔ. The oceanic waters in the transect were less influenced by the river plume and resulted in lower Rrs(0+) CVΔ.
The estuarine waters showed the highest variability of the optical constituents (Figure 10) due to salinity intrusion and, consequently, the largest Rrs(0+) CVΔ. Since estuarine dynamics and circulation contribute to the transport and dilution of fresh plume waters to saline oceanic waters (Thomson, 1981; Kostaschuk and Atwood, 1990; Hickey et al., 1998), the optical constituents result from both distinct water masses, with absorption and scattering playing a quasi-equal role in light attenuation (Loos and Costa, 2010; Phillips and Costa, 2017). This biogeochemical and, consequently, optical spatial complexity contributed to the largest Rrs(0+) CVΔ at any PGR, indicating that the spatial scale of dynamics is shorter than the PGR.
The spatial variability of the in situ Rrs(0+) analysis presented here has implications for the satellite data match-up analysis commonly used to validate atmospherically corrected Rrs(0+). As per the results obtained, irrespective of the spatial resolution or window box used in the validation process, in situ measurements acquired in estuarine waters may produce high uncertainties for satellite validation statistics.
4 Conclusion
This research provides a detailed and straightforward analysis of the spatial variability of in situ Rrs(0+) based on 33,073 measurements from the Salish Sea, west coast of Canada, taken aboard a BC ferry with autonomous radiometers (SAS-ST). The present study brings awareness to the spatial variability of Rrs in coastal waters for consideration when defining the quality of in situ data for satellite validation. The comparison of satellite-derived Rrs(0+) with the corresponding in situ data is not the objective of this paper. However, our near-future work will involve the detailed satellite validation match-up analysis aspects of this study. The Salish Sea is a highly optically dynamic water system with a strong influence from riverine and oceanic waters, which is common in many coastal regions of the world. This analysis provides a recommendation for accessing the quality of in situ Rrs(0+) match-up data based on the spatial variability as complementary to standard recommendations, including the temporal match-up intervals, sensors specifications and calibration, platform perturbation noise, parameterization to address surface Fresnel reflection of the sky radiance and corrections for the bidirectional effect, sky conditions, and data processing methods (Mobley, 1999; Hooker and Morel, 2003; Zibordi et al., 2012; Talone et al., 2018; Vabson et al., 2019a, Vabson et al., 2019b; Ruddick et al., 2019; Alikas et al., 2020; Tilstone et al., 2021; Wang and Costa, 2022). For specific water masses, the spatial variability of in situ Rrs(0+) within the pixel resolution of ocean color satellites or commonly used pixel window sizes may significantly contribute to the uncertainty budget in a match-up analysis. For the simulation of PGR, we considered a fixed-width grid size of 300, 900, 1500, and 3000 m, whereas the distance between the geographical coordinates of the in situ measurement transact was estimated using the cosine-haversine formula (Robusto, 1957). We consider that including a 300 m PGR is sufficient to identify and define the oceanographic features of the region, even with a fixed width window. However, a moving window analysis could contribute to our future studies of very high-resolution data, such as the validation of MSI Sentinel-2, Landsat-8, etc.
Based on a large dataset covering a variety of optical water masses, we found that the spatial variability of Rrs(0+) measurements is the largest (∼18% and 68% for 900 and 3000 m PGR, respectively) in NFPI waters, followed by in the OWI (∼28% and 35%, respectively), thus indicating the spatial heterogeneity of interface waters. Further, the Rrs(0+) variability was evaluated for specific water masses beyond the transitional water—plume, estuarine, and oceanic waters—characterized based on a salinity gradient criteria. Overall, the subpixel variability increased as the spatial resolution of the sensor or the window size increased, mainly in a linear fashion. Similar to the findings for the NFPI waters, the estuarine waters showed higher subpixel Rrs(0+) variability (∼8% and 16% for 900 and 3000 m PGR, respectively) among the three water masses, again indicating its inhomogeneous spatial nature. The high variability in Rrs(0+) was primarily associated with the spatial dynamic of the optical water constituents, thus limiting the use of these datasets as Fiducial Reference Measurements (FRMs) and for validation of satellite-derived atmospherically corrected Rrs(0+). We suggest considering the spatial variability of in situ Rrs(0+) measurement, which represents the small scale environmental changes in coastal waters. Also, we recommend using, the salinity threshold as a proxy to identify the recommended values of Rrs(0+) CVΔ in the construction of the match-up data set. Hence, the transitional water boundary pixels, especially those representing NFPI and OWI, and estuarine water masses will be excluded for satellite match-up analysis to avoid compromising the statistical result of satellite validation.
Data Availability Statement
The datasets presented in this study can be found in online repositories. The names of the repository/repositories and accession number(s) can be found at: https://data.oceannetworks.ca/DataSearch.
Author Contributions
HJN was responsible for the data processing, analysis, and manuscript writing. MC and FG were responsible for the project conceptualization, results, discussions, and significant reviews in the manuscript, and ZW was responsible for the development of methods for acquiring and processing the in situ Rrs(0+) data.
Funding
HN was supported by the Canadian Space Agency (FAST 18FAVICB09) program. The project also had funding from MC from NSERC NCE MEOPAR—Marine Environmental Observation, Prediction, and Response Network, Canadian Foundation for Innovations (CFI), and NSERC Discovery Grant, Canada.
Conflict of Interest
The authors declare that the research was conducted in the absence of any commercial or financial relationships that could be construed as a potential conflict of interest.
Publisher’s Note
All claims expressed in this article are solely those of the authors and do not necessarily represent those of their affiliated organizations, or those of the publisher, the editors, and the reviewers. Any product that may be evaluated in this article, or claim that may be made by its manufacturer, is not guaranteed or endorsed by the publisher.
Acknowledgments
We are thankful to the BC Ferries crew for logistical support during the installation of sensors, and the ONC (Ocean Networks Canada) for technical support with installing and maintaining the sensors.
References
Alikas, K., Ansko, I., Vabson, V., Ansper, A., Kangro, K., Uudeberg, K., et al. (2020). Consistency of Radiometric Satellite Data over Lakes and Coastal Waters with Local Field Measurements. Remote Sens. 12 (4), 616. doi:10.3390/rs12040616
Allen, S. E., and Wolfe, M. A. (2013). Hindcast of the Timing of the Spring Phytoplankton Bloom in the Strait of Georgia, 1968-2010. Prog. Oceanogr. 115, 6–13. doi:10.1016/j.pocean.2013.05.026
Aurin, D., Mannino, A., and Franz, B. (2013). Spatially Resolving Ocean Color and Sediment Dispersion in River Plumes, Coastal Systems, and Continental Shelf Waters. Remote Sens. Environ. 137, 212–225. doi:10.1016/j.rse.2013.06.018
Bailey, S. W., and Werdell, P. J. (2006). A Multi-Sensor Approach for the On-Orbit Validation of Ocean Color Satellite Data Products. Remote Sens. Environ. 102 (1-2), 12–23. doi:10.1016/j.rse.2006.01.015
Balasubramanian, S. V., Pahlevan, N., Smith, B., Binding, C., Schalles, J., Loisel, H., et al. (2020). Robust Algorithm for Estimating Total Suspended Solids (TSS) in Inland and Nearshore Coastal Waters. Remote Sens. Environ. 246, 111768. doi:10.1016/j.rse.2020.111768
Barnes, B. B., Cannizzaro, J. P., English, D. C., and Hu, C. (2019). Validation of VIIRS and MODIS Reflectance Data in Coastal and Oceanic Waters: An Assessment of Methods. Remote Sens. Environ. 220, 110–123. doi:10.1016/j.rse.2018.10.034
Bissett, W. P., Arnone, R. A., Davis, C. O., Dickey, T. D., Dye, D., Kohler, D. D. R., et al. (2004). A Look at Ocean-Color Scales of Variability, Spatial Coherence, and the Need for Fine-Scale Remote Sensing in Coastal Ocean Optics. Oceanography 17 (2), 33–43. doi:10.5670/oceanog.2004.45
Blondeau-Patissier, D., Gower, J. F. R., Dekker, A. G., Phinn, S. R., and Brando, V. E. (2014). A Review of Ocean Color Remote Sensing Methods and Statistical Techniques for the Detection, Mapping and Analysis of Phytoplankton Blooms in Coastal and Open Oceans. Prog. Oceanogr. 123, 123–144. doi:10.1016/j.pocean.2013.12.008
Boss, E., Haëntjens, N., Ackleson, S. G., Balch, B., Chase, A., Dall’Olmo, G., et al. (2019). “IOCCG Ocean Optics and Biogeochemistry Protocols for Satellite Ocean Colour Sensor Validation Inherent Optical Property Measurements and Protocols: Best Practices for the Collection and Processing of Ship-Based Underway Flow-Through Optical Data (V4. 0),” in IOCCG Ocean Optics and Biogeochemistry Protocols for Satellite Ocean Colour Sensor Validation.
Boss, E., Pegau, W. S., Lee, M., Twardowski, M., Shybanov, E., Korotaev, G., et al. (2004). Particulate Backscattering Ratio at LEO 15 and its Use to Study Particle Composition and Distribution. J. Geophys. Res. Oceans 109 (C1), C01014. doi:10.1029/2002jc001514
Brando, V., Lovell, J., King, E., Boadle, D., Scott, R., and Schroeder, T. (2016). The Potential of Autonomous Ship-Borne Hyperspectral Radiometers for the Validation of Ocean Color Radiometry Data. Remote Sens. 8 (2), 150. doi:10.3390/rs8020150
Carswell, T., Costa, M., Young, E., Komick, N., Gower, J., and Sweeting, R. (2017). Evaluation of MODIS-Aqua Atmospheric Correction and Chlorophyll Products of Western North American Coastal Waters Based on 13 Years of Data. Remote Sens. 9 (10), 1063. doi:10.3390/rs9101063
Cazzaniga, I., Zibordi, G., and Mélin, F. (2021). Spectral Variations of the Remote Sensing Reflectance during Coccolithophore Blooms in the Western Black Sea. Remote Sens. Environ. 264, 112607. doi:10.1016/j.rse.2021.112607
D'Alimonte, D., Shybanov, E. B., Zibordi, G., and Kajiyama, T. (2013). Regression of In-Water Radiometric Profile Data. Opt. Express 21 (23), 27707–27733. doi:10.1364/OE.21.027707
Davis, C. O., Kavanaugh, M., Letelier, R., Bissett, W. P., and Kohler, D. (2007). “Spatial and Spectral Resolution Considerations for Imaging Coastal Waters,” in Coastal Ocean Remote Sensing (San Diego, California, United States: International Society for Optics and Photonics, 6680, 66800P. doi:10.1117/12.734288
Dierssen, H. M., and Randolph, K. (2013). “Remote Sensing of Ocean Color,” in Earth System Monitoring (New York: Springer), 439–472. doi:10.1007/978-1-4614-5684-1_18
Doxaran, D., Leymarie, E., Nechad, B., Dogliotti, A., Ruddick, K., Gernez, P., et al. (2016). Improved Correction Methods for Field Measurements of Particulate Light Backscattering in Turbid Waters. Opt. Express 24 (4), 3615–3637. doi:10.1364/oe.24.003615
Doyle, J. P., and Zibordi, G. (2002). Optical Propagation within a Three-Dimensional Shadowed Atmosphere–Ocean Field: Application to Large Deployment Structures. Appl. Opt. 41 (21), 4283–4306. doi:10.1364/ao.41.004283
Dutkiewicz, S., Hickman, A. E., Jahn, O., Henson, S., Beaulieu, C., and Monier, E. (2019). Ocean Colour Signature of Climate Change. Nat. Commun. 10 (1), 578. doi:10.1038/s41467-019-08457-x
Environment and Climate Change Canada (2021a). Canada's Air Pollutant Emissions Inventory Report 2021: Executive Summary. Available at: www.canada.ca/en/environment-climate-change/services/air-pollution/publications/emissions-inventory-report-2021-executive-summary.html.
Environment and Climate Change Canada (2021b). Greenhouse Gas Sources and Sinks: Executive Summary 2021. Available at: www.canada.ca/en/environment-climate-change/services/climate-change/greenhouse-gas-emissions/sources-sinks-executive-summary-2021.html.
Esenkulova, S., Suchy, K. D., Pawlowicz, R., Costa, M., and Pearsall, I. A. (2021). Harmful Algae and Oceanographic Conditions in the Strait of Georgia, Canada Based on Citizen Science Monitoring. Front. Mar. Sci. 8, 725092. doi:10.3389/fmars.2021.725092
Giannini, F., Hunt, B. P. V., Jacoby, D., and Costa, M. (2021). Performance of OLCI Sentinel-3A Satellite in the Northeast Pacific Coastal Waters. Remote Sens. Environ. 256, 112317. doi:10.1016/j.rse.2021.112317
Gordon, H. R., and Ding, K. (1992). Self-shading of In-Water Optical Instruments. Limnol. Oceanogr. 37 (3), 491–500. doi:10.4319/lo.1992.37.3.0491
Haines, A., Kovats, R. S., Campbell-Lendrum, D., and Corvalan, C. (2006). Climate Change and Human Health: Impacts, Vulnerability, and Public Health. Public Health 120, 585–596. doi:10.1016/j.puhe.2006.01.002
Halverson, M., and Pawlowicz, R. (2011). Entrainment and Flushing Time in the Fraser River Estuary and Plume from a Steady Salt Balance Analysis. J. Geophys. Res. Oceans 116 (C8), C08023. doi:10.1029/2010jc006793
Harrison, P. J., Fulton, J. D., Taylor, F. J. R., and Parsons, T. R. (1983). Review of the Biological Oceanography of the Strait of georgia: Pelagic Environment. Can. J. Fish. Aquat. Sci. 40, 1064–1094. doi:10.1139/f83-129
He, Q., and Silliman, B. R. (2019). Climate Change, Human Impacts, and Coastal Ecosystems in the Anthropocene. Curr. Biol. 29 (19), R1021–R1035. doi:10.1016/j.cub.2019.08.042
Hickey, B. M., Pietrafesa, L. J., Jay, D. A., and Boicourt, W. C. (1998). The Columbia River Plume Study: Subtidal Variability in the Velocity and Salinity Fields. J. Geophys. Res. 103 (C5), 10339–10368. doi:10.1029/97jc03290
Hilborn, A., and Costa, M. (2018). Applications of DINEOF to Satellite-Derived Chlorophyll-A from a Productive Coastal Region. Remote Sens. 10 (9), 1449. doi:10.3390/rs10091449
Hooker, S. B., and Morel, A. (2003). Platform and Environmental Effects on Above-Water Determinations of Water-Leaving Radiances. J. Atmos. Ocean. Technol. 20 (1), 187–205. doi:10.1175/1520-0426(2003)020<0187:paeeoa>2.0.co;2
Horner-Devine, A. R., Hetland, R. D., and MacDonald, D. G. (2015). Mixing and Transport in Coastal River Plumes. Annu. Rev. Fluid Mech. 47, 569–594. doi:10.1146/annurev-fluid-010313-141408
Houghton, R. W., Chant, R. J., Rice, A., and Tilburg, C. (2009). Salt Flux into Coastal River Plumes: Dye Studies in the Delaware and Hudson River Outflows. J. Mar. Res. 67 (6), 731–756. doi:10.1357/002224009792006142
Johannessen, S. C., Macdonald, R. W., and Strivens, J. E. (2021). Has Primary Production Declined in the Salish Sea? Can. J. Fish. Aquat. Sci. 78 (3), 312–321. doi:10.1139/cjfas-2020-0115
Johannessen, S. C., Masson, D., and Macdonald, R. W. (2006). Distribution and cycling of suspended particles inferred from transmissivity in the Strait of Georgia, Haro Strait and Juan de Fuca Strait. Atmosphere-Ocean 44 (1), 17–27. doi:10.3137/ao.440102
Kilcher, L. F., Nash, J. D., and Moum, J. N. (2012). The Role of Turbulence Stress Divergence in Decelerating a River Plume. J. Geophys. Res. Oceans 117 (C5), 5032. doi:10.1029/2011jc007398
Komick, N. M., Costa, M. P. F., and Gower, J. (2009). Bio-optical Algorithm Evaluation for MODIS for Western Canada Coastal Waters: an Exploratory Approach Using In Situ Reflectance. Remote Sens. Environ. 113, 794–804. doi:10.1016/j.rse.2008.12.005
Koponen, S., Attila, J., Pulliainen, J., Kallio, K., Pyhälahti, T., Lindfors, A., et al. (2007). A Case Study of Airborne and Satellite Remote Sensing of a Spring Bloom Event in the Gulf of Finland. Cont. Shelf Res. 27 (2), 228–244. doi:10.1016/j.csr.2006.10.006
Kostaschuk, R. A., and Atwood, L. A. (1990). River Discharge and Tidal Controls on Salt-Wedge Position and Implications for Channel Shoaling: Fraser River, British Columbia. Can. J. Civ. Eng. 17 (3), 452–459. doi:10.1139/l90-049
Kyryliuk, D., and Kratzer, S. (2019). Evaluation of Sentinel-3A OLCI Products Derived Using the Case-2 Regional CoastColour Processor over the Baltic Sea. Sensors 19 (16), 3609. doi:10.3390/s19163609
Lee, Z. P., Du, K., Voss, K. J., Zibordi, G., Lubac, B., Arnone, R., et al. (2011). An Inherent-Optical-Property-Centered Approach to Correct the Angular Effects in Water-Leaving Radiance. Appl. Opt. 50 (19), 3155–3167. doi:10.1364/ao.50.003155
Loisel, H., Nicolas, J. M., Sciandra, A., Stramski, D., and Poteau, A. (2006). Spectral Dependency of Optical Backscattering by Marine Particles from Satellite Remote Sensing of the Global Ocean. J. Geophys. Res. Oceans 111 (C9), 14. doi:10.1029/2005jc003367
Loos, E. A., and Costa, M. (2010). Inherent Optical Properties and Optical Mass Classification of the Waters of the Strait of Georgia, British Columbia, Canada. Prog. Oceanogr. 87, 144–156. doi:10.1016/j.pocean.2010.09.004
Loos, E., Costa, M., and Johannessen, S. (2017). Underwater Optical Environment in the Coastal Waters of British Columbia, Canada. Facets 2 (2), 872–891. doi:10.1139/facets-2017-0074
MacDonald, D. G., and Geyer, W. R. (2004). Turbulent Energy Production and Entrainment at a Highly Stratified Estuarine Front. J. Geophys. Res. Oceans 109 (C5), C05004. doi:10.1029/2003jc002094
MacDonald, D. G., Goodman, L., and Hetland, R. D. (2007). Turbulent Dissipation in a Near‐field River Plume: A Comparison of Control Volume and Microstructure Observations with a Numerical Model. J. Geophys. Res. Oceans 112 (C7), C07026. doi:10.1029/2006jc004075
Mahadevan, A., and Campbell, J. W. (2002). Biogeochemical Patchiness at the Sea Surface. Geophys. Res. Lett. 29 (19), 32. doi:10.1029/2001GL014116
Mahadevan, A. (2004). “Spatial Heterogeneity and its Relation to Processes in the Upper Ocean,” in Ecosystem Function in Heterogeneous Landscapes. Editors G. M. Lovett, M. G. Turner, C. G. Jones, and K. C. Weathers (N. Y: Springer), 165–182.
Masson, D., and Peña, A. (2009). Chlorophyll distribution in a temperate estuary: The Strait of Georgia and Juan de Fuca Strait. Estuar. Coast. Shelf Sci. 82 (1), 19–28. doi:10.1016/j.ecss.2008.12.022
McCabe, R. M., Hickey, B. M., and MacCready, P. (2008). Observational Estimates of Entrainment and Vertical Salt Flux in the Interior of a Spreading River Plume. J. Geophys. Res. Oceans 113 (C8), C08027. doi:10.1029/2007jc004361
Mélin, F., and Franz, B. A. (2014). Assessment of Satellite Ocean Colour Radiometry and Derived Geophysical Products. Exp. Methods Phys. Sci. 47, 609–638. doi:10.1016/B978-0-12-417011-7.00020-9
IOCCG (2019). “Uncertainties in Ocean Colour Remote Sensing,” in IOCCG Report Series, No. 18, International Ocean Colour Coordinating Group. Editor F. Mélin (Dartmouth, Canada: IOCCG). doi:10.25607/OBP-696
Mélin, F., Zibordi, G., and Berthon, J. F. (2007). Assessment of Satellite Ocean Color Products at a Coastal Site. Remote Sens. Environ. 110 (2), 192–215. doi:10.1016/j.rse.2007.02.026
Mobley, C. D. (1999). Estimation of the Remote-Sensing Reflectance from Above-Surface Measurements. Appl. Opt. 38, 7442–7455. doi:10.1364/AO.38.007442
Mograne, M., Jamet, C., Loisel, H., Vantrepotte, V., Mériaux, X., and Cauvin, A. (2019). Evaluation of Five Atmospheric Correction Algorithms over French Optically-Complex Waters for the Sentinel-3A OLCI Ocean Color Sensor. Remote Sens. 11 (6), 668. doi:10.3390/rs11060668
Moore, C., Barnard, A., Fietzek, P., Lewis, M. R., Sosik, H. M., White, S., et al. (2009). Optical Tools for Ocean Monitoring and Research. Ocean. Sci. 5 (4), 661–684. doi:10.5194/os-5-661-2009
Moore, G. F., Aiken, J., and Lavender, S. J. (1999). The Atmospheric Correction of Water Colour and the Quantitative Retrieval of Suspended Particulate Matter in Case II Waters: Application to MERIS. Int. J. Remote Sens. 20 (9), 1713–1733. doi:10.1080/014311699212434
Moses, W. J., Ackleson, S. G., Hair, J. W., Hostetler, C. A., and Miller, W. D. (2016). Spatial Scales of Optical Variability in the Coastal Ocean: Implications for Remote Sensing and In Situ Sampling. J. Geophys. Res. Oceans 121 (6), 4194–4208. doi:10.1002/2016jc011767
Moum, J. N., Gregg, M. C., Lien, R. C., and Carr, M. E. (1995). Comparison of Turbulence Kinetic Energy Dissipation Rate Estimates from Two Ocean Microstructure Profilers. J. Atmos. Ocean. Technol. 12 (2), 346–366. doi:10.1175/1520-0426(1995)012<0346:cotked>2.0.co;2
Nasiha, H. J., Shanmugam, P., and Sundaravadivelu, R. (2019). Estimation of Sediment Settling Velocity in Estuarine and Coastal Waters Using Optical Remote Sensing Data. Adv. Space Res. 63 (11), 3473–3488. doi:10.1016/j.asr.2019.02.023
Nechad, B., Ruddick, K. G., and Park, Y. (2010). Calibration and Validation of a Generic Multisensor Algorithm for Mapping of Total Suspended Matter in Turbid Waters. Remote Sens. Environ. 114 (4), 854–866. doi:10.1016/j.rse.2009.11.022
Owens, D., Abeysirigunawardena, D., Biffard, B., Chen, Y., Conley, P., Jenkyns, R., et al. (2022). The Oceans 2.0/3.0 Data Management and Archival System. Front. Mar. Sci. 9, 806452. doi:10.3389/fmars.2022.806452
Pahlevan, N., Sarkar, S., and Franz, B. A. (2016). Uncertainties in Coastal Ocean Color Products: Impacts of Spatial Sampling. Remote Sens. Environ. 181, 14–26. doi:10.1016/j.rse.2016.03.022
Park, Y.-J., and Ruddick, K. (2005). Model of Remote-Sensing Reflectance Including Bidirectional Effects for Case 1 and Case 2 Waters. Appl. Opt. 44 (7), 1236–1249. doi:10.1364/ao.44.001236
Patt, F. S. (2002). “Navigation Algorithms for the SeaWiFS Mission,” in NASA Tech. Memo 16. Editor S. B. Hooker, and E. R. Firestone (Greenbelt, MD: NASA Goddard Space Flight Center).
Pawlowicz, R., Di Costanzo, R., Halverson, M., Devred, E., and Johannessen, S. (2017). Advection, Surface Area, and Sediment Load of the Fraser River Plume under Variable Wind and River Forcing. Atmosphere-Ocean 55 (4-5), 293–313. doi:10.1080/07055900.2017.1389689
Phillips, S. R., and Costa, M. (2017). Spatial-temporal Bio-Optical Classification of Dynamic Semi-estuarine Waters in Western North America. Estuar. Coast. Shelf Sci. 199, 35–48. doi:10.1016/j.ecss.2017.09.029
Platt, T., Hoepffner, N., Stuart, V., and Brown, C. C. (2008). “Why Ocean Colour? the Societal Benefits of Ocean-Colour Technology,” in Reports and Monographs of the International Ocean-Colour Coordinating Group (IOCCG) (Dartmouth, NS, Canada: IOCCG).
Poggioli, A. R., and Horner-Devine, A. R. (2018). Two-layer Hydraulics at the River-Ocean Interface. J. Fluid Mech. 856, 633–672. doi:10.1017/jfm.2018.688
Robusto, C. C. (1957). The Cosine-Haversine Formula. Am. Math. Mon. 64 (1), 38–40. doi:10.2307/2309088
Ruddick, K. G., Voss, K., Boss, E., Castagna, A., Frouin, R., Gilerson, A., et al. (2019). A Review of Protocols for Fiducial Reference Measurements of Water-Leaving Radiance for Validation of Satellite Remote-Sensing Data over Water. Remote Sens. 11 (19), 2198. doi:10.3390/rs11192198
Sathyendranath, S., Brewin, R. J., Jackson, T., Mélin, F., and Platt, T. (2017). Ocean-colour Products for Climate-Change Studies: What Are Their Ideal Characteristics? Remote Sens. Environ. 203, 125–138. doi:10.1016/j.rse.2017.04.017
IOCCG (2000). “Remote Sensing of Ocean Color in Coastal, and Other Optically-Complex Waters,” in Reports of the International Ocean-Colour Coordinating Group 3. Editor S. Sathyendranath (Darmouth, Canada: IOCCG Project Office), 144.
Satlantic (2016). SAS Solar Tracker Operation Manual. Nova Scotia, Canada: Sea bird scientific Inc. Available at: https://d3pcsg2wjq9izr.cloudfront.net/files/87215/download/676702/SASoperationmanual.pdf.
Satlantic (2010). Satlantic Instrument File Standard. Nova Scotia, Canada: Sea bird scientific Inc. Available at: https://wiki.oceannetworks.ca/download/attachments/24215788/SAT-DN-00134_Instrument%20File%20Format.pdf.
Shang, Z., Lee, Z., Dong, Q., and Wei, J. (2017). Self-shading Associated with a Skylight-Blocked Approach System for the Measurement of Water-Leaving Radiance and its Correction. Appl. Opt. 56 (25), 7033–7040. doi:10.1364/ao.56.007033
Shanmugam, P., He, X., Singh, R. K., and Varunan, T. (2018). A Modern Robust Approach to Remotely Estimate Chlorophyll in Coastal and Inland Zones. Adv. Space Res. 61 (10), 2491–2509. doi:10.1016/j.asr.2018.02.024
Slade, W. H., Boss, E., Dall’Olmo, G., Langner, M. R., Loftin, J., Behrenfeld, M. J., and Westberry, T. K. (2010). Underway and Moored Methods for Improving Accuracy in Measurement of Spectral Particulate Absorption and Attenuation. J. Atmos. Ocean. Technol. 27 (10), 1733–1746. doi:10.1175/2010jtecho755.1
Stronach, J. A. (1977). Observational and Modelling Studies of the Fraser River Plume (Canada: University of British Columbia). Doctoral dissertation.
Suchy, K. D., Le Baron, N., Hilborn, A., Perry, R. I., and Costa, M. (2019). Influence of Environmental Drivers on Spatio-Temporal Dynamics of Satellite Derived Chlorophyll a in the Strait of Georgia. Prog. Oceanogr. 176, 102134. doi:10.1016/j.pocean.2019.102134
Sutton, J. N., Johannessen, S. C., and Macdonald, R. W. (2013). A Nitrogen Budget for the Strait of Georgia, British Columbia, with Emphasis on Particulate Nitrogen and Dissolved Inorganic Nitrogen. Biogeosciences 10, 7179–7194. doi:10.5194/bg-10-7179-2013
Talone, M., Zibordi, G., and Lee, Z. (2018). Correction for the Non-nadir Viewing Geometry of AERONET-OC above Water Radiometry Data: An Estimate of Uncertainties. Opt. Express 26 (10), A541–A561. doi:10.1364/oe.26.00a541
Taylor, N. C., and Kudela, R. M. (2021). Spatial Variability of Suspended Sediments in San Francisco Bay, California. Remote Sens. 13 (22), 4625. doi:10.3390/rs13224625
Thomson, R. E. (1981). Oceanography of the British Columbia Coast, Canadian Special Publication of Fisheries and Aquatic Science. Canada: Fisheries and Oceans Canada, 291.
Tilstone, G. H., Pardo, S., Dall'Olmo, G., Brewin, R. J., Nencioli, F., Dessailly, D., et al. (2021). Performance of Ocean Colour Chlorophyll a Algorithms for Sentinel-3 OLCI, MODIS-Aqua and Suomi-VIIRS in Open-Ocean Waters of the Atlantic. Remote Sens. Environ. 260, 112444. doi:10.1016/j.rse.2021.112444
Travers-Smith, H., Giannini, F., Sastri, A. R., and Costa, M. (2021). Validation of Non-photochemical Quenching Corrections for Chlorophyll-A Measurements Aboard Ships of Opportunity. Front. Mar. Sci. 8, 686750. doi:10.3389/fmars.2021.686750
Vabson, V., Kuusk, J., Ansko, I., Vendt, R., Alikas, K., Ruddick, K., et al. (2019a). Field Intercomparison of Radiometers Used for Satellite Validation in the 400-900 Nm Range. Remote Sens. 11, 1129. doi:10.3390/rs11091129
Vabson, V., Kuusk, J., Ansko, I., Vendt, R., Alikas, K., Ruddick, K., et al. (2019b). Laboratory Intercomparison of Radiometers Used for Satellite Validation in the 400-900 Nm Range. Remote Sens. 11, 1101. doi:10.3390/rs11091101
Vandenberg, N., Costa, M., Coady, Y., and Agbaje, T. (2017). “PySciDON: A python Scientificframework for Development of Ocean Network Applications,” in IEEE Pacific Rim Conference on Communications, Computers and Signal Processing (PACRIM), 1–6. Victoria, BC, Canada: Institute of Electrical and Electronics Engineers, Inc.. doi:10.1109/PACRIM.2017.8121926
Wang, Z., and Costa, M. (2022). Autonomous Shipborne In Situ Reflectance Data in Optically Complex Coastal Waters: a Case Study of the Salish Sea, Canada. Front. remote Sens. 44. doi:10.3389/frsen.2022.867570
Wang, Z., and Costa, M. (2018). “Autonomous Shipborne In Situ Reflectance Data in Opticallycomplex Coastal Waters for Validation of Sentinel-3 Imagery: A Case Study of the Salish Sea, Canada,” in Proceedings of the XXIV Ocean Optics Conference (Dubrovnik, Croatia.
Ward, N. D., Megonigal, J. P., Bond-Lamberty, B., Bailey, V. L., Butman, D., Canuel, E. A., et al. (2020). Representing the Function and Sensitivity of Coastal Interfaces in Earth System Models. Nat. Commun. 11 (1), 1–14. doi:10.1038/s41467-020-16236-2
Werdell, P. J., Franz, B. A., Bailey, S. W., Harding, L. W., and Feldman, G. C. (2007). “Approach for the Long-Term Spatial and Temporal Evaluation of Ocean Color Satellite Data Products in a Coastal Environment,” in Coastal Ocean Remote Sensing. San Diego, California, United States: International Society for Optics and Photonics, 6680, 66800G. doi:10.1117/12.732489
Westberry, T. K., Dall’Olmo, G., Boss, E., Behrenfeld, M. J., and Moutin, T. (2010). Coherence of Particulate Beam Attenuation and Backscattering Coefficients in Diverse Open Ocean Environments. Opt. Express 18 (15), 15419–15425. doi:10.1364/oe.18.015419
Woźniak, S. B., and Stramski, D. (2004). Modeling the Optical Properties of Mineral Particles Suspended in Seawater and Their Influence on Ocean Reflectance and Chlorophyll Estimation from Remote Sensing Algorithms. Appl. Opt. 43 (17), 3489–3503. doi:10.1364/ao.43.003489
Wu, J. L., Ho, C. R., Huang, C. C., Srivastav, A. L., Tzeng, J. H., and Lin, Y. T. (2014). Hyperspectral Sensing for Turbid Water Quality Monitoring in Freshwater Rivers: Empirical Relationship between Reflectance and Turbidity and Total Solids. Sensors 14 (12), 22670–22688. doi:10.3390/s141222670
Zaneveld, J. R. V., Boss, E., and Barnard, A. (2001). Influence of Surface Waves on Measured and Modeled Irradiance Profiles. Appl. Opt. 40 (9), 1442–1449. doi:10.1364/ao.40.001442
Zibordi, G., and Ferrari, G. M. (1995). Instrument Self-Shading in Underwater Optical Measurements: Experimental Data. Appl. Opt. 34 (15), 2750–2754. doi:10.1364/ao.34.002750
Zibordi, G., Mélin, F., and Berthon, J. F. (2018). A Regional Assessment of OLCI Data Products. IEEE Geoscience Remote Sens. Lett. 15 (10), 1490–1494. doi:10.1109/lgrs.2018.2849329
Zibordi, G., Mélin, F., Berthon, J. F., Holben, B., Slutsker, I., Giles, D., et al. (2009). AERONET-OC: a Network for the Validation of Ocean Color Primary Products. J. Atmos. Ocean. Technol. 26 (8), 1634–1651. doi:10.1175/2009jtecho654.1
Zibordi, G., Mélin, F., Berthon, J. F., and Talone, M. (2015a). In Situ autonomous Optical Radiometry Measurements for Satellite Ocean Color Validation in the Western Black Sea. Ocean Sci. 11, 275–286. doi:10.5194/os-11-275-2015
Zibordi, G., Mélin, F., Hooker, S. B., D'Alimonte, D., and Holben, B. (2004). An Autonomous Above-Water System for the Validation of Ocean Color Radiance Data. IEEE Trans. Geoscience Remote Sens. 42 (2), 401–415. doi:10.1109/tgrs.2003.821064
Zibordi, G., Mélin, F., Voss, K. J., Johnson, B. C., Franz, B. A., Kwiatkowska, E., et al. (2015b). System Vicarious Calibration for Ocean Color Climate Change Applications: Requirements for In Situ Data. Remote Sens. Environ. 159, 361–369. doi:10.1016/j.rse.2014.12.015
Zibordi, G., Ruddick, K., Ansko, I., Moore, G., Kratzer, S., Icely, J., et al. (2012). In Situ determination of the Remote Sensing Reflectance: an Inter-comparison. Ocean Sci. 8 (4), 567–586. doi:10.5194/os-8-567-2012
Keywords: in situ remote sensing reflectance, subpixel variability, SAS Solar Tracker, optically complex coastal waters, transitional water boundary
Citation: Nasiha HJ, Wang Z, Giannini F and Costa M (2022) Spatial Variability of In Situ Above-Water Reflectance in Coastal Dynamic Waters: Implications for Satellite Match-Up Analysis. Front. Remote Sens. 3:876748. doi: 10.3389/frsen.2022.876748
Received: 15 February 2022; Accepted: 10 May 2022;
Published: 24 June 2022.
Edited by:
Minwei Zhang, Science Applications International Corporation, United StatesReviewed by:
Vittorio Ernesto Brando, Institute of Marine Science (CNR), ItalySrinivas Kolluru, Florida Atlantic University, United States
Copyright © 2022 Nasiha, Wang, Giannini and Costa. This is an open-access article distributed under the terms of the Creative Commons Attribution License (CC BY). The use, distribution or reproduction in other forums is permitted, provided the original author(s) and the copyright owner(s) are credited and that the original publication in this journal is cited, in accordance with accepted academic practice. No use, distribution or reproduction is permitted which does not comply with these terms.
*Correspondence: Hussain J. Nasiha, bmFzaWhhakB1dmljLmNh