 Gerhard Meister1*
 Joseph J. Knuble2Leland H. Chemerys3
 Hyeungu Choi4
 Nicholas R. Collins5Robert E. Eplee1,6Ulrik Gliese7Eric T. Gorman8
 Kim Jepsen3Samuel Kitchen-McKinley3Shihyan Lee1,6Jeffrey W. Mcintire3Frederick S. Patt1,6Bradley C. Tse9Eugene Waluschka10
 P. Jeremy Werdell1
- 1Ocean Ecology Lab, Goddard Space Flight Center, NASA, Greenbelt, MD, United States
- 2NASA Goddard Space Flight Center, Greenbelt, MD, United States
- 3Science Systems and Applications Inc., Lanham, MD, United States
- 4Global Science & Technology, Greenbelt, MD, United States
- 5Telophase Corporation at NASA’s Goddard Space Flight Center, Greenbelt, MD, United States
- 6Science Applications International Corporation, Reston, VA, United States
- 7KBR, Greenbelt, MD, United States
- 8NASA GSFC Instrument Systems Engineering, Greenbelt, MD, United States
- 9Microtel, Greenbelt, MD, United States
- 10Stellar Solutions, Chantilly, VA, United States
This paper summarizes the results from the system level test campaign of the Engineering Test Unit (ETU) of the ‘Ocean Color Instrument’ (OCI), the primary payload of NASA’s ‘Plankton, Aerosol, Cloud and ocean Ecosystem’ (PACE) mission. The main goals of the test campaign were to optimize characterization procedures and evaluate system level performance relative to model predictions. Critical performance parameters such as radiometric gain, signal-to-noise ratio, polarization, instantaneous field-of-view, temperature sensitivity, relative spectral response and stability were evaluated for wavelengths from 600 to 2,260 nm and are in line with expectations. We expect the OCI flight unit to meet the PACE mission performance requirements. Building and testing the ETU has been extremely important for the development of the OCI flight unit (e.g. improved SNR by increasing the aperture, optimized thermal design), and we strongly recommend the inclusion of an ETU in the development of future spaceborne sensors that rely on novel technological designs. ETU testing led to the discovery of a hysteresis issue with the SWIR bands, and a correction algorithm was developed. Also, the coregistration of the SWIR bands relative to each other is worse than expected, but this was discovered too late in the schedule to remediate.
1 Introduction
The PACE mission represents NASA’s next investment in ocean biology, clouds, and aerosol data records to enable advanced insight into ocean and atmospheric responses to Earth’s changing climate (Werdell et al., 2019). Scheduled for launch in January 2024, PACE will extend key heritage climate data records, and also enable the accurate estimation of a wide range of novel ocean, land, and atmosphere geophysical variables. A key aspect of PACE is the inclusion of an advanced satellite radiometer known as the Ocean Color Instrument (OCI) to measure the “colors” of the ocean, land, and atmosphere. Whereas heritage instruments, such as the NASA Sea-viewing Wide Field-of-view (SeaWiFS), Moderate Resolution Imaging Spectroradiometer (MODIS), and Visible Infrared Imaging Radiometer (VIIRS), observe roughly five-to-ten visible wavelengths from blue to red, OCI will collect a continuum of colors that span the visible spectrum from the ultraviolet to near infrared and beyond. In doing so, OCI will be the first of its kind to collect such hyperspectral radiometry on daily global scales. This leap in technology will enable improved understanding of aquatic ecosystems and biogeochemistry, as well as provide new information on phytoplankton community composition and improved detection of algal blooms (see, e.g., Bracher et al., 2009; Torecilla et al., 2011; Catlett and Siegel, 2018). OCI will also continue and advance many atmospheric aerosol, cloud, and land capabilities from heritage satellite instrumentation (Coddington et al., 2017; Platnick et al., 2018; Remer et al., 2019a), which in combination with its ocean measurements, will enable improved assessment of atmospheric and terrestrial impacts on ocean biology and chemistry (PACE Science Definition Team, 2018 and references within).
The PACE payload will be complemented by two small multi-angle polarimeters (MAP) with spectral ranges that span the visible to near infrared spectral region, which will improve aerosol and hydrosol characterizations and provide opportunities for novel ocean color atmospheric correction (Omar et al., 2018, Remer et al., 2019b). The first MAP, the University of Maryland Baltimore County HARP2 instrument, will nominally provide wide-swath multispectral polarimetric angles at 10 view angles in the blue, green, and near infrared, and at 60 view angles in the red. (Fernandez Borda et al., 2018). The second MAP, the SRON Netherlands Institute for Space Research and Airbus Defence and Space Netherlands SPEXone instrument, will provide narrow-swath hyperspectral polarimetric retrievals at five view angles (Hasekamp et al., 2019). Ultimately, the PACE instrument suite will revolutionize studies of global biogeochemistry, carbon cycles, and hydrosols/aerosols in the ocean-atmosphere system and, in general, shed new light on our colorful home planet.
This paper describes the results of the prelaunch test campaign of the OCI Engineering Test Unit. While PACE is a multi-disciplinary mission, in practice, ocean color requirements drove its design concept and requirements for its test campaign and, thus, a brief review of the ocean color paradigm is warranted for context. Ocean color satellite instruments such as OCI measure the spectral top-of-the-atmosphere (TOA) radiance at visible-to-shortwave infrared bands. Atmospheric correction algorithms are typically applied to remove the contribution of the atmosphere from TOA radiances, which can exceed 90% of the total signal, and produce estimates of spectral remote-sensing reflectances (Rrs), the light exiting the water normalized to the downwelling surface irradiance (Mobley et al., 2016). Bio-optical algorithms are then applied to the derived Rrs to produce estimates of geophysical and optical quantities, such as the near surface concentration of the phytoplankton pigment chlorophyll-a (Hu et al., 2019; O’Reilly and Werdell 2019), spectral inherent optical properties (IOCCG 2006; Werdell et al., 2018), and metrics of phytoplankton community composition (Bracher et al., 2017; Mouw et al., 2017). The performance requirements needed to accurately perform ocean color atmospheric correction and geophysical inversions ultimately dictated how OCI was built, operated, and tested.
Like its predecessors, OCI will provide 2 day global coverage of TOA radiances. Unlike its predecessors, OCI will cover a spectral range from 340 to 2,260 nm. Below 890 nm, OCI will include two spectrometers that continuously span the ultraviolet to 600 and 600 nm to near-infrared spectral regions to provide hyperspectral radiances sampled every 2.5 nm, with a bandwidth of 5 nm for each channel. Wavelengths above 900 nm are measured in seven discrete multispectral bands of varying bandwidths, six of which are at similar wavelengths to those on heritage missions to support both atmospheric and ocean color applications. Nominal spatial resolution is similar to the SeaWiFS instrument with 1,050 m at nadir. As for SeaWiFS, the pixel size increases due to a ∼20° tilt and as a function of scan angle. As also demonstrated by SeaWiFS, tilting the radiometer allows capture of ocean science pixels that would otherwise be unusable because of Sun glint contamination. Variations in the radiometric sensitivity of each OCI channel over time will be monitored by solar diffuser measurements for short term instrument gain adjustments (Meister and Eplee, 2018) and independent lunar measurements for trend adjustments of long time periods (e.g., 2 years or more, see Patt and Eplee, 2018), similar to the approach employed for the VIIRS instrument (Eplee et al., 2015).
NASA’s Goddard Space Flight Center is currently building the OCI flight unit. The Engineering Test Unit (ETU) was built mainly for engineering risk reduction purposes. The ETU contains most components of the flight unit, with notable exceptions including the tilt mechanism, the blue focal plane assembly (FPA), and the solar diffuser assembly (SDA). The ETU SWIR bands contain far fewer SWIR Detection Systems (SDS, see below) than the flight unit, but cover all spectral bands. The blue FPA is a critical component of OCI, the decision not to include it in the ETU was made for cost reasons. The red FPA was deemed more important than the blue FPA because the SNR requirements at 865 nm were a challenge during the design phase. It turned out that the two FPAs are so similar in design that having only one FPA in the ETU was not a significant technological development issue. The main drawback was that the light sources needed for UV testing are very different from those needed for wavelengths above 600 nm, so no experience was gathered testing light sources with a strong signal in the blue.
Another important benefit of an ETU is that it can be used to optimize the test campaign for the flight unit. A summary of the initial plan for the test campaign is provided in Meister et al., 2019. “First light” on the ETU was measured in January 2020. The OCI ETU completed its test campaign in May 2021. The campaign included ambient testing and two multiweek test periods with OCI in a large thermal vacuum (TVAC) chamber, the first focusing on the red FPA, the second on the SWIR bands. Testing was halted for several months in 2020 due to the COVID-19 pandemic. A considerable amount of ground support equipment (GSE) needed to be employed for the test campaign such as monochromatic and broadband light sources, integrating spheres, collimated light sources, GSE radiometers, the TVAC chamber, and a support structure that allowed OCI to be quickly moved into different orientations. The ETU test campaign allowed us to verify that all these types of GSE worked as expected or to resolve issues when necessary.
Although the basic design of ETU and flight unit remains the same, several important details of the flight unit were modified as a result of the ETU test results (e.g., the telescope aperture was increased from 90 to 93 mm to increase signal-to-noise ratio (SNR)). Therefore, results from the ETU test campaign are indicative of flight unit performance, but can differ significantly for certain performance parameters.
This paper focuses on providing radiometric test results from the ETU system level (i.e. fully assembled) test campaign. Details regarding the acquisition of the measurements will be provided in later publications that describe the flight unit test campaign. Section 2 provides an overview of the OCI instrument. Sections 3, 4 describe the test results from OCI measurements of an integrating sphere (monochromatic and white light, respectively). Section 5 contains results from OCI measurements of collimated light. A short summary is provided in section 6.
2 Description of OCI
A detailed description of OCI is provided in Gorman et al., 2019. Figure 1 illustrates the light path (yellow line) inside OCI. Light enters the telescope from the top left. The telescope consists of the primary mirror, depolarizer, and flat mirror, spinning at 5.7 Hz. The Half-Angle Mirror (HAM) rotates at half that rate. All subsequent components are stationary. The blue and red dichroics reflect the desired wavelengths to the blue FPA and red FPA, respectively. A grating disperses the wavelengths onto a CCD.
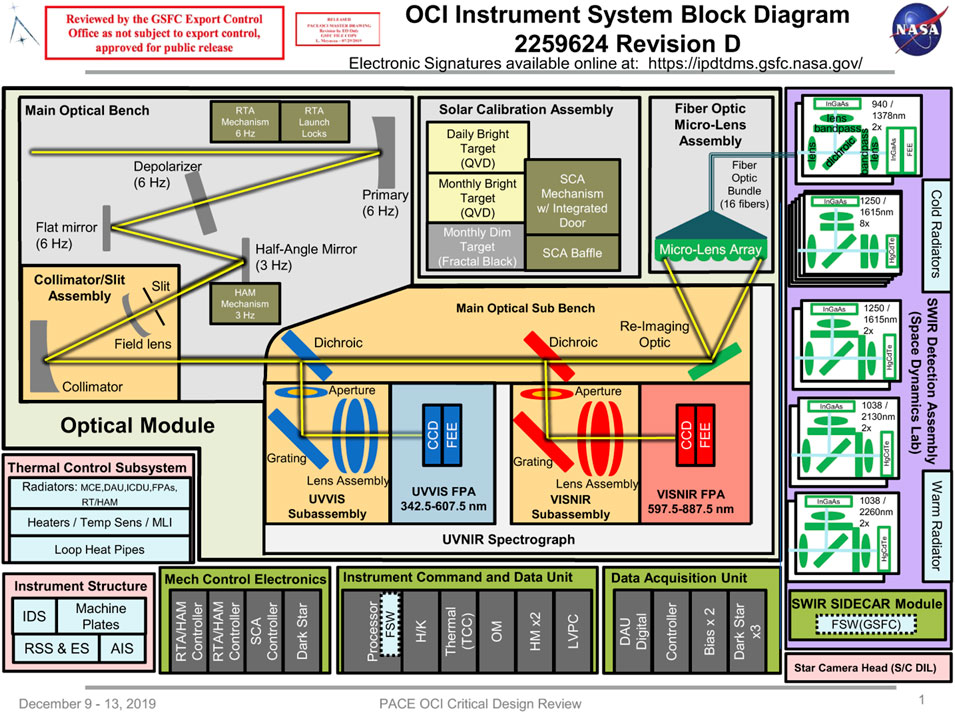
FIGURE 1. OCI flight unit optical path and main instrument components. The ETU does not include the UVVIS FPA, the full number of SDS units in the SWIR Detection Assembly, and the Solar Calibration Assembly.
Wavelengths above 900 nm are reflected via the Re-Imaging Optic to the Micro-Lens Array (MLA). The MLA consists of 16 lenses, each lens focusing light onto a fiber. The fiber carries the light to the SWIR Detection Assembly that contains 16 SWIR Detection Systems (SDS). Inside each SDS, a dichroic splits the light again. The transmitted and reflected light each go through a bandpass filter as shown on the right hand side of Figure 1, and is then detected by either an Indium-Gallium-Arsenide (InGaAs) detector (wavelengths below 1,500 nm) or a Mercury-Cadmium-Telluride (MCT) detector (wavelengths above 1,500 nm).
There are multiple SDS units for each band, e.g. two units for the 940 and 1,378 nm bands, as indicated in Figure 1. The signal from the various SDS units of the same wavelength is aggregated via time-delayed integration (TDI) to improve SNR performance. For the wavelengths 1,250 and 1,615 nm, OCI provides two radiance values: one acquired with standard gain (called 1250SG and 1615SG below), and one with high gain (1250HG and 1615HG). The high gain SDS units provide improved SNR, but saturate well below the maximum cloud radiances.
The CCDs on the blue and red FPA each have 512 pixels in the spectral direction and 128 pixels in the spatial (across track) direction. TDI is used in the spatial direction of the CCDs in the blue and red FPAs over 128 pixels, see section 2.3 in Gorman et al., 2019. After TDI, several physical pixels are aggregated by the Data Acquisition Unit (DAU) into a science pixel to reduce data volume. The threshold mode aggregates eight pixels in the spectral direction and eight pixels in spatial direction (a total of 64 physical CCD pixels) into one science pixel, covering ∼5 nm in wavelength and ∼1 km in the scan direction of an earth viewing scene. Each CCD is read out by 16 taps, with each tap reading 32 spectral pixels, covering a wavelength range of 20 nm. The spectral sampling after DAU aggregation can be increased by choosing a different aggregation mode, from the threshold 5 nm sampling to either 2.5, 1.25, or 0.625 nm.
For each spectral band, an OCI scan line contains about 1,250 science pixels, covering scan angles from about −56° to +56°. The rotation speed of the telescope is chosen so that consecutive scan lines are acquired with a spacing of ∼1 km in spacecraft track direction.
OCI provides its raw data (Level 0) in CCSDS (https://standards.nasa.gov/ccsds-standards) format. The Level 0 data is ingested by the Ocean Data Processing System (ODPS, see https://sciences.gsfc.nasa.gov/earth/oceanecology/content/uploadFiles/highlight_files/ODPS_Presentation.ppt) and processed into Level 1A (https://oceancolor.gsfc.nasa.gov/products/) format. The OCI data analysis is performed on the Level 1A data. Except for minor differences (mainly due to the OCI flight unit still being in development), this format is identical to the format of the OCI on-orbit data. This allows the ODPS to exercise its OCI processing code, reducing potential initialization issues during the commissioning phase of the PACE mission.
An equally important part of the prelaunch characterization data is the Ground Support Equipment (GSE) data. This data includes environmental measurements in the laboratory such as temperature and humidity, information on light sources (voltage, current, etc.), and measurements of light source intensity from GSE radiometers. This data is stored in a database developed at Goddard Space Flight Center called XINA. A real time data viewer associated with (but separate from) XINA is used to monitor both the OCI raw data and the GSE data, supporting real time decisions during OCI testing.
OCI instrument output (digital number ‘DN’, or ‘dn’ after background subtraction) will be converted to radiance (Lt) in the Level 1B (https://oceancolor.gsfc.nasa.gov/products/) code using the following calibration equation (similar to the SeaWiFS calibration, see Eq. 1 in Eplee et al., 2012):
with Lt = radiance measured in a hyperspectral or SWIR band (either test radiance in laboratory or TOA radiance on-orbit) K1 = absolute gain factor K2(t) = relative gain factor as a function of time t K3 = temperature correction factor T = instrument temperature measured at relevant locations Tref = reference temperature (used during thermal vacuum prelaunch characterization, close to expected on-orbit temperature) K4 (θ) = response versus scan angle correction factor θ= scan angle K5 = nonlinearity factor DN = digital number measured at a certain θ DN0 = average of ∼50 digital numbers measured during dark current collection (acquired once per scan) dn = DN–DN0
Corrections for polarization, straylight, and spectral out-of-band are applied in a later stage of the OCI processing code (at Level 2, see https://oceancolor.gsfc.nasa.gov/products/)). The algorithm for the polarization correction is provided in Meister et al., 2005. Correction algorithms for straylight and out-of-band have not been finalized yet, but will follow the approach described in Zong et al., 2007.
The characterization coefficients Ki are derived for each spectral band and for each HAM side. In most cases, HAM side differences are negligible, and the data shown in the sections below is shown for one HAM side only or averaged over the two HAM sides.
The main purpose of the OCI prelaunch characterization campaign is to measure the OCI performance and evaluate its performance relative to the OCI requirements. Key radiometric requirements for OCI are provided in Table 1. They were derived from the PACE mission requirements, and are to a large part adapted from requirements suggested in Meister et al., 2011. Note that during the ETU phase of the OCI development, the OCI radiometric requirements were kept in draft form, a consequence of the “design to cost” approach adopted for the PACE mission, see Werdell et al., 2019.
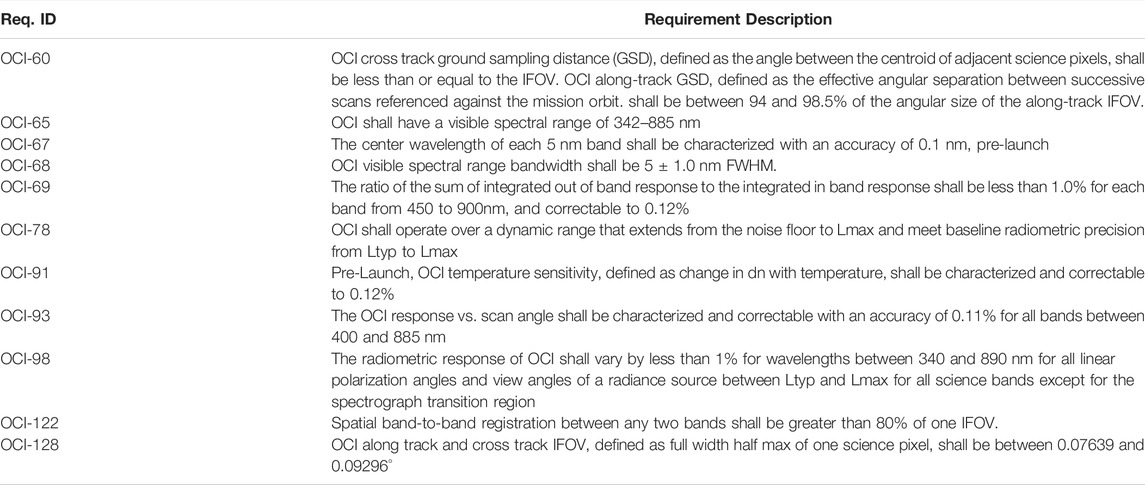
TABLE 1. Key OCI radiometric requirements discussed in this paper for the OCI ETU red FPA spectral range. SNR requirements are provided in Table 2.
3 Characterization of OCI With Monochromatic Illumination
OCI is a hyperspectral radiometer from 340 to 890 nm, therefore its spectral characterization is a very high priority. The main source for OCI spectral characterization is the ‘Goddard Laser for Absolute Measurement of Radiance‘ (GLAMR), a tunable laser system that provides monochromatic radiance over a wide range of wavelengths (Barsi et al., 2018; McAndrew et al., 2018). The laser light is fed via fibers into an integrating sphere to provide a spatially homogeneous radiance field. The radiance exiting the sphere is calibrated via transfer radiometers calibrated at NIST (Woodward et al., 2018). A detailed report of the OCI GLAMR measurements is provided in Kitchen-McKinley et al., 2021. The basic quantity provided by the GLAMR measurements is the Absolute Spectral Response (ASR), defined as the ratio of the dn measured by OCI divided by the radiance provided by GLAMR. The relative spectral response (RSR) is the ASR normalized to its maximum. An example is shown in Figure 2.
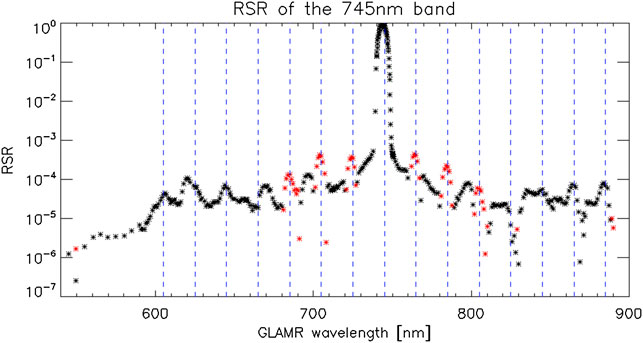
FIGURE 2. Relative Spectral Response (RSR) of the 745 nm band. Black stars are positive, red stars negative values. The blue dashed lines indicate wavelengths where crosstalk between the taps of the CCD is expected.
There are several negative RSR values shown in Figure 2. The negative values are due to electronic crosstalk between taps of the CCD. This type of crosstalk can be either positive or negative, it was initially discovered during component level measurements of the red FPA. The three taps to the left and right of 745 nm show negative crosstalk, several of the taps further away show positive crosstalk. The magnitude of the crosstalk was reduced for the flight unit by modifying the procedure for backside thinning of the CCD.
The RSR of OCI is used to derive several important spectral characteristics of the OCI bands, such as band center wavelength, bandwidth, and out-of-band ratio (see Kitchen-McKinley et al., 2021, for exact definitions of these quantities). A key quantity is the band center wavelength. The OCI specifications require that band center wavelengths cover the wavelength range from 342 to 885 nm, and that the bands are spaced 5 nm ± 0.5 nm apart. The OCI design predicted the band center wavelengths, these predictions are referred to as ‘nominal wavelengths’. Figure 3 shows that the measured band center wavelengths agree well with the nominal wavelengths. Note that there is no specific OCI requirement for these two quantities to agree well, but the good agreement is an indication that the OCI ETU was built as designed.
FIGURE 3. Difference of the measured center wavelength to the nominal wavelength (5 nm sampling interval) for the bands on the red FPA, HAM side A (black stars) and HAM side B (red diamonds). Blue dashed lines indicate CCD tap boundaries. No significant anomalies are seen at the tap boundaries.
Figure 3 shows implicitly that the red FPA of OCI provides a sufficient range to cover the wavelengths from 600 to 885 nm (on the flight unit, the blue FPA will provide hyperspectral bands from 310 to 605 nm, and a hyperspectral band at 890 nm not shown in Figure 3). The difference of adjacent center wavelengths varies between 4.74 and 5.1 nm (the maximum difference between adjacent data points in Figure 3 is 0.26 nm), well within the requirement of 5 nm ± 0.5 nm. The estimated uncertainty of the measured center wavelengths is better than 0.05 nm (at constant temperature; for thermal impacts, see section 4).
The measured bandwidth (FWHM (full width half maximum) of the peak in Figure 2) for the red FPA bands follows the model predictions, increasing from 4.9 nm at 615–5.1 nm at 885 nm. The measured bandwidth is well within the requirement of 5 nm ± 1 nm.
The out-of-band (OOB) ratio is the ratio of the integral of the out-of-band response (RSR values less than 0.01 in Figure 2) to the integral of the in-band response (RSR values greater than 0.01 in Figure 2). The measured OOB ratio of the red FPA hyperspectral bands is below the requirement of 1.0%, see Figure 4. The first measured value in Figure 4 is at 600 nm, in the blue dichroic transition region. In this region, part of the light is directed to the blue FPA, part to the red FPA. The requirements are waived in this region.
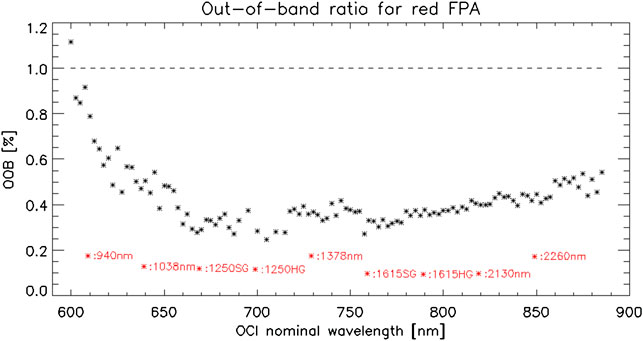
FIGURE 4. Measured OOB response (black stars) for the red FPA bands at 2.5 nm sampling. Requirement is shown as a dashed line. Red stars show the OOB response for the SWIR bands (arbitrary values on the abscissa, correct values on the ordinate).
Figure 4 also shows that the OOB ratios for the SWIR bands are even lower than those of the red FPA bands. This is due to the spectral band filters of the SWIR bands, the red FPA uses a grating for wavelength separation.
Integrating the absolute spectral response (ASR) over wavelength yields the OCI radiometric gain (inverse of K1). The results are shown in Figure 5. The high K1 values around 600 nm are due to the blue dichroic transition region, where a significant fraction of the spectrum is diverted to the blue FPA. The low K1 values (high radiometric gains) for the spectral bands from 660 to 715 nm were designed to increase SNR for that wavelength range to support fluorescence line height algorithms (Behrenfeld et al., 2009).
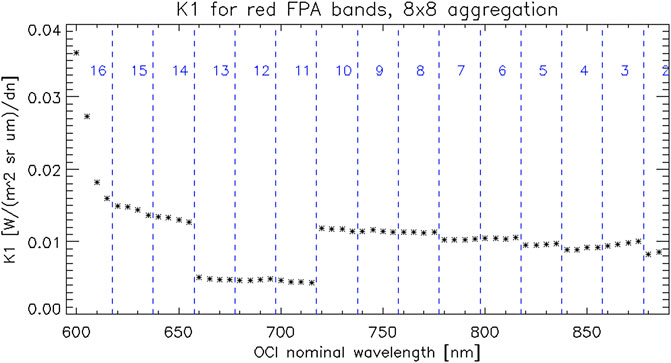
FIGURE 5. K1 for the red FPA bands, calculated from GLAMR data. Data shown above was processed with 8 × 8 aggregation, i.e. 5 nm spectral sampling. The blue numbers/dashed lines show the CCD tap numbers/boundaries.
4 Characterization of OCI With White Light
Monochromatic light is not needed for the measurement of many OCI characterization parameters, including SNR, saturation radiances, response-versus-scan (RVS), polarization sensitivity, temperature sensitivity, linearity, and temporal stability. In these cases, a “white” (or rather: spectrally continuous) light source can be used to achieve a considerable reduction in measurement time. The OCI test campaign used various combinations of halogen and plasma lamps to achieve the desired radiance intensities, because no single lamp can provide adequate intensity at all OCI wavelengths. Theses lamps are installed into a 20″ integrating sphere with an 8″ exit aperture to provide a spatially homogeneous and Lambertian radiance field. Most of the red FPA characterizations were performed with a single 150 W halogen lamp. The blue FPA on the flight unit will require more radiance in the UV than the halogen lamps can provide. A laser driven light source (EQ-400 from Energetiq [https://www.energetiq.com/ldls-eq400-laser-driven-light-source-broadband] will be used together with a halogen lamp for the flight unit characterization, providing a radiance of about 80 W/(m^2 sr um) at 340 nm, similar to the typical TOA radiance from an open ocean scene.
One of the most important parameters of an imaging radiometer is its SNR. It is calculated by dividing the mean of the measured dn by the standard deviation. The measurements are performed at different radiance levels of the 20″ integrating sphere. For OCI, multispectral bands of various bandwidths were used in the SNR requirement definition to allow comparisons to heritage sensors such as SeaWiFS, MODIS, and VIIRS. Table 2 compares the SNR of the multispectral bands of the red FPA measured at nominal temperature to the threshold requirement, showing significant margin of at least 40%. The variation of the SNR from minimum to maximum operational temperature was less than 5%.
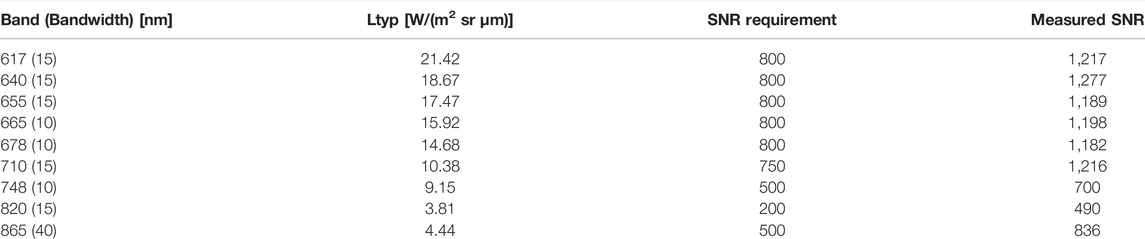
TABLE 2. OCI ETU SNR at typical radiances (Ltyp). The threshold SNR requirements are met with large margins for the red FPA. Baseline requirements (not shown) are marginal for the 665 and 678 nm bands. SNR of the multispectral bands are calculated by combining signal and noise from several 5 nm bands, determined by the bandwidth of the multispectral band.
Note that the higher gains around 670 nm (low K1 in Fig. C) do not lead to very large SNR values for the multispectral bands at 665 and 678 nm relative to the neighboring bands, because the bandwidth of these two bands is only 10nm, compared to the 15 nm bandwidth of the neighboring bands.
The SWIR band SNR of the ETU cannot be compared directly to the requirement because the ETU contains only a fraction of the SWIR detectors of the flight unit, and therefore the ETU SWIR SNR does not benefit from TDI. Based on ETU SWIR single detector SNR measurements, the flight unit SWIR bands will have sufficient SNR margin as well.
Figure 6 shows the SNR of the 865 nm multispectral band (40 nm wide) versus radiance level. The SNR values provided in table 2 are derived by interpolating between adjacent radiance levels to Ltyp. Note the extremely high SNR at high radiance levels. The high SNR at high radiances for the 865 nm band is due to 1) the SNR requirement is defined at the very low typical TOA radiance (Ltyp) of an open ocean scene (Ahmad and Meister, 2018), and SNR increases for most types of sensors (OCI is shot noise limited at high radiance levels), and 2) OCI needs to have a high dynamic range to allow both ocean color (low radiances) and cloud (high radiances) applications.
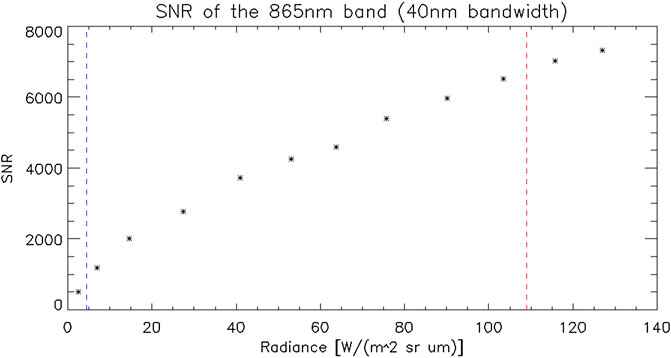
FIGURE 6. SNR at 865 nm (40 nm bandwidth) as a function of radiance. The dashed blue horizontal is the typical TOA radiance for open ocean, the dashed red line is a preliminary estimate of the radiance from the solar diffuser. The maximum radiance of a white cloud at 865 nm is ∼300 W/(m2 sr μm), beyond the scale of this plot.
The measured saturation radiances are shown in Figure 7. From 660 to 715 nm, the required saturation levels were lowered from maximum cloud radiances (Lmax, see Ahmad and Meister, 2018, for the derivation of Lmax) to lower values (Lclip), in order to provide higher SNR at low radiance levels by increasing the gains for these bands (see Figure 5 above), which is needed for the phytoplankton fluorescence product (Behrenfeld et al., 2009). Lclip is sufficiently high to allow measuring unsaturated radiances for any non-cloudy ocean scene.
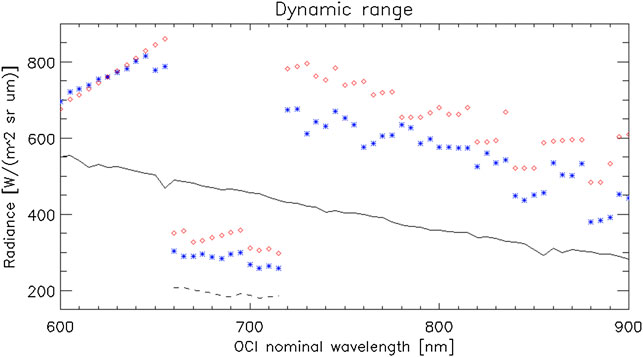
FIGURE 7. OCI red FPA dynamic range. Blue stars above 645 nm show saturated measurements due to light sources providing radiances above Lmax (solid line) or Lclip (dashed line). Blue stars below 650 nm show unsaturated measurements, no available light source was bright enough to saturate those bands (i.e. saturation occurs above these levels). The red diamonds show saturation derived from ‘progressive TDI’ (a special type of data aggregation mode described in McIntire et al., 2021; it does not require bright light sources to achieve saturation) measurements. Saturation in the ETU was higher than expected, so the measured light levels were suboptimal for determining exact saturation levels, explaining at least part of the difference between the two methods.
OCI ETU saturation levels are above Lmax/Lclip for all bands, including SWIR bands (not shown). The large margin of the saturation radiance relative to Lmax/Lclip shown in Figure 7 allowed the OCI engineering team to increase the telescope aperture for the flight unit to improve SNR.
Response versus scan (RVS, modelled by K4 in the calibration equation) describes how the instrument response (measured dn) to a constant light source changes as a function of scan angle. It is measured by rotating OCI around its telescope rotation axis, while the position of the light source (the 20″ integrating sphere) remains fixed. OCI is positioned on a rotating table (Figure 8) called GAToR (GSE Application for Tilt or Rotation).
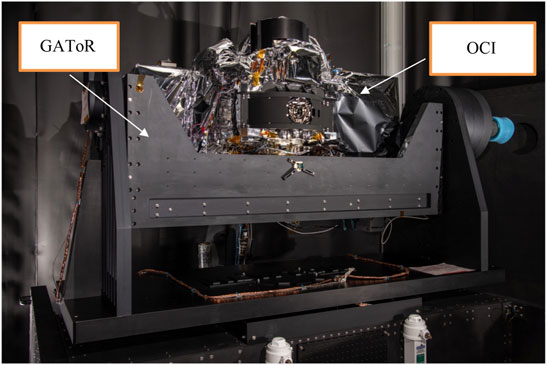
FIGURE 8. OCI ETU on the ‘GSE Application for Tilt or Rotation’ (GAToR). The calibration light source (IS) illuminates OCI from the viewer’s perspective. GAToR allows OCI to be rotated around the vertical and horizontal axis.
The measured RVS are shown in Figure 9. The results did not meet expectations for the SWIR bands, where a significant increase with scan angle was found. The root cause was a misalignment of the fiber relative to the MLA lenses. Improvements to the alignment procedure will eliminate this issue for the flight unit.
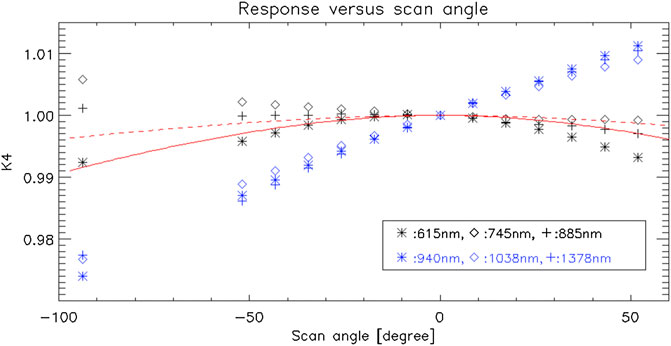
FIGURE 9. Response versus scan angle at six different wavelengths. The SWIR bands (blue symbols) show an unexpected almost linear increase versus scan angle. The data is normalized to 1.0 at 0° scan angle. The measurement at −93° is at the solar diffuser view angle, outside of the regular earth view. The red solid line is the RVS model prediction for 615nm, the red dashed line for 940 nm.
The RVS of the red FPA bands was similar to model predictions based on reflectance measurements of the HAM. However, the ETU system level measurements were slightly less symmetric around 0° scan angle than expected, trending lower towards positive scan angles, see black symbols in Figure 9. The root cause for this trend is still under investigation, it is so small that both measurement artifacts and real instrument characteristics need to be considered. The red lines in Figure 9 show model predictions based on component level directional reflectance measurements of the HAM. The measurements for 615 nm agree rather well with the model predictions for negative scan angles, but are clearly too low at +50°.
OCI polarization sensitivity as a function of scan angle was measured similarly to RVS (OCI was mounted on GAToR, looking at the stationary 20 inch integrating sphere at various scan angles). A rotating polarizer was placed between OCI and the sphere, and the polarizer was rotated to provide linearly polarized light from 0 to 360° polarizer angle in 15° intervals. The polarization sensitivity is shown in Figure 10 as a function of the polarizer angle. The polarizer was fully rotated twice, the second rotation corresponds to the angles 360–720°. The measurements follow the expected two cycle curve every 360°, but the amplitude of the second cycle (peak around 330°) is smaller than the first one (peak around 150 deg). A linear gradient in the polarizer transmission can explain this effect, which was confirmed by measurements with a GSE radiometer, see section 11 in Waluschka et al., 2021.
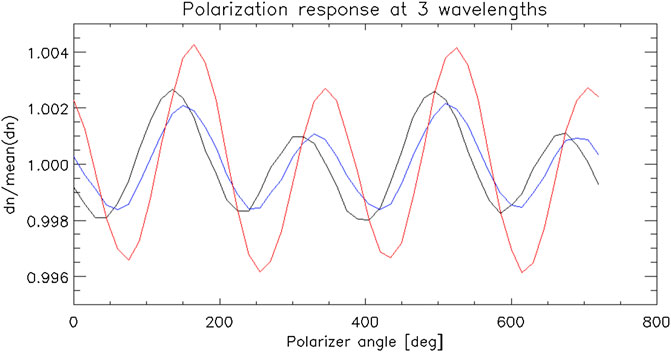
FIGURE 10. Polarization response as a function of polarizer angle at 3 wavelengths: 630 nm (blue), 880 nm (black), and 890 nm (red). The polarizer was rotated by 360° twice, the data is displayed consecutively from 0 to 720°.
The amplitude of the two cycle curve is called the polarization amplitude (for a formal definition, see Eq. 13 in Meister et al., 2005). The polarization amplitude for all wavelengths of the red FPA is less than 0.4%, see Figure 11, below the requirement of 1%. The dependence of the polarization amplitude on scan angle is very small, below 0.2% (not shown). The cyclical pattern seen in Figure 11 for higher wavelengths was qualitatively predicted by a model of the depolarizer. Around 600 nm, the polarization amplitude is influenced by the dichroic. The polarization amplitudes for the SWIR bands are all below 1% (not shown). A detailed report of the OCI ETU polarization measurements is provided in Waluschka et al., 2021.
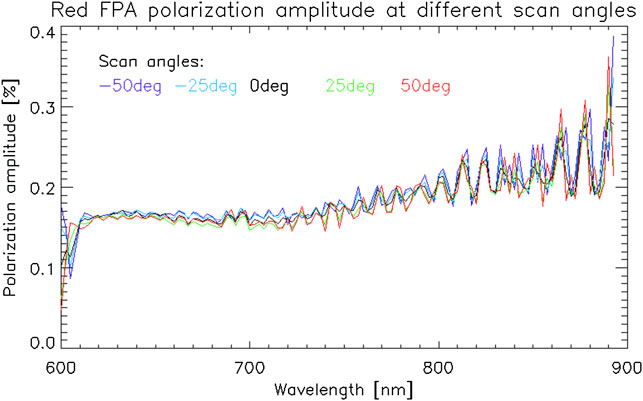
FIGURE 11. Polarization amplitude as a function of wavelength at five different scan angles, sampled every 2.5 nm.
The temperature sensitivity of OCI was characterized during the first thermal vacuum (TVAC) campaign in spring 2020. OCI was placed in a TVAC chamber that allowed precise control of the temperature of different parts of the OCI instrument. The results showed a variation of the measured OCI dn in response to a constant radiance source of up to 1.3% over the measured temperature range. The expected variation of on-orbit temperatures is only a fraction of the measured range, so the expected on-orbit sensitivity is much smaller than 1.3%. The uncertainty after correction for temperature sensitivity is less than 0.1%. It increases to 0.4% at 600 nm. This wavelength is in the transition region from the red FPA to the blue FPA, resulting in higher measurement uncertainties from 590 to 610 nm.
A slight wavelength shift is expected for the hyperspectral bands as a function of temperature due to the grating. Over the whole measured temperature range, the change was about 0.25 nm for the red FPA. The expected on-orbit change is about 0.1 nm. Unlike the other variations discussed in this paper, there are currently no plans to correct this spectral shift on-orbit.
5 Characterization of OCI Spatial Resolution
The test data described in the previous two sections were acquired by scanning across the aperture of an integrating sphere, providing a homogeneous light field more than 50 science pixels in diameter. To characterize the spatial resolution of OCI, well defined light patterns were produced with the LSF (line spread function) bench.
A diagram of the LSF bench is shown in Figure 12 below. Light is fed into a small integrating sphere with a 2 inch aperture via a fiber cable. An 8 inch off-axis parabola (OAP) collimates the light from the sphere and directs it towards OCI. Scene masks can be inserted between the OAP and the sphere, producing different light patterns. An example of a scene mask is shown in Figure 13. The single science pixel mask produces an image that corresponds to the light field OCI would see on-orbit if a square area of 1 km times 1 km was illuminated, surrounded by darkness.
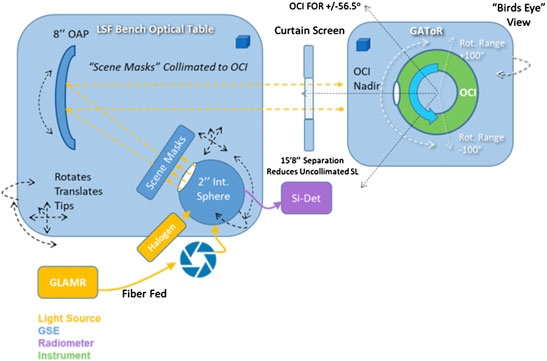
FIGURE 12. Setup of the LSF bench for ambient testing.
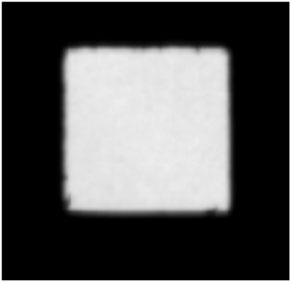
FIGURE 13. Image of “1 science pixel mask”, taken with a digital camera from OCI’s point of view.
For a single science pixel mask, the OCI pixel sampling along the scan is unlikely to obtain a measurement with one science pixel fully illuminated. Instead, partial illumination even for the highest reading is most likely, leading to higher uncertainties in the data analysis. The sampling is very stable from scan to scan, so measuring over a long period of time does not reduce the partial illumination issue. Fortunately, OCI has the capability to temporally delay data acquisition of the (unaggregated) CCD pixels for every scan by fractions of a science pixel (the smallest delay step possible is 1/32nd of a science pixel). The temporal delay causes the pixel to be acquired later in the scan. By using a series of consecutive delays (e.g. 1/32, 2/32, 3/32, etc.), one of the delay steps will produce a near perfect alignment of the along scan pixel sampling with the one science pixel light source, eliminating the problem of partial illumination. These delay steps also allow to map the up and down ramps towards/from the maximum signal, allowing a precise determination of the FWHM of the response in the along scan dimension. Unfortunately, this mode also increases measurement time significantly, so this mode was not used for all LSF bench measurements.
The area seen by an OCI science pixel is described by the instantaneous field-of-view (IFOV). The results for scanning across the one science pixel mask with time delay are shown in Figure 14. The hyperspectral bands show a more rectangular shape than the SWIR bands, whose shape is more Gaussian like in heritage sensors such as SeaWiFS or MODIS. The reason is that the hyperspectral bands are composed of the aggregation of eight physical pixels, providing a steeper slope at the edges of the IFOV. The IFOV in scan direction of the SWIR bands is a little wider, and the tails of the response are significantly larger. This fundamental difference between the hyperspectral bands and the SWIR bands should be taken into account when evaluating the performance of algorithms for science products that use both SWIR and lower wavelengths, especially in scenes with large pixel-to-pixel variability.
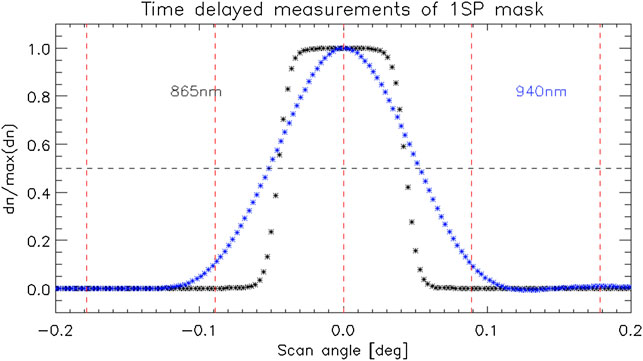
FIGURE 14. OCI measurements of a one science pixel wide mask using time delay stepping with step size 1/32 of a science pixel. Data was recentered to 0° for plotting purposes. The IFOV in scan direction is calculated as the FWHM (intersection of the measured data and the horizontal dashed line). The vertical dashed lines indicate the GSD in scan direction for scale.
For the ETU, the IFOV measurements were made with a one science pixel mask, because the IFOV requirement is based on the FWHM of the OCI response to a one science pixel wide source. However, it was later discovered that the exact size of the source width as provided by the mask is a significant uncertainty contribution to the IFOV calculation when using a one science pixel mask. The OCI team is planning to measure the IFOV for the flight unit with a much thinner mask (e.g. One physical pixel wide), which is expected to result in a reduced uncertainty in the IFOV calculation.
The ground sampling distance (GSD) is the distance between the centers of adjacent IFOVs. GSD was measured with special masks (having multiple slits separated by a known angular distance, e.g. by the angular equivalent of two IFOV) and by measuring a single slit mask at different rotation angles of the telescope. The vertical dashed lines in Figure 14 indicate the GSD in scan direction (0.0892°). The GSD of the ETU was slightly higher than desired (by about 2%), and will be adjusted for the flight unit.
In order to obtain the IFOV in track direction, OCI was tilted in small angular increments in along track direction using GAToR. The results are shown in Figure 15 close to nadir scan angle. The IFOV in along track direction derived from these measurements is 0.083 deg, within the required range from 0.076 to 0.093 deg.
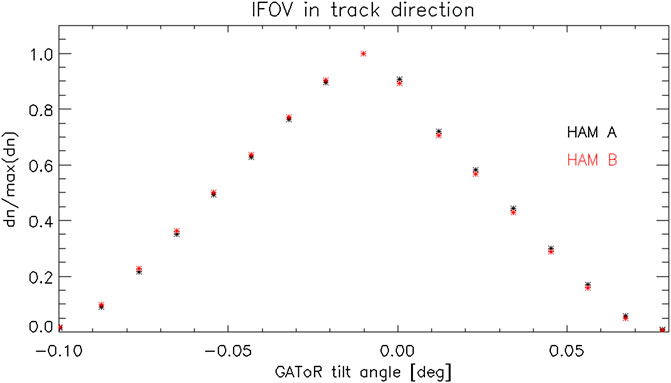
FIGURE 15. Measurements to determine along track IFOV for 865 nm. The light source for these measurements was monochromatic light.
Figure 15 shows that the two HAM sides are slightly shifted relative to each other (HAM B is higher on the left side, lower on the right side). This results from the HAM faces not being perfectly parallel with the rotation axis, causing a small along-track shift in the view direction that is opposite in sign for the two sides. This shift will be taken into account in the geolocation processing (Patt, 2018) for the on-orbit data. It is so small that it does not significantly impact along-track sampling homogeneity.
The band-to-band registration (BBR) describes the overlap of the IFOVs of two spectral bands. The OCI requirement is that the areas imaged by any two spectral bands overlap by at least 80%. Overlap is calculated by evaluating the location of the centroids of the band’s IFOV relative to each other (different IFOV shapes are ignored by the current analysis). By design, OCI has excellent overlap in track direction, but the timing of signal acquisition can vary significantly by band due to electronic delays specific to each detector type, resulting in poor BBR in scan direction.
The BBR in scan direction for just the red FPA is within the desired range, see Figure 16. However, there are significant differences within the SWIR bands regarding the timing of signal acquisition. These variations were confirmed by modeling the SWIR electronics, they are an intrinsic feature of the current design and cannot be modified for the flight unit. For flight, both the red and blue FPA readout timing will be adjusted. The mean readout time for each FPA can be shifted accurately; e.g. the mean value for the red FPA bands can be shifted from the current value of 21.37 in Figure 16 to 21.05, the mean value of the SWIR bands. This means a majority of the SWIR bands (and all the blue and red FPA bands) will meet the BBR requirement, but a few SWIR bands will not meet the BBR requirement.
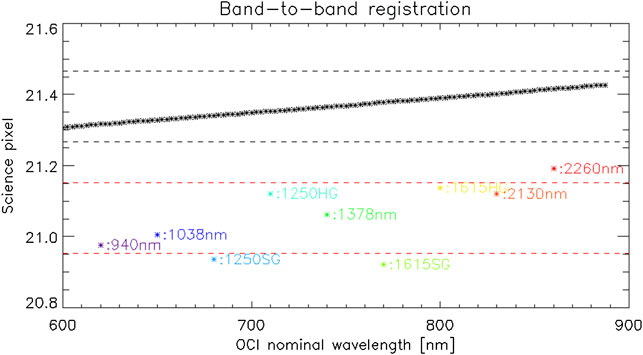
FIGURE 16. Centroid of IFOV of the red FPA as a function of wavelength. Additionally, the colored stars show the centroids of the SWIR bands (arbitrary values on the abscissa, correct values on the ordinate). The dashed lines indicate the maximum allowable range to meet the band-to-band registration requirement for the red FPA (black lines) and the SWIR FPA (red lines).
An important aspect of any ocean color sensor is its performance in high contrast scenes, because dark ocean scenes are typically mixed with bright clouds. Figure 17 shows the logarithmic response of several bands to a bright one science pixel mask. It can be seen that the SWIR bands show significant hysteresis. Modeling of the SWIR detectors and electronics confirmed that such a behavior should be expected, solely due to detector characteristics and the choice of capacitors and resistances in the readout electronics, optical scattering is not contributing significantly to this behavior. Although the hysteresis effect is small for a single pixel source, extended cloud fields will compound the hysteresis effect for subsequently measured ocean pixels. Additional measurements with different mask widths and at different radiance levels showed that the effect is cumulative, linear, and highly predictable. A correction algorithm was developed that is expected to reduce the impact of SWIR band hysteresis to acceptable values. A NASA Technical Memorandum describing the correction will be published on the PACE website after the OCI flight unit characterization is complete.
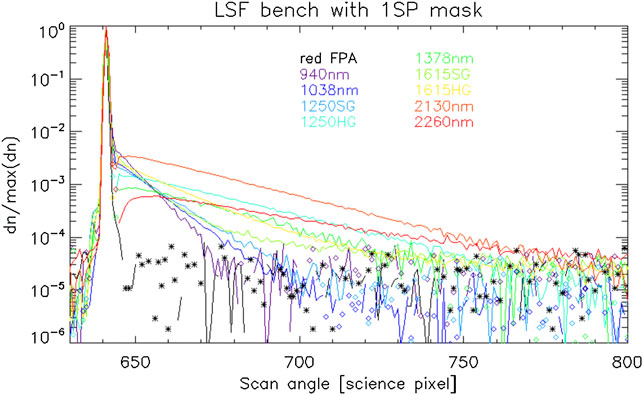
FIGURE 17. Normalized response of SWIR bands to a one science pixel source (at pixel # 641). Red bands are represented by only one band (black line/symbol), to illustrate acceptable hysteresis. Solid lines show positive values, symbols negative values. For a noise dominated response, positive and negative values are equally likely after offset subtraction. All SWIR bands show clear hysteresis.
6 Summary
The results of the OCI ETU test program presented in this paper strongly confirm our expectation that the OCI flight unit will be able to measure highly accurate radiances to support the advanced science algorithms of the PACE mission. Key parameters such as SNR, spectral bandwidth, and spatial resolution were within requirements. The most significant problem discovered during ETU testing was SWIR band hysteresis. A correction algorithm has been developed for this artifact. Additionally, some of the SWIR bands will not meet the band-to-band registration requirement. This deviation was deemed acceptable by the PACE science team.
There were no requirements that the ETU shall meet any of the flight unit performance goals, but the excellent performance of the OCI ETU gives us confidence that the OCI flight unit will perform as predicted. Although we expect that adding the blue FPA will add challenges to the execution of the test program because radiances down to 350 nm are notoriously difficult to deal with, the success of the ETU program (covering wavelengths from 600 to 2,250 nm) is highly encouraging.
In the early stages of the PACE mission, it was discussed whether to skip the build of an ETU and proceed directly to building the flight unit. This was considered in order to save cost, schedule, and because a laboratory prototype (McClain et al., 2012) had already been built. In retrospect, the decision to build an ETU was critical to building a flight unit that meets the PACE performance requirements, due to numerous engineering lessons learned during building the ETU and lessons based on ETU performance evaluations. In addition, the ETU test program allowed the test team to practice and optimize test procedures and data analysis approaches, resulting in valuable schedule savings for the flight unit test program. Two of the most critical design changes implemented for the flight unit based on ETU lessons were the increase of the OCI telescope aperture to increase SNR, and the removal of a subsystem level heater (the heater provided only marginal benefit for thermal stability, but its operation impacted the OCI radiometric stability).
Data Availability Statement
The datasets presented in this study can be found in online repositories. The names of the repository/repositories and accession number(s) can be found below: The datasets (L0 and L1A) analyzed for this study can be obtained by request from NASA's Ocean Biology Distributed Active Archive Center, see https://earthdata.nasa.gov/eosdis/daacs/obdaac, or downloaded directly via https://oceancolor.gsfc.nasa.gov/cgi/mission_quality_monitor?mission=PACE_OCI. This website also provides the OCI flight unit data, starting January 2022. If needed, please contact the main author of this paper for further download instructions.
Author Contributions
GM wrote the first draft of the manuscript. Data for plots were provided by SK-M, JM, and HC. All authors contributed to the OCI ETU test program and to manuscript revision, read, and approved the submitted version.
Funding
This work was funded by the NASA PACE mission.
Conflict of Interest
GM is employed by NASA. LC is employed by Science Systems and Applications. HC is employed by Global Science and Technology. NC is employed by Telophase Corporation. RE is employed by Science Applications International corporation. UG is employed by KBR. BT is employed by Microtel. EW is employed by Stellar Solutions.
The remaining authors declare that the research was conducted in the absence of any commercial or financial relationships that could be construed as a potential conflict of interest.
Publisher’s Note
All claims expressed in this article are solely those of the authors and do not necessarily represent those of their affiliated organizations, or those of the publisher, the editors and the reviewers. Any product that may be evaluated in this article, or claim that may be made by its manufacturer, is not guaranteed or endorsed by the publisher.
Acknowledgments
We would like to thank the OCI Integration and Test team for their perseverance during the difficult period of the COVID-19 pandemic, and two reviewers for their valuable comments.
References
Ahmad, A., and Meister, G. (2018). “Ltyp and Lmax Calculations for PACE Ocean Color Instrument,” in PACE Technical Report Series. NASA/TM-2018-219027/Vol. 7, chapter 8.
Barsi, J., McCorkel, J., McAndrew, B., Zukowski, J. B., Shuman, T., Johnston, S., et al. (2018). Spectral Testing of the Landsat 9 OLI-2 Instrument Using the Goddard Laser Absolute Measurement of Radiance (GLAMR). Earth Obs. Syst. XXIII, 10764. Proceedings of SPIE. doi:10.1117/12.2321192
Behrenfeld, M. J., Westberry, T. K., Boss, E. S., O'Malley, R. T., Siegel, D. A., Wiggert, J. D., et al. (2009). Satellite-detected Fluorescence Reveals Global Physiology of Ocean Phytoplankton. Biogeosciences 6 (5), 779–794. doi:10.5194/bg-6-779-2009
Bracher, A., Bouman, H. A., Brewin, R. J. W., Bricaud, A., Brotas, V., Ciotti, A. M., et al. (2017). Obtaining Phytoplankton Diversity from Ocean Color: a Scientific Roadmap for Future Development. Front. Mar. Sci. 4. doi:10.3389/fmars.2017.00055
Bracher, A., Vountas, M., Dinter, T., Burrows, J. P., Röttgers, R., and Peeken, I. (2009). Quantitative Observation of Cyanobacteria and Diatoms from Space Using PhytoDOAS on SCIAMACHY Data. Biogeosciences 6, 751–764. doi:10.5194/bg-6-751-2009
Catlett, D., and Siegel, D. A. (2018). Phytoplankton Pigment Communities Can Be Modeled Using Unique Relationships with Spectral Absorption Signatures in a Dynamic Coastal Environment. J. Geophys. Res. Oceans 123, 246–264. doi:10.1002/2017jc013195
Coddington, O. M., Vukicevic, T., Schmidt, K. S., and Platnick, S. (2017). Characterizing the Information Content of Cloud Thermodynamic Phase Retrievals from the Notional PACE OCI Shortwave Reflectance Measurements. J. Geophys. Res. Atmos. 122 (15), 8079–8100. doi:10.1002/2017jd026493
Eplee, R. E., Meister, G., Patt, F. S., Barnes, R. A., Bailey, S. W., Franz, B. A., et al. (2012). On-orbit Calibration of SeaWiFS. Appl. Opt. 51, 8702–8730. doi:10.1364/ao.51.008702
Eplee, R. E., Turpie, K. R., Meister, G., Patt, F. S., Franz, B. A., and Bailey, S. W. (2015). On-orbit Calibration of the Suomi National Polar-Orbiting Partnership Visible Infrared Imaging Radiometer Suite for Ocean Color Applications. Appl. Opt. 54 (8), 1984–2006. doi:10.1364/ao.54.001984
Fernandez Borda, R. A., Martins, J. V., McBride, B., Remer, L. A., and Barbosa, H. M. (20182018). “Capabilities of the HARP2 Polarimetric Sensor on the PACE Satellite,” in AGU Fall Meeting Abstracts, OS11D–1431.
Gorman, E., Kubalak, D. A., Deepak, P., Dress, A., Mott, D. B., Meister, G., et al. (2019). The NASA Plankton, Aerosol, Cloud, Ocean Ecosystem (PACE) Mission: an Emerging Era of Global, Hyperspectral Earth System Remote Sensing. Sensors, Syst. Next-Generation Satell. XXIII, 11151 111510G. doi:10.1117/12.2537146
Hasekamp, O. P., Fu, G., Rusli, S. P., Wu, L., Di Noia, A., Brugh, J. a. d., et al. (2019). Aerosol Measurements by SPEXone on the NASA PACE Mission: Expected Retrieval Capabilities. J. Quantitative Spectrosc. Radiat. Transf. 227, 170–184. doi:10.1016/j.jqsrt.2019.02.006
Hu, C., Feng, L., Lee, Z., Franz, B. A., Bailey, S. W., Werdell, P. J., et al. (2019). Improving Satellite Global Chlorophyll a Data Products through Algorithm Refinement and Data Recovery. J. Geophys. Res. Oceans 124 (3), 1524–1543. doi:10.1029/2019jc014941
IOCCG (2006). Remote Sensing of Inherent Optical Properties: Fundamentals, Tests of Algorithms, and Applications. Dartmouth, NS: IOCCG.
Kitchen-McKinley, S., McIntire, J., Choi, H., and Meister, G. (2021). PACE OCI Pre-launch ETU Spectral Characterization and Performance. Earth Obs. Syst. XXVI 11829, 118290Q. International Society for Optics and Photonics. doi:10.1117/12.2594306
McAndrew, B., McCorkel, J., Shuman, T., Zukowski, B., Traore, A., Rodriguez, M., et al. (2018). “Goddard Laser for Absolute Measurement of Radiance for Instrument Calibration in the Ultraviolet to Short Wave Infrared,” in Conference on Lasers and Electro-Optics, San Jose, CA.
McClain, C. R., Behrenfeld, M., Wilson, M., Monosmith, B., Quijada, M., Meister, G., et al. The Ocean Radiometer for Carbon Assessment (ORCA): Development History within an Advanced Ocean Mission Concept, Science Objectives, Design Rationale, and Sensor Prototype Description, NASA/TM-2012-215894, Goddard Space Flight Center, Md., 55p., 2012.
McIntire, J., Kitchen-McKinley, S., Choi, H., and Meister, G. (2021). Progressive TDI Measurements with the PACE OCI ETU. Earth Obs. Syst. XXVI 111829, 118290S. International Society for Optics and Photonics. doi:10.1117/12.2594239
Meister, G., McClain, C. R., Ahmad, Z., Bailey, S. W., Barnes, R. A., Brown, S., et al. Requirements for an Advanced Ocean Radiometer, NASA/TM-2011-215883, Goddard Space Flight Center, Md., 40p., 2011.
Meister, G., and Eplee, R. E. (2018). “Strategy and Requirements for the PACE OCI Solar Diffuser Calibration,” in PACE Technical Report Series. NASA/TM-2018-219027/Vol. 7, chapter 6.
Meister, G., Knuble, J. J., Cook, W. B., Gorman, E. T., and Werdell, P. J. (2019). Calibration Plan for the Ocean Color Instrument (OCI) Engineering Test Unit. Sensors, Syst. Next-Generation Satell. XXIII 11151 111511W. doi:10.1117/12.2550820
Meister, G., Kwiatkowska, E. J., Franz, B. A., Patt, F. S., Feldman, G. C., and McClain, C. R. (2005). Moderate-Resolution Imaging Spectroradiometer Ocean Color Polarization Correction. Appl. Opt. 44 (26), 5524–5535. doi:10.1364/ao.44.005524
Mobley, C. D., Werdell, J., Franz, B., Ahmad, Z., and Bailey, S. (2016). Atmospheric Correction for Satellite Ocean Color Radiometry. NASA Tech. Memo., 85. NASA/TM-2016-217551.
Mouw, C. B., Hardman-Mountford, N. J., Alvain, S., Bracher, A., Brewin, R. J. W., Bricaud, A., et al. (2017). A Consumer's Guide to Satellite Remote Sensing of Multiple Phytoplankton Groups in the Global Ocean. Front. Mar. Sci. 4, 41. doi:10.3389/fmars.2017.00041
O'Reilly, J. E., and Werdell, P. J. (2019). Chlorophyll Algorithms for Ocean Color Sensors - OC4, OC5 & OC6. Remote Sens. Environ. 229, 32–47. doi:10.1016/j.rse.2019.04.021
Omar, A. H., Tzortziou, M., Coddington, O., and Remer, L. A. (2018). Plankton Aerosol, Cloud, Ocean Ecosystem Mission: Atmosphere Measurements for Air Quality Applications. J. Appl. Remote Sens. (SPIE) 12 (4), 1–10. doi:10.1117/1.jrs.12.042608
PACE Science Definition Team (2018). Pre-Aerosols, Clouds, and Ocean Ecosystem (PACE) Mission Science Definition Team Report. PACE Technical Report Series, NASA/TM-2018-219027/Vol. 2, 316.
Patt, F. S. (2018). “Development of PACE OCI Pointing Knowledge and Control Requirements for Geolocation,” in PACE Technical Report Series. NASA/TM-2018-219027/Vol. 6, chapter 2.
Patt, F. S., and Eplee, R. E., 2018, “Strategy and Requirements for the PACE OCI Lunar Calibration”, PACE Technical Report Series, NASA/TM-2018-219027/Vol. 7, chapter 7.
Platnick, S., Coddington, O., and Ackerman, S. A. (2018). “Cloud Retrievals in the PACE Mission: PACE Science Team Consensus Document,” in PACE Technical Report Series. NASA/TM-2018-219027/Vol. 4.
Remer, L. A., Davis, A. B., Mattoo, S., Levy, R. C., Kalashnikova, O. V., Coddington, O., et al. (2019a). Retrieving Aerosol Characteristics from the PACE Mission, Part 1: Ocean Color Instrument. Front. Earth Sci. 7. doi:10.3389/feart.2019.00152
Remer, L. A., Knobelspiesse, K., Zhai, P., Xu, F., Kalashnikova, O. V., Chowdhary, J., et al. (2019b). Retrieving Aerosol Characteristics from the PACE Mission, Part 2: Multi-Angle and Polarimetry. Front. Earth Sci. 7. doi:10.3389/fenvs.2019.00094
Torrecilla, E., Stramski, D., Reynolds, R. A., Millán-Núñez, E., and Piera, J. (2011). Cluster Analysis of Hyperspectral Optical Data for Discriminating Phytoplankton Pigment Assemblages in the Open Ocean. Remote Sens. Environ. 115, 2578–2593. doi:10.1016/j.rse.2011.05.014
Waluschka, E., Collins, N. R., Cook, W. B., Gorman, E. T., Hilton, G. M., Knuble, J. J., et al. PACE Ocean Color Instrument Polarization Testing and Results. In Earth Obs. Syst. XXVI 2021 1 (Vol. 11829, p. 118290R). International Society for Optics and Photonics.doi:10.1117/12.2594029
Werdell, P. J., Behrenfeld, M. J., Bontempi, P. S., Boss, E., Cairns, B., Davis, G. T., et al. (2019). The Plankton, Aerosol, Cloud, Ocean Ecosystem Mission: Status, Science, Advances. Bull. Am. Meteorological Soc. 100 (9), 1775–1794. doi:10.1175/bams-d-18-0056.1
Werdell, P. J., McKinna, L. I. W., Boss, E., Ackleson, S. G., Craig, S. E., Gregg, W. W., et al. (2018). An Overview of Approaches and Challenges for Retrieving Marine Inherent Optical Properties from Ocean Color Remote Sensing. Prog. Oceanogr. 160, 186–212. doi:10.1016/j.pocean.2018.01.001
Woodward, J. T., Shaw, P. S., Yoon, H. W., Zong, Y., Brown, S. W., and Lykke, K. R. (2018). Invited Article: Advances in Tunable Laser-Based Radiometric Calibration Applications at the National Institute of Standards and Technology, USA. Rev. Sci. Instrum. 89 (9), 091301–091325. doi:10.1063/1.5004810
Keywords: ocean color, aerosols, clouds, hyperspectral, calibration, characterization
Citation: Meister G, Knuble JJ, Chemerys LH, Choi H, Collins NR, Eplee RE, Gliese U, Gorman ET, Jepsen K, Kitchen-McKinley S, Lee S, Mcintire JW, Patt FS, Tse BC, Waluschka E and Werdell PJ (2022) Test Results From the Prelaunch Characterization Campaign of the Engineering Test Unit of the Ocean Color Instrument of NASA’s Plankton, Aerosol, Cloud and Ocean Ecosystem (PACE) Mission. Front. Remote Sens. 3:875863. doi: 10.3389/frsen.2022.875863
Received: 14 February 2022; Accepted: 01 June 2022;
Published: 23 June 2022.
Edited by:
Vittorio Ernesto Brando, Institute of Marine Science, ItalyReviewed by:
Constant Mazeran, Solvo (Europe), FranceEwa Kwiatkowska, European Organisation for the Exploitation of Meteorological Satellites, Germany
Copyright © 2022 Meister, Knuble, Chemerys, Choi, Collins, Eplee, Gliese, Gorman, Jepsen, Kitchen-McKinley, Lee, Mcintire, Patt, Tse, Waluschka and Werdell. This is an open-access article distributed under the terms of the Creative Commons Attribution License (CC BY). The use, distribution or reproduction in other forums is permitted, provided the original author(s) and the copyright owner(s) are credited and that the original publication in this journal is cited, in accordance with accepted academic practice. No use, distribution or reproduction is permitted which does not comply with these terms.
*Correspondence: Gerhard Meister, Z2VyaGFyZC5tZWlzdGVyQG5hc2EuZ292