 Thomas Mumuni Bilintoh
- School of Geography, Clark University, Worcester, MA, United States
Conservationists routinely require methods to analyze the effects of conservation interventions such as reforestation. Although methods to measure the effects of reforestation abound, these methods often fail to track and communicate the complexities of reforestation interventions. This paper uses intensity analysis to analyze the effects of reforestation intervention in Brazil’s Rio Doce water basin. In particular, this paper uses intensity analysis to study the effects of reforestation on three land cover categories in Brazil’s Rio Doce water basin. The illustrative approach analyzes the temporal difference of forest in three land cover maps at time points 1998, 2008, and 2015 from the Rio Doce water basin, Brazil, where each map has four land cover categories: forest formation, pasture, mosaic of agriculture and pasture, and urban infrastructure. Interval level intensity indicates that change is faster during the second time interval (1998–2008). The results from the categorical level intensity show that the forest formation and the mosaic of agriculture and pasture are active gainers during both time intervals, while pasture is an active loser. Forest formation targets the mosaic of agriculture and pasture more intensively at the interval level during the first time interval. Forest formation gains the most from a mosaic of agriculture and pasture while at the same time targeting the mosaic of agriculture and pasture during the second time interval. The mosaic of agriculture and pasture gains the most from both forest formation and pasture during both time intervals but targets pasture. The results for the second time interval show that the reforestation process in the Rio Doce water basin, Brazil, only forced the farmers to move to other forest covers in the vicinity. This process constitutes exchange, which accounts for more than half of the change during the second time interval, and thus contributes 0 to the net change of forest.
1 Introduction
Forest covers only 31% of the Earth’s land surface but provides a haven for most of Earth’s species (Marx, McFarlane and Alzahrani, 2017). However, anthropogenic activities such as urbanization (Faulkner, 2004) and mechanized agriculture (Hobson, Bayne and Van Wilgenburg, 2002) coupled with natural disasters such as wildfires have resulted in deforestation worldwide (Bradshaw et al., 2007; Marlon et al., 2012). Consequentially, the world is experiencing a rise in the above-ground carbon stock and biodiversity loss (Costa and Foley, 2000; Caplow et al., 2011), leading to increased reforestation interventions from various organizations.
Latin America and the Caribbean are home to most of Earth’s tropical forests and thus receive most reforestation interventions. Five out of ten of the literature works concerning deforestation and reforestation on Google scholar are in Latin America, specifically Brazil or Amazon (Scullion et al., 2019). Although these papers report on reforestation, they often fail to provide any insight concerning the complexities involved in the relationship between the reforestation process and other land use such as agriculture (Wei, Liu and Zhou, 2013; Cortés-Capano et al., 2020).
Remotely sensed imagery, specifically satellite imagery, has played a critical role in studying forest changes at varying scales (Gopal and Woodcock, 1996; Huete, 2012; Lechner, Foody and Boyd, 2020). Advancements in remote sensing platforms such as Landsat, Sentinel, the Moderate Resolution Imaging Spectroradiometer, and Unmanned Aerial Vehicles during the past decade have resulted in an influx of categorical land cover data, which are more detailed spatiotemporally and in the number of categories (Lu et al., 2004; Masek et al., 2015). MapBiomas, The Global Forest Watch, and ICIMOD are examples of institutions that have benefited tremendously from the advancements in remotely sensed imagery and the creation of land cover maps. These institutions have leveraged land cover maps and existing methods to create online platforms which quantify forest change in North America and the rest of the world. Although some strides have been achieved in the creation and availability of data concerning forest change, there is still a gap in methods that can help quantify and characterize the complex changes in forests. The next three paragraphs describe some of the existing methods concerning the quantification of forest change from remotely sensed data.
The reducing emissions from deforestation and forest degradation (REDD+) project is perhaps the most popular method concerning the quantification of reforestation (Alexander et al., 2011; Groom and Palmer, 2012; Ingalls et al., 2018). Although the REDD + project has benefits that promote reforestation to reduce above-ground carbon, scientists who use the REDD + project to tell the success stories of reforestation often fail to track and communicate clearly the relationship between reforestation and other land uses such as agriculture (Schneider et al., 2015; Skutsch and Turnhout, 2020).
Other studies quantify the success of reforestation intervention by comparing the area of deforestation that has undergone reforestation. Gerlein-safdi et al. (2020) computed the area (in hectares) of reforestation in China’s drylands for six time points: 2004, 2006, 2008, 2010, 2012, and 2014. They compared the reforestation areas from a manual, airplane, and natural methods. Although their study provided information concerning the area of reforestation, it failed to offer any insight into the transition patterns of forests. Philippe, Astrid and Catherine (2013) used an object-based automatic and national expert validation to analyze the patterns of forest cover change between 2000 and 2005 in the Congo Basin. The study used a transitional table to compare maps from two time points: 2000 and 2005, and reported three types of forest cover change: degradation, regeneration, and reforestation. However, their study reported the types of change as fractions of tree cover and failed to provide any insight beyond the fractions of change. Tasser et al. (2007) measured the rate of reforestation from 1908 to 2000 in four regions of the Eastern Central Alps. In particular, they used a zero-inflated binomial model to measure the rate of reforestation in the Eastern Central Alps. Although the model included variables such as altitude, slope, drainage, and pasture land, their study failed to account for any transition pattern that resulted in the rates of reforestation they observed.
Pontius and Santacruz (2014) showed that the complexities involved in the transition patterns of land cover categories could result from quantity, exchange, and shift. Quantity refers to the absolute value of net change. Exchange refers to the situation where, in a part of the landscape, one category transitions to another while the two categories experience a reversal of transitioning in other parts of the landscape. Exchange, therefore, contributes a zero net change for both categories (Quan, Pontius and Song, 2020). Shift refers to a situation in which a category loses to another category while the losing categories gains from a third category. Aldwaik and Pontius (2012) provided a framework called intensity analysis to show that a category’s quantity, exchange, and shift could be expressed at three levels of intensities: interval, category, and transition levels.
The preceding discourse shows that the relation between a land category of interest and other land cover categories is so complex that reforestation programs often fail to realize that farmers only shift to nearby forest covers to sustain their lives. As a result, it is common to read the success stories of reforestation intervention, which are solely based on evidence that an area that experienced deforestation has undergone reforestation (Honey-Rosés et al., 2018). However, failing to track the activities of other land categories, such as agriculture which often require deforestation in places like the Amazon may only result in short-lived reforestation.
This paper therefore, examines the complexities associated with reforestation on three land cover categories: forest formation, pasture, and a mosaic of agriculture and pasture in Brazil’s Rio Doce water basin.
2 Methods
2.1 Study Area
The study area is the Rio Doce water basin, located in the Aimorés (in Minas Gerais state) of Brazil, measuring 1787.2 acres (Figure 1). Its land cover comprises mainly forest, agriculture, and pasture. In the 1980s, severe deforestation destroyed the tree cover and ecological system of the Rio Doce water basin. Coincidentally, deforestation was spreading like wildfire across the Amazon of Brazil, and the world watched, via satellite imagery, with awe at the rate of the deforestation (Fernandes et al., 2020; West and Fearnside, 2021). The major turning point in the Rio Doce water basin occurred when two Brazilian couples, Sebastião Salgado and Lélia Deluiz Wanick Salgado, decided to champion the course of reforestation. Sebastião Salgado, a photographer, had been in Rwanda to take the photographic coverage of the Rwandan genocide but decided to return to Aimorés (his home) in 1994. Upon returning, he discovered that the beautiful scenery of the lush forest, which he enjoyed during his childhood, had been converted to pasture lands. Lélia Deluiz Wanick Salgado, his wife, encouraged him to team up with her to recover the lost forest. They commenced a reforestation intervention in 1999 and have since planted more than 4.5 million seedlings, encompassing about 293 of the tree species native to the Atlantic Forest (INSTITUTOTERRA, 2019). After 20 years, the world celebrates their success story of reforestation in the Rio Doce water basin. This paper will provide insights into the complex relationship between the reforestation intervention and other land cover categories such as pasture and agriculture.
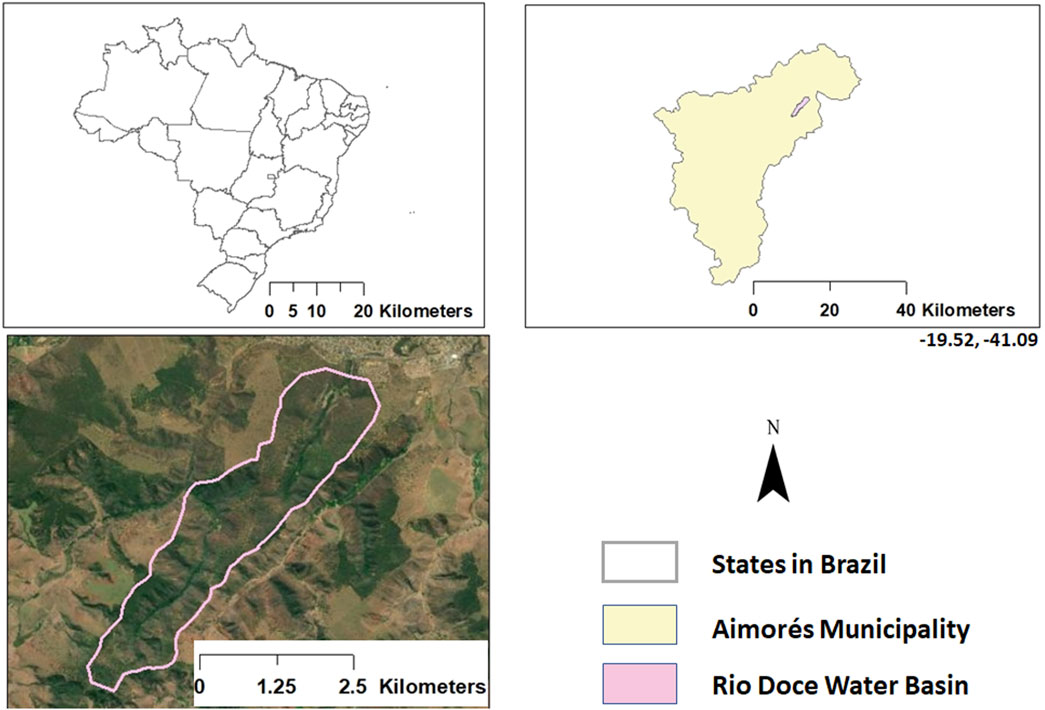
FIGURE 1. Location of the study area.
2.2 Data
Figure 2A shows three land cover maps of the study area at time points 1998, 2008, and 2015. These time points were selected to reflect pre, mid, and post-reforestation efforts. The land cover maps are subsets of collection 3.1 of Mapbiomas’ land cover maps for the Minas Gerais state. The Landsat sensors Thematic Mapper™, Enhanced Thematic Mapper Plus (ETM+), and the Operational Land Imager and Thermal Infrared Sensor (OLI-TIRS) onboard Landsat 5, Landsat 7, and Landsat 8, respectively, serve as input data for creating MapBiomas’ land cover maps with an overall accuracy of 85%. MapBiomas relies on Python and JavaScript codes to classify the mosaic of Landsat images in a Google Earth Engine environment. Souza and Azevedo (2017) also provide detailed information concerning the methodology used to create the land cover maps. Readers can access all the JavaScript and Python codes at MapBiomas’ public GitHub repository: https://github.com/mapbiomas-brazil. In addition, the land cover maps can be downloaded for free from https://mapbiomas.org/en/termosdeuso?cama_set_language=en. Each map shows four land cover categories: forest, pasture, agriculture and pasture, and infrastructure. Each land cover’s spatial resolution is 30 m * 30 m, and Table 1 provides definitions for each land cover category. Figures 2B,C show maps of losses and gains during 1998–2008 and 2008–2015.
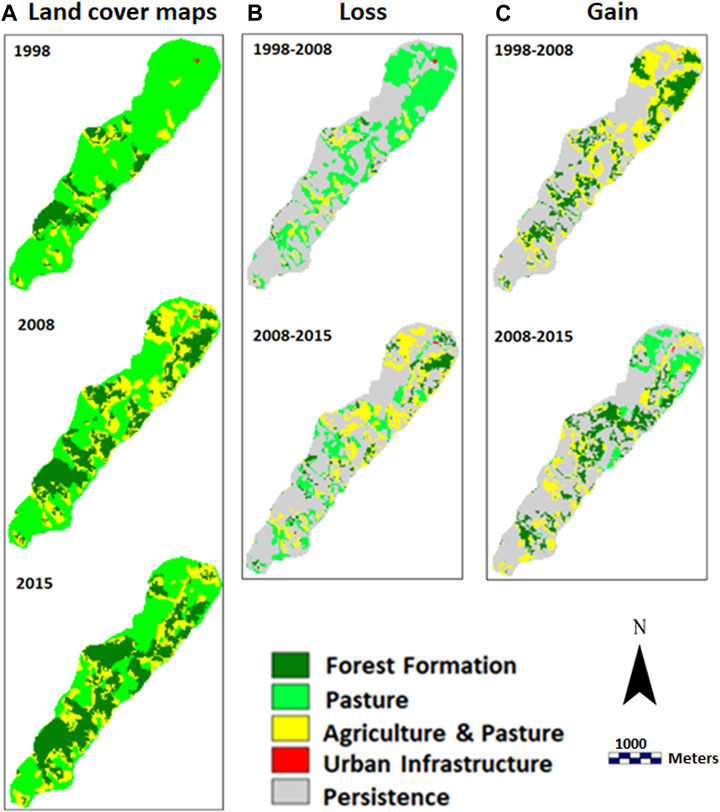
FIGURE 2. (A) Land cover maps for the study site at 1995, 2008, and 2015. (B) Maps of losses for 1998–2008 and 2008–2015. (C) Maps of gains for 1998–2008 and 2008–2015.
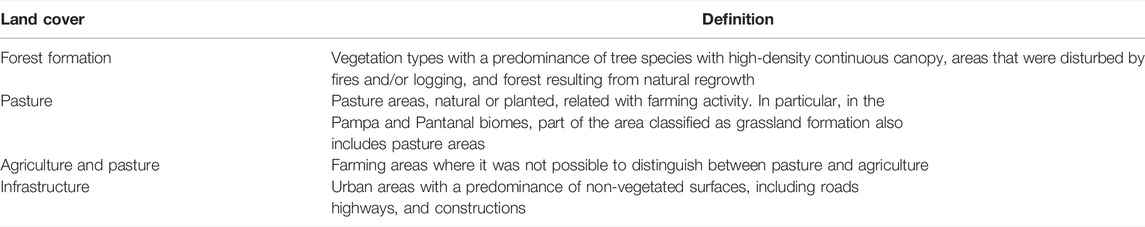
TABLE 1. Definition of land cover categories (source: Souza et al., 2020).
Figure 3 shows the transition matrices for 1998–2008 and 2008–2015. Figure 3 departs from the traditional, transitional table prominently features in most land change papers. This departure is useful because it does not bombard the reader with a wall of numbers, which often characterizes the traditional, transitional table. The squares in Figure 3 clearly show the sizes of the trajectories associated with each category and offer a direct and easy way to gain insights into the sizes of loss, gain, and persistence associated with each category. The two transition figures in Figure 3 serve as a data input for the intensity analysis.

FIGURE 3. Transition matrix for two time intervals: 1998–2008 and 2008–2015.
2.3 Intensity Analysis
Intensity analysis is a quantitative framework developed by Aldwaik and Pontius (2012) to characterize change patterns in categorical data at varying temporal resolutions. The original framework of intensity analysis revolved around three levels of intensities: interval, categorical, and transitional, which shows different levels in detail. Table 2 provides information concerning the mathematical notations to analyze transition matrices.
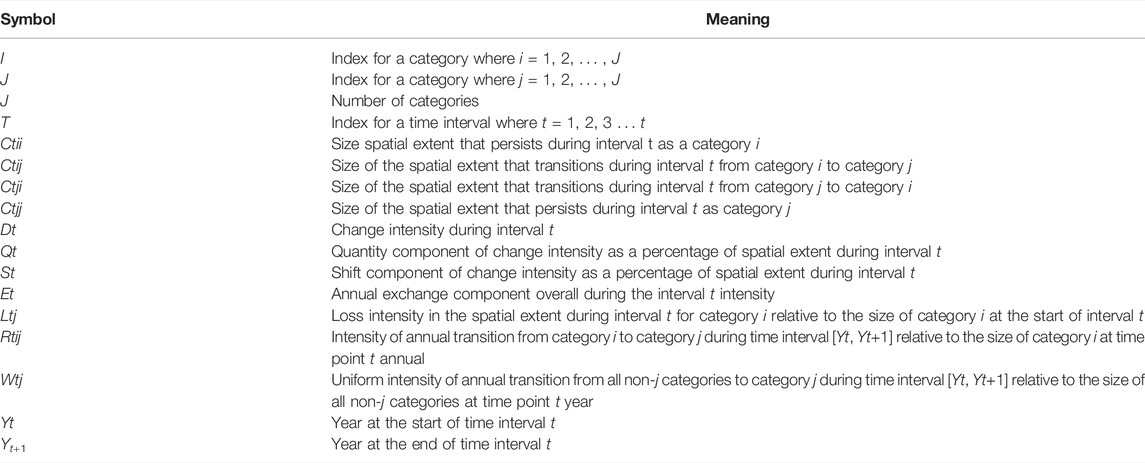
TABLE 2. Mathematical notation.
2.3.1 Interval Level and Components
Interval level intensities measure variations in size and the annual rate of gross change during a given time interval (see Eq. 1). A time interval is duration between two time points. Thus, the interval level intensity offers insight into which site’s annual rate of gross change is slow or fast (Huang et al., 2012). Equation 1 shows how to compute gross change; while Equations 2, 3, and 4 show how to compute the three components of change: quantity, exchange, and shift from the gross change. Eq. (2) is divided by 2 because each change involves a losing and gaining category (Quan et al., 2018). As a result, the numerator of Eq. 2 is double the absolute net (Chen and Pontius, 2011). Equations 5–8 compute intensities for gross change and the three components of change.
2.3.2 Categorical Level
The categorical level intensity measures sizes and intensities of each category’s gross gains and gross losses. It provides insights concerning which categories are dormant or active during a given time interval. As a result, the categorical level intensity shows which patterns of change are stable across given time intervals (Pontius et al., 2013).
2.3.3 Transitional Level
The transitional level intensity shows which category’s transitions are intensively avoided or targeted during a given time interval. Equation 11 defines
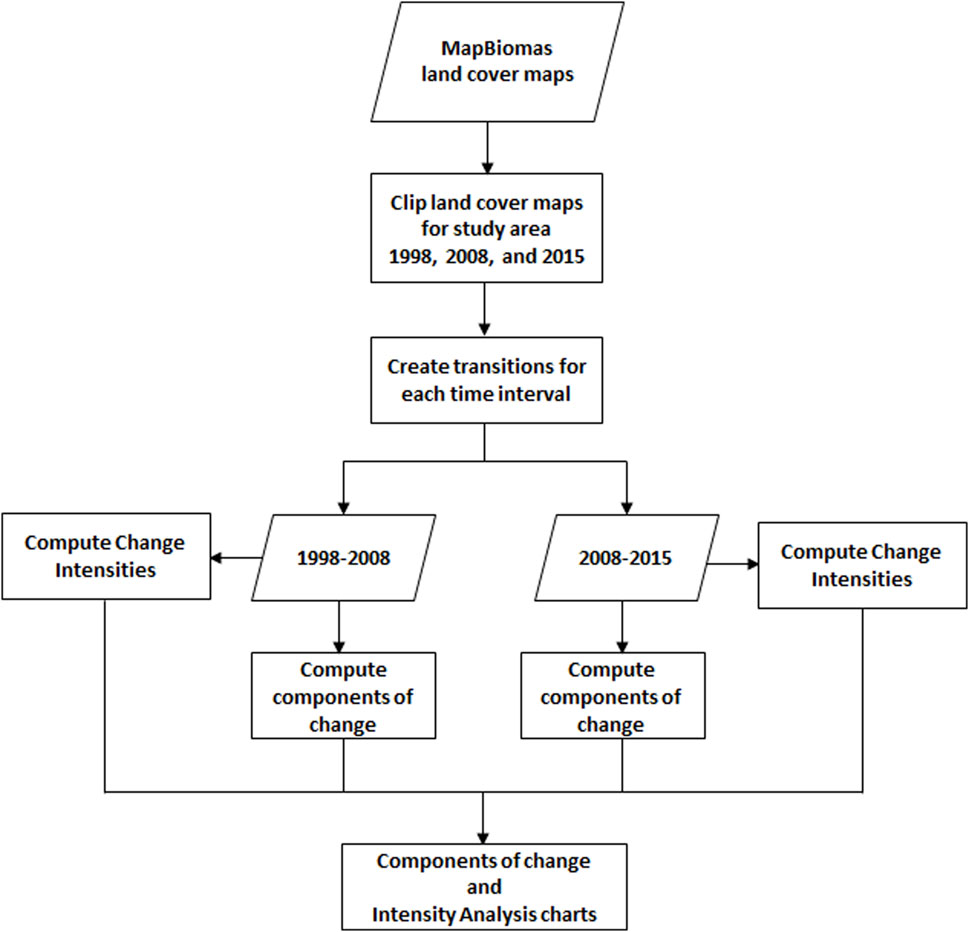
FIGURE 4. Workflow of the study.
3 Results
3.1 Interval Level
Figure 3 shows that the transitions involving infrastructure are almost zero during both time intervals. Thus, this paper focuses on analyzing the other categories’ intensities that have relatively larger transitions. Figure 5A shows that the percentage of the study area experiencing change during the first time interval (1998–2008) is larger than the percentage of the study area experiencing change during the second time interval (2008–2015). However, Figure 5B, which shows the interval and size for the two time intervals, shows that the annual change during the first time interval is slower than the annual change during the second time interval. This is because the short-dashed black line shown in Figure 5B is the uniform annual change. Thus, if a time interval’s bar falls short of the line, the time interval corresponding to that bar experiences a slow annual change. Conversely, if a time interval’s bar extends beyond the short-dashed black line, the time interval experiences a faster annual change.
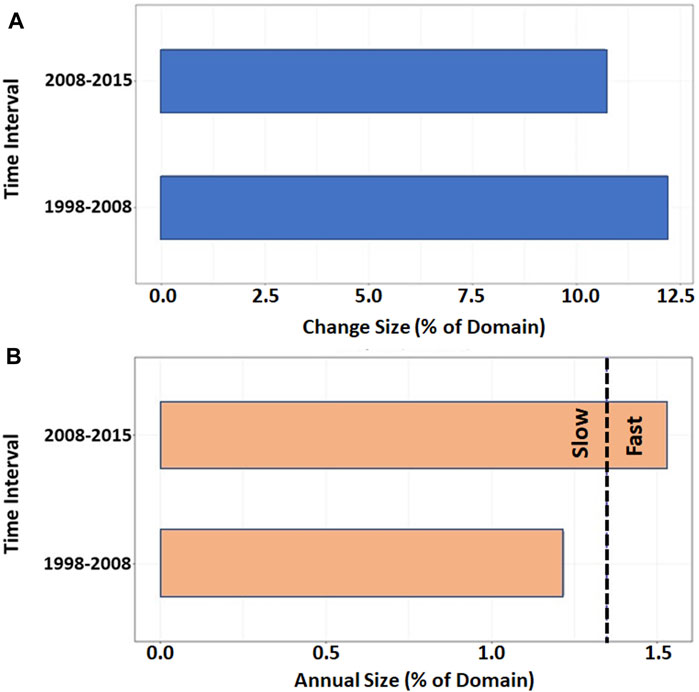
FIGURE 5. (A) Sizes of change in the study area during time intervals 1998–2008 and 2008–2015. (B) Annual change rate during time intervals 1998–2008 and 2008–2015.
3.2 Categorical Level
Figures 6A,B show quantity and allocation disagreement for the first and second time intervals. Pontius and Millones (2011) provide a detailed description of quantity and allocation disagreement. Figure 6A shows that quantity accounts for most of the change in forest formation, pasture, and the mosaic of agriculture and pasture during the first time interval. Figure 6A also indicates that the mosaic of agriculture and pasture experiences both exchange and shift during the first time interval. However, in Figure 6B, forest formation, pasture, and the mosaic of agriculture and pasture’s change are primarily exchange during the second time interval. Figures 7A,B show information concerning the categorical intensities for the two time intervals. In particular, Figures 7A,B show how uniform intensity compares with each category’s intensity. If a category’s intensity falls short of the uniform intensity bar then the category’s change is dormant. If a category’s intensity bar extends beyond the uniform intensity bar then the category’s change is active. Finally, if the length of a category’s intensity bar equals the uniform intensity bar then the category’s intensity is uniform. Figures 1) and 2) show that forest formation and the mosaic of agriculture and pasture are active gainers during both time intervals; while pasture is an active loser.
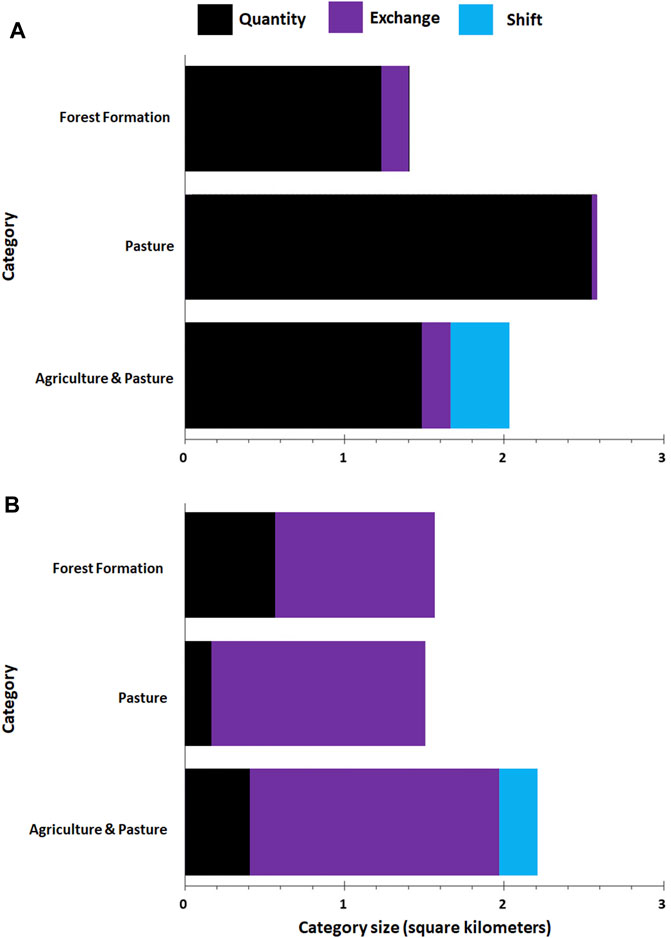
FIGURE 6. (A) The components of change for each category during 1998–2008; (B) the components of change for each category during 2008–2015.
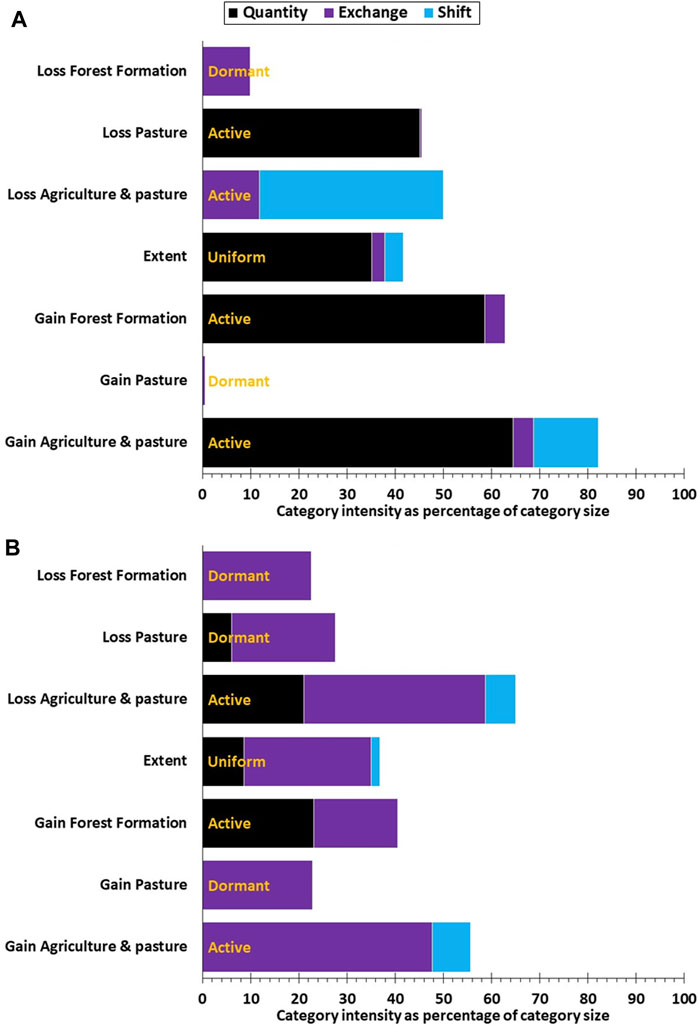
FIGURE 7. (A) Categorical level intensity during 1995–2008; (B) categorical level intensity during 2008–2015.
3.3 Transitional Level
Loss or gain precedes the name of each category in Figures 8A,B. If loss precedes the name of a category, then that category is the losing category, and the categories in the stacked bar are the gaining categories. Conversely, if gain precedes the name of a category, then that category is the gaining category, and the categories in the stacked bar are the losing categories. For instance, the first staked bar in Figure 8A is loss forest formation, which shows the intensities of two categories: pasture and the mosaic of agriculture and pasture. This indicates that the forest formation loses to both Ppsture and the mosaic of agriculture and pasture. Figures 8A,B show that forest formation gains more from pastures than the mosaic of agriculture during the first time interval. This is because pasture’s intensity is larger than the mosaic of pasture and agriculture’s intensity size in the gain forest formation stacked bar. Conversely, the forest formation gains more from the mosaic of agriculture and pastures than pasture during the second time interval. A > indicates that a gaining category targets the losing category, an = symbol indicates that a category’s transition intensity equals the gaining category’s uniform intensity, and an intensity bar without a > or = symbol indicates that a category’s transition intensity avoids the gaining category’s uniform intensity. Thus, forest formation and pasture’s gains target forest formation more intensively than the mosaic of agriculture and pasture during both time intervals.
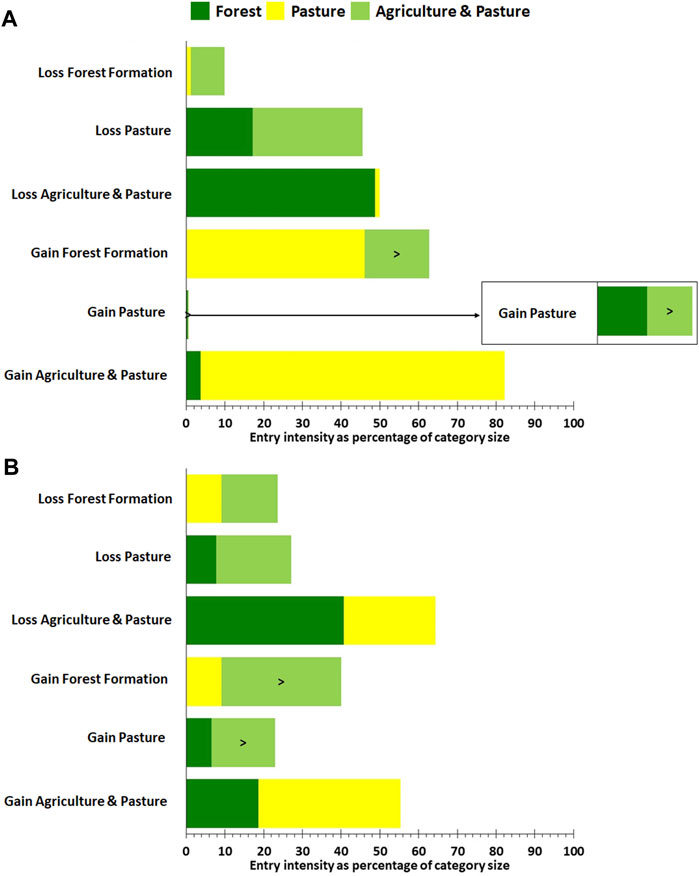
FIGURE 8. (A) Results for the transitional level intensity during time interval 1998–2008; (B) results for the transitional level intensity during time interval 1998–2008.
4 Discussion
4.1 Time Interval Level
Land change in the Rio Doce water basin was faster during the second time interval (2008–2015) as compared to the first time interval (1998–2008). An increase in reforestation efforts, global demand for coffee, sugar, beef, and milk during the 20th century could have accounted for this observation (Rezende et al., 2009; Salter, 2017; Lyra and Rigo, 2019).
4.2 Category Level
Forest formation is an active gainer during both time intervals. This aligns with the goal of the reforestation program in the Rio Doce’s water basin (INSTITUTOTERRA, 2019). However, forest formation’s gain characteristics during the first time interval are different from the second time interval. During the first time interval, gain quantity is the largest component of change for the forest formation category with a small exchange component. On the other hand, forest formation’s gain quantity is almost the size of exchange during the second time interval.
Figure 6B and Figure 7B show that exchange accounts for most of the change in pasture and the mosaic of agriculture and pasture during the second time interval. This observation is consistent with findings from Lyra and Rigo (2019), which reported that an increase in the global demand for coffee and sugarcane (cash crops cultivated in the study area) influenced the decision of farmers in and around the Rio Doce water basin to convert forest into agriculture lands. Similarly, Silva, Batistella and Moran (2017) showed that between 1985 and 2010 farmers in the Atlantic Forest region of Brazil and, by extension, the Rio Doce water basin converted the large parcels of forest into pastures to sustain their livestock (primarily cattle). This action was again influenced by the high demand for milk and beef across the globe (Salter, 2017).
The decision to welcome change that affects the source of livelihood is not a simple one, especially for farmers living and practicing farming within a geographical region. Beymer-Farris and Bassett (2012), Nielsen et al. (2018), and Bauer (2005) showed that farmers’ decision to embrace a reforestation process might be influenced by a myriad of factors such as direct financial incentives, a guaranteed alternative source of livelihood, and the sustainability of the alternative source of livelihood. Thus, it is possible that the farmers in the Rio Doce basin saw the global demand for coffee, sugar, milk, and beef as an opportunity to profit from their pasture and agricultural lands. This decision could have bolstered their resolve to continuously convert other land covers such as forest in the study area to pasture and agricultural lands.
4.3 Transitional Level
During the first time interval, forest formation gains more from pasture than it gains from a mosaic of agriculture and pasture. However, the > sign on the bar for the mosaic of agriculture and pasture shows that forest formation targets the mosaic of agriculture and pasture more intensively. This observation is perhaps due to prioritizing reforesting locations closer to forest or areas previously populated by forest formation (Valente, Petean and Vettorazzi, 2017). Another possibility is that it was more convenient to access seeds nearer to areas already forested (Ukrainetz, O’Neill and Jaquish, 2011). Janzen (1970) and Wright (1983) demonstrated that the mortality of a seed increased with proximity to a reproductive adult tree and the density of seeds. Inferably, it is easier to find nursing seedlings of a specific tree species closer to an area currently or previously inhabited by the same tree species. It is, therefore, logical that the conservationists in the study area scouted for seeds from areas relatively closer to the exiting forest to 1) acquire seedlings having the same species of the trees in the study area and 2) save the cost of having to traverse to other regions to collections or purchase new seedling for the reforestation project. Conversely, Figure 8B shows that forest formation gains the most from a mosaic of agriculture and pasture while at the same time targeting the mosaic of agriculture and pasture during the second time interval. During both time intervals, the mosaic of agriculture and pasture gains the most from both forest formation and pasture but targets pasture. This observation is attributable to the fact that the size of pasture in 1998 and 2008 is larger than the relative sizes of the other land cover categories. Furthermore, it is easier for farmers to convert pasture to a mosaic of agriculture and pasture because pasture consists of grassland, which is relatively easier to plow. Rashford, Walker and Bastian (2011) allude to a similar observation concerning famers’ decision to convert grassland to agriculture land in the Prairie Pothole Region (north-central United States). They used a statistical model to show that famers’ decision to convert grassland to cropland increased on the average by 1.3% (from 1979 to 1997) and 1.5% from (2006–20011).
4.4 Next Steps
The results from intensity analysis show the intensity at which forest gains or losses during a specific time interval. However, it may be important also to gain insight into the relative distance at which forest gains or losses. Therefore, the author plans to develop or rely on existing methods to quantify the relationship between the loss and gain of reforestation in relation to distance to existing forests and other variables such as elevation.
5 Conclusion
This paper shows how a combination of land cover maps (derived from satellite imagery) and intensity analysis can reveal the complex dynamics between forest and other land cover categories during a reforestation process. It is clear from this paper that the reforestation process in the study site might be affected by an exchange between land cover categories, which contribute 0 to net change. Thus, the author recommends that the Terra institute, policymakers, and conservationists employ the methods described in this paper to review the progress of their reforestation programs. This will provide an insightful approach to measuring the success rate of the reforestation process in the Rio Doce water basin and reforestation programs worldwide.
Data Availability Statement
Publicly available datasets were analyzed in this study. These data can be found at: https://drive.google.com/file/d/1AGClGyg_8IRWhyz51NgeINs1Edhdft71/view?usp=sharing.
Author Contributions
The author confirms being the sole contributor of this work and has approved it for publication.
Conflict of Interest
The author declares that the research was conducted in the absence of any commercial or financial relationships that could be construed as a potential conflict of interest.
Publisher’s Note
All claims expressed in this article are solely those of the authors and do not necessarily represent those of their affiliated organizations, or those of the publisher, the editors and the reviewers. Any product that may be evaluated in this article, or claim that may be made by its manufacturer, is not guaranteed or endorsed by the publisher.
References
Aldwaik, S. Z., and Pontius, R. G. (2012). Intensity Analysis to Unify Measurements of Size and Stationarity of Land Changes by Interval, Category, and Transition. Landsc. Urban Plan. 106 (1), 103–114. doi:10.1016/j.landurbplan.2012.02.010
Alexander, S., Nelson, C. R., Aronson, J., Lamb, D., Cliquet, A., Erwin, K. L., et al. (2011). Opportunities and Challenges for Ecological Restoration within REDD+. Redd. +’ 19 (6), 683–689. doi:10.1111/j.1526-100X.2011.00822.x
Bauer, R. L. (2005). Economic Differentiation and the Divided Responses of Spanish Galician Farmers to Reforestation of the Commons Under Franco. Social Science History 29 (2), 175–205. doi:10.1215/01455532-29-2-17510.1017/s0145553200012918
Beymer-Farris, B. A., and Bassett, T. J. (2012). The REDD Menace: Resurgent Protectionism in Tanzania's Mangrove Forests. Global Environmental Change 22 (2), 332–341. doi:10.1016/j.gloenvcha.2011.11.006
Bradshaw, C. J. A., Sodhi, N. S., Peh, K. S.-H., and Brook, B. W. (2007). Global Evidence that Deforestation Amplifies Flood Risk and Severity in the Developing World. Global Change Biol. 13 (11), 2379–2395. doi:10.1111/j.1365-2486.2007.01446.x
Caplow, S., Jagger, P., Lawlor, K., and Sills, E. (2011). Evaluating Land Use and Livelihood Impacts of Early Forest Carbon Projects: Lessons for Learning About REDD+. Environmental Science & Policy 14 (2), 152–167. doi:10.1016/j.envsci.2010.10.003
Chen, H., and Pontius, R. G. (2011). Sensitivity of a Land Change Model to Pixel Resolution and Precision of the Independent Variable. Environ. Model Assess 16 (1), 37–52. doi:10.1007/s10666-010-9233-3
Cortés‐Capano, G., Toivonen, T., Soutullo, A., Fernández, A., Dimitriadis, C., Garibotto‐Carton, G., et al. (2020). Exploring Landowners' Perceptions, Motivations and Needs for Voluntary Conservation in a Cultural Landscape. People and Nature 2 (3), 840–855. doi:10.1002/pan3.10122
Costa, M. H., and Foley, J. A. (2000). Combined Effects of Deforestation and Doubled Atmospheric CO2 Concentrations on the Climate of Amazonia. J. Climate 13 (1), 18–34. doi:10.1175/1520-0442(2000)013<0018:ceodad>2.0.co;2
Ernst, C., Mayaux, P., Verhegghen, A., Bodart, C., Christophe, M., and Defourny, P. (2013). National Forest Cover Change in Congo Basin: Deforestation, Reforestation, Degradation and Regeneration for the Years 1990, 2000 and 2005. Glob Change Biol 19, 1173–1187. doi:10.1111/gcb.12092
Faulkner, S. (2004). Urbanization Impacts on the Structure and Function of Forested Wetlands. Urban Ecosystems 7 (2), 89–106. doi:10.1023/b:ueco.0000036269.56249.66
Fernandes, M. M., Fernandes, M. R. d. M., Garcia, J. R., Matricardi, E. A. T., de Almeida, A. Q., Pinto, A. S., et al. (2020). Assessment of Land Use and Land Cover Changes and Valuation of Carbon Stocks in the Sergipe Semiarid Region, Brazil: 1992-2030. Land Use Policy 99 (May), 104795. doi:10.1016/j.landusepol.2020.104795
Gerlein-safdi, C., Keppel-Aleks, G., Wang, F., Frolking, S., and Mauzerall, D. L. (2020). Satellite Monitoring of Natural Reforestation Efforts in China's Drylands. One Earth 2 (1), 98–108. doi:10.1016/j.oneear.2019.12.015
Gopal, S., and Woodcock, C. (1996). Remote Sensing of Forest Change Using Artificial Neural Networks. IEEE Trans. Geosci. Remote Sensing 34 (2), 398–404. doi:10.1109/36.485117
Groom, B., and Palmer, C. (2012). Author ’ S Personal Copy REDD + and Rural Livelihoods. Biological Conservation 154, 45–52. doi:10.1016/j.biocon.2012.03.002
Hobson, K. A., Bayne, E. M., and Van Wilgenburg, S. L. (2002). Large-scale Conversion of Forest to Agriculture in the Boreal Plains of Saskatchewan. Conservation Biology 16 (6), 1530–1541. doi:10.1046/j.1523-1739.2002.01199.x
Honey-Rosés, J., Maurer, M., Ramírez, M. I., and Corbera, E. (2018). Quantifying Active and Passive Restoration in Central Mexico from 1986-2012: Assessing the Evidence of a Forest Transition. Restor Ecol 26 (6), 1180–1189. doi:10.1111/rec.12703
Huang, J., Pontius, R. G., Li, Q., and Zhang, Y. (2012). Use of Intensity Analysis to Link Patterns with Processes of Land Change from 1986 to 2007 in a Coastal Watershed of Southeast China. Applied Geography 34, 371–384. doi:10.1016/j.apgeog.2012.01.001
Huete, A. R. (2012). Vegetation Indices, Remote Sensing and Forest Monitoring. Geography Compass 6 (9), 513–532. doi:10.1111/j.1749-8198.2012.00507.x
Ingalls, M. L., Meyfroidt, P., To, P. X., Kenney-Lazar, M., and Epprecht, M. (2018). The Transboundary Displacement of Deforestation Under REDD+: Problematic Intersections Between the Trade of Forest-Risk Commodities and Land Grabbing in the Mekong Region. Global Environmental Change 50, 255–267. doi:10.1016/j.gloenvcha.2018.04.003
INSTITUTOTERRA (2019). A N N U a L Ac T I V I T Y Report 2019. Available at: https://institutoterra.org/wp-content/uploads/2021/05/Relatorio_2019_ING_v3.pdf.
Janzen, D. H. (1970). Herbivores and the Number of Tree Species in Tropical Forests. The American Naturalist 104 (940), 501–528. doi:10.1086/282687
Lechner, A. M., Foody, G. M., and Boyd, D. S. (2020). Applications in Remote Sensing to Forest Ecology and Management. One Earth 2 (5), 405–412. doi:10.1016/j.oneear.2020.05.001
Lu, D., Mausel, P., Brondízio, E., and Moran, E. (2004). Change Detection Techniques. International Journal of Remote Sensing 25 (12), 2365–2401. doi:10.1080/0143116031000139863
Lyra, B. U., and Rigo, D. (2019). Deforestation Impact on Discharge Regime in the Doce River Basin. Rev. ambiente água 14 (4), 1. doi:10.4136/ambi-agua.2370
Marlon, J. R., Bartlein, P. J., Gavin, D. G., Long, C. J., Anderson, R. S., Briles, C. E., et al. (2012). Long-Term Perspective on Wildfires in the Western USA. Proc. Natl. Acad. Sci. U.S.A. 109 (9), 535–543. doi:10.1073/pnas.1112839109
Marx, A., McFarlane, D., and Alzahrani, A. (2017). UAV Data for Multi-Temporal Landsat Analysis of Historic Reforestation: A Case Study in Costa Rica. International Journal of Remote Sensing 38 (8–10), 2331–2348. doi:10.1080/01431161.2017.1280637
Masek, J. G., Hayes, D. J., Joseph Hughes, M., Healey, S. P., and Turner, D. P. (2015). The Role of Remote Sensing in Process-Scaling Studies of Managed Forest Ecosystems. Forest Ecology and Management 355, 109–123. doi:10.1016/j.foreco.2015.05.032
Nielsen, M. R., Theilade, I., Meilby, H., Nui, N. H., and Lam, N. T. (2018). Can PES and REDD+ Match Willingness to Accept Payments in Contracts for Reforestation and Avoided Forest Degradation? The Case of Farmers in Upland Bac Kan, Vietnam. Land Use Policy 79 (February), 822–833. doi:10.1016/j.landusepol.2018.09.010
Pontius, R., Gao, Y., Giner, N., Kohyama, T., Osaki, M., and Hirose, K. (2013). Design and Interpretation of Intensity Analysis Illustrated by Land Change in Central Kalimantan, Indonesia. Land 2 (3), 351–369. doi:10.3390/land2030351
Pontius, R. G. (2019). Component Intensities to Relate Difference by Category with Difference Overall. International Journal of Applied Earth Observation and Geoinformation 77, 94–99. doi:10.1016/j.jag.2018.07.024
Pontius, R. G., and Millones, M. (2011). Death to Kappa: Birth of Quantity Disagreement and Allocation Disagreement for Accuracy Assessment. International Journal of Remote Sensing 32 (15), 4407–4429. doi:10.1080/01431161.2011.552923
Pontius, R. G., and Santacruz, A. (2014). Quantity, Exchange, and Shift Components of Difference in a Square Contingency Table. International Journal of Remote Sensing 35 (21), 7543–7554. doi:10.1080/2150704X.2014.969814
Quan, B., Pontius, R. G., and Song, H. (2020). Intensity Analysis to Communicate Land Change During Three Time Intervals in Two Regions of Quanzhou City, China. GIScience & Remote Sensing 57 (1), 21–36. doi:10.1080/15481603.2019.1658420
Quan, B., Ren, H., Pontius, R. G., and Liu, P. (2018). Quantifying Spatiotemporal Patterns Concerning Land Change in Changsha, China. Landscape Ecol. Eng. 14 (2), 257–267. doi:10.1007/s11355-018-0349-y
Rashford, B. S., Walker, J. A., and Bastian, C. T. (2010). Economics of Grassland Conversion to Cropland in the Prairie Pothole Region. Conservation Biology 25 (2), no. doi:10.1111/j.1523-1739.2010.01618.x
Rezende, P. De. (2009). Characterization of a Forest Incentive Program in Minas Gerais State. Cerne 15 (3), 295–302. Available at: http://www.redalyc.org/articulo.oa?id=74413021006.
Salter, A. M. (2017). Improving the Sustainability of Global Meat and Milk Production. Proc. Nutr. Soc. 76, 22–27. doi:10.1017/S0029665116000276
Schneider, C., Coudel, E., Cammelli, F., and Sablayrolles, P. (2015). Small-Scale Farmers' Needs to End Deforestation: Insights for REDD+ in So Felix Do Xingu (Par, Brazil). Int. Forest. Rev. 17, 124–142. doi:10.1505/146554815814668963
Scullion, J. J., Vogt, K. A., Drahota, B., Winkler-Schor, S., and Lyons, M. (2019). Conserving the Last Great Forests: A Meta-Analysis Review of the Drivers of Intact Forest Loss and the Strategies and Policies to Save Them. Front. For. Glob. Change 2 (October), 1–12. doi:10.3389/ffgc.2019.00062
Silva, R. F. B. d., Batistella, M., and Moran, E. F. (2017). Socioeconomic Changes and Environmental Policies as Dimensions of Regional Land Transitions in the Atlantic Forest, Brazil. Environmental Science & Policy 74 (April), 14–22. doi:10.1016/j.envsci.2017.04.019
Skutsch, M., and Turnhout, E. (2020). REDD+: If Communities Are the Solution, What Is the Problem? World Development 130, 104942. doi:10.1016/j.worlddev.2020.104942
Souza, C. M., Z. Shimbo, J., Rosa, M. R., Parente, L. L., A. Alencar, A., Rudorff, B. F. T., et al. (2020). Reconstructing Three Decades of Land Use and Land Cover Changes in Brazilian Biomes with Landsat Archive and Earth Engine. Remote Sensing 12 (17), 2735. doi:10.3390/RS12172735
Souza, J. C., and Azevedo, T. (2017). MapBiomas General “Handbook” ATBD. R Algorithm Theoretical Base Document & Results. 24. doi:10.13140/RG.2.2.31958.88644
Tasser, E., Walde, J., Tappeiner, U., Teutsch, A., and Noggler, W. (2007). Land-Use Changes and Natural Reforestation in the Eastern Central Alps. Agriculture, Ecosystems & Environment 118, 115–129. doi:10.1016/j.agee.2006.05.004
Ukrainetz, N. K., O’Neill, G. A., and Jaquish, B. (2011). Comparison of Fixed and Focal Point Seed Transfer Systems for Reforestation and Assisted Migration: A Case Study for Interior Spruce in British Columbia. Can. J. For. Res. 41 (7), 1452–1464. doi:10.1139/x11-060
Valente, R. A., Petean, F. C. d. S., and Vettorazzi, C. A. (2017). Multicriteria Decision Analysis for Prioritizing Areas for Forest Restoration. Cerne 23 (1), 53–60. doi:10.1590/01047760201723012258
Wei, X., Liu, W., and Zhou, P. (2013). Quantifying the Relative Contributions of Forest Change and Climatic Variability to Hydrology in Large Watersheds: A Critical Review of Research Methods. Water 5 (2), 728–746. doi:10.3390/w5020728
West, T. A. P., and Fearnside, P. M. (2021). Brazil's Conservation Reform and the Reduction of Deforestation in Amazonia. Land Use Policy 100, 105072. doi:10.1016/j.landusepol.2020.105072
Keywords: reforestation, agriculture, land change, intensity analysis, Brazil
Citation: Bilintoh TM (2022) Intensity Analysis to Study the Dynamics of Reforestation in the Rio Doce Water Basin, Brazil. Front. Remote Sens. 3:873341. doi: 10.3389/frsen.2022.873341
Received: 10 February 2022; Accepted: 05 May 2022;
Published: 17 June 2022.
Edited by:
Chong Liu, Sun Yat-sen University, ChinaReviewed by:
Shicheng Li, China University of Geosciences Wuhan, ChinaYachen Xie, Michigan State University, United States
Copyright © 2022 Bilintoh. This is an open-access article distributed under the terms of the Creative Commons Attribution License (CC BY). The use, distribution or reproduction in other forums is permitted, provided the original author(s) and the copyright owner(s) are credited and that the original publication in this journal is cited, in accordance with accepted academic practice. No use, distribution or reproduction is permitted which does not comply with these terms.
*Correspondence: Thomas Mumuni Bilintoh, dGJpbGludG9oQGNsYXJrdS5lZHU=
†ORCID: Thomas Mumuni Bilintoh, orcid.org/0000-0002-6852-4439