
94% of researchers rate our articles as excellent or good
Learn more about the work of our research integrity team to safeguard the quality of each article we publish.
Find out more
ORIGINAL RESEARCH article
Front. Remote Sens., 02 May 2022
Sec. Multi- and Hyper-Spectral Imaging
Volume 3 - 2022 | https://doi.org/10.3389/frsen.2022.860816
This article is part of the Research TopicUncertainties and Challenges in Water Color Remote Sensing in Coastal and Inland WatersView all 9 articles
 Martin Montes1,2
 Nima Pahlevan1,2*
 David M. Giles1,2
 Jean-Claude Roger2,3
 Peng-wang Zhai4Brandon Smith1,2
 Robert Levy2
 P. Jeremy Werdell2
 Alexander Smirnov1,2
Satellite remote sensing of near-surface water composition in terrestrial and coastal regions is challenging largely due to uncertainties linked to a lack of representative continental aerosols in the atmospheric correction (AC) framework. A comprehensive family of absorbing aerosols is proposed by analyzing global AERONET measurements using the Partition Around Medoids (PAM) classifier. The input to the classifier is composed of Version 3, Level 2.0 daily average aerosol properties [i.e., single scattering albedo at λ = 0.44 μm, (SSA(0.44)) and the Angstrom exponents for extinction and absorption AEe(0.44–0.87) and AEa(0.44–0.87), respectively from observations from June 1993 to September 2019. The PAM classification based on low daily aerosol optical depth (AOD(0.44) ≤ 0.4) suggested 27 distinct aerosol clusters encompassing five major absorbing aerosol types (Dust (DU), Marine (MAR), Mixed (MIX), Urban/Industrial (U/I), and Biomass Burning (BB)). Seasonal patterns of dominant PAM-derived clusters at three AERONET sites (GSFC, Kanpur, and Banizoumbou) strongly influenced by U/I, DU, and BB types, respectively, showed a satisfactory agreement with variations of aerosol mixtures reported in the literature. These PAM-derived models augment the National Aeronautics and Space Administration's (NASA's) aerosol models (A2010) applied in its operational AC. To demonstrate the validity and complementary nature of our models, a coupled ocean-atmosphere radiative transfer code is employed to create a simulated dataset for developing two experimental machine-learning AC processors. These two processors differ only in their aerosol models used in training: 1) a processor trained with the A2010 aerosol models (ACI) and 2) a processor trained with both PAM and A2010 aerosol models (ACII). These processors are applied to Landsat-8 Operational Land Imager (OLI) matchups (N = 173) from selected AERONET sites equipped with ocean color radiometers (AERONET-OC). Our assessments showed improvements of up to 30% in retrieving remote sensing reflectance (Rrs) in the blue bands. In general, our empirically derived PAM aerosol models complement A2010 models (designed for regions strongly influenced by marine conditions) over continental and coastal waters where absorbing aerosols are present (e.g., urban environments, areas impacted by dust, or wildfire events). With the expected geographic expansion of in situ aquatic validation networks (e.g., AERONET-OC), the advantages of our models will be accentuated, particularly in the ultraviolet and short blue bands.
The application of moderate-to-high resolution imagery from satellite platforms (e.g., Landsat-8 and Sentinel-2) for studying inland water bodies (e.g., lakes, reservoirs, rivers) and nearshore coastal ecosystems has become more prevalent over the past decade (Alikas et al., 2015; Barnes et al., 2015; Gernez et al., 2017; Snyder et al., 2017; Maciel et al., 2019; Page et al., 2019; Balasubramanian et al., 2020; Hakimdavar et al., 2020; Cao and Tzortziou, 2021). This increased usage has driven the aquatic remote sensing community to formulate and implement suitable processing techniques and algorithms to generate reliable in-water products for a host of scientific and monitoring exercises (Franz et al., 2015; Watanabe et al., 2015; Saulquin et al., 2016; Slonecker et al., 2016; De Keukelaere et al., 2018; Steinmetz and Ramon, 2018; Poddar et al., 2019; Vanhellemont, 2019; Balasubramanian et al., 2020; Manuel et al., 2020; Fan et al., 2021).
One of the main sources of uncertainties in Landsat-8/Sentinel-2 data processing is the atmospheric correction (AC) (IOCCG, 2019; Pahlevan et al., 2021a) for which inaccurate representation of aerosol radiative properties is one major weakness, particularly when absorbing aerosols are present (IOCCG, 2010; Pahlevan et al., 2017a; Frouin et al., 2019). This is explained by the contribution of coupled aerosol scattering and absorption and their high spatial and temporal variability (Prospero et al., 1983). Given a particular location and time, realistic aerosol mixtures are critical for executing a robust AC on aquatic satellite scenes to retrieve high-quality spectral remote sensing reflectance (
To date, there is no real-time integration of independent aerosol datasets into AC frameworks. This limitation is due to the lack of concurrent in situ measurements of aerosol properties and/or poor spatial and temporal representation of atmospheric models. Indeed, the data coverage by terrestrial observation networks (e.g., the Aerosol Robotic Network; AERONET) is generally sparse despite a significant increase in the number of sampling sites worldwide during the last two decades. Likewise, simulated aerosol distributions (e.g., The Modern-Era Retrospective analysis for Research and Applications; MERRA-2) (Gelaro et al., 2017) are unable to resolve the composition of aerosol mixtures at scales comparable to those used by moderate-resolution spaceborne imagers (footprint ∼ 30 m), such as the Operational Land Imager (OLI) aboard Landsat-8. Due to these caveats, NASA’s approach to the characterization of aerosol properties for each satellite observation is currently carried out based on discrete aerosol categories selected dynamically (e.g., as a function of relative humidity (RH), Ahmad et al., 2010, hereafter A2010) using observed near- and shortwave-infrared reflectances (hereafter NIR and SWIR, respectively). Other relevant AC processors apply different techniques or aerosol models to account for the aerosol contribution (Pahlevan et al., 2021a), yet, we primarily focus on NASA’s AC procedure adopted by the U.S. Geological Survey for Landsat-8 data processing (Franz et al., 2015; Pahlevan et al., 2017b).
The A2010 model developments are guided experimentally via observations at selected AERONET sites and are categorized according to relative humidity (RH) (Ahmad et al., 2010). The interplay between RH and aerosol optical properties has long been recognized in marine environments (Shettle and Fenn, 1979; Gerber, 1985). However, these relationships may not apply to inland and nearshore coastal waters having a weak marine influence due to the major impact of land processes (e.g., evapotranspiration (Raoufi and Beighley, 2017)) on RH. Unlike empirical models, theoretical A2010 models use a suite of AERONET measurements collected across several small open-ocean islands and three stations along the Chesapeake Bay region to constrain the aerosol properties in marine environments suited for heritage ocean-color observations (open water and coastal, respectively). Further, A2010 models have two main characteristics: 1) they have been developed by assuming two size distribution modes (i.e., fine and coarse) having an extreme range of contributions in terms of number density, and 2) they only simulate weakly absorbing aerosols by using spherical and relatively small-sized particles (i.e., dust is not included). As an example, SSA and asymmetric properties of A2010 models corresponding to RH = 80% are shown in Figure 1. For NASA’s standard AC (Mobley et al., 2016), the selection of these aerosol models is constrained by RH sourced from assimilated ancillary data. A recent study has reported large uncertainties in RH over continental regions (Mélin et al., 2022), likely leading to incorrect selection of aerosol models and subsequent effects on derived Rrs over inland and nearshore coastal waters.
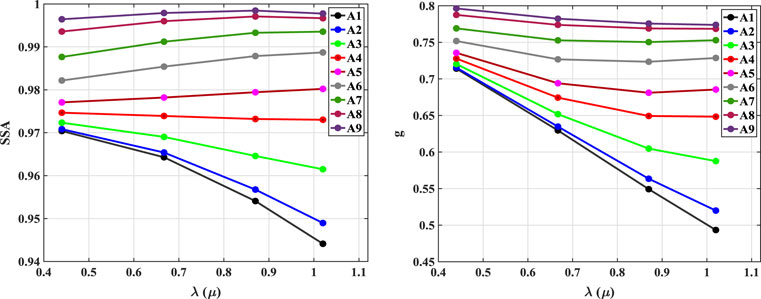
FIGURE 1. Single Scattering Albedo (SSA) and asymmetry parameter (g) for selected A2010 (RH = 80%). The models are sorted according to size fractions with increasing coarse modes from A1 through A9.
In general, the use of empirical aerosol models (i.e., entirely derived from in situ measurements) for AC has been customary in terrestrial remote sensing studies (Vermote et al., 1997; Dubovik et al., 2002a; Roger et al., 2022). These models are usually calibrated with data obtained from well-known aerosol sources (e.g., biomass burning) (Sayer et al., 2014). Although several statistical techniques have been proposed for deriving global aerosol classes from airborne and land-based (e.g., AERONET) measurements (Omar et al., 2005; Giles et al., 2012; Russell et al., 2014), none of these investigations have been applied to the study of aquatic ecosystems. In essence, no comparisons between empirical and theoretical aerosol models have been made to evaluate the advantage and disadvantages of each model for representing aerosol mixtures over aquatic environments having a weak (e.g., estuaries) or strong (e.g., lake) continental influence.
Our objective is to develop and validate globally applicable empirical aerosol mixtures that can be applied to continental waters, complement A2010 models, and improve AC methods over inland and nearshore coastal waters. Our empirical models are constructed according to AERONET measurements associated with relatively low aerosol optical depth (AOD (0.44) ≤ 0.4), the range where AC is oftentimes carried out in practice. The methodology for this contribution is organized in four subsections 1) the classification of aerosols based on clustering of aerosol properties as derived from global AERONET measurements, 2) the validation of aerosol types derived from the proposed clustering technique (i.e., Partition Around Medoids; PAM), 3) the comparisons between PAM- and A2010-based aerosol models for microphysical properties, and 4) the demonstration of the validity and efficacy of PAM models in the context of AC.
The first subsection involves the dimensionality reduction of aerosol parameters and describes the criteria for selecting the maximum number of clusters. The identification of aerosol sources based on literature, the definition of PAM clusters in terms of aerosol types, and the presentation of the classification performance are explained in the second subsection. The verification of realistic representations of aerosol types was centered around two techniques (the dominant clusters and the Multidimensional Euclidean Distance; MED). The third subsection highlights similarities and differences between PAM and A2010 models and the benefits and caveats of using them in continental- and marine-dominated aerosol environments. Lastly, we describe experimental machine-learning (ML) AC processors to showcase the advantages of integrating PAM aerosol models for retrieving
Optical and microphysical aerosol properties for the total atmospheric column were obtained from daily Version 3, Level 2.0 inversion AERONET products between June 1993 and September 2019. The geographic distribution of measurements is shown in Figure 2. Our original database has 74,627 records from 806 monitoring locations. The quality control of Version 3, Level 2.0 products includes an automatic cloud screening and instrument anomaly detection (e.g., obstruction of field-of-view) (Smirnov et al., 2000; Giles et al., 2019). The inversion of aerosol properties relies on fitting radiance measurements (i.e., direct Sun and angular distribution of diffuse contributions) to radiance estimates derived from a radiative transfer model (Dubovik and King, 2000). Consistently, all Sun and sky radiance measurements made by AERONET since 1993 have been performed with CIMEL sun-photometers (Holben et al., 1998). The spectral configuration of these instruments is based on the ultraviolet (UV) (λ = 0.34 and 0.38 µm), visible (λ = 0.44, 0.5, 0.675 µm), as well as NIR and SWIR (λ = 0.87, 1.02 and 1.64 µm) channels that had been slightly modified in some monitoring sites (Barreto et al., 2016). The daily arithmetic average of aerosol optical inversions is reported at four wavelengths (λ = 0.44, 0.675,0.87, and 1.02 µm). It comprises microphysical (e.g., real (nr) and imaginary (ni) part of refractive index, respectively) and optical (e.g., SSA) properties (Table 1).
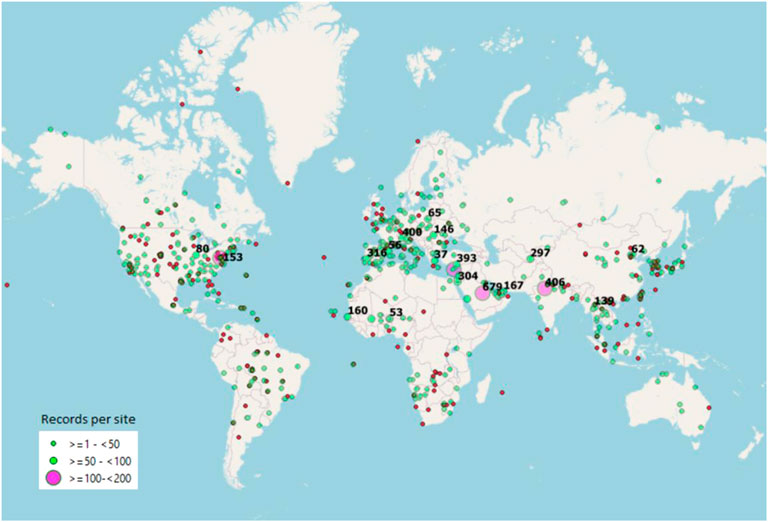
FIGURE 2. The global network of AERONET sites. The sites with > 50 daily records are labeled with numbers (see Supplementary Appenedix Table A2 for specific site names). The green and magenta circles denote the sites whose observations were utilized in clustering. The sites without SSA/AEa inversions are marked with red circles. The data for developing PAM models were collected between October-1993 and September-2019.

TABLE 1. List of acronyms.
For the spectral range of 0.44–0.87 μm and AOD(0.44) values between 0.4 and 1, the average uncertainty for AOD, SSA, the asymmetry parameter (g), nr and ni, at λ = 0.44 µm is ±0.02, ±0.03, ±4%, ±0.04, and ±30–50%, respectively (Dubovik et al., 2002b; Johnson et al., 2009; Giles et al., 2012). Uncertainties in SSA, nr, and ni values increase for AOD(0.44) < 0.4, leading to maximum uncertainties of ±0.09, ±0.05, and ±100%, respectively (Dubovik et al., 2002a; Dubovik et al., 2002b). Note that errors on SSA retrievals, as inferred from their standard deviations, vary spectrally and with respect to aerosol types (e.g., ±0.055 and ±0.11 at λ = 1.02 µm and for dust and urban/industrial aerosol sources, respectively) (Sinyuk et al., 2020). For the visible-NIR region, the maximum uncertainty associated with the extinction and absorption Ångtrom exponents (AEe and AEa, respectively) is approximately ±9% (Wagner and Silva, 2008; Giles et al., 2012). Uncertainties in microphysical properties rv, σv and Cv (i.e., the logarithmic volume median radius, the standard deviation, and the particle volume concentration, respectively) are less influenced by AOD and may vary between ±10% and ±35% for an intermediate size range (i.e., particle radius, r = 0.1–7 μm) and up to 100% near the edges of the size distributions (Dubovik et al., 2000). These uncertainties on retrieving aerosol size properties also depend on the aerosol type (Giles et al., 2012).
The number and type (i.e., optical vs. microphysical) of aerosol properties used for discriminating different aerosol mixtures based on AERONET measurements vary across various studies due, in part, to differences in the number of records and their temporal/spatial characteristics. Here, the selection of aerosol properties was according to five criteria: 1) minimum cross-covariation between variables, 2) aerosol properties linked to PSD, particle shape and absorption characteristics (e.g., AEe, g, and SSA, respectively), 3) optical parameters having spectral information (e.g., AEe, AEa), 4) aerosol attributes with relatively small uncertainties (i.e., < 30%), and 5) number of parameters leading to the maximum number of clusters (Kmax) (see section 2.3). Three aerosol properties met these criteria: SSA(0.44), AEe, and AEa (Supplementary Appendix Table A1). Indeed, preliminary results suggested minimum covariation between the variables above, as inferred from the coefficient of determination (r2 < 0.25). For instance, SSA(0.87) was excluded from the analysis since preliminary results indicated a lower number of clusters when this property was included. Spurious AEa estimates were removed as they represented < 0.5% of the total records used for clustering. An important assumption in our clustering is that aerosol properties excluded as input in the PAM classification are also unique for each cluster they are associated with because the considered aerosol properties are substantially correlated with those excluded. The AERONET dataset was stratified in different ranges of AOD as suggested in several studies (Levy et al., 2007; Kahn et al., 2016). The main application of our aerosol classification is to identify aerosol models applicable to AC over inland and coastal waters. Naturally, the AC and subsequent inversions of in-water optical properties are relatively confidently conducted if the aerosol loading were relatively low (i.e., AOD(0.44) ≤0.4). Thus, only aerosol measurements obtained under this atmospheric turbidity were used for the PAM classification, reducing the number of AERONET samples by 87%, leading to a total of 9,352 samples. This data reduction did not compromise the number of computed clusters, nor the general spatial coverage and seasonal variability of aerosol properties summarized in the original dataset (i.e., with all the AOD values included). Although accurate SSA and AEa estimates can only be achieved for both AOD(0.44)≥ 0.4 and large zenith angles (i.e., > 50°), we adopted daily averages of relatively low AODs that contain instances of AERONET Level 2.0 records with AODs exceeding the threshold. By using this AERONET Level 2.0 subset, we assume that the absorption-related properties can be applied to the lower AOD data for the entire day. This assumption was validated by comparing changes in mean SSA(0.44) values as a function of mean AOD(0.44) for different aerosol loading intervals. For example, at the GSFC site, the coefficient of determination was close to zero suggesting no relationships for daily mean comparisons of SSA-AOD and AEa-AOD obtained for low (≤0.4) and intermediate (i.e., ≤ 1) daily mean AOD values (see Supplementary Appendix Figure A1).
Note that high atmospheric turbidity (AOD(0.44) ≥ 1) represented 15% of the AERONET dataset assembled in this study. The above pre-sorted database (N = 9,352) containing SSA and AEa inversions was split into two batches (i.e., 75% training and 25% validation data chosen based on odd/even indices (Omar et al., 2005)). Lastly, these data subsets were stratified according to AOD(0.44) thresholds (i.e., only records with AOD(0.44) ≤0.4 were preserved) before applying the PAM clustering technique (see Section 2.3 and Section 2.4).
The classification of aerosol properties has been investigated using unsupervised and supervised algorithms with different skills and limitations (Omar et al., 2005; Giles et al., 2012; Russell et al., 2014; Hamill et al., 2016). Here, discrete aerosol classes were estimated using an unsupervised classification based on PAM (Kaufman and Rousseeuw, 1990) (Figure 3).

FIGURE 3. PAM classification of aerosols.
This top-down clustering algorithm minimizes the distance of each point i with respect to the nearest centroid or “medoid” and requires a first guess in terms of Kmax (the maximum number of clusters). Unlike the k-means algorithm (MacQueen, 1967), the “medoid” is a data point, and PAM can be used with non-Euclidean distances and non-spherical clusters. The Mahalanobis Distance (MD) was chosen for the PAM analysis since it is not sensitive to outliers and weak cross-correlations between variables. MD measures the dissimilarity between two vectors (u and v) with covariance S (Varmuza and Filzmoser, 2016):
where superscript T denotes the matrix transpose, and u,v vectors are composed of pre-selected aerosol properties. Kmax was estimated using the Silhouette index (Sil) (Rousseeuw, 1987) after initializing PAM with 30 potential clusters (i.e., initial guess). This initial guess corresponds to an intermediate number of aerosol mixtures with respect to the range reported in the literature (i.e., 4 to 74 aerosol models) (Omar et al., 2005; Giles et al., 2012; Russell et al., 2014; Li et al., 2015; Hamill et al., 2016)). Sil is defined as:
where b(m) and a(m) are the minimum dissimilarities (“distance”) from sample m to samples not belonging to the cluster k. The Silhouette magnitude varies between −1 and 1 and measures how similar an object is relative to its own cluster with values near +1 (cohesion) compared to other groups with values near –1 (separation). The criterion here for estimating the final Kmax used in each clustering process was a Sil greater or equal to 0.51 (i.e., a threshold above which the clustering structure is at least “reasonable’) (Kaufman and Rousseeuw, 1990). The remaining Sil-based clustering structure definitions are “no substantial”, “weak”, and “strong” (i.e.,−1 to 0.25, 0.26–0.5, and >71, respectively). Preliminary results suggest insignificance of two small-sized clusters (N < 30) that were excluded from the analysis due to extremely low (high) SSA (AEa) values likely related to the relatively high uncertainties of these parameters. Thus, a group of records was considered a cluster only if that potential cluster has at least 50 daily records with Sil ≥ 0.51.
The relative cluster size (CS) was defined as the number of records belonging to cluster k divided by the number of records of all clusters encompassing 9,352 observations. Lastly, the cluster structure goodness (CSG) was defined as the number of records of cluster k with Sil ≥ 0.51 divided by the total number of records in cluster k. CSG is independent of the number of measurements and indicative of how “compact” (i.e., homogeneous in terms of aerosol properties) each cluster is. No CSG thresholds were used for defining the maximum number of clusters as estimated from PAM.
Ground-truthing of aerosol models derived from clustering of AERONET measurements is commonly based on known aerosol sources (e.g., areas with continuous industrial activity) (Omar et al., 2005) or in situ airborne experiments (e.g., Aerosol Characterization Experiment-Asia) (Kim et al., 2007). An aerosol source may only be dominant within a month or season in some areas rather than during an entire year (e.g., dust in spring at Kanpur, India) (Giles et al., 2012). In general, aerosol sources are linked to five primitive aerosol types: 1. dust, 2. mixed, 3. urban/industrial, 4. biomass burning, and 5. marine, hereafter DU, MIX, U/I, BB, and MAR, respectively (Omar et al., 2005).
The first step in evaluating the clustering results was the association of each common AERONET site (i.e., used by PAM and cited in the literature) with one primitive aerosol type that was dominant throughout the year (Omar et al., 2005; Giles et al., 2012; Russell et al., 2014) (Supplementary Appendix Table A2). The second step was to label each cluster in terms of “most likely” aerosol type by analyzing the frequency and presence of sites described in step 1 in each cluster. Thus, more than one cluster can be aggregated within the same aerosol type resulting in “aerosol sub-types”. The third step was the prediction of the aerosol type in each reference site as estimated from PAM and comparison with the initial label assigned in step 1. To accomplish this last task, the PAM results were validated with respect to different geographic locations and periods of the year (annual and seasonal analysis, respectively).
The annual analysis encompassed the evaluation of two metrics: 1) dominant annual clusters, and 2) minimum Multidimensional Euclidean Distance (MEDmin). Comparisons for MAR aerosols were not performed due to the lack of data given the relatively low AOD of marine environments and known difficulties for obtaining accurate SSA and AEa inversions. A dominant cluster and associated aerosol type at the AERONET site j were defined as the most frequent cluster if the minimum number of records was greater than two and no co-dominance was present (i.e., at least two aerosol types have the same frequency). The MEDmin metrics were applied to an independent AERONET dataset created in section 2.2 computed at the monthly scale based on dominant clusters derived from PAM. The MEDmin calculations were focused on four AERONET sites (Solar Village, XiangHe, Mexico City, and Mongu) where a consensus among studies regarding the annual dominance or co-dominance of aerosol sources (DU, MIX, U/I, and BB, respectively) were found (Omar et al., 2005; Giles et al., 2012; Russell et al., 2014; Hamill et al., 2016) (Supplementary Appendix Table A2). The MED is equivalent to the norm of the difference between u and v vectors:
where u and v represent mean aerosol properties for dominant PAM-derived cluster and independent dataset, respectively, for month m, subscripts 1, 2, and 3 indicate the arithmetic average of SSA(0.44), AEe, and AEa, respectively. This arithmetic average is multi-annual for PAM-derived classes and monthly for the validation dataset. The aerosol type associated with the PAM-derived cluster with the minimum MED was selected for each site and month. The classification performance of PAM for aerosol types was quantified as unity (Number of mismatches/(Number of matches + mismatches). For the same aerosol type, matches for dominant annual clusters were computed based on several previous study sites. Conversely, matches for MEDmin were examined with respect to a single reference location but using multiple monthly estimates. Also, reference aerosol sources for the MEDmin technique were based on PAM-derived types.
Seasonal validations were examined at three AERONET sites (i.e., GSFC, Kanpur and Banizoumbou, Figure 3, Supplementary Appendix Table A1) where the aerosol composition during different periods of the year has been investigated in detail (Omar et al., 2005; Levy et al., 2007; Giles et al., 2012; Russell et al., 2014). The analysis consisted of characterizing changes in PAM-derived aerosol types among seasons and comparing the patterns described in published studies.
The optical inversion implemented by AERONET for retrieving aerosol optical properties differs from that applied in A2010. The AERONET radiative transfer model has additional assumptions regarding surface reflectance and multiple scattering effects (García et al., 2008; Giles et al., 2012; Sinyuk et al., 2020). Thus, the optical properties of PAM-derived and A2010 aerosol models may not be compared unless Mie simulations are performed for calculating the optical properties of PAM and A2010 models. The simulations for “adjusted” A2010 models should be done using mean volume density concentration fractions derived from each PAM cluster. To simplify the calculations, a first attempt to investigate the similarities and differences between PAM and RH-based A2010 models was made using the refractive index (nr and ni) and two microphysical properties defined in the number density space (the mean radius and width of PSD, rn and σn, respectively, Table 1). Since AERONET inversions are carried out with PSDs in volume space, a transformation was performed to compute PSD-related parameters in number density units as in A2010. Further, unlike A2010, the refractive index in PAM-derived models is not resolved as a function of PSD modes. Thus, nr and ni values for fine and coarse modes of A2010 models were merged by using the number density function (NDF) of every RH case study (i.e., 30, 50, 70, 75, 80, 85, 90, and 95%) as a weighting factor:
where <> indicates the NDF-weighted parameter, and x represents nr or ni. As a result of the above formulation, the PAM and RH-based aerosol mixtures can be directly compared and assessed for their complementary nature and/or differences.
For a practical assessment of the efficacy of the PAM models in the context of AC, we integrated our models into an experimental AC framework. Adapting the state-of-the-art processors (Pahlevan et al., 2021a) was unachievable due to a number of reasons, including, their theoretical limitations for handling absorbing aerosols (e.g., they cannot be detected using the NIR band ratio (Chomko and Gordon, 1998)) and the difficulty in their formulation and implementation (e.g., re-generating Rayleigh look-up-tables, single-scattering to multiple-scattering conversion). Inevitably, we developed two machine learning (ML) processors to convert top-of-atmosphere reflectance (
The input to the RT code consisted of in situ
To further constrain the number of simulations, only a subset of A2010 models representing fine-mode, weakly-to-non absorbing models (indexed 1 through 7) modulated by a few RH cases (50, 70, and 80%) were applied (we assumed an absence of oceanic aerosols). This choice of A2010 models was determined from Landsat-8/OLI matchups processed via the SeaWiFS Data Analysis System (SeaDAS). The final combination of aerosols for ACI yielded 21 (= 7 × 3) different aerosol models and 48 (=27 + 21) for ACII. The rest of the input parameters, including atmospheric gaseous concentrations (NO2 and O3 at 0.17 and 290 Dobson, respectively), water vapor amount (3 g cm−2), wind speed (3 m s−1), and surface pressure (1,017 mb), were assumed constant.
Our ML model is a class of neural networks referred to as Mixture Density Networks (MDNs) (Bishop, 1994), which learn conditional probabilities for input (
More specific information that corresponds to the development of MDNs is enlisted in Table 2. The input and output features were log-transformed and scaled with mean and standard deviations. Like previous studies (Smith et al., 2021; O'Shea et al., 2021), the final model prediction is the median of 10 ensembles (i.e., MDN iterations). For the matchup assessments, median

TABLE 2. Properties of MDNs used for developing our experimental AC processors.
For performance evaluations, we applied the metrics below
where
The unsupervised classification of aerosols based on PAM resulted in 27 clusters (Table 3). This number of aerosol mixtures is relative as it may vary for higher or lower Silhouette thresholds (e.g., 1 and 200 mixtures, respectively). However, an intermediate Sil index (≥0.51) was adopted to reduce the processing time without compromising the number of potential aerosol classes reported in the literature (Omar et al., 2005; Giles et al., 2012; Russell et al., 2014; Hamill et al., 2016). Each PAM cluster represents an aerosol model mixture with specific microphysical and radiative properties. Also, each cluster is composed of multiple AERONET sites and measurements obtained during different periods of the year. To interpret regional and temporal changes in the aerosol compositions, the PAM models were assigned to five broad aerosol types based on AERONET sites widely cited as aerosol sources (Omar et al., 2005; Giles et al., 2012; Russell et al., 2014). This aerosol classification was also critical for validating and predicting the monthly and annual composition of dominant aerosols, as described in section 3.2. A few representative AERONET sites assigned to different clusters are illustrated in Figure 4.
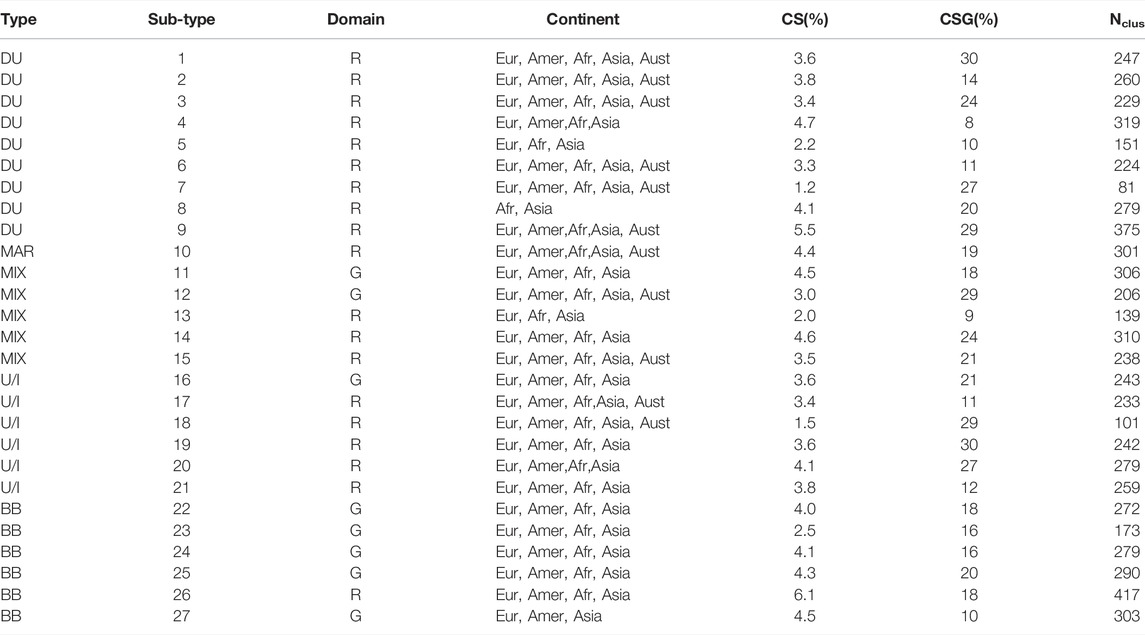
TABLE 3. PAM-derived aerosol models. G: global, R: regional, Eur: Europe, Amer: America, Aust: Australia, Afr: Africa, Nclus: number of records per cluster, CS: Cluster Size, CSG: Cluster Structure Goodness.
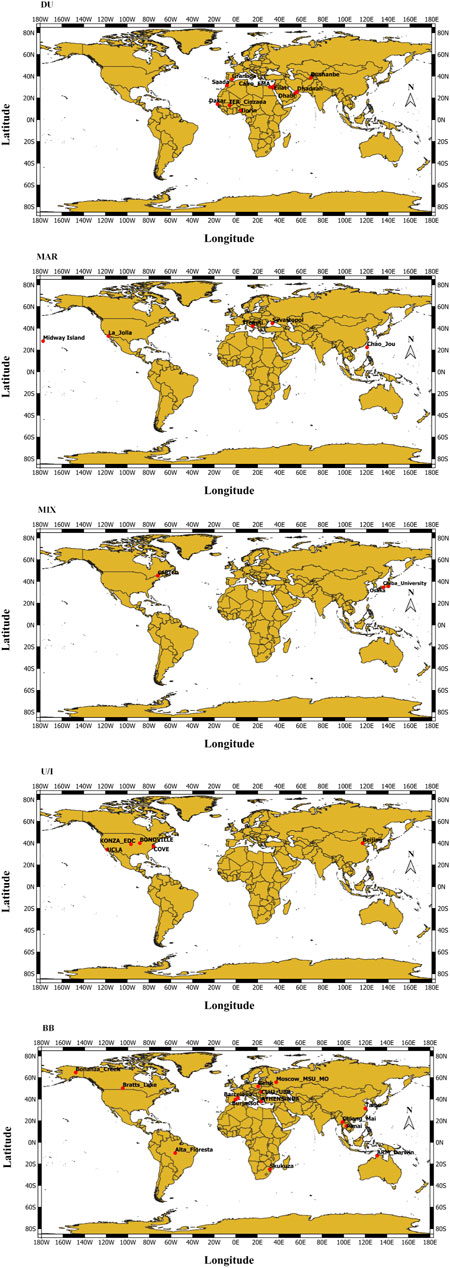
FIGURE 4. Examples of PAM-derived aerosol types in AERONET sites. Sub-types 1–10. Examples of PAM-derived aerosol types in AERONET sites. Sub-types 11–21. Examples of PAM-derived aerosol types in AERONET sites. Sub-types 22–27.
Here, one aerosol type can be grouped into more than one PAM-based cluster, thus, PAM models can be defined for aerosol sub-types that characterize a new mixed type. The PAM models in Table 3 are categorized according to the mean values of fine mode Cv fraction [i.e., FCvfine = Cvfine/(Cvfine + Cvcoarse)] per aerosol type. Therefore, aerosol sub-types 1 through 9 correspond to DU (Cv fraction as percentage = 10.2–25%), 10 to MAR (43%), 11–15 to MIX (27.4–59.4%), 16–21 to U/I (34.6–67.5%) and 22–27 to BB (48–65.9%). The CS values among sub-types were highly variable (1.2–6.1%), but the average value per type was comparable between the basic five aerosol sources used here (∼3%). The CSG values varied mainly between 8 and 30%. All PAM models had a designated “regional” distribution (i.e., not all continents had measurements); however, the BB aerosol type tended to be represented by a “global” distribution (i.e., AERONET records in all continents but sub-Arctic locations).
In general, most AERONET measurements applied in the PAM classification (95%) were concentrated in the Northern Hemisphere and corresponded to spring-summer months (63.3%) (Table 4). Despite this latitudinal asymmetry, BB, MAR, MIX, and U/I aerosol types tended to be more prevalent over sites south of the equator. This spatial pattern was reversed for DU, possibly due to both the lack of significant dust sources (e.g., compared to Saharan and Gobi Deserts) and the location of AERONET sites near dust regions in the Southern Hemisphere.
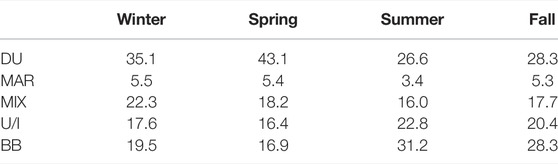
TABLE 4. Seasonal aerosol-type distributions. Values represent the total percentage (i.e., Northern and Southern Hemispheres) for each aerosol category. Each column sums up to 100%.
In general, DU models were dominant in all months, representing 32% of aerosol records with the highest contribution during spring (43.1%). The AERONET measurements with biomass burning classification were the second most dominant aerosol type during an annual cycle with the highest contributions during summer (31.2%), followed closely by the fall period (28.3%) (Table 4). Marine-dominated aerosols only account for less than 6% in all seasons, possibly due to the limited availability of inverted AERONET aerosol properties for AOD(0.44) < 0.4 across most of these locations. The highest seasonal contribution associated with the MIX aerosol type was 22.3% and occurred during winter. Also, the influence of MIX aerosols decreased during warmer months and was characterized by a weak inter-seasonal variability. Like BB, the U/I aerosol type had the highest seasonal contribution of (22.8%) during summer followed by the fall period (20.4%).
Table 5 summarizes the mean values of SSA(0.44), AEe and AEa for each aerosol class derived from PAM and the mean values of other relevant aerosol properties (e.g., g, rn, and nr) correlated with our input classification parameters. These values are within the expected range for aerosol types described in the literature (Dubovik et al., 2002a; Giles et al., 2012; Russell et al., 2014; Roger et al., 2022). The standard deviation of each aerosol property is not shown as the intra-cluster variability can be inferred from CSG values computed in Table 3. In general, the magnitude of AEe decreased (increased) at lower (higher) aerosol sub-type numbers (e.g., 0.27 to 0.70 for DU sub-types 1–9) (e.g., 1.46 to 1.88 for BB sub-types 22–27) due to smaller (larger) contributions of fine aerosol particles. Mean values of AEa for DU ranged from 1.5 to 2.5, with values closer to 1 typically associated with the remaining aerosol types. On average, fine and coarse mode particles had the smallest radius for DU sub-types (0.04 and 0.69 μm, respectively). In general, σnfine (σncoarse) decreased (increased) in aerosol types with higher FCvfine values (e.g., σnfine up to 0.63 and 0.45 in DU and BB, respectively). The real (imaginary) part of the refractive index for DU-like models was commonly high (low) with respect to the other aerosol types (e.g., maximum nr(0.44) and minimum ni(0.44) for DU sub-types were 1.498 and 0.001, respectively). The variability for nr (ni) in the blue or NIR spectral range was relatively small (large) with values < 5% and >90%, respectively. As expected, the asymmetry parameter tended to decrease as FCvfine increases (e.g., the mean g(0.44) for DU and BB types was 0.750 and 0.688, respectively).
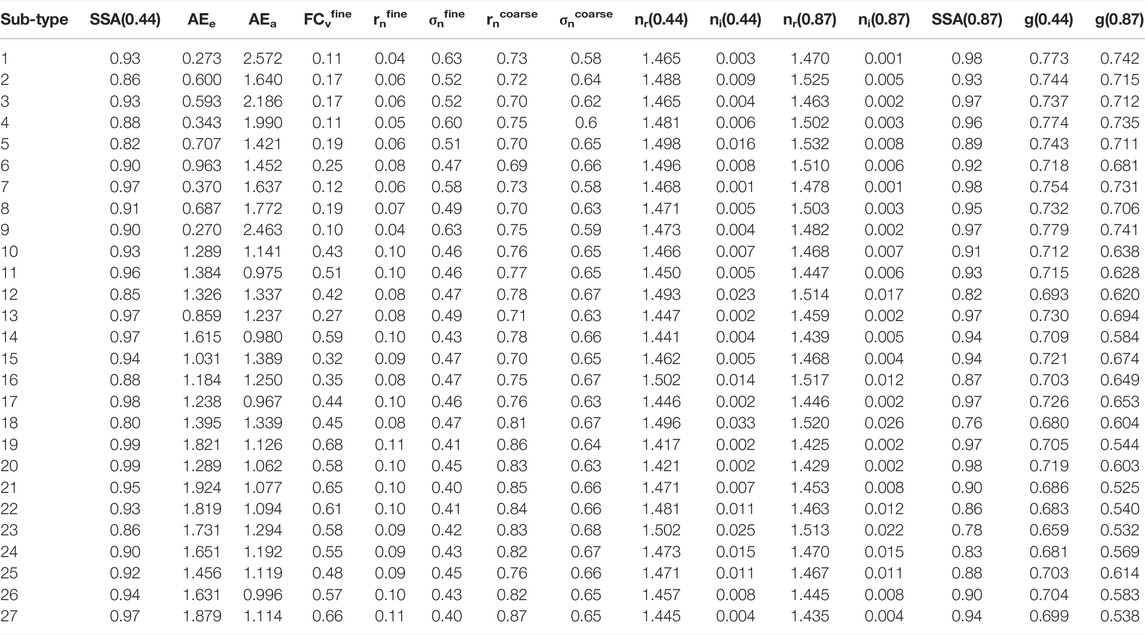
TABLE 5. Summary of aerosol properties per cluster. Each value corresponds to the arithmetic mean. Units of properties are described in Table 1. Sub-types 1–9 are DU, 10 is MAR, 11–15 are MIX, 16–21 are U/I, and 22–27 are BB.
The differences between PAM-derived aerosol types are also present when angular and spectral changes of aerosol properties are considered. To emphasize these variations, selected models represented in the four aerosol types are depicted in Figure 5. In general, DU-MIX (BB-U/I) sub-types had the lowest (highest) backscattering contributions as inferred from their normalized phase (Pa) functions (i.e., θs = 90° to 160°) (Figure 5B) with the MAR models having intermediate values. Note that several curves may be depicted with the same color when the main aerosol type is composed of more than one PAM model (i.e., sub-type).
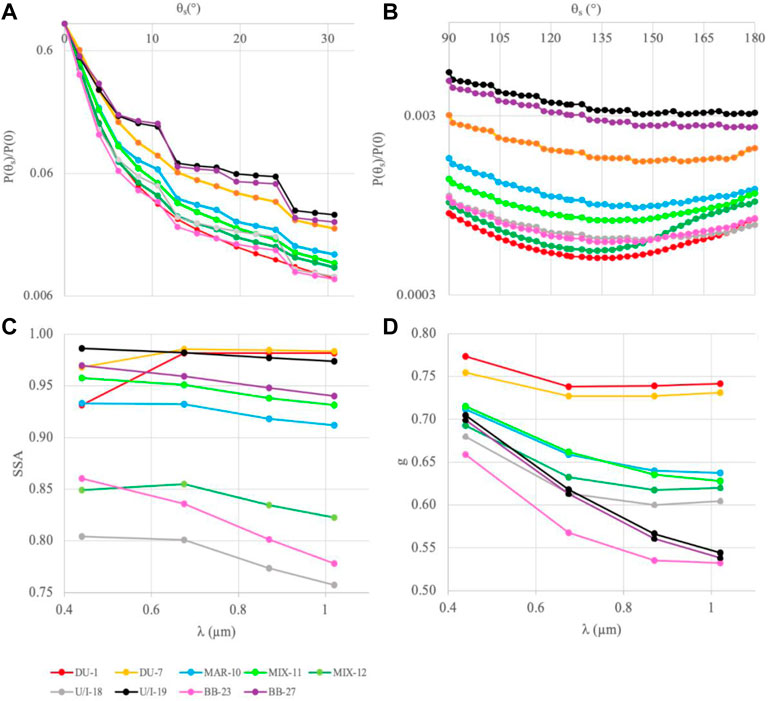
FIGURE 5. Spectral variation of aerosol properties for selected PAM-derived clusters and associated types. Arithmetic average of normalized phase function at scattering angle θs = 0°) for forward panel (A) and backscattering angles [panel (B)], SSA [panel (C), and g [panel (D)]. Curves with the same color symbol represent different aerosol models of the same type (Table 5). The numbers next to aerosol types represent PAM-derived subtypes (Table 5).
In the forward-scattering direction (i.e., θs = 5 to 25°) (Figure 5A), there was not a clear differentiation between DU-MIX and BB-U/I sub-types. Likewise, aerosols mainly composed of sea salt were characterized by a normalized phase function falling in the middle of the envelope composed of all aerosol models. The spectral behavior of SSA was a good indicator to discriminate aerosols with different compositions as three general patterns are observed: P1. aerosols with SSA increasing with λ (e.g., DU), P2. aerosols with SSA decreasing with λ (e.g., BB and MAR), and P3. aerosols presenting P1 and P2 (e.g., U/I and MIX) (Figure 5C). Spectral curves of g are depicted in Figure 5D and suggest a direct relationship between the spectral slope and FCvfine. More specifically, the spectral slope of g between 0.44 and 1.02 µm were high (low) for fine-mode (coarse-mode) dominated aerosol assemblages (i.e., BB-U/I and DU sub-types, respectively). Likewise, aerosols with a substantial contribution of fine and coarse particles (i.e., MIX and MAR) presented intermediate values of g spectral slopes. The complementary components of the PAM models are readily inferred by comparing these spectra with the A2010 models shown in Figure 1.
The calculation of dominant clusters over AERONET sites reported in the literature for different aerosol types was used to evaluate the PAM performance for identifying aerosol reference sources. This verification was based on annually dominant aerosol categories. Thus, AERONET records corresponding to different periods of the year were merged for each annual estimate. This comparison technique had varying degrees of success as the proportion of correct matches for DU, BB, U/I, MIX, and MAR were highly variable (i.e., 67, 33, 32, 15, and 10% success rate, respectively). In general, AERONET sites with correct matches for DU (e.g., Banizoumbou, Cape Verde, Ouagadougou) were previously proposed by more than one study (see Supplementary Appendix Table A3). The sites with accurate classification of BB aerosols (e.g., Mongu, Bonanza Creek, Cuiaba) correspond with aerosol sub-type clusters 23 to 25. The PAM-based classification of the GSFC site suggested aerosols mainly originated from urban/industrial activities, which agreed with reference aerosol sources cited (Supplementary Appendix Table A3). Most sites with correct matches in U/I coincided with locations studied by Omar et al. (2005) in Supplementary Appendix Table A3 (e.g., Venise, UCLA, Mexico City) and corresponded to sub-types 20 and 21. The identification of MIX-dominated sites based on PAM was not satisfactory as PAM predictions were only correct in two reference AERONET locations (Kanpur and Howland).
The AERONET sites labeled as DU by the PAM classifier coincided geographically with deserts (Supplementary Appendix Table A4 and Figure 4) (e.g., Mojave, Sonoran). To date, no AERONET sites exist in the Gobi Desert. However, its influence was manifested in western China. Predominance of dust along with observations made in Florida and the Caribbean Sea during summer was likely related to trans-Atlantic transport of dust originated in Sahara and Sub-Sahara (Sahel) deserts of Western Africa. As expected, PAM-based marine aerosols were associated with lower altitudes with respect to the sea level (96–325 m) as nearshore coastal areas are commonly characterized by lower elevations. MAR locations were concentrated along the coast of California, the Mediterranean Sea, and the Persian Gulf. MAR was rarely determined at island sites due to their typically low AOD values and the associated limitation for retrieving absorption-related aerosol properties (e.g., SSA). Aerosol sources within the BB aerosol type (Figure 4) included sites typically influenced by wildfires (e.g., Bonanza Creek, Alta Floresta) or man-originated fires (e.g., Barcelona, Moscow and Skukuza). No BB models were present in Sudan or west Africa due to the lack of measurements, relatively high AOD, and/or major influence of dust. In Asia, BB sites were identified in Iran (e.g., IASBS), Russia (e.g., Yakutsk), Thailand, Burma, and Indonesia. Lastly, in Australia, BB aerosols were likely originated from wildfires of woodlands and forests (e.g., Lake Argyle and Lucinda).
AERONET sites for MIX were ubiquitous, and their location generally overlapped with the location of other aerosol types such as DU (e.g., Cairo_EMA), MAR (e.g., Arica), BB (e.g., Bonanza Creek), and U/I (e.g., UCLA). The AERONET sites classified as U/I corresponded with the largest cities around the world (e.g., Sao Paulo, Dragon Osaka Center, Mexico City). Also, PAM models labeled as U/I were present in highly populated areas in the U.S., Africa, Europe, and Asia (e.g., Fresno, Toulouse, Dalanzadgad, Supplementary Appendix Table A3).
In this study, an alternative evaluation of PAM’s ability for classifying aerosol types in different geographic locations was based on MED comparisons. Independent AERONET measurements were used (i.e., remaining 25% of records not included in PAM analysis), and dominant clusters were determined at the monthly scale for only four sites (i.e., Solar Village, XiangHe, Mexico City, and Mongu). Unfortunately, no MEDmin calculations were possible for the MAR type due to the scarcity of measurements. In general, the identification of aerosol types based on MEDmin was very satisfactory for DU and BB case studies (section 2.4) (i.e., Solar Village and Mongu, respectively). Indeed, the annual mean of aerosol properties in PAM-derived DU-and BB-related clusters allowed successful discrimination (i.e., 75 and 80% of months, respectively) of aerosol assemblages in pre-selected reference sites. In Solar Village, DU-related sub-types 4 and 9 were correctly predicted between January and August, however, the MEDmin estimates between September and December were poor due in part to a more diverse composition of aerosols (e.g., co-dominance of U/I and MIX) (Figure 6). The co-dominance among different DU sub-types was also observed between January and March. In Mongu, the dominant aerosol composition between June and October was BB. The co-dominance of polluted continental aerosols (i.e., U/I) during fall-winter (Omar et al., 2005) could not be corroborated in this study due to the lack of measurements (section 2.4). In XiangHe, there was no correspondence between PAM and MEDmin classifications of aerosol types as PAM-derived sub-types only matched in 9% of comparisons due to a strong co-dominance of aerosol types different from MIX. However, MEDmin was more sensitive as 67% of monthly data were labeled as MIX. The validation results were also unclear in Mexico City, where PAM clusters suggested a co-dominance between U/I and BB and during different periods of the year. Also, MEDmin failed to correctly identify the dominant aerosol composition as 90% of monthly comparisons were associated with BB (e.g., sub-types 23 and 24). In this case, BB could be a dominant sub-type during periods of moderate AOD (∼0.4) for which the AERONET retrieval is obtained. In contrast, our PAM clustering is based on lower AOD values. As a result, the validation procedure is dependent on the assumption that the estimation of the aerosol type is conserved at lower AOD.
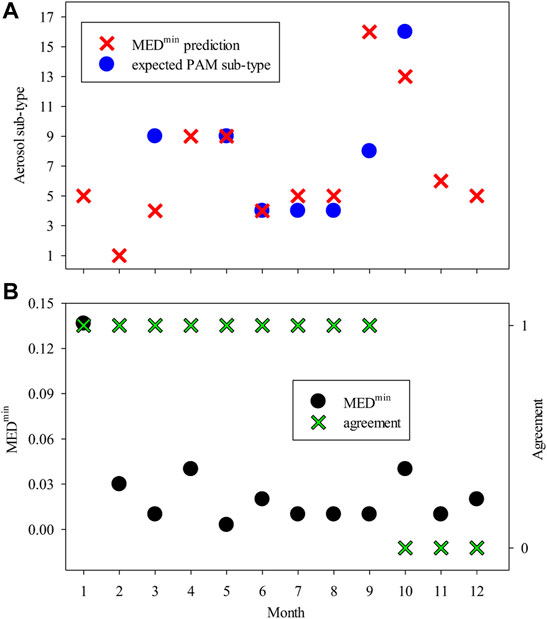
FIGURE 6. Validation of aerosol models using MED in Solar Village. Predicted aerosol sub-types (A), MEDmin prediction performance (B). The mismatch between aerosol types is an agreement of 0. No blue circles when co-dominance is present.
Monthly variability of dominant clusters and their mean aerosol properties are depicted in Figure 7 for three AERONET locations (GSFC, U.S. East coast; Kanpur, Northern India; and Banizoumbou, West Africa). Most observations at GSFC were made in spring-summer and showed a dominance of PAM clusters linked to U/I and BB during spring-summer and fall, respectively (Figure 7A). Winter months commonly exhibited a more heterogeneous composition of aerosols with co-dominance of one or more types (e.g., missing bars in Figure 7A). The transition from spring-summer to fall was associated with higher SSA(0.44) and lower AEe and FCvfine values (Figure 7B). Also, the variability of AEa for both dominant clusters was around 1. Months with missing mean aerosol properties coincided with periods of the year where co-dominance of aerosol sub-types occurred. The variation of aerosol composition at Kanpur was characterized by MIX and DU aerosol types during winter and spring-fall, respectively (i.e., PAM clusters 15 and 2,5,8, respectively) (Figure 7C). Unlike GSFC, the number of AERONET observations was smaller and concentrated in the spring months. Changes in aerosol properties of dominant clusters coincided with an increase of AEa and SSA(0.44) from spring to fall months(Figure 7D). Banizoumbou was characterized by DU-related aerosol sub-types (e.g., 1,2,4 and 9) during all seasons (Figure 7E). Likewise, DU-BB co-dominance was mainly present between July and January. October was associated with relatively high SSA(0.44) (∼0.92), AEe (0.84) and FCvfine (0.128) values (Figure 7F). Maximum mean values of AEa (2.7) were calculated in June when AEe (0.1) and FCvfine (0.08) were relatively low.
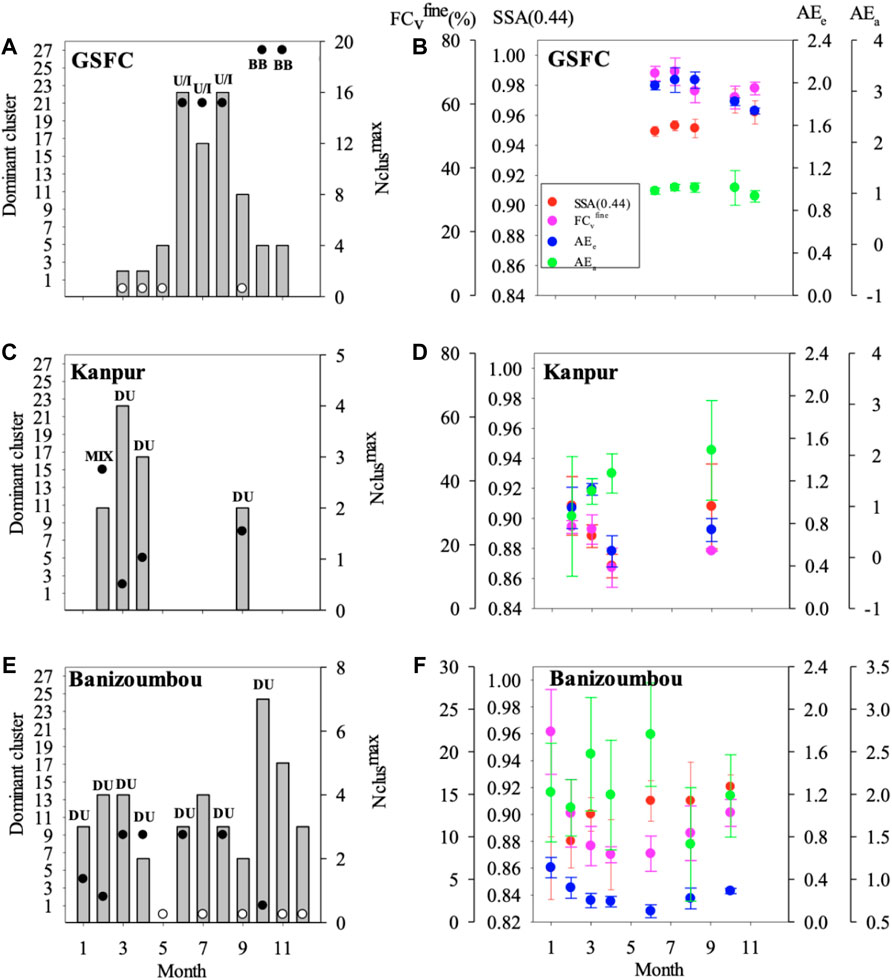
FIGURE 7. Site-specific monthly variability of PAM-derived aerosols. GSFC (A, B), Kanpur (C, D), Banizoumbou (E, F), dominant aerosol sub-type ids (left panels, solid circles), types (bold legend) and their mean properties (right panels), co-dominance of clusters (left panels, empty circles), Nclusmax is the number of records for the dominant cluster.
The performance of ACI and ACII for each AERONET-OC site is illustrated in Table 6. The performance metrics, and their ratios, suggest up to 30% improvements in estimating
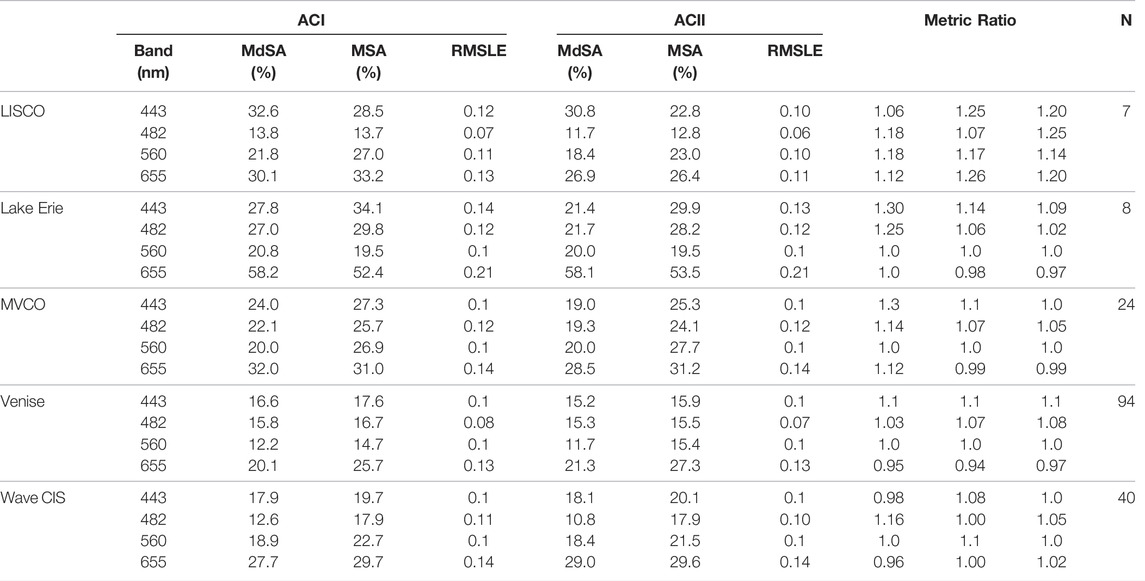
TABLE 6. Per-site matchup statistics (Eq. 5–7) for the performance of our experimental AC processors (ACI and ACII). The number of matchups is provided in the last column.
To further illustrate the improved spectral patterns in retrieved
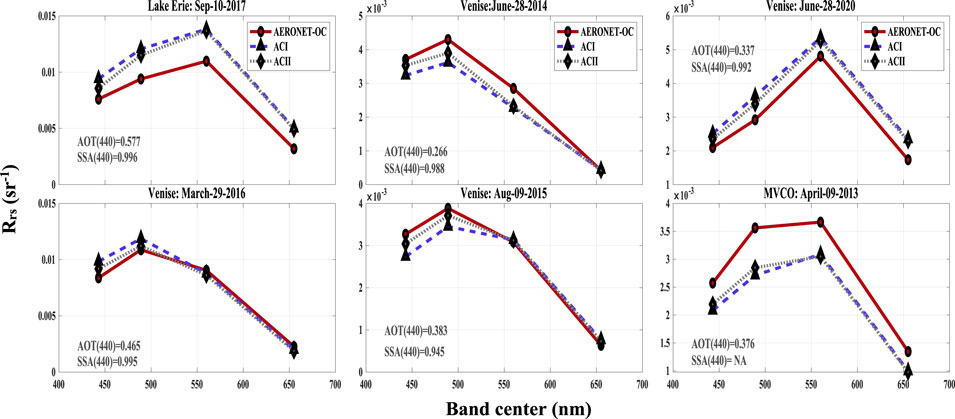
FIGURE 8. OLI-retrieved
This study’s categorical analysis of aerosols was based on PAM, an unsupervised classification technique. There is no consensus in the literature regarding the preferential use of unsupervised over supervised methods for obtaining different aerosol classes. The main advantage of using a supervised algorithm is that clustering results are not abstract (i.e., aerosol classes have already been assigned to an aerosol type). Conversely, categories computed from unsupervised clustering must be interpreted a posteriori using reference information (i.e., aerosol sources). Here, the maximum number of clusters was defined based on the Silhouette index, a metric successfully applied in several studies for discriminating aerosols (Omar et al., 2013; Äijälä et al., 2017; Szkop and Pietruczuk, 2019). Omar et al. (2005) computed a Kmax = 6 using an iterative criterion based on minimum cluster size. Unlike our findings, the Omar et al. (2005) estimates for Kmax were probably in the low range as their number of samples and sites was much smaller. To derive Kmax, Giles et al. (2012) utilized multiple filters (e.g., 2-D scatterplots, size thresholds). They suggested up to 8 aerosol categories that might be underestimated due to our study’s analysis of a larger number of AERONET sites. Russell et al. (2014) proposed a Kmax of seven that was established based on pre-defined aerosol sources, the Mahalanobis distance probabilities, and thresholds on aerosol properties. The smaller number of clusters in Russell et al. (2014) with respect to our study may be related to the spatially constrained analysis of AERONET sites and the strong correlation between some aerosol properties used for clustering. Overall, the finer clustering scheme adopted in this study was driven by the limited relevant information content in
The spatial and temporal global distribution of aerosol types followed different patterns related to large-scale atmospheric circulation (e.g., DU) or local conditions (e.g., U/I, BB, and MAR) (section 3.2). The prevalence of dust in the northern hemisphere has been linked to the air mass advection from deserts (e.g., Gobi and Taklamakan in north-central Asia, Saharan in Western Africa) (Tanré et al., 2003; Eck et al., 2005; Giles et al., 2011). The largest contribution of BB-related aerosols occurs during summer in northern high latitude locations, which tends to shift near and south of the equator in the northern hemisphere fall (Eck et al., 2003; Eck et al., 2009; Eck et al., 2013; Tilstone et al., 2020). Another finding was a major fraction of U/I during summer, perhaps due to humid, stagnant, and hot conditions allowing for secondary aerosol formation and hygroscopic growth due to humidification such as cloud processing (Eck et al., 2012; Eck et al., 2014).
PAM-derived aerosol properties in Table 5 showed unusually high AEe values for cluster 10 (MAR). Although AEe values up to 2.2 have been rarely measured (e.g., Lanai, Bermuda and Kaashidhoo (Smirnov et al., 2003a)), AEe values for maritime environments are typically below 1 when the aerosol optical depth at 500 nm is less than 0.15 (Smirnov et al., 2003a). The anomalous high mean value of AEe in our marine-dominated aerosol cluster is probably attributable to a relatively high contribution of fine-mode particles with a land origin (e.g., smoke) at Tremiti, Italy, and Chao-Jou, Taiwan. This hypothesis is supported by the relatively smaller FCvfine (∼0.15) of maritime aerosols (Smirnov et al., 2003a; Sayer et al., 2012a). Mean values of rv and σv for aerosol mode fractions reported in (Sayer et al., 2012a) did not explain the differences with our results as their fine and coarse particle distributions were characterized by a smaller radius (rn = 0.088 and 0.566 µm) and larger width (0.49 and 0.69) with respect to those associated to cluster 10.
The magnitude of AEe in cluster 14 was beyond the upper range of MIX aerosol assemblages, likely due to a greater contribution of particles derived from BB and U/I. In general, AEa values for MIX, U/I, MAR, and BB were low due to the increased dominance of black carbon particles. However, clusters 20 (U/I) and 25 (BB) had high AEa values indicating the possibility of brown carbon particles. Mean AEa values slightly less than one can be expected due to the uncertainty in calculating AEa from AERONET measurements (Giles et al., 2012).
The spatial analysis of PAM-derived clusters revealed that aerosols of a continental origin mainly influence most AERONET sites (Figure 4). The marine aerosol type only represents ∼ 4% of the entire database. This finding agrees with Omar et al. (2005), who suggested a minor marine contribution (i.e., 5%) based on nine years of measurements. Also, our results regarding BB contributions (26%) are comparable to those calculated by Omar et al. (2005) (26.6%).
Despite these similarities, our clustering results suggest that 1. natural sources (i.e., dust + marine) account for a more significant percentage of data due mainly to the underestimation of “dust” sites in Omar et al. (2005) (15%), 2. our U/I aerosol type contribution was 2-fold smaller, and 3. the contribution of the “mixed” aerosol type derived from PAM was more significant. Unlike our distribution of AERONET sites, the monitoring locations of Omar et al. (2005) did not include observations in Australia that were less dense in Asia, explaining the greater importance of “dust-type” particles in our study. The PAM classification generally only agreed with AERONET reference sites annually dominated by dust. Misclassification of DU was mainly due to the co-dominance of aerosol types during the same month. This inconsistency was mainly associated with aerosol classes suggested by Omar et al. (2005). Also, inconsistencies in discriminating aerosols were attributed to dataset variations (e.g., sampling periods, aerosol load) at some AERONET sites chosen as reference aerosol sources (see Supplementary Appendix Table A3).
In our study, the Ilorin and Beijing sites corresponded to DU and U/I types (Supplementary Appendix Table A3), a result that apparently contradicts (Eck et al., 2010), who suggested a composition dominated by MIX. However, most AERONET records used in (Eck et al., 2010) were characterized by AOD(0.44) > 0.4 [see Figure 2 in Eck et al. (2010)] and different climatologies (e.g., only ten years for Ilorin). The accuracy of PAM for discriminating AERONET sites characterized by dominant aerosol types was also investigated in this study based on MEDmin, suggesting a satisfactory performance for detecting sites with a predominance of DU and BB types. Based on the k-means algorithm, Omar et al. (2005) also found that most comparisons associated with DU and BB were matched correctly. Unlike the annual dominant clustering approach used here, MEDmin had a better skill to separate MIX-dominated sites, however, this advantage was not observed for the U/I case study as aerosols were classified as BB. This interference was also detected by Omar et al. (2005) for three AERONET locations (Skukuza, IMS Metu Erdeml, and Dalanzadgad) and was attributed to smoke aging.
Monthly changes on aerosol types at GSFC, Kanpur, and Banizoumbou were consistent with the aerosol type contributions computed in this study and local seasonal patterns of aerosol composition reported in the literature (Figure 7). The augmentation of smoke-related particles at GSFC during fall, dust events in Kanpur in spring, and seasonal alternate of DU-BB types in Banizoumbou are major shifts in aerosol composition that agree with global temporal patterns computed here (see Table 4). Omar et al. (2005) concluded that aerosols at GSFC are the polluted continental type with a higher contribution during summer as detected here. However, Omar et al. (2005) pointed out that GSFC also experiences periods of significant clean continental aerosol (i.e., rural or MIX) from November to February, a finding not supported by our classification that could be partly explained by differences between datasets. Giles et al. (2011) showed that aerosols at Kanpur have a complex composition with absorption and spectral characteristics that resemble a MIX aerosol type. Also, Giles et al. (2011) detected the predominant influence of dust events during the spring months. The year-round aerosol composition at Banizoumbou was strongly influenced by dust originating from the Saharan desert, as pointed out by Omar et al. (2005). Likewise, our models support a switch in dominant aerosol composition occurring between July-January (BB) and February-June (DU) (Rajot et al., 2008).
PAM and A2010 models present major differences in terms of aerosol properties (e.g., see Figures 1, 5). The range of rn values for the fine mode revealed that aerosol mixtures derived from the clustering of AERONET measurements could have smaller median diameters with respect to those suggested by A2010 models (Supplementary Appendix Table A5). Indeed, the smallest rnfine values for the A2010 aerosol mixtures (0.085 μm) were up to 2-fold larger than the minimum median radius computed for PAM clusters. PAM-based models have a smaller variability of rncoarse and intermediate sizes (e.g., the radius was never above 1) with respect to A2010 models. Unlike the radius, the width of PSD was more variable for fine and coarse fractions of PAM models as σn of A2010 models was constant for each size-distribution mode (σnfine = 0.437, σncoarse = 0.672). σnfine (σncoarse) for A2010 coincided with the lower (upper) end of PAM-derived σnfine (σncoarse) values. The nr for A2010 models was more variable (1.379–1.528 and 1.371–1.518 for λ = 0.44 and 0.87 μm, respectively) with respect to values associated with PAM clusters (1.417–1.502 and 1.425–1.1532). Despite this variation, the A2010 models cannot capture the maximum values computed by PAM at λ = 0.87 μm. Unlike nr, ni values for A2010 models were less variable and relatively small (e.g., 0.0022–0.010 and 0.00218–0.0099 for λ = 0.44 and 0.87 μm, respectively) with respect to those characterized by PAM clusters (0.00132–0.052 and 0.00054–0.056). In terms of aerosol types, two crucial questions arise:
1. What are operational aerosol models derived from A2010 not represented in nature (i.e., in situ information)?
2. How do microphysical properties of PAM-derived type MAR compare to those of RH-based models?
Regarding the first question, the following findings summarize what aerosol characteristics are “missing” in A2010 models:
1. The median radius for the fine mode pointed out that ten DU, three MIX, and two U/I sub-types (i.e., clusters 1–10,13–15 and 18) are not part of A2010 models,
2. σnfine for the A2010 models only mimics the PAM cluster 19 with U/I type,
3. The range of rncoarse values for A2010 can be constrained to a reduced number of theoretical models (2 model x 10 RH = 20 models) matching the PAM-derived range,
4. σncoarse for the A2010 models only resembles the PAM cluster 20 with U/I type,
5. The range of nr(0.44) values for A2010 can be constrained to 27 models matching the PAM-derived range,
6. Relatively high nr(0.87) values in PAM sub-types 2,6,14 and 20 are not reflected in A2010,
7. Relatively low and high ni(0.44) values (<0.002 and >0.01, respectively) in PAM models (eight U/I, four MIX, and three DU sub-types) are not presented in the A2010 models, and
8. Relatively low and high ni(0.87) values (<0.0022 and > 0.099, respectively) in PAM models (ten DU, six U/I, four MIX and four BB sub-types) are not included in any A2010 model.
Regarding the second question, the following can be generalized (Supplementary Appendix Table A5):
1. The range of rn, σn, and nr values used to compute A2010 models is narrower with respect to that characterizing PAM-derived MAR type.
2. The imaginary part of the refractive index is commonly underestimated by the A2010 aerosol models, and this difference is more remarkable at λ = 0.44 μm.
3. The arithmetic averages of rnfine, rncoarse, nr, and ni for the PAM-derived MAR model represent A2010 models associated with an intermediate RH (i.e., RH = 75–80%).
4. The average width of fine mode (coarse) PSD was larger (smaller) for PAM-derived aerosol mixture.
Although the more realistic representation of σn and ni by PAM models, A2010 mixtures can be applied in a “dynamic” way, given the functionalities between RH and aerosol properties. Thus, the A2010 models may provide a finer temporal “tuning” as a function of humidity in coastal areas with marine-dominated aerosols. Also, RH-dependencies are still considered viable in marine-dominated locations not coinciding with AERONET sites.
The classification of aerosols in this study aimed to support an enhanced representation of aerosol conditions for improved global aquatic remote sensing science and applications. This enhancement ultimately relies upon two important aspects: an operational implementation of aerosol models and a realistic representation of “natural” aerosol mixtures. NASA’s operational AC method (Gordon and Wang, 1994), which identifies aerosol types according to a NIR (or NIR-SWIR) band-ratio, is generally ineffective when PAM-like aerosol models are incorporated in the aerosol look-up-table (Gordon, 1997). It is therefore imperative to devise optimization techniques (e.g., polynomial fitting, ML) to leverage a wide array of aerosol types (Gordon et al., 1997; Chomko and Gordon, 1998). Compared to the performance of other ML processors validated in the literature (Fan et al., 2021; Pahlevan et al., 2021a; Brockmann et al., 2016), our preliminary results (Table 6 and Figure 8) suggest that MDNs, once trained extensively, can offer a significant boost in the quality of retrieved
We recall that future satellite instruments (Werdell et al., 2019; Ustin and Middleton, 2021), which are anticipated to offer measurements within the short blue bands and UV region, will benefit even more from the PAM models once combined with the A2010 models. Adding commercial satellite images to the publicly available datasets (Vanhellemont and Ruddick, 2018) will expand research and application opportunities, underscoring the need for more comprehensive aerosol models. Our models will be especially beneficial to emerging scientific applications, such as mapping and monitoring water quality indicators in urban environments (Miao et al., 2020) or in other regions typically influenced by dust (Dube et al., 2015) or wildfire events (Blake et al., 2020; Kramer et al., 2020). With the global rise of temperature and extended periods of drought, these events are becoming widespread, demanding AC processors capable of tackling changing aerosol compositions and contents. Consequently, subsequent efforts may focus on designing novel methodology for effectively incorporating the PAM-like models in existing/future AC processors.
The primary motivation of the present study was to advance NASA’s existing aerosol models (A2010) for remote sensing applications in inland and nearshore coastal environments. An accurate representation of aerosol conditions is fundamental to obtaining reliable
1. The validation of PAM-derived aerosol types agreed well with those reported at GSFC and Kanpur, two intensely studied AERONET sites where aerosol mixtures are typically influenced by dust and biomass burning smoke.
2. Identifying MIX and U/I types based on PAM sub-types was not always consistent with the sites suggested in the literature and the independent data analyzed here. This apparent disagreement is mainly attributed to our data selection criterion (AOD(0.44)
3. Improving aerosol representation over A2010 models is essential in areas where the aerosol composition is predominantly DU, U/I, and BB.
4. A practical assessment of the utility of PAM models in the context of atmospheric correction verified enhanced retrievals in Landsat-8/OLI’s blue bands. The performance gain is most anticipated across regions influenced by absorbing aerosols and within the UV and blue spectral bands.
We assert that integrating PAM models in existing and/or future AC processors will reduce uncertainties in downstream products over lakes, rivers, reservoirs, and nearshore environments from the past (Landsat-5), current (Landsat-9), and future (e.g., Landsat Next) satellite instruments. The PAM models are particularly expected to advance the quality and useability of satellite products for studying and monitoring waterbodies near aerosol sources (e.g., coastal cities, urban waters, Sub-Saharan African lakes, South American and Western North American water resources).
The original contributions presented in the study are included in the article/Supplementary Material. The aerosol models detailed in Table 5 can be accessed via https://github.com/STREAM-RS.
MM: Formal analysis, Investigation, Visualization; NP: Conceptualization, Funding acquisition, Project administration; MM, P-WZ, BS: Methodology; NP, DG, J-CR: Supervision; MM, BS, NP: Validation; MM, NP, DG: Roles/Writing - original draft; MM, NP, DG, J-CR, RL, PJW, AS: Writing—review andediting.
This work was funded under NASA ROSES contract #80HQTR19C0015, Remote Sensing of Water Quality element, and the USGS Landsat Science Team Award #140G0118C0011.
Authors MM, NP, DG, BS, and AS are employed by SSAI.
The remaining authors declare that the research was conducted in the absence of any commercial or financial relationships that could be construed as a potential conflict of interest.
All claims expressed in this article are solely those of the authors and do not necessarily represent those of their affiliated organizations, or those of the publisher, the editors and the reviewers. Any product that may be evaluated in this article, or claim that may be made by its manufacturer, is not guaranteed or endorsed by the publisher.
We are thankful to Zia Ahmad for his initial involvement and feedback throughout the course of this study. We are also grateful to the Principal Investigators (PIs) of the AERONET-OC sites, whose datasets aided in evaluating the usefulness of our developed aerosol models for the atmospheric correction of Landsat-8/OLI images. The PIs include Giuseppe Zibordi, Sherwin Ladner, Hui Fang, Heidi Sosik, Tim Moore, Steve Ruberg, Menghua Wang, Alex Gilerson, and Samir Ahmed.
The Supplementary Material for this article can be found online at: https://www.frontiersin.org/articles/10.3389/frsen.2022.860816/full#supplementary-material
Adrian, R., O'Reilly, C. M., Zagarese, H., Baines, S. B., Hessen, D. O., Keller, W., et al. (2009). Lakes as Sentinels of Climate Change. Limnol. Oceanogr. 54, 2283–2297. doi:10.4319/lo.2009.54.6_part_2.2283
Ahmad, Z., Franz, B. A., McClain, C. R., Kwiatkowska, E. J., Werdell, J., Shettle, E. P., et al. (2010). New Aerosol Models for the Retrieval of Aerosol Optical Thickness and Normalized Water-Leaving Radiances from the SeaWiFS and MODIS Sensors over Coastal Regions and Open Oceans. Appl. Opt. 49, 5545–5560. doi:10.1364/ao.49.005545
Äijälä, M., Heikkinen, L., Fröhlich, R., Canonaco, F., Prévôt, A. S., Junninen, H., et al. (2017). Resolving Anthropogenic Aerosol Pollution Types–Deconvolution and Exploratory Classification of Pollution Events. Atmos. Chem. Phys. 17, 3165–3197. doi:10.5194/acp-17-3165-2017
Alikas, K., Kangro, K., Randoja, R., Philipson, P., Asuküll, E., Pisek, J., et al. (2015). Satellite-based Products for Monitoring Optically Complex Inland Waters in Support of EU Water Framework Directive. Int. J. Remote Sensing 36, 4446–4468. doi:10.1080/01431161.2015.1083630
Balasubramanian, S. V., Pahlevan, N., Smith, B., Binding, C., Schalles, J., Loisel, H., et al. (2020). Robust Algorithm for Estimating Total Suspended Solids (TSS) in Inland and Nearshore Coastal Waters. Remote Sensing Environ. 246, 111768. doi:10.1016/j.rse.2020.111768
Barnes, B. B., Hu, C., Kovach, C., and Silverstein, R. N. (2015). Sediment Plumes Induced by the Port of Miami Dredging: Analysis and Interpretation Using Landsat and MODIS Data. Remote Sensing Environ. 170, 328–339. doi:10.1016/j.rse.2015.09.023
Barreto, Á., Cuevas, E., Granados-Muñoz, M.-J., Alados-Arboledas, L., Romero, P. M., Gröbner, J., et al. (2016). The New Sun-Sky-Lunar Cimel CE318-T Multiband Photometer - a Comprehensive Performance Evaluation. Atmos. Meas. Tech. 9, 631–654. doi:10.5194/amt-9-631-2016
Blake, D., Nyman, P., Nice, H., D'Souza, F. M. L., Kavazos, C. R. J., and Horwitz, P. (2020). Assessment of post-wildfire Erosion Risk and Effects on Water Quality in South-Western Australia. Int. J. Wildland Fire 29, 240–257. doi:10.1071/wf18123
Brajard, J., Jamet, C., Moulin, C., and Thiria, S. (2006). Use of a Neuro-Variational Inversion for Retrieving Oceanic and Atmospheric Constituents from Satellite Ocean Colour Sensor: Application to Absorbing Aerosols. Neural Networks 19, 178–185. doi:10.1016/j.neunet.2006.01.015
Bricaud, A., and Stramski, D. (1990). Spectral Absorption Coefficients of Living Phytoplankton and Nonalgal Biogenous Matter: A Comparison between the Peru Upwelling Areaand the Sargasso Sea. Limnol. Oceanogr. 35, 562–582. doi:10.4319/lo.1990.35.3.0562
Brockmann, C., Doerffer, R., Peters, M., Kerstin, S., Embacher, S., and Ruescas, A. (2016). Evolution of the C2RCC Neural Network for Sentinel 2 and 3 for the Retrieval of Ocean Colour Products in normal and Extreme Optically Complex Waters. ESASP 740, 54.
Cao, F., and Tzortziou, M. (2021). Capturing Dissolved Organic Carbon Dynamics with Landsat-8 and Sentinel-2 in Tidally Influenced Wetland-Estuarine Systems. Sci. Total Environ. 777, 145910. doi:10.1016/j.scitotenv.2021.145910
Chomko, R. M., and Gordon, H. R. (1998). Atmospheric Correction of Ocean Color Imagery: Use of the Junge Power-Law Aerosol Size Distribution with Variable Refractive index to Handle Aerosol Absorption. Appl. Opt. 37, 5560–5572. doi:10.1364/ao.37.005560
De Keukelaere, L., Sterckx, S., Adriaensen, S., Knaeps, E., Reusen, I., Giardino, C., et al. (2018). Atmospheric Correction of Landsat-8/OLI and Sentinel-2/MSI Data Using iCOR Algorithm: Validation for Coastal and Inland Waters. Eur. J. Remote Sensing 51, 525–542. doi:10.1080/22797254.2018.1457937
Derimian, Y., Karnieli, A., Kaufman, Y. J., Andreae, M. O., Andreae, T. W., Dubovik, O., et al. (2006). Dust and Pollution Aerosols over the Negev Desert, Israel: Properties, Transport, and Radiative Effect. J. Geophys. Res. Atmospheres 111. doi:10.1029/2005jd006549
Dey, S., Tripathi, S. N., Singh, R. P., and Holben, B. (2004). Influence of Dust Storms on the Aerosol Optical Properties over the Indo-Gangetic basin. J. Geophys. Res. Atmospheres 109, D20211. doi:10.1029/2004jd004924
Dube, T., Mutanga, O., Seutloali, K., Adelabu, S., and Shoko, C. (2015). Water Quality Monitoring in Sub-saharan African Lakes: a Review of Remote Sensing Applications. Afr. J. Aquat. Sci. 40, 1–7. doi:10.2989/16085914.2015.1014994
Dubovik, O., Holben, B., Eck, T. F., Smirnov, A., Kaufman, Y. J., King, M. D., et al. (2002a). Variability of Absorption and Optical Properties of Key Aerosol Types Observed in Worldwide Locations. J. Atmos. Sci. 59, 590–608. doi:10.1175/1520-0469(2002)059<0590:voaaop>2.0.co;2
Dubovik, O., Holben, B. N., Lapyonok, T., Sinyuk, A., Mishchenko, M. I., Yang, P., et al. (2002b). Non-spherical Aerosol Retrieval Method Employing Light Scattering by Spheroids. Geophys. Res. Lett. 29, 54–1544. doi:10.1029/2001gl014506
Dubovik, O., and King, M. D. (2000). A Flexible Inversion Algorithm for Retrieval of Aerosol Optical Properties from Sun and Sky Radiance Measurements. J. Geophys. Res. 105, 20673–20696. doi:10.1029/2000jd900282
Dubovik, O., Smirnov, A., Holben, B. N., King, M. D., Kaufman, Y. J., Eck, T. F., et al. (2000). Accuracy Assessments of Aerosol Optical Properties Retrieved from Aerosol Robotic Network (AERONET) Sun and Sky Radiance Measurements. J. Geophys. Res. 105, 9791–9806. doi:10.1029/2000jd900040
Eck, T. F., Holben, B. N., Reid, J., Giles, D., Rivas, M., Singh, R. P., et al. (2012). Fog-and Cloud-Induced Aerosol Modification Observed by the Aerosol Robotic Network (AERONET). J. Geophys. Res. Atmospheres 117, D07206. doi:10.1029/2011jd016839
Eck, T. F., Holben, B. N., Reid, J. S., Arola, A., Ferrare, R. A., Hostetler, C. A., et al. (2014). Observations of Rapid Aerosol Optical Depth Enhancements in the Vicinity of Polluted Cumulus Clouds. Atmos. Chem. Phys. 14, 11633–11656. doi:10.5194/acp-14-11633-2014
Eck, T. F., Holben, B. N., Reid, J. S., Mukelabai, M. M., Piketh, S. J., Torres, O., et al. (2013). A Seasonal Trend of Single Scattering Albedo in Southern African Biomass-Burning Particles: Implications for Satellite Products and Estimates of Emissions for the World's Largest Biomass-Burning Source. J. Geophys. Res. Atmos. 118, 6414–6432. doi:10.1002/jgrd.50500
Eck, T. F., Holben, B., Sinyuk, A., Pinker, R., Goloub, P., Chen, H., et al. (2010). Climatological Aspects of the Optical Properties of fine/coarse Mode Aerosol Mixtures. J. Geophys. Res. Atmospheres 115, D19205. doi:10.1029/2010jd014002
Eck, T., Holben, B., Dubovik, O., Smirnov, A., Goloub, P., Chen, H., et al. (2005). Columnar Aerosol Optical Properties at AERONET Sites in central Eastern Asia and Aerosol Transport to the Tropical Mid-Pacific. J. Geophys. Res. Atmospheres 110, D06202. doi:10.1029/2004jd005274
Eck, T., Holben, B., Reid, J., O'neill, N., Schafer, J., Dubovik, O., et al. (2003). High Aerosol Optical Depth Biomass Burning Events: A Comparison of Optical Properties for Different Source Regions. Geophys. Res. Lett. 30, 2035. doi:10.1029/2003gl017861
Eck, T., Holben, B., Reid, J., Sinyuk, A., Hyer, E., O'Neill, N., et al. (2009). Optical Properties of Boreal Region Biomass Burning Aerosols in central Alaska and Seasonal Variation of Aerosol Optical Depth at an Arctic Coastal Site. J. Geophys. Res. Atmospheres 114, D11201. doi:10.1029/2008jd010870
Fan, Y., Li, W., Chen, N., Ahn, J.-H., Park, Y.-J., Kratzer, S., et al. (2021). OC-SMART: A Machine Learning Based Data Analysis Platform for Satellite Ocean Color Sensors. Remote Sensing Environ. 253, 112236. doi:10.1016/j.rse.2020.112236
Franz, B. A., Bailey, S. W., Kuring, N., and Werdell, P. J. (2015). Ocean Color Measurements with the Operational Land Imager on Landsat-8: Implementation and Evaluation in SeaDAS. J. Appl. Remote Sens 9, 096070. doi:10.1117/1.jrs.9.096070
Frouin, R. J., Franz, B. A., Ibrahim, A., Knobelspiesse, K., Ahmad, Z., Cairns, B., et al. (2019). Atmospheric Correction of Satellite Ocean-Color Imagery during the PACE Era. Front. Earth Sci. 7, 145. doi:10.3389/feart.2019.00145
García, O., Díaz, A., Expósito, F., Díaz, J., Dubovik, O., Dubuisson, P., et al. (2008). Validation of AERONET Estimates of Atmospheric Solar Fluxes and Aerosol Radiative Forcing by Ground-Based Broadband Measurements. J. Geophys. Res. Atmospheres 113, D21207. doi:10.1029/2008JD010211
Gelaro, R., McCarty, W., Suárez, M. J., Todling, R., Molod, A., Takacs, L., et al. (2017). The Modern-Era Retrospective Analysis for Research and Applications, Version 2 (MERRA-2). J. Clim. 30, 5419–5454. doi:10.1175/jcli-d-16-0758.1
Gerber, H. E. (1985). Relative-humidity Parameterization of the Navy Aerosol Model (NAM). Naval Research Lab Washington DC.
Gernez, P., Doxaran, D., and Barillé, L. (2017). Shellfish Aquaculture from Space: Potential of Sentinel2 to Monitor Tide-Driven Changes in Turbidity, Chlorophyll Concentration and Oyster Physiological Response at the Scale of an Oyster Farm. Front. Mar. Sci. 4, 137. doi:10.3389/fmars.2017.00137
Gilerson, A., Carrizo, C., Foster, R., and Harmel, T. (2018). Variability of the Reflectance Coefficient of Skylight from the Ocean Surface and its Implications to Ocean Color. Opt. Express 26, 9615–9633. doi:10.1364/oe.26.009615
Giles, D. M., Holben, B. N., Eck, T. F., Sinyuk, A., Smirnov, A., Slutsker, I., et al. (2012). An Analysis of AERONET Aerosol Absorption Properties and Classifications Representative of Aerosol Source Regions. J. Geophys. Res. Atmospheres 117, D17203. doi:10.1029/2012jd018127
Giles, D. M., Holben, B. N., Tripathi, S. N., Eck, T. F., Newcomb, W. W., Slutsker, I., et al. (2011). Aerosol Properties over the Indo-Gangetic Plain: A Mesoscale Perspective from the TIGERZ experiment. J. Geophys. Res. Atmospheres 116, D18203. doi:10.1029/2011jd015809
Giles, D. M., Sinyuk, A., Sorokin, M. G., Schafer, J. S., Smirnov, A., Slutsker, I., et al. (2019). Advancements in the Aerosol Robotic Network (AERONET) Version 3 Database - Automated Near-Real-Time Quality Control Algorithm with Improved Cloud Screening for Sun Photometer Aerosol Optical Depth (AOD) Measurements. Atmos. Meas. Tech. 12, 169–209. doi:10.5194/amt-12-169-2019
Gordon, H. R. (1997). Atmospheric Correction of Ocean Color Imagery in the Earth Observing System Era. J. Geophys. Res. 102, 17081–17106. doi:10.1029/96jd02443
Gordon, H. R., Du, T., and Zhang, T. (1997). Remote Sensing of Ocean Color and Aerosol Properties: Resolving the Issue of Aerosol Absorption. Appl. Opt. 36, 8670–8684. doi:10.1364/ao.36.008670
Gordon, H. R., and Wang, M. (1994). Retrieval of Water-Leaving Radiance and Aerosol Optical Thickness over the Oceans with SeaWiFS: a Preliminary Algorithm. Appl. Opt. 33, 443–452. doi:10.1364/ao.33.000443
Hakimdavar, R., Hubbard, A., Policelli, F., Pickens, A., Hansen, M., Fatoyinbo, T., et al. (2020). Monitoring Water-Related Ecosystems with Earth Observation Data in Support of Sustainable Development Goal (SDG) 6 Reporting. Remote Sensing 12, 1634. doi:10.3390/rs12101634
Hamill, P., Giordano, M., Ward, C., Giles, D., and Holben, B. (2016). An AERONET-Based Aerosol Classification Using the Mahalanobis Distance. Atmos. Environ. 140, 213–233. doi:10.1016/j.atmosenv.2016.06.002
Ho, J. C., Michalak, A. M., and Pahlevan, N. (2019). Widespread Global Increase in Intense lake Phytoplankton Blooms since the 1980s. Nature 574, 667–670. doi:10.1038/s41586-019-1648-7
Hoepffner, N., and Sathyendranath, S. (1991). Effect of Pigment Composition on Absorption Properties of Phytoplankton. Mar. Ecol. Prog. Ser. 73, 11–23. doi:10.3354/meps073011
Holben, B. N., Eck, T. F., Slutsker, I., Tanré, D., Buis, J. P., Setzer, A., et al. (1998). AERONET-A Federated Instrument Network and Data Archive for Aerosol Characterization. Remote Sensing Environ. 66, 1–16. doi:10.1016/s0034-4257(98)00031-5
Holben, B. N., Tanré, D., Smirnov, A., Eck, T. F., Slutsker, I., Abuhassan, N., et al. (2001). An Emerging Ground-Based Aerosol Climatology: Aerosol Optical Depth from AERONET. J. Geophys. Res. 106, 12067–12097. doi:10.1029/2001jd900014
IOCCG (2010). “Atmospheric Correction for Remotely-Sensed Ocean-Colour Products,” in IOCCG Report Series, International Ocean Colour Coordinating Group. Editor M. Wang (Dartmouth: Canada).
IOCCG (2014). “Phytoplankton Functional Types from Space,” in Reports of the International Ocean-Colour Coordinating Group. Editors S. Sathyendranath, and S. Sathyendranath (Dartmouth: IOCCGCanada).
IOCCG (2018). “Earth Observations in Support of Global Water Quality Monitoring,” in IOCCG Report Series, International Ocean Colour Coordinating Group. Editors S. Greb, A. Dekker, and C. Binding (Dartmouth: Canada).
IOCCG (2019). “Uncertainties in Ocean Colour Remote Sensing,” in IOCCG Report Series, International Ocean Colour Coordinating Group. Editor F. Mélin (Dartmouth: Canada).
Johnson, B. T., Christopher, S., Haywood, J. M., Osborne, S. R., McFarlane, S., Hsu, C., et al. (2009). Measurements of Aerosol Properties from Aircraft, Satellite and Ground-Based Remote Sensing: a Case-Study from the Dust and Biomass-Burning Experiment (DABEX). Q.J.R. Meteorol. Soc. 135, 922–934. doi:10.1002/qj.420
Kahn, R. A., Sayer, A. M., Ahmad, Z., and Franz, B. A. (2016). The Sensitivity of SeaWiFS Ocean Color Retrievals to Aerosol Amount and Type. J. Atmos. Oceanic Technology 33, 1185–1209. doi:10.1175/jtech-d-15-0121.1
Kahru, M., Anderson, C., Barton, A. D., Carter, M. L., Catlett, D., Send, U., et al. (2021). Satellite Detection of Dinoflagellate Blooms off California by UV Reflectance Ratios. Elem. Sci. Anth 9, 00157. doi:10.1525/elementa.2020.00157
Kaufman, L., and Rousseeuw, P. J. (1990). Partitioning Around Medoids (Program Pam). Finding groups Data introduction cluster Anal. 344, 68–125.
Kim, J., Jung, C. H., Choi, B.-C., Oh, S.-N., Brechtel, F. J., Yoon, S.-C., et al. (2007). Number Size Distribution of Atmospheric Aerosols during ACE-Asia Dust and Precipitation Events. Atmos. Environ. 41, 4841–4855. doi:10.1016/j.atmosenv.2007.02.024
Kramer, S. J., Bisson, K. M., and Fischer, A. D. (2020). Observations of Phytoplankton Community Composition in the Santa Barbara Channel during the Thomas Fire. J. Geophys. Res. Oceans 125, e2020JC016851. doi:10.1029/2020jc016851
Levy, R. C., Remer, L. A., and Dubovik, O. (2007). Global Aerosol Optical Models and Lookup Tables for the New MODIS Aerosol Retrieval over Land. Greenbelt: National Aeronautics and Space Administration.
Li, S., Kahn, R., Chin, M., Garay, M. J., and Liu, Y. (2015). Improving Satellite-Retrieved Aerosol Microphysical Properties Using GOCART Data. Atmos. Meas. Tech. 8, 1157–1171. doi:10.5194/amt-8-1157-2015
Maciel, D., Novo, E., Sander de Carvalho, L., Barbosa, C., Flores Júnior, R., and de Lucia Lobo, F. (2019). Retrieving Total and Inorganic Suspended Sediments in Amazon Floodplain Lakes: A Multisensor Approach. Remote Sensing 11, 1744. doi:10.3390/rs11151744
MacQueen, J. (1967). Some Methods for Classification and Analysis of Multivariate Observations. Proceedings of the Fifth Berkeley Symposium on Mathematical Statistics and Probability. Oakland, CA, USA, 281–297.
Manuel, A., Blanco, A. C., Tamondong, A. M., Jalbuena, R., Cabrera, O., and Gege, P. (2020). Optmization of Bio-Optical Model Parameters for Turbid Lake Water Quality Estimation Using Landsat 8 and Wasi-2D. Int. Arch. Photogramm. Remote Sens. Spat. Inf. Sci. XLII-3/W11, 67–72. doi:10.5194/isprs-archives-xlii-3-w11-67-2020
Mélin, F., De Vis, P., and Hunt, S. (2022). Sensitivity of Ocean Color Atmospheric Correction to Uncertainties in Ancillary Data: A Global Analysis with SeaWiFS Data. IEEE Geosci. Remote Sensing 60, 1–18. doi:10.1109/TGRS.2022.3150400
Mélin, F., and Zibordi, G. (2005). Aerosol Variability in the Po Valley Analyzed from Automated Optical Measurements. Geophys. Res. Lett. 32.
Miao, S., Liu, C., Qian, B., and Miao, Q. (2020). Remote Sensing-Based Water Quality Assessment for Urban Rivers: a Study in Linyi Development Area. Environ. Sci. Pollut. Res. 27, 34586–34595. doi:10.1007/s11356-018-4038-z
Mitchell, R., O'Brien, D., and Campbell, S. (2006). Characteristics and Radiative Impact of the Aerosol Generated by the Canberra Firestorm of January 2003. J. Geophys. Res. Atmospheres 111, D02204. doi:10.1029/2005jd006304
Mobley, C. D. (1999). Estimation of the Remote-Sensing Reflectance from Above-Surface Measurements. Appl. Opt. 38, 7442–7455.
Mobley, C. D., Werdell, J., Franz, B., Ahmad, Z., and Bailey, S. (2016). Atmospheric Correction for Satellite Ocean Color Radiometry.
Morley, S. K., Brito, T. V., and Welling, D. T. (2018). Measures of Model Performance Based on the Log Accuracy Ratio. Space Weather 16, 69–88. doi:10.1002/2017sw001669
Nobileau, D., and Antoine, D. (2005). Detection of Blue-Absorbing Aerosols Using Near Infrared and Visible (Ocean Color) Remote Sensing Observations. Remote Sensing Environ. 95, 368–387. doi:10.1016/j.rse.2004.12.020
O'Shea, R. E., Pahlevan, N., Smith, B., Bresciani, M., Egerton, T., Giardino, C., et al. (2021). Advancing Cyanobacteria Biomass Estimation from Hyperspectral Observations: Demonstrations with HICO and PRISMA Imagery. Remote Sensing Environ. 266, 112693. doi:10.1016/j.rse.2021.112693
Omar, A. H., Winker, D. M., Tackett, J. L., Giles, D. M., Kar, J., Liu, Z., et al. (2013). CALIOP and AERONET Aerosol Optical Depth Comparisons: One Size Fits None. J. Geophys. Res. Atmos. 118, 4748–4766. doi:10.1002/jgrd.50330
Omar, A. H., Won, J. G., Winker, D. M., Yoon, S. C., Dubovik, O., and McCormick, M. P. (2005). Development of Global Aerosol Models Using Cluster Analysis of Aerosol Robotic Network (AERONET) Measurements. J. Geophys. Res. Atmospheres 110, D10S14. doi:10.1029/2004jd004874
Page, B. P., Olmanson, L. G., and Mishra, D. R. (2019). A Harmonized Image Processing Workflow Using Sentinel-2/MSI and Landsat-8/OLI for Mapping Water Clarity in Optically Variable lake Systems. Remote Sensing Environ. 231, 111284. doi:10.1016/j.rse.2019.111284
Pahlevan, N., Gerace, A. D., and Schott, J. R. (2012). Integrating Landsat 7 Imagery with Physics-Based Models for Quantitative Mapping of Coastal Waters Near River Discharges. Photogrammetric Eng. Remote Sensing (Pe&rs) 78, 11. doi:10.14358/pers.78.11.1163
Pahlevan, N., Mangin, A., Balasubramanian, S. V., Smith, B., Alikas, K., Arai, K., et al. (2021a). ACIX-aqua: A Global Assessment of Atmospheric Correction Methods for Landsat-8 and Sentinel-2 over Lakes, Rivers, and Coastal Waters. Remote Sensing Environ. 258, 112366. doi:10.1016/j.rse.2021.112366
Pahlevan, N., Smith, B., Binding, C., Gurlin, D., Li, L., Bresciani, M., et al. (2021b). Hyperspectral Retrievals of Phytoplankton Absorption and Chlorophyll-A in Inland and Nearshore Coastal Waters. Remote Sensing Environ. 253, 112200. doi:10.1016/j.rse.2020.112200
Pahlevan, N., Roger, J.-C., and Ahmad, Z. (2017a). Revisiting Short-Wave-Infrared (SWIR) Bands for Atmospheric Correction in Coastal Waters. Opt. Express 25, 6015–6035. doi:10.1364/oe.25.006015
Pahlevan, N., Schott, J. R., Franz, B. A., Zibordi, G., Markham, B., Bailey, S., et al. (2017b). Landsat 8 Remote Sensing Reflectance (Rrs) Products: Evaluations, Intercomparisons, and Enhancements. Remote Sensing Environ. 190, 289–301. doi:10.1016/j.rse.2016.12.030
Pahlevan, N., Smith, B., Schalles, J., Binding, C., Cao, Z., Ma, R., et al. (2020). Seamless Retrievals of Chlorophyll-A from Sentinel-2 (MSI) and Sentinel-3 (OLCI) in Inland and Coastal Waters: A Machine-Learning Approach. Remote Sensing Environ. 240, 111604. doi:10.1016/j.rse.2019.111604
Poddar, S., Chacko, N., and Swain, D. (2019). Estimation of Chlorophyll-A in Northern Coastal Bay of Bengal Using Landsat-8 OLI and Sentinel-2 MSI Sensors. Front. Mar. Sci. 6, 598. doi:10.3389/fmars.2019.00598
Prospero, J. M., Charlson, R. J., Mohnen, V., Jaenicke, R., Delany, A. C., Moyers, J., et al. (1983). The Atmospheric Aerosol System: An Overview. Rev. Geophys. 21, 1607–1629. doi:10.1029/rg021i007p01607
Rajot, J. L., Formenti, P., Alfaro, S., Desboeufs, K., Chevaillier, S., Chatenet, B., et al. (2008). AMMA Dust experiment: An Overview of Measurements Performed during the Dry Season Special Observation Period (SOP0) at the Banizoumbou (Niger) Supersite. J. Geophys. Res. Atmospheres 113, D00C14. doi:10.1029/2008jd009906
Raoufi, R., and Beighley, E. (2017). Estimating Daily Global Evapotranspiration Using Penman-Monteith Equation and Remotely Sensed Land Surface Temperature. Remote Sensing 9, 1138. doi:10.3390/rs9111138
Reid, J. S., Kinney, J. E., Westphal, D. L., Holben, B. N., Welton, E. J., Tsay, S. C., et al. (2003). Analysis of Measurements of Saharan Dust by Airborne and Ground-Based Remote Sensing Methods during the Puerto Rico Dust Experiment (PRIDE). J. Geophys. Res. Atmospheres 108, 8586. doi:10.1029/2002jd002493
Roger, J.-C., Vermote, E., Skakun, S., Murphy, E., Dubovik, O., Kalecinski, N., et al. (2022). Aerosol Models from the AERONET Data Base. Application to Surface Reflectance Validation. Atmos. Meas. Tech. Discuss. 15, 1123–1144. doi:10.5194/amt-15-1123-2022
Rousseeuw, P. J. (1987). Silhouettes: a Graphical Aid to the Interpretation and Validation of Cluster Analysis. J. Comput. Appl. Math. 20, 53–65. doi:10.1016/0377-0427(87)90125-7
Russell, P. B., Kacenelenbogen, M., Livingston, J. M., Hasekamp, O. P., Burton, S. P., Schuster, G. L., et al. (2014). A Multiparameter Aerosol Classification Method and its Application to Retrievals from Spaceborne Polarimetry. J. Geophys. Res. Atmos. 119, 9838–9863. doi:10.1002/2013jd021411
Sanders, L. C., Schott, J. R., and Raqueño, R. (2001). A VNIR/SWIR Atmospheric Correction Algorithm for Hyperspectral Imagery with Adjacency Effect. Remote Sensing Environ. 78, 252–263. doi:10.1016/s0034-4257(01)00219-x
Saulquin, B., Fablet, R., Bourg, L., Mercier, G., and d'Andon, O. F. (2016). MEETC2: Ocean Color Atmospheric Corrections in Coastal Complex Waters Using a Bayesian Latent Class Model and Potential for the Incoming sentinel 3 - OLCI mission. Remote sensing Environ. 172, 39–49. doi:10.1016/j.rse.2015.10.035
Sayer, A., Hsu, N., Bettenhausen, C., Ahmad, Z., Holben, B., Smirnov, A., et al. (2012a). SeaWiFS Ocean Aerosol Retrieval (SOAR): Algorithm, Validation, and Comparison with Other Data Sets. J. Geophys. Res. Atmospheres 117, D03206. doi:10.1029/2011jd016599
Sayer, A., Smirnov, A., Hsu, N., and Holben, B. (2012b). A Pure marine Aerosol Model, for Use in Remote Sensing Applications. J. Geophys. Res. Atmospheres 117, D05213. doi:10.1029/2011jd016689
Sayer, A. M., Hsu, N. C., Eck, T. F., Smirnov, A., and Holben, B. N. (2014). AERONET-based Models of Smoke-Dominated Aerosol Near Source Regions and Transported over Oceans, and Implications for Satellite Retrievals of Aerosol Optical Depth. Atmos. Chem. Phys. 14, 11493–11523. doi:10.5194/acp-14-11493-2014
Schafer, J., Eck, T., Holben, B., Artaxo, P., and Duarte, A. (2008). Characterization of the Optical Properties of Atmospheric Aerosols in Amazonia from Long-Term AERONET Monitoring (1993–1995 and 1999–2006). J. Geophys. Res. Atmospheres 113, D04204. doi:10.1029/2007jd009319
Schroeder, T., Behnert, I., Schaale, M., Fischer, J., and Doerffer, R. (2007). Atmospheric Correction Algorithm for MERIS above Case-2 Waters. Int. J. Remote Sensing 28, 1469–1486. doi:10.1080/01431160600962574
Shettle, E. P., and Fenn, R. W. (1979). Models for the Aerosols of the Lower Atmosphere and the Effects of Humidity Variations on Their Optical Properties. United States Air Force: Air Force Geophysics Laboratory, Air Force Systems Command, 79, 214.
Singh, R., Dey, S., Tripathi, S., Tare, V., and Holben, B. (2004). Variability of Aerosol Parameters over Kanpur, Northern India. J. Geophys. Res. Atmospheres 109, D23206. doi:10.1029/2004jd004966
Sinyuk, A., Holben, B. N., Eck, T. F., Giles, D. M., Slutsker, I., Korkin, S., et al. (2020). The AERONET Version 3 Aerosol Retrieval Algorithm, Associated Uncertainties and Comparisons to Version 2. Atmos. Meas. Tech. 13, 3375–3411. doi:10.5194/amt-13-3375-2020
Slonecker, E. T., Jones, D. K., and Pellerin, B. A. (2016). The New Landsat 8 Potential for Remote Sensing of Colored Dissolved Organic Matter (CDOM). Marine Pollut. Bull. 107 (2), 518–527.
Smirnov, A., Holben, B., Dubovik, O., Frouin, R., Eck, T., and Slutsker, I. (2003a). Maritime Component in Aerosol Optical Models Derived from Aerosol Robotic Network Data. J. Geophys. Res. Atmospheres 108, 4033. AAC 14-1-AAC 14-11. doi:10.1029/2002jd002701
Smirnov, A., Holben, B., Eck, T., Dubovik, O., and Slutsker, I. (2003b). Effect of Wind Speed on Columnar Aerosol Optical Properties at Midway Island. J. Geophys. Res. Atmospheres 108, 4802. doi:10.1029/2003jd003879
Smirnov, A., Holben, B. N., Eck, T. F., Dubovik, O., and Slutsker, I. (2000). Cloud-screening and Quality Control Algorithms for the AERONET Database. Remote sensing Environ. 73, 337–349. doi:10.1016/s0034-4257(00)00109-7
Smith, B., Pahlevan, N., Schalles, J., Ruberg, S., Errera, R., Ma, R., et al. (2021). A Chlorophyll-A Algorithm for Landsat-8 Based on Mixture Density Networks. Front. Remote Sensing 1. doi:10.3389/frsen.2020.623678
Snyder, J., Boss, E., Weatherbee, R., Thomas, A. C., Brady, D., and Newell, C. (2017). Oyster Aquaculture Site Selection Using Landsat 8-derived Sea Surface Temperature, Turbidity, and Chlorophyll a. Front. Mar. Sci. 4, 190. doi:10.3389/fmars.2017.00190
Steinmetz, F., and Ramon, D. (2018). “Sentinel-2 MSI and Sentinel-3 OLCI Consistent Ocean Colour Products Using POLYMER,” in Remote Sensing of the Open and Coastal Ocean and Inland Waters, International Society for Optics and Photonics, 107780E. doi:10.1117/12.2500232
Szkop, A., and Pietruczuk, A. (2019). Synergy of Satellite-Based Aerosol Optical Thickness Analysis and Trajectory Statistics for Determination of Aerosol Source Regions. Int. J. Remote Sensing 40, 8450–8464. doi:10.1080/01431161.2019.1612117
Tanré, D., Haywood, J., Pelon, J., Léon, J., Chatenet, B., Formenti, P., et al. (2003). Measurement and Modeling of the Saharan Dust Radiative Impact: Overview of the Saharan Dust Experiment (SHADE). J. Geophys. Res. Atmospheres 108. doi:10.1029/2002JD003273
Thewes, D., Stanev, E. V., and Zielinski, O. (2020). Sensitivity of a 3D Shelf Sea Ecosystem Model to Parameterizations of the Underwater Light Field. Front. Mar. Sci. 6. doi:10.3389/fmars.2019.00816
Tilstone, G., Dall’Olmo, G., Hieronymi, M., Ruddick, K., Beck, M., Ligi, M., et al. (2020). Field Intercomparison of Radiometer Measurements for Ocean Colour Validation. Remote Sensing 12, 1587. doi:10.3390/rs12101587
Uitz, J., Stramski, D., Reynolds, R. A., and Dubranna, J. (2015). Assessing Phytoplankton Community Composition from Hyperspectral Measurements of Phytoplankton Absorption Coefficient and Remote-Sensing Reflectance in Open-Ocean Environments. Remote Sensing Environ. 171, 58–74. doi:10.1016/j.rse.2015.09.027
Ustin, S. L., and Middleton, E. M. (2021). Current and Near-Term Advances in Earth Observation for Ecological Applications. Ecol. Process. 10, 1–57. doi:10.1186/s13717-020-00255-4
Vanhellemont, Q. (2019). Adaptation of the Dark Spectrum Fitting Atmospheric Correction for Aquatic Applications of the Landsat and Sentinel-2 Archives. Remote Sensing Environ. 225, 175–192. doi:10.1016/j.rse.2019.03.010
Vanhellemont, Q., and Ruddick, K. (2018). Atmospheric Correction of Metre-Scale Optical Satellite Data for Inland and Coastal Water Applications. Remote Sensing Environ. 216, 586–597. doi:10.1016/j.rse.2018.07.015
Varmuza, K., and Filzmoser, P. (2016). Introduction to Multivariate Statistical Analysis in Chemometrics. Boca Raton: CRC Press.
Vermote, E. F., El Saleous, N., Justice, C. O., Kaufman, Y. J., Privette, J. L., Remer, L., et al. (1997). Atmospheric Correction of Visible to Middle-Infrared EOS-MODIS Data over Land Surfaces: Background, Operational Algorithm and Validation. J. Geophys. Res. Atmospheres 102, 17131–17141. doi:10.1029/97jd00201
Wagner, F., and Silva, A. M. (2008). Some Considerations about Ångström Exponent Distributions. Atmos. Chem. Phys. 8, 481–489. doi:10.5194/acp-8-481-2008
Wang, G., Lee, Z., Mishra, D. R., and Ma, R. (2016). Retrieving Absorption Coefficients of Multiple Phytoplankton Pigments from Hyperspectral Remote Sensing Reflectance Measured over Cyanobacteria Bloom Waters. Limnol. Oceanogr. Methods 14, 432–447. doi:10.1002/lom3.10102
Watanabe, F., Alcântara, E., Rodrigues, T., Imai, N., Barbosa, C., and Rotta, L. (2015). Estimation of Chlorophyll-A Concentration and the Trophic State of the Barra Bonita Hydroelectric Reservoir Using OLI/Landsat-8 Images. Ijerph 12, 10391–10417. doi:10.3390/ijerph120910391
Werdell, P. J., and Bailey, S. W. (2005). An Improved In-Situ Bio-Optical Data Set for Ocean Color Algorithm Development and Satellite Data Product Validation. Remote sensing Environ. 98, 122–140. doi:10.1016/j.rse.2005.07.001
Werdell, P. J., Behrenfeld, M. J., Bontempi, P. S., Boss, E., Cairns, B., Davis, G. T., et al. (2019). The Plankton, Aerosol, Cloud, Ocean Ecosystem mission: Status, Science, Advances. Bull. Am. Meteorol. Soc. 100, 1775–1794. doi:10.1175/bams-d-18-0056.1
Xi, H., Hieronymi, M., Röttgers, R., Krasemann, H., and Qiu, Z. (2015). Hyperspectral Differentiation of Phytoplankton Taxonomic Groups: a Comparison between Using Remote Sensing Reflectance and Absorption Spectra. Remote Sensing 7, 14781–14805. doi:10.3390/rs71114781
Yang, M., Howell, S. G., Zhuang, J., and Huebert, B. J. (2009). Attribution of Aerosol Light Absorption to Black Carbon, Brown Carbon, and Dust in China - Interpretations of Atmospheric Measurements during EAST-AIRE. Atmos. Chem. Phys. 9, 2035–2050. doi:10.5194/acp-9-2035-2009
Keywords: absorbing aerosols, aquatic remote sensing, water quality, atmospheric correction, lakes, rivers, coastal waters
Citation: Montes M, Pahlevan N, Giles DM, Roger J-C, Zhai P-w, Smith B, Levy R, Werdell PJ and Smirnov A (2022) Augmenting Heritage Ocean-Color Aerosol Models for Enhanced Remote Sensing of Inland and Nearshore Coastal Waters. Front. Remote Sens. 3:860816. doi: 10.3389/frsen.2022.860816
Received: 23 January 2022; Accepted: 16 March 2022;
Published: 02 May 2022.
Edited by:
Jianwei Wei, Center for Satellite Applications and Research (STAR), United StatesReviewed by:
Lei Bi, Zhejiang University, ChinaCopyright © 2022 Montes, Pahlevan, Giles, Roger, Zhai, Smith, Levy, Werdell and Smirnov. This is an open-access article distributed under the terms of the Creative Commons Attribution License (CC BY). The use, distribution or reproduction in other forums is permitted, provided the original author(s) and the copyright owner(s) are credited and that the original publication in this journal is cited, in accordance with accepted academic practice. No use, distribution or reproduction is permitted which does not comply with these terms.
*Correspondence: Nima Pahlevan, bmltYS5wYWhsZXZhbkBuYXNhLmdvdg==
Disclaimer: All claims expressed in this article are solely those of the authors and do not necessarily represent those of their affiliated organizations, or those of the publisher, the editors and the reviewers. Any product that may be evaluated in this article or claim that may be made by its manufacturer is not guaranteed or endorsed by the publisher.
Research integrity at Frontiers
Learn more about the work of our research integrity team to safeguard the quality of each article we publish.