 Amy W. Nau
 Ben Scoulding
 Rudy J. Kloser1
 Yoann Ladroit
 Vanessa Lucieer
- 1Commonwealth Scientific and Industrial Research Organisation, Hobart, TAS, Australia
- 2Institute for Marine and Antarctic Studies, College of Science and Engineering, University of Tasmania, Hobart, TAS, Australia
- 3National Institute of Water and Atmospheric Research, Wellington, New Zealand
Multibeam echosounder water column data provides a three-dimensional image of features between the water surface and the seafloor. Although this swath of acoustic data can be collected over a wide range of angles, most of the data, at least beyond the range to the first seafloor return, is contaminated by noise created by receiver array sidelobe interference. As a result, the water column data beyond the minimum slant range commonly is excluded from analysis. This paper demonstrates a method to consistently filter and extract targets comprising a gas seep feature across the multibeam swath, including targets within the areas dominated by receiver array sidelobe interference. For each sample range, data are filtered based on the mean plus a certain number (k) of standard deviations of the sample values along that range. The filtering is coupled with a morphological classification to retain only targets of interest while excluding background data and noise. Data were collected over a shallow water artificial gas seep using two different flow rates and at three different vessel speeds. Using the proposed method, 119 of 124 test seeps were identified correctly. Seep targets were identified at all angles across the water column fan up to beam pointing angles of 55°, with 19 of 23 seeps being correctly identified at angles greater than 50°. This method demonstrates that features can be extracted and geolocated in the sidelobe noise when the interference is appropriately filtered. These results will improve the areal extent of multibeam surveys and increase the utility of acoustic data in capturing information on water column targets directly above the seafloor.
1 Introduction
Acoustic systems are effective instruments for detecting targets in the water column such as fish, zooplankton, and bubbles (Simmonds and MacLennan, 2005). Free-flowing gas bubbles are an ideal water column target due to the high-density contrast between gas bubbles and the surrounding water (Clay and Medwin, 1977). Acoustic methods have been used for the detection of gas seeps since the 1960s (McCartney and Bary, 1965) and the value of detecting underwater gas seeps remains important for a variety of reasons including locating, characterizing, and quantifying natural gas seeps (Richardson and Davis, 1998; Sahling et al., 2014; Weber et al., 2014), assessing potential contributions of greenhouse gases into the atmosphere (Bussmann and Suess, 1998; Greinert et al., 2010; Scandella et al., 2016), and monitoring potential leakage associated with subsea storage of carbon dioxide (CO2) (Blackford et al., 2014).
Multibeam echosounders (MBES) are a standard acoustic tool for conducting geophysical surveys in the marine environment. Though originally designed to map seafloor topography in high resolution, modern systems also record the strength of the acoustic returns, or backscatter intensity, from both the seafloor and the water column (Mayer et al., 2002), providing a potentially time- and cost-effective way to collect data on physical and biological targets on and above the seafloor such as gas seeps, anthropogenic objects, fish, or vegetation (Clarke, 2006; McGonigle et al., 2011; Schneider von Deimling and Papenberg, 2012; Colbo et al., 2014; Innangi et al., 2016; Dunlop et al., 2018).
Backscatter intensities from water column data (WCD) have traditionally been considered a “supplementary” data product of the MBES, and because of this many systems have not been optimized regarding WCD quality. Many MBES transducer systems employ a Mills Cross technique for beamforming whereby the receiver array is arranged orthogonal to the transmitter array allowing for the formation of narrow directional beams (Urick, 1983) (Figure 1A). While this configuration gives an advantage to high-resolution seafloor detections, it can result in unacceptable amounts of interference within the WCD record, either masking real targets or creating artificial results. The most persistent of these patterns are generally referred to as “sidelobe interference” or “sidelobe artifact” and were first described in depth by de Moustier and Kleinrock (1986) for the original Sea Beam multibeam system. This interference is the result of the beam patterns from both the transmitter and receiver arrays where most of the energy is concentrated within the main lobe, but some is also present in surrounding “sidelobes,” causing characteristic interference pattern noise within the WCD in both the transmitter and receiver directions (Clarke, 2006). For the receiver array (across-track) direction, the noise pattern within WCD generally results from the interaction of the receiver array sidelobes with the strong specular seafloor echoes, usually at nadir for a typical sonar orientation pointing straight down on a flat seafloor (Figure 1D). This manifests within the WCD record as an upwards-facing semi-circular pattern of higher amplitude signals that impacts all samples beyond the range of the first seafloor detection known as the minimum slant range (MSR, Figure 1B). In the transmitter array (along-track) direction, the sidelobe interference manifests as a downwards-facing hyperbolic arc with an apex above the true target location (Clarke, 2006; Marques, 2012).
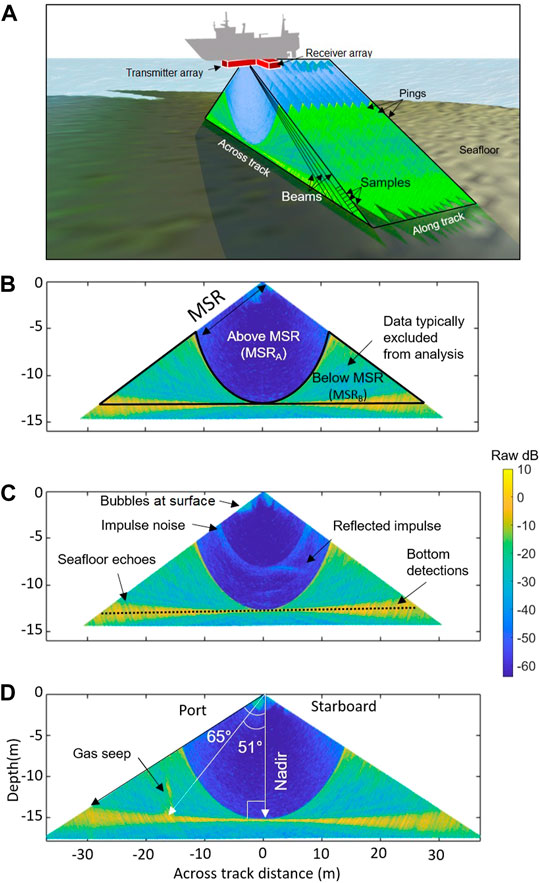
FIGURE 1. (A) 3-D depiction of a Mills Cross multibeam system with a transmitter array mounted perpendicular to the receiver array below the ship. Multiple pings make up the sampling insonified volume, and each ping is further broken down into beams and samples. (B) Demonstrates the terminology for the minimum slant range (MSR) and the areas of data encompassed above minimum slant range (MSRA) and below minimum slant range (MSRB). MSRA, dominated by blue shows the “clean” area of the WCD that is generally not impacted by sidelobe interference. MSRB dominated by green demonstrates the data impacted by sidelobe interference due to the strong nadir seafloor return in all beams and samples beyond the MSR. (C) Shows examples of various types of noise within the WCD. Bottom detections are indicated by the black dotted line. The yellow samples surrounding the bottom detections are the spreading echoes of the seafloor return. (D) Demonstrates the beam pointing angles. Nadir is 90° from the transducer parallel to the surface and pointing directly down to the seafloor. The swath width of a single side (port/starboard) of the data is shown as 65°. A real water column feature is shown which is a gas seep fully enclosed within MSRB. The beam pointing angle to the base of the seep target in this case is 51°. Colors within each WCD ping represent raw amplitudes.
Multibeam systems have been used in many studies for the detection of shallow and deep-water gas seeps (e.g., Dupré et al., 2014; Sahling et al., 2014; Skarke et al., 2014; Weber et al., 2014; Michaud et al., 2016; Philip et al., 2016). Methods for automated gas seep detections have been attempted (Urban et al., 2016; Zhao et al., 2017; Zhao et al., 2020; Weber, 2021), but these detections are rarely identified inside the receiver array sidelobe noise within the water column data. For near-benthic MBES water column feature extraction many studies exclude all data from beyond the MSR (e.g., McGonigle et al., 2011; Nakamura et al., 2015; Zhao et al., 2017) or only use the nadir beams (Kruss et al., 2015), severely limiting the volume of data available for WCD analysis. Various studies have attempted to identify targets from within the sidelobe interference or propose methods for post-processing sidelobe suppression. As the receiver array sidelobe interference from the seafloor generally impacts WCD at common time/range samples, the most promising methods involve de-noising techniques based on sample range. de Moustier (2013) proposed a Constant False Alarm Rate (CFAR) method to normalize the signals along each time slice and only retain samples that fall within the 75th quartile. Wang et al. (2020) also proposed a CFAR-based algorithm (Double Selectivity Index (DSI)-CFAR), which uses a sliding window to determine an adaptive threshold for identifying seafloor and water column targets. Weber (2021) proposed a CFAR detector coupled with a morphology-based classifier to isolate gas seep targets. Wilson et al. (2015) developed a model of how noise from the main lobe is recorded on other beams at the same range and subtracted it from those sample ranges to mute the sidelobe noise, although they do not provide specific details of their model or algorithm. Liu et al. (2019) used a mean and standard deviation approach and a compression factor to de-noise the water column images and suppress the across-track sidelobe interference due to targets within the water column using an adaptive soft threshold. Schimel et al. (2020) proposed a promising method for normalizing the WCD across the entire swath, with applications of using WCD to detect giant kelp. This method subtracts the average noise level across each sample range and then reapplies a reference level based on the nadir beams.
Despite the proposal of these promising processing techniques for sidelobe suppression, the robust and repeatable detection and extraction of targets within the outer beams (e.g., fully enclosed within the receiver array sidelobe interference beyond the MSR) remains a challenge. Identifying the maximum extent of the usable swath in the water column data is critical for determining the maximum efficiency of WCD for target detection of near-benthic targets, such as gas seeps extending from the seafloor or vegetation (e.g., kelp). This study presents a fully automated method for filtering WCD, including data contaminated by receiver array sidelobe interference, to extract potential WCD targets and then classify those targets into potential gas bubble seeps in shallow water (<20 m). We determine the full extent to which gas seeps can be accurately identified in the MBES swath, particularly beyond the MSR, and discuss the limits of detection and usefulness of the method in the routine monitoring of gas seeps.
2 Methods
2.1 Data Acquisition
A custom-built bubble release system (BRS) was used to release controlled amounts of CO2 gas into the water column (Scoulding et al., 2020). A gas cylinder containing 6 kg of compressed CO2 gas was housed in an aluminum frame (140 cm long and 120 cm tall) at a 15° upward angle to help maintain flow. The gas cylinder was connected to a dual gauge regulator and a 1/8″ screw valve to control the flow of CO2 gas through to a PVC bubbler containing five equidistant 0.53 mm holes. Two relevant flow rates (determined by Scoulding et al., 2020) were tested, high flow (2 L min−1) and low flow (0.2 L min−1).
The survey was conducted on the 4th of February 2020 off of Kingston Beach in southern Tasmania. The BRS was deployed on a gently sloping sandy seafloor in a water depth of 15 m. MBES WCD was acquired from CSIRO’s 7.5 m vessel South Cape using a pole-mounted Kongsberg EM2040C 1.3° (across-track per beam) x 1.3° (along-track per beam) system. Data were acquired at 300 kHz in continuous wave, single swath, equidistant beam spacing mode (256 beams), using a “very short” pulse length of 25 μs and with 130° swath coverage (65° port and 65° starboard). WCD were recorded as separate *.wcd files with a time-varied gain (TVG) on acquisition of 30 log(r) + 20 dB offset, where r is the range in m. Lines were run at increasing distances from the BRS from both E-W and N-S directions with approximately 20 lines run per 10° distance from the BRS (e.g., 20 passes collected at angles 0–9°, 20 passes at 10–19°, up to 60°). Three speeds were tested (1 m/s, 2 m/s and 3 m/s) for each of the two bubble flow rates (0.2 L min−1 and 2 L min−1) (Figure 2A). A sound velocity cast was taken using a Valeport Monitor sound velocity profiler before data acquisition. The profile revealed a slight thermocline at 10 m depth (Figure 2B). Two additional casts were performed throughout the survey to confirm stable conditions throughout the water column.
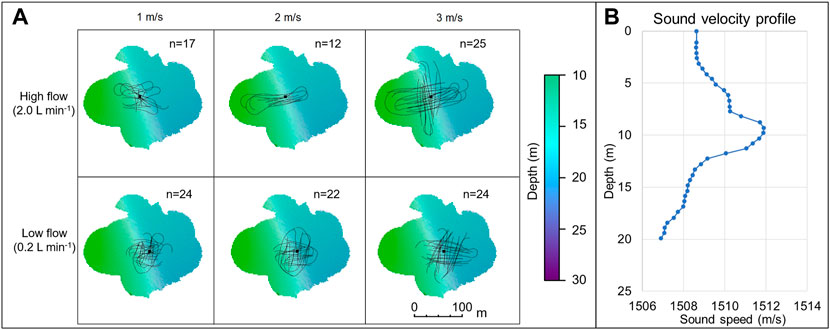
FIGURE 2. (A) Survey lines (solid black lines) are shown for combination of high flow (2 L min−1) and low flow rates (0.2 L min−1) (image rows) at three vessel speeds of 1, 2 and 3 m/s (image columns). The black squares represent the locations of bubble release system. n is the number of survey lines run for each configuration. The scale bar shows distance in meters. The color scale shows bathymetry depth in meters between 10 and 30. (B) Sound velocity profile from survey area.
2.2 Processing Methods
Multibeam water column data are recorded natively (in the notations used in this paper) as a series of transmitted pulses (from the transmitter array) which are recorded from the receiver array in the across track direction and referred to as “pings” (Figure 1A). Each ping consists of a certain number of formed “beams” (e.g., 256 for the Kongsberg EM2040C in equidistant mode) which are further broken down into time “samples” (Figure 1A), where the signal amplitude of each sample is recorded as the return echo strength at that range. Throughout this work, “target” refers to a sample that is considered to be a real reflector within the water column (i.e., not considered noise or artifact) and “feature” refers to a coherent object (e.g., gas seep, fish school) that is made up of targets.
The sample-beam data can be geometrically processed to display each ping as a projection in depth/across track coordinates, as in Figures 1B–D. This is the typical multibeam “fan” that converts the sample/beam data into real-world XYZ coordinates. In this across-track view, the sidelobe interference manifests as a “semi-circle of radius equal to the minimum slant range (MSR) to the seafloor” (Clarke, 2006) where the sidelobe noise is due to the impact of strong targets on neighboring beams in the receiver array, primarily from the strong specular seafloor return but also due to strong reflectors within the water column. The strength of this sidelobe noise at any given range is the result of the strength of the seafloor (or other strong reflector) return combined with the beam pattern of the receiver array. For this paper, the data above the MSR which is assumed to not be impacted by receiver array sidelobe interference due to seafloor echoes is referred to as MSRA, and the data beyond the MSR which is generally confounded by this type of sidelobe interference is referred to as MSRB (Figure 1B). In addition to sidelobe interference, MBES WCD can be contaminated with a variety of other noise sources, such as acoustic interference (impulse noise), ship noise, weather or turbulence from the surface causing bubbles to sweep under the transducer. Examples of various types of noise and data characteristics of WCD are shown in Figure 1C and a comprehensive list of noise sources and how they appear in WCD can be found in Clarke (2006). Beam pointing angle, as reported here, is the angle of a specific beam from nadir (Figure 1D).
The sequence of a series of pings along the ship track can be combined into a 3D volume (triangular volume in Figure 1A). The insonified water volume decreases with increasing beam angle, as described by Urban et al. (2016) and Schimel et al. (2020). This presents an additional challenge when using the full extent of the MBES WCD insofar as features near the seafloor in the outer beams are truncated by the angle of the beam. In Urban et al. (2016), the insonified water volume is further reduced by excluding the volume of water beyond the MSR (Figure 3 in Urban et al., 2016) (i.e., limited to only the data within MSRA (Figure 1B). However, this study’s goal is to extend the useable insonified water volume to include data within the full angular aperture of the swath (MSRA + MSRB). For targets such as gas seeps that present throughout the water column in shallow water, this limits the detection potential in the outer beams.
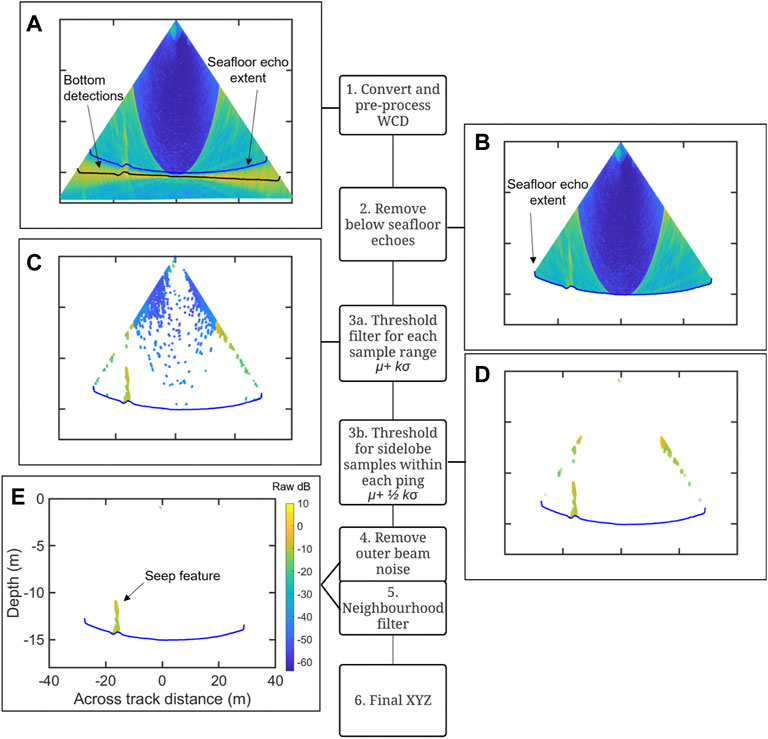
FIGURE 3. Overview of the pre-processing and filtering workflow steps. Images correspond to a single ping with targets comprising a seep feature within the MSRB region. These show the results of applying the corresponding filtering step(s) in sequence. The color scale represents raw dB values ranging from −64 to 10 dB. The black line in the top image (A) shows the original bottom detections. The blue line (B–E) is the modelled extent of the seafloor echoes.
The raw values recorded for water column amplitudes may vary depending on manufacturer specifications and the corrections that are applied on acquisition. For the Kongsberg data used in this study, the amplitude values within the WCD datagrams (AWC) are recorded in 0.5 dB resolution based on Eq. 1 in Gurshin et al. (2009). The raw Kongsberg EM2040 WCD amplitudes were processed using custom Matlab scripts (MATLAB 2019b) built on the open-source CoFFee toolbox (CoFFee, 2020). In this method, water column targets were extracted automatically using sequential filtering steps, with each step further refining the extraction based on known noise patterns of the WCD to isolate real targets. “Targets” in this context, refer to individual WCD samples potentially corresponding to real features within the water column.
2.2.1 Pre-Processing and Filtering Workflow
The pre-processing steps and filtering workflow is summarized in Figure 3 and includes the following steps.
1. Convert and Pre-Process Water Column Data
Multibeam water column data files (∗.wcd) are imported into Matlab using functions from the CoFFee toolbox (CoFFee, 2020). The data are then pre-processed to correctly geolocate water column samples using the method described in Schimel et al. (2020). Sample range is calculated using the sound velocity recorded at the transducer within the WCD datagram (Kongsberg, 2018).
During acquisition, the measured seafloor sample for each beam is recorded as a “bottom detection” (shown as black dots in Figure 3A). These bottom detections are smoothed and filtered to remove errors using the CoFFee smoothing function CFF_filter_WC_bottom_detect.m with a slope threshold of 10.
2. Remove Seafloor Echoes
The amplitude of the samples within the data beyond the minimum slant range (MSRB) depends on the seafloor echo’s strength at the corresponding slant range. To calculate background water column noise levels in subsequent steps (including sidelobe noise at impacted ranges), only samples that are within the water column should be considered, and thus the seafloor echo itself should not be included as part of the water column data for subsequent calculations. The echoes from the seafloor are generally the highest amplitude samples within the WCD, which can skew the average taken across all time samples, and therefore must be removed prior to calculating the statistical thresholds based on sample range.
While the seafloor for bathymetry is recorded as a single bottom detection per beam based on the bottom detection algorithm employed by the system, the echoes of the seafloor are spread across multiple samples, with the number of samples impacted increasing as the footprint of the beam increases with beam angle and depth. The amount of spreading can be estimated by calculating the spreading footprint (f) on the seafloor in the across-track direction based on the beamwidth, beam pointing angle, and the range to the bottom detection using the equation:
where ϴ is the beam pointing angle (radians) and BW is the beamwidth (radians). In this case, the beamwidth used is the one reported by the manufacturer in the system specifications (1.3° for the EM2040C at 300 kHz). This estimation assumes a flat seafloor. By adding this footprint value (in m) to the bottom detection range value for each beam, we can estimate all samples that may be impacted by the echoes from the seafloor above the recorded bottom detection and can then use this as a boundary condition to conservatively remove all the samples below any possible impact of the seafloor echo (solid blue line in Figures 3A–E).
3. Adaptive Statistical Thresholds
The threshold filtering is applied on a ping-by-ping basis. Two thresholds are calculated for each ping, (3a) a threshold calculated from the mean and standard deviation for each sample range which removes the noise from the MSRB regions containing sidelobe interference, and (3b) a threshold based on the amplitudes within the MSRB region of the entire ping which removes remaining low amplitude targets from MSRA.
3a. Threshold for Each Sample Range
For each ping the mean (μ) and standard deviation (σ) is calculated across each sample range. A unique threshold value for each sample range (ts) is then calculated by:
where k is a constant multiplier representing the number of standard deviations (by default k = 2, chosen initially based on the two-sigma rule and determined as optimum through experimentation with different values. No assumptions were made on the distribution of samples). Data are filtered by retaining only values along each sample range above the threshold (ts) value for that range. If a sample is greater than the threshold value for that sample range it is retained, otherwise, the sample is removed (Figure 3C).
3b. Threshold for Each Ping
The threshold based on sample range removes most of the noise within the MSRB region. Due to the lower background noise levels for data within MSRA, low amplitude “targets” can still be retained using only the sample-range threshold, creating a bias of targets detected within MSRA that would be filtered out from the higher background noise levels of MSRB. An additional threshold is used to further clean the remaining water column and to only retain targets that can be detected within both MSRA and MSRB. An overall ping threshold value is calculated based on the average amplitude levels within MSRB of the entire ping. MSRB is determined by extracting samples with ranges greater than the MSR but less than the bottom footprint calculated using Eq. 1. Using these samples only, a single additional threshold for each ping (tp) is calculated by:
For the remaining samples from Step 3a, if the sample is greater than the ping threshold tp it is retained, otherwise the sample is removed (Figure 3D).
Figure 4 illustrates the two thresholds compared to the WCD amplitudes along a specific beam over a seep target. The noise level within MSRB depends on the initial response of the seafloor echo at each slant range. The goal of calculating the threshold along each slant range is to determine the amount of “noise” that is proportional to and thus dependent on the original seafloor echo, but without including the actual seafloor value itself. This makes the calculated statistics self-adjust to the impact of the seafloor signal within the sidelobes at each range without skewing the values with the data from the seafloor.
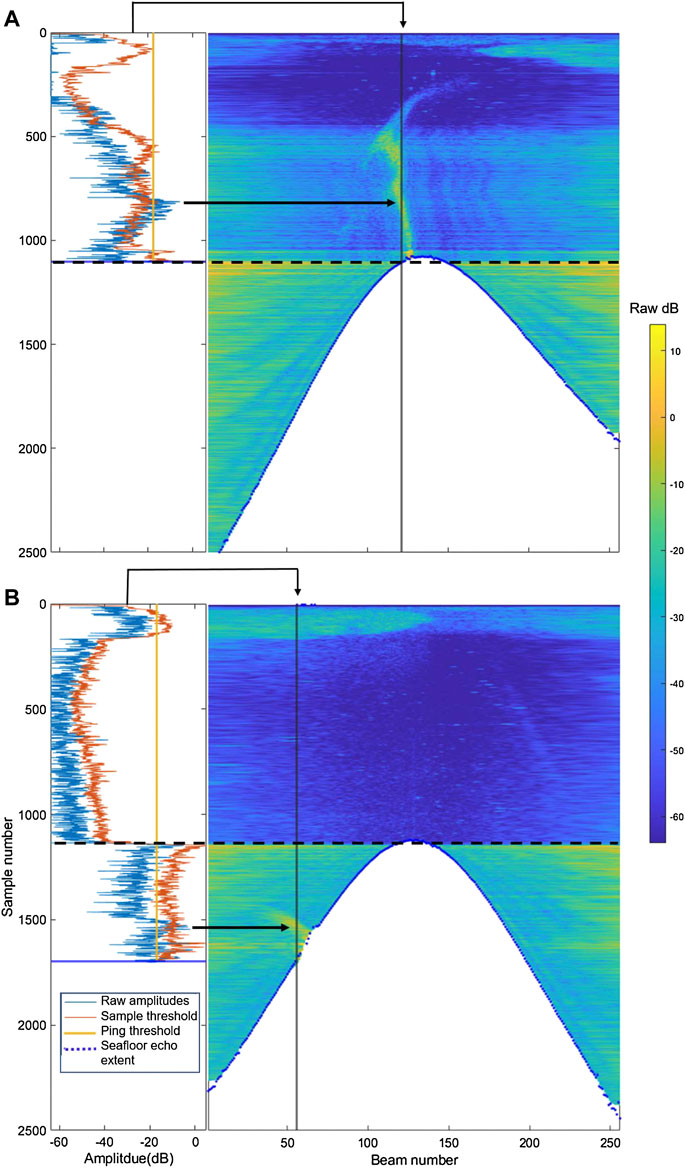
FIGURE 4. Example of raw WCD amplitudes plotted with the filtering thresholds for a seep located (A) near nadir and (B) within the outer beams fully within MSRB. The graphs on the left show a plot of the raw WCD amplitudes (light blue line) for the beam indicated by the vertical black line on the corresponding image on the right. The orange line is the sample range threshold, with a different threshold value for each sample range. The yellow line is the ping threshold, with a single value for all samples and beams for that ping. Any part of the blue line that is to the right of both the orange and yellow thresholds at that sample range will be retained by the filtering. Any data to the left of the thresholds will be rejected. The black arrows indicate the seep, which has amplitudes above (right) of both thresholds. The black dashed lines indicate the transition between the MSRA and MSRB data. Note the lack of this transition in (A) as the plotted beam falls fully within MSRA. The color scale for the right images is raw amplitude in dB and corresponds to the X-axis of the plots on the left.
4. Filtering of the Outer Beam Noise
After applying the thresholds from steps 3a and 3b, we can assume that the remaining noise is primarily due to other persistent noise characteristics such as high noise in the outer beams described by Schimel et al. (2020) or sources of noise not related to sidelobe interference, such as ship-related noise or acoustic interference (Figure 1C). To remove the outer beam noise, data from the outer 5° beams are discarded (e.g., beam pointing angles >60°) (Figure 3E).
5. Neighborhood Filter
As the final filtering step, a neighborhood filter is run on any remaining targets. This removes impulse noise, bottom reverberations due to acoustic interference, propeller or vessel noise by using the non persistent characteristic of those (unlikely to remain stable for several pings). The neighborhood filter runs over a sequence of three pings, where for each ping the remaining targets are compared with targets one ping before and after at the same sample range. Any target within the central ping without at least one neighboring target at the same sample range from the surrounding pings is removed (Figure 3E).
6. Generation of the Point Cloud
The remaining samples are then exported to a text file containing X (Easting in m), Y (Northing in m), Z (depth in m) coordinates and relevant associated metadata (beam number, beam pointing angle, ping number, file number, sample range, nadir bottom detection range, amplitude) for each sample target. Although the final data are exported in point format, note that each point corresponds to the volume of water contained within the sample resolution and beam width at that sample range.
For this experimental setup, the metal frame of the BRS extended into the water column by 1 m and could impact the water column samples near the bottom detections. Therefore, the filtered data was run through one additional step to remove samples within 1 m of the seafloor (the height of the lander frame). It ensured that all detected targets, particularly within the outer beams, corresponded to gas bubbles only and not an interaction with the frame. This was performed as a conservative measure to ensure accurate representation of seep detection, but it would not need to be applied in a natural environment where seeps would originate from the seafloor itself.
2.2.1.1 Filtering Variations
Various values of the constant multiplier k were tested to determine the impact of changing this variable and to determine the optimal value. Using the optimized value of k (k = 2), variations to the remaining steps of the method were also tested to demonstrate their impact on the final results. These tests included not removing the seafloor echoes before calculating the sample range statistics (step 2) and not applying the neighborhood filter (step 5). These alternatives were used to determine the optimal parameters and sequence of steps for the method, and to demonstrate the impact of excluding any of the steps.
2.2.2 Classification Workflow
Following the filtering workflow, the resulting XYZ points represent a “cleaned” set of targets containing potential features of interest, such as gas seeps, fish schools, or vegetation. In this study, we are focusing on detecting gas seeps and therefore the calssification methods were developed to isolate and classify targets that correspond to seep features automatically. This was done using the Matlab Computer Vision toolbox. It includes the following steps (Figure 5).
(1) The results of the filtered XYZ workflow are converted to a Matlab point cloud format.
(2) The point cloud is classified into clusters using the Computer Vision cluster algorithm based on Euclidean distance (pcsegdist), with a 1.0 m distance threshold.
(3) As gas seeps are expected to form a coherent feature consisting of many points, any small clusters (<100-point targets) are removed (seeps detected at 50° at 6 kts consist of approximately 100–500 points).
(4) The remaining clusters are validated against morphological criteria by calculating the height/width (H/W) ratio and distance of the base of the target to the seafloor. Height (H, in m) is determined by calculating the difference between the minimum and maximum Z values within a cluster. Width (W, in m) is determined by calculating the difference between the minimum and maximum X and Y values (Easting and Northing, in m) and using the largest as W.
(5) Clusters with a H/W ratio greater than 0.8 and those that are within 5 m of the seafloor are classified as potential seeps. The H/W ratio was chosen assuming that seep features will be vertically extended within the water column. However, at large beam angles, the reduced sampling volume limits the vertical extent of the observed feature, so a moderate value of 0.8 was chosen to retain potential seeps within the outer beams. The 5 m criteria was used under the assumption that seeps will be emanating from the seafloor, so the minimum detections should originate within 5 m of the seafloor, otherwise, it may represent a different feature that may appear similar morphologically but may be higher in the water column. All other clusters are classified as “non-seep” features.
(6) Final clusters are exported to an XYZ text file along with corresponding data values for each sample, such as raw amplitude (AWC), calculated Svu, beam number, ping number, across-track distance, beam pointing angle, sample range, bottom detection range, cluster number, and whether the cluster was classified as a seep or non-seep feature.
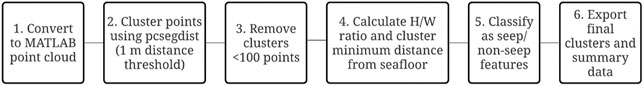
FIGURE 5. Overview of classification workflow.
2.2.3 Noise/Amplitude Levels
Raw AWC values can be converted to an estimate of uncalibrated volume scattering (Svu, dB re 1 m−1) using the equation from Gurshin et al. (2009) and Urban et al. (2016), where subscript u denotes uncalibrated values (Dunlop et al., 2018), as:
where X is time-varied gain (TVG) function, r is range (m), c is sound speed (m/s),
Svu is used to compare relative differences in the strength of the individual gas seep targets and compare the amplitude of targets against the background noise levels. For all calculations using Svu, arithmetic means are computed in the linear domain as uncalibrated volume backscattering coefficients, svu = 10^(Svu/10) and reported back in the logarithmic domain Svu = 10log10(svu).
To compare maximum, minimum and mean Svu levels detected for each pass over the seep, a slice of data between 12 and 13 m water depth was extracted to compare amplitude strengths at a consistent depth. This range was chosen to be far enough above the BRS so that the frame would not have an impact on the amplitudes at any beam angle, but close enough to the seafloor to include detections from large pointing angles that may be limited due to the reduced sampling volume in the outer beams. Average noise levels from the Svu amplitudes were calculated for all WCD files, for both the MRSA and MSRB regions using a series of 75 pings of “empty” water column data (either before or after the known gas seep).
3 Results
The results are reported based on the beam pointing angle from nadir to the base (at the seafloor) of the known seep target (Figure 1D.) which is chosen to give an indication of the greatest across-track distance for which the targets can be reliably identified using a swath width on acquisition of 65° (port and starboard).
3.1 Detection
By running the filtering steps, the original *.wcd data files are reduced from a file size of 300 MB (approximately 500 pings collected over 60 s) to XYZ text files of 1–6 MB. The output file includes information for each sample target such as raw amplitude, Svu, beam number, beam pointing angle, sample range, nadir bottom range, ping number and whether the sample is within the MSRB. In addition to the XYZ point cloud, a quality control image is generated, showing the targets retained by ping after the filtering process. Figure 6 shows examples of these images for a gas seep detected at (a) nadir and (b) at 51°. In these images, the dark blue points are targets identified within the MSRA region and orange points indicate targets identified within MSRB. Even when fully within MSRB (Figure 6B) the gas seep is visible as the prominent feature before classification. The reduced vertical extent of the seep at the higher angle is due to the reduced sampling volume as angle from nadir increases (i.e., the bubbles rise out of the detection range of the beams).
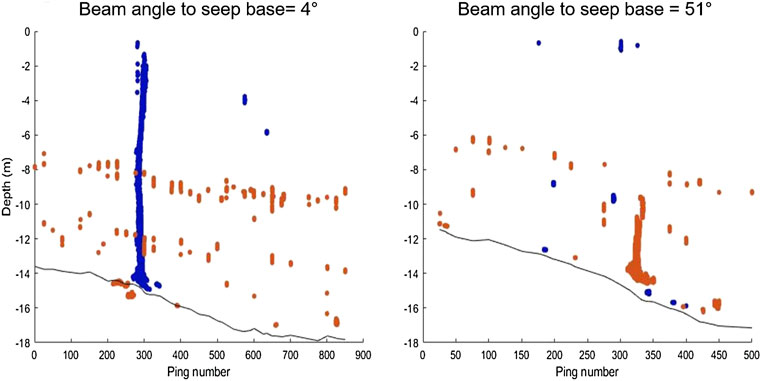
FIGURE 6. 2-D quality control figures generated from filtering workflow. (A) shows a survey line with the gas seep located near nadir (4°), and (B) shows a survey line with the gas seep base located at 51°. Base angle is the beam pointing angle to the base of the gas seep at the seafloor. The blue points indicate targets within MSRA, and the orange points indicate targets within MSRB (fully within sidelobe interference). Black lines indicate bottom detections from the nadir beam. In these images targets across all beams are overplotted at each ping number to compress the image from 3-D to 2-D.
3.2 Classification
Individual gas seep features are automatically extracted from the raw WCD amplitudes in the filtering and classification steps. An example of one classified point cloud cluster is shown in Figure 7, where the left image illustrates the raw water column fan in 3-D and the right image shows the extracted point cloud overlaid in black. The same survey line is presented as Figure 6B, where the seep was located fully within the MSRB region with an angle to the base of the gas seep at 51°.
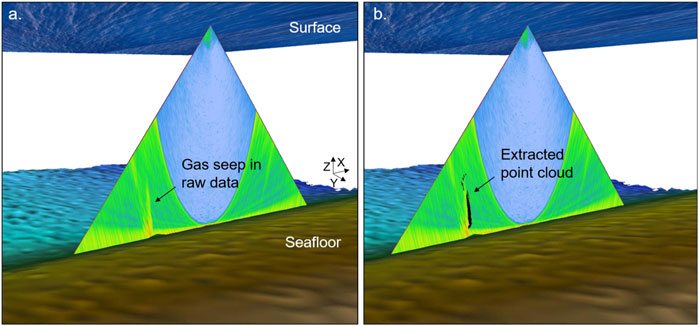
FIGURE 7. 3-D image of classified point cloud on original water column fan (single ping); (A) Original WCD image and (B) classified point cloud overlaid on original data.
Examples of gas seeps extracted as 3-D point clouds at various angles from 0° to 56° are shown in Figure 8. All of these were from the low flow rate (0.2 L min−1) release with the vessel travelling at 3 m/s. The decreasing vertical detectable extent of the gas seep with increasing angle is due to the decreasing sampling volume near the edges of the water column fan. Gas seep clusters were composed of numbers of point targets between 110 and 45,292, with an average of 5,842 targets per gas seep feature. Numbers of targets within the gas seep clusters decreased with increasing speed and beam angle, due to the increased distance between pings at higher speeds and the decreased sampling volume at higher angles.
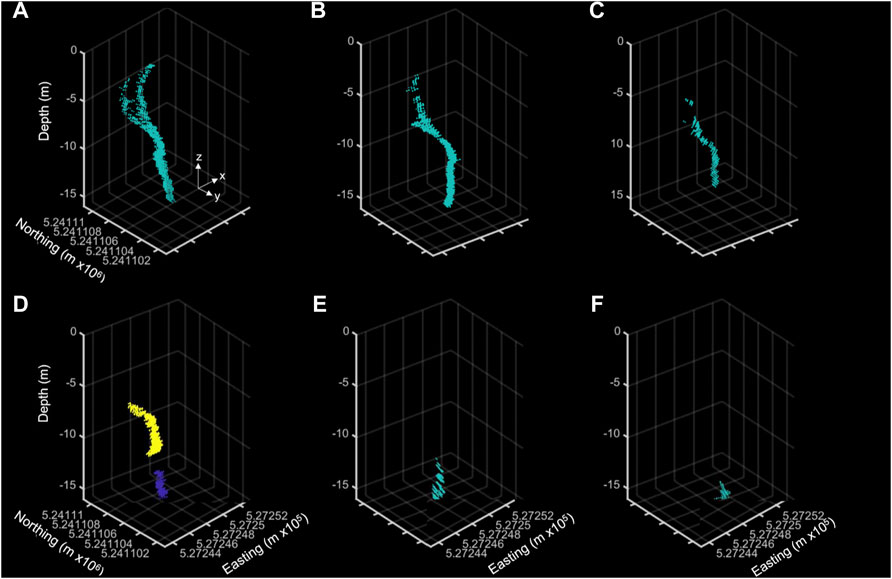
FIGURE 8. 3-D point clouds of classified seep features from various angles (A) 3°, (B) 13°, (C) 35°, (D) 43°, (E) 50°, and (F) 56°. The two colors in (D) indicate that two separate seep clusters were identified.
Each of the resulting gas seep point clouds was checked for accuracy against the true seep location and original water column fan images. A total of 124 survey lines with gas seeps with a verified location of the BRS were analyzed across a range of angles from 0 to 60°, along with 63 additional survey lines of data either from line turns or passes where there was no flow from the BRS to test for false positives or false negatives. Out of these 187 survey lines, 178 were correctly classified (either as true gas seep or true negative), indicating ∼95% detection success. The total number of correctly and incorrectly identified seeps binned by base angle is shown in Table 1. At base angles of greater than 50°, 19 seeps were correctly identified out of the 23 lines tested. For angles of 40–49°, 20 out of 21 were correctly identified. At angles less than 40°, all seeps were correctly identified.
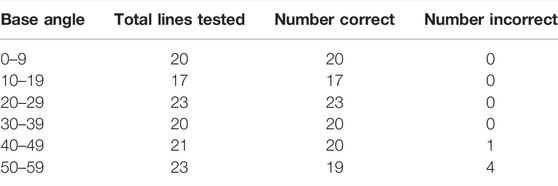
TABLE 1. Number of correctly and incorrectly identified seeps by base angle. Base angles are binned by 10° increments.
For the “control” survey lines with no gas seeps a total of four false positives were detected. At least one false positive was due to anomalous loss of data in one half of the swath for a few pings which allowed vessel noise to bypass the threshold filters. For the survey lines containing the target gas seep (n = 124) the single gas seep feature was classified as two separate clusters five times. In these cases, the targets were divided between the MSRA and MSRB portions of the data (Figure 8D). This was likely due to the high noise at the interchange between these regions, which can cause a gap in the points greater than the 1.0 m clustering threshold. However, in these cases, the gas seep was identified correctly, with each section classified as a separate gas seep cluster. Of the five false negatives (where a gas seep should have been detected) only one occurred at angles less than 55° (occurring at 44°). Four of the five false negatives were made at the highest speed tested of 3 m/s. Only one false negative was identified for the high flow seep, which had a base angle of 58°.
The constant multiplier, k, represents the number of standard deviations from the mean from which data are identified as real targets above the background noise. Throughout the development of the method many values of k were tested. We present here two different values (one above and one below 2) to demonstrate the impact of this value on detection capabilities. These data are presented in Table 2. By decreasing k from 2 to 1.8, one additional gas seep at angles greater than 50° was correctly identified. However, the number of false positive detections increased significantly due to the lower threshold values retaining additional potential targets. Increasing k from 2 to 2.2 resulted in more true seeps (14 in total) being missed due to the more aggressive threshold values. The method presented using k = 2 was determined to provide the optimal results in terms of high confidence of detections with low chances of false positives.
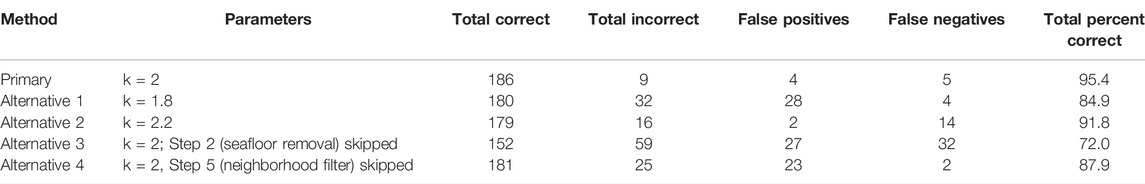
TABLE 2. Results of total correct classifications using the primary and alternative processing steps. The total correct are the total number of either true seep detections or true negatives out of 187 lines tested. Total numbers of correct and incorrect may be more than 187 due to false positives or due to a seep being classified twice due to being split between the MSRA/MSRB transition. False positives are seeps features that were classified outside of the known seep location. False negatives are cases where no seeps were detected on a line where the known seep was present. Total percent correct is based on the total number of correct detections divided by the total of correct and incorrect.
Alterations to the workflow were also tested by removing certain steps of the filtering process. The filtering steps were run without first removing the samples from and below the seafloor echoes (step 2) (Alternative 3, Table 2). This resulted in a reduction in success rate from 95% to 72.0% with 32 of the 124 seeps no longer detected. Alternative 4 tested the impact of removing the neighborhood filtering step (step 5). In this case, the success rate dropped from 95% to 87.9%. Although all the seeps correctly classified by the original method were the same for this scenario, and three additional seeps were correctly detected, the removal of the neighborhood filter resulted in significantly more false positives as the noise that the filter would have removed was incorrectly classified as seep related.
Figure 9 shows a comparison of the primary and alternative methods with the results obtained by each method reported as a percentage of the correctly identified seeps depending on beam angle. This is the ratio of the positively identified seeps divided by the total number of verified gas seeps within the dataset. This does not include the control survey lines or false positives. The results were binned by angle in 5° increments between 0 and 60° and plotted at the midpoint of each bin. This figure shows that the primary method has 100% success at identifying the seeps up to 40°, with the reliability dropping to ∼50% only past 55°. The alternate methods (dashed lines) result in less consistent detections, even at angles <40°. In particular, the alternative method that did not remove the seafloor echoes prior to calculating the threshold statistics decreases significantly past the transition to MSRB, indicating that this step is critical for successfully determining an appropriate threshold for each sample range.
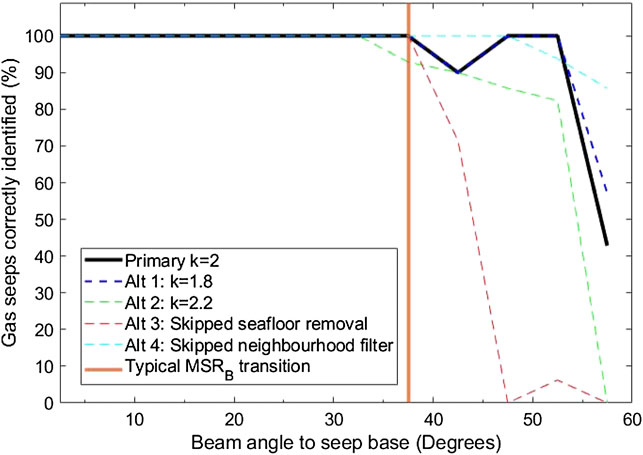
FIGURE 9. Percentage of seeps correctly identified by beam angle to seep base. The solid black line shows the results of using the primary method (k = 2), and dashed lines show the results using the alternative methods. Different parameters for each method are indicated by the colour. Percentages were calculated using only the count of correct seeps identified divided by the total number of lines containing a seep. The vertical orange line represents the typical transition between the MSRA and MSRB data. Seeps detected at beam angles greater than 37.5° would generally be within the sidelobe interference of the MSRB data.
Figure 10 illustrates the false positive detections for each processing scenario. It highlights the marked increase in false-positive detections for reducing k from 2 to 1.8, skipping the removal of seafloor detection step, or skipping the neighborhood filtering step. Combined with the correct percentages displayed in Figure 9, the primary method using k = 2 provides optimal results while minimizing false detections.
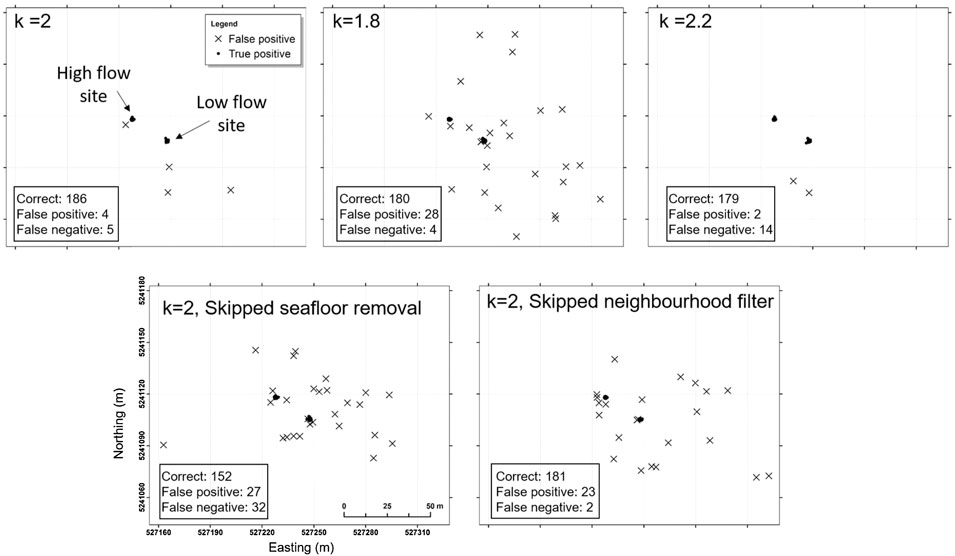
FIGURE 10. Maps displaying false positives for the primary and alternative processing methods. Grids are in Easting (m) and Northings (m) using WGS84 UTM Zone 55S projection coordinates. False positives are shown by crosses, and correctly identified seeps are solid circles. The two clusters’ locations of correct seeps are the locations of the high and low flow deployments.
Changing the thresholds of the classification workflow only altered the results slightly. Distance thresholds between 0.5 and 1 m made no difference to the overall results, with the only difference being that a 0.5 m threshold resulted in more seeps being split into two separate clusters at the MSRA/MSRB transition. Increasing the threshold to 2 m also does not impact the overall detections, but more possibly unrelated targets are included in the classified seeps. Most gas seeps within the outer beams (>50°) contained between 100 and 600 points up to speeds of 3 m/s. Changing the point threshold up to 500 points decreased the gas seep detection rates in the outer beams (17 false negatives, overall success of 90% with no seeps detected beyond 54°), and 100 was determined to be the optimal count for retaining the most gas seeps without resulting in too many small false clusters.
3.3 Noise Level Results
The background noise results (in Svu) for samples within MSRA and MSRB were averaged for each speed using 75 pings of “empty” WCD (no gas seep present) for each file to give an overall indication of background noise levels. Within MSRA the background levels were −66.9, −66.2, and −54.5 dB for 1, 2, and 3 m/s, respectively. Within MSRB the background noise levels were −37.4, −36.9 and −34.2 dB for 1, 2 and 3 m/s, respectively. Background noise levels increased at higher speeds, likely due to an increase in vessel induced noise at higher speeds. This is more notable in the MSRA region, which is expected as the sidelobe noise dominates most other noise sources in the MSRB region.
Histograms of the Svu and raw sample amplitudes within each region of the WCD fan are shown in Figure 11. This highlights the distinct higher background noise levels within the data MSRB. The Svu of the gas seep-related targets are within the upper limits of the MSRB background levels, indicating that targets can be extracted using the filtering methods even close to the background noise levels.
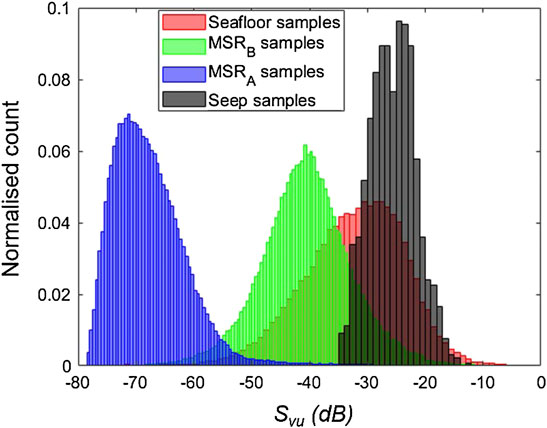
FIGURE 11. Histograms of WCD samples Svu values by region. Blue samples are from data in the MRSA region, green samples are from the MSRB region, red samples are samples impacted by the echo of the seafloor and black samples are from within a gas seep feature. All except for the seep samples were from data within a single ping. Seep samples were collated over a series of pings due to the low number of seep target samples within a single ping.
3.4 Seep Amplitude Results
The maximum, minimum and mean Svu values were determined for each survey line for a horizontal slice of the extracted gas seep targets between 12 and 13 m depth. Figure 12A shows the mean Svu of targets for the high flow and low flow rate gas seeps across all angles and speeds and whether the samples were detected within the MSRA or MSRB regions. The mean Svu shows consistent values across all speeds and angles. There is a slight increase for the values within the MSRB region, which is due to some lower amplitude samples being retained as targets within the MSRA region, so the averaged values become biased at the lower angles. Figure 12B shows the maximum Svu of the same target sets as Figure 12A. These data also indicate that beam angle does not significantly impact amplitude, although there is a slight decrease above 55°. The average of the maximum samples was −16.1 dB for the high flow (ranging between −11.8 and −21.2) and −21.5 dB for the low flow (ranging between −18.0 and −27.8). These values indicate a ∼6–7 dB detected difference between the high and low flow rates. The average of the minimum samples was −31.4 dB for the high flow (ranging between −33.1 and −28.4) and −34.0 dB for the low flow (ranging between −37.2 and −28.3). These values indicate that the detection limit for these target using this method is ∼3–5 dB above the background sidelobe noise (samples within MSRB).
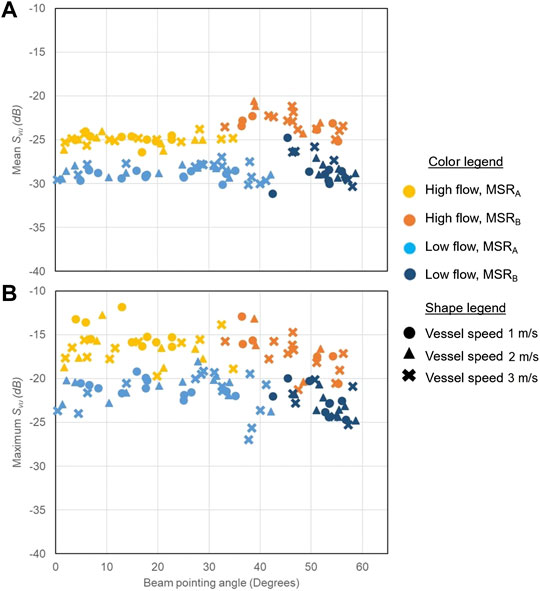
FIGURE 12. (A) Mean Svu values plotted by beam pointing angle. Circles represent data collected at 1 m/s, triangles at 2 m/s and crosses at 3 m/s. High flow refers to 2.0 L min−1 and Low flow refers to 0.2 L min−1. MSRA are samples above the minimum slant range, and MSRB are samples that are below (within the area of receiver array sidelobe interference). (B) Maximum Svu values plotted by beam pointing angle.
The amplitudes of the seep targets that were detected were generally well above the sidelobe noise and had consistent amplitudes across all angles, indicating that the chosen target could be reliably detected. These results show it is possible to detect seeps at a rate of 0.2 L min−1 out to 55° and speeds up to 3 m/s.
4 Discussion
While processing WCD to the full extent of the swath is a relatively new field due to the inherent difficulties of sidelobe interference, there has recently been increased effort to effectively filter or suppress this interference for various water column targets (de Moustier, 2013; Liu et al., 2019; Schimel et al., 2020; Wang et al., 2020). However, no studies have quantifiably determined the maximum extent to which data can be utilized in the MSRB region. Through a controlled field experiment, this study demonstrates that targets with an amplitude of at least 3–5 dB above the average sidelobe noise levels can be identified up to beam angles of 55°, significantly extending the range of WCD suitable for analysis. The method uses filtering threshold values calculated directly from the data on a sample range and ping-by-ping basis, minimizing the need for prior knowledge about the absolute amplitudes of targets.
Extending the available data to the full width of the swath to detect real targets within 5° of the maximum beam angles significantly improves the cost-effectiveness of using MBES as a monitoring tool. Compared to analyses that only consider the MSRA region, this method increases the area of the multibeam fan available for analysis by 53%. For shallow gas detection, the ability to monitor for gas reliably and efficiently is a critical component of monitoring programs such as for Carbon Capture and Storage (CCS) (Blackford et al., 2014; Dean et al., 2020). The variation of parameters presented in the results (Table 2) demonstrates the effectiveness of the method for correctly classifying gas seeps (100% confidence out to 44°) while also minimizing the rate of false-positive classifications (4 false positives out of 187 survey lines, ∼2% false-detection rate). This method is well suited for Measurement, Monitoring and Verification tasks in inshore shallow water CCS sites (Blackford et al., 2015; Harkin et al., 2017), which may have similar environmental characteristics to the test site in this study.
Automating the filtering and extraction of features reduces the amount of manual MBES data processing required, reducing the volume of data (from 300 MB to ∼2 kB) while preserving all raw data values relevant for subsequent processing and analysis. The results flag only targets significant enough to require further inspection by an analyst, considerably reducing manual overhead costs. Commercially available software packages still rely heavily on visual interpretation and manual editing, resulting in a need for improved automation and detection algorithms. Due to the dynamic nature of noise within the WCD, a simple single amplitude threshold (e.g., filtering workflow Section 2.2.1.3.2) is insufficient to fully clean noise from real targets. Using additional thresholds relative to each sample range ensures that only targets above the relative background noise at each range are retained without the need for further manual editing. The method presented here is fully automated and could be implemented easily within one of the commercially available platforms.
4.1 Sidelobe Noise
Previous studies have shown that using the average signal (Schimel et al., 2020) and variance (Liu et al., 2019) of WCD samples along a common range arc can effectively suppress sidelobe noise. The method presented by Liu et al. (2019) reduced the sidelobe interference, but it did not demonstrate the full extent to which targets can be identified across the entire multibeam swath. Schimel et al. (2020) provides the most promising method to date for fully normalizing water column returns across the swath. The methods presented here build on this concept by using the variance of each sample range as a threshold to remove background noise rather than normalize it, to extract coherent features to the full extent of the multibeam swath. Other methods were also tested, such as using quantiles to determine the threshold values at each sample range rather than the mean and variance. The 95th and 97.5 quantiles were tested (substituted for step 3a), and it was found that the 95th quantile retained too much noise, while the 97.5 missed a significant number of real seeps. Therefore, this technique was not pursued further.
Some multibeam systems, such as the Kongsberg EM710, use sectors to try to minimize sidelobe interference on acquisition, which may impact how effective this method is for filtering sidelobe noise for those systems. However, it may be possible to modify the algorithm to determine thresholds based on sample range and sector and apply the thresholds separately to each sector. Zhao et al. (2017) used a similar method wherein a threshold was determined by μ+ k σ, which was calculated for the amplitude values within a whole sector rather than by sample range. This method effectively removed background noise for automated detection of gas plumes, but was only applied to data within MSRA.
Other methods for suppressing sidelobes at the beamforming stage have been proposed (Lønmo et al., 2020), and some sonar systems specifically designed to limit sidelobe levels, such as the Simard ME70, have been developed (Trenkel et al., 2008). Such methods may lower sidelobe levels to enable additional detections within the MSRB region. However, many MBES systems still employ a Mills Cross configuration with sidelobe suppression limited to Dolph-Chebyshev array shading on beamforming (Lurton, 2016). Thus, until suitable and affordable technological solutions can resolve the sidelobe interference issue, post-processing methods must be developed to effectively filter the sidelobe signal to take advantage of the MBES WCD from many of the MBES systems in use today. The method described here provides an easily implemented approach to optimizing data analysis within conventional Mills Cross beam forming scenarios.
4.2 Impact of k
The value of k in this workflow was shown to have an impact on the results. The optimal value was determined through experimentation, but comparable conclusions have been found from similar analyses (Zhao et al., 2017; Liu et al., 2019). Zhao et al. (2017) determined optimal values of k of 1.2 and 1.5 for different datasets and noted that this value may depend on depth. Liu et al. (2019) set their constant multiplier parameter (b) to 1.8, noting that increasing or decreasing this value resulted in either too many targets being removed or too many false positives, respectively. Adjustments to k may be necessary, depending on the depth of the survey area, frequency of the MBES system, or backscattering strength of the target of interest. If implemented within commercial software, the ability to adjust this parameter would improve the flexibility of optimizing the method for various datasets. As a general rule, a lower k value may be sufficient for datasets with overall low noise (e.g., calm survey conditions, low ship noise) but a higher k may be required for highly contaminated data. A lower k would result in detecting targets closer to background noise levels but may result in more false positives. Knowledge of the data quality and target of interest should help guide the choice for a suitable value of k.
4.3 Limitations
4.3.1 Acoustic Detectability
Although the method demonstrated works well for this shallow water example over a flat seafloor, we recognize that there are several limitations as well as potential improvements required, particularly when it is applied to a dynamic natural environment. Employing MBES WCD in general for detecting any target is limited by the acoustic detectability of the feature of interest. Acoustic detectability will depend on:
(1) the backscatter strength of the target relative to background noise levels and
(2) the sampling volume limited by the beam angles.
Although targets within the sidelobe noise are able to be extracted using the method presented here, targets that have an amplitude below the sidelobe noise levels still cannot be detected. As the sidelobe noise is not additive to the strength of the target, anything below the sidelobe level will saturate the sample amplitude, resulting in the loss of any true scattering. This limits the proposed algorithm’s use to targets that are known to be at least two times (3 dB) higher than the sidelobe level. In the case of gas seeps, for a given frequency, the strength of the backscatter return from bubbles varies with the size and density of bubbles (Greinert and Nützel, 2004; Ainslie and Leighton, 2009), and as bubbles rise, they may dissolve (McCartney and Bary, 1965), decreasing their acoustic signature beyond what can be detected by the MBES system (Nakamura et al., 2015; Philip et al., 2016).
Data acquisition conditions have a significant impact on data quality, which would ultimately impact the ability to detect seeps. For example, vessel speed impacts the number of detections over a target and the noise within the WCD (Chadwick et al., 2014; Nakamura et al., 2015). An increase in background noise level will decrease the limits of detection of the targets of interest.
In terms of point (2) above, the sampling volume of the multibeam fan decreases with increasing beam angle, as described by Urban et al. (2016) and Schimel et al. (2020). This presents an additional challenge when using the full extent of the MBES WCD insofar as the vertical extent of features in the outer beams are truncated by the angle of the beam. The reduction of sampling volume with increased beam angles limits the applications of full-swath MBES WCD analysis to features likely to fall near to the seafloor within the insonified range. Using the method presented here, the height of detected gas seeps will be limited in the outer beams by the reduced sampling volume, and overall detections will be limited by the acoustic detectability above the background noise levels within the MSRB region. With these known limitations, this method is ideally suited for the detection of strong benthic targets, such as gas seeps, vegetation, or near-benthic dwelling species of fish. Gas seeps present an ideal target as they originate from the seafloor and may be easier to detect close to the seafloor before there is a chance for dissolution or dispersions of individual bubbles within the water column.
4.3.2 Seafloor Impact
A major limitation to this study was the flat, homogenous seafloor over which the experiment was performed, which may not be realistic for some natural seep areas. Although the sidelobe noise pattern is predictable, the strength of the interference is directly related to the strength of the seafloor return based on its characteristics. For natural gas seep environments, the seafloor surrounding the seep is typically characterized by pockmarks (Cathles et al., 2010) or ‘hardground’ structures (Spain et al., 2022). The pockmarks generally form a depression in the bathymetry and can have backscatter intensity values of 3–4 dB higher than the surrounding seafloor (Tang et al., 2021). This increased seafloor signal results in higher amplitude sidelobe response at corresponding ranges. In terms of the method proposed here, this means a higher background noise level at the slant ranges corresponding to the seep base or pockmark area will limit the detection of targets to those above those background levels. However, since the threshold statistics used are directly related to the signal strength at a given slant range, a target sufficiently above the background levels should still be detected, even if that bottom echo has a higher backscatter value than surrounding areas (such as a pockmark). It should be recognized that this method’s ability to extract a target depends on the target being statistically higher amplitude than the noise along a common range arc, which will vary for each range due to the variability of the seafloor response.
A more pressing limitation is that the pattern of noise within the MSRB is not entirely consistent along each slant range and varies along each beam based on the beam pattern of the receiver array. The optimal solution for reducing the noise within MSRB would be to estimate the influence of this beam pattern directly. This is not easily implemented without exact knowledge of the beam pattern of a specific transducer, which depends on parameters not often shared by manufacturers (element number, their spacing, their directivity, and antenna shading). The method presented here provides a computationally simple approach that adjusts for most of the noise within the MSRB. In some cases, the influence of the beam pattern may be strong enough to fall outside the thresholds calculated for the sample range and thus not be fully filtered by this method. Work is currently underway to incorporate a better compensation of the beam pattern influence, which may improve these results.
The model of the seafloor footprint in Section 2.2.1, Step 2 of the filtering workflow is a novel attempt to model the spatial extent of the energy from the bottom detection, which can be crucial for near-benthic applications and for identifying targets close to the “acoustic dead zone” (Ona and Mitson, 1996). This model is an estimation based on the 3 dB beamwidth and assumes a flat seafloor. Although simplified, this model agreed well with the slightly sloping bathymetry of the field test data. In Figure 3, the blue line shows that the spreading estimation is slightly above the seafloor signals within the data. This is due to the equation being an estimation based on range rather than a calculation of the true beam insonified width taking into account steering angle, wavelength, and shading (see equations in Marques, 2012). The estimation was determined to be conservative (at worst taking away too many samples rather than too few) and was computationally efficient.
Seafloor echoes from complex bathymetry such as rocky reefs and canyons can be contaminated with a significant amount of transmit array sidelobe interference (Nau et al., 2018), which could hinder the effectiveness of the Eq. 1 used to remove the seafloor echoes. In the worst case, if the model did not remove all true seafloor echoes the mean and standard deviation along a sample range may be skewed to higher amplitudes and would over-filter data along that range. Equation 1 could be modified to include bathymetric slope and construct a more realistic model of the influence of the seafloor on sample amplitudes around the bottom detection.
4.3.3 Quantitative Analysis
Quantitative analysis, presented in Svu here, is limited due to the uncalibrated nature of MBES WCD as well as to the fact that because of transmitter array sidelobes, water column targets within neighboring beams can cause “ghost” echoes (Dupré et al., 2015; Wilson et al., 2015) which can convolute quantitative estimates based on backscatter strengths. The Svu values determined across a common depth slice demonstrate the ability to consistently detect the difference between flow rates (0.2 L min−1 and 2 L min−1), like what was found for comparable flow rates during single-beam echosounder experiments (Scoulding et al., 2020). These data show that Svu is consistent across all angles and survey vessel speeds, with a slight decrease in the outer beams. This decrease may be due to the equivalent beam angle not fully being compensated for within the recorded amplitude values. These detected differences assume consistent bubble size and density within each flow rate. Changes in bubble population sizes or density impact Svu values and could thus change the ability to detect differences based solely on flow rate.
4.3.4 Additional Limitations
Another limitation of this method is the absence of compensation for all potential sources of acoustic noise. WCD can be impacted by transmitter array sidelobe noise and other transient noise that persists for more than one ping, which may not be removed by the presented method. These additional noise sources could lead to false-positive detections as they may be flagged as targets. Additional filters could be implemented to identify and remove those noise sources.
Removing the outer beams to filter the high noise levels at the edges of the swath is an overly simplified approach. Alternative statistical approaches could be implemented to remove the outer beam noise without excluding all data in those beams.
4.4 Classification
In this study, the classification was tailored to shallow gas seeps, but this could be modified for any other target of interest, such as fish schools, vegetation, or wrecks, provided the amplitude of the target is at least above the MSRB background noise levels and has a defining morphological characteristic. Gas seeps have a characteristic shape referred to in the acoustic signature as a “flare” (Judd et al., 1997), which is generally a narrow feature extending from the seafloor. Flare shape is influenced by ocean currents and the rise velocity of the bubbles, and the stability of the shape allows for these characteristics to be used as a signature to distinguish seeps from other biological targets (Judd et al., 1997; Greinert, 2008; Ostrovsky, 2009; Schneider von Deimling and Papenberg, 2012). By understanding the characteristics of different water column targets, we can implement criteria to guide classification rules. It must be noted, however, that these assumed characteristics may change due to dynamic oceanographic conditions (e.g., water currents, thermoclines) which impact the horizontal path of rising bubbles streams (McCartney and Bary, 1965; Schneider von Deimling et al., 2010; Wilson et al., 2015), and therefore may need to be modified depending on knowledge of the local oceanography. Additionally, full ray tracing of the water column samples is traditionally not applied. In locations with distinct thermo- or pycnoclines, this may impact the relative sample range of targets, the distribution of noise along a sample range, and the morphological appearance of cohesive features.
The high resolution of MBES allows repeated samples over a feature, which can then be used for the clustering algorithm to identify coherent features and classify them based on morphological characteristics. Due to the shallow water, narrow beam footprint and high ping rate of the system used here, coherent water column features were made up of many “targets” retained from the filtering steps, which allowed for a relatively high number (100) to be used for the clustering algorithms. For deep water features, sonar systems operating at lower frequencies with lower beam resolution or depending on differences in vessel speed, the number of targets that contribute to a feature may be reduced and require different classification thresholds. Reduced numbers of targets may worsen detection limits.
5 Conclusion
This study used a controlled experimental setup to test the ability to detect features at the full extent of MBES WCD, including within regions of the data dominated by receiver array sidelobe noise. Leveraging the use of a regulated seep feature, we are able to reproducibly demonstrate the extraction of targets across the multibeam swath to within 5° of the maximum beam angles. These results provide a foundation for future testing and expansion on natural applications. Preliminary testing by the authors on EM302 and deep water EM2040 natural seeps and shallow-water kelp habitat shows promising results, with further testing currently underway. Although the receiver array sidelobe interference presents a challenge to identify features within the WCD, we have shown here that targets of interest can still be reliably extracted at nearly the full extent of the multibeam fan, including detectable amplitude differences between high and low flow rates independent of vessel speed or receiver array sidelobe noise levels.
Data Availability Statement
The original contributions presented in the study are publicly available. This data can be found here: https://doi.org/10.25919/7ne5-4r28.
Author Contributions
AN conceptualized the project and experimental design and performed the algorithm development, data analysis and primary paper writing. BS organised the field work and data collection and contributed significantly to the paper writing and figures. RK provided project funding for data collection and contributions to the paper background and scope. VL provided project support for the data analysis and contributed significantly to the writing. YL contributed significantly to the data analysis and alternative algorithms to evaluate as comparisons.
Funding
The authors wish to acknowledge financial assistance provided through Australian National Low Emissions Coal Research and Development (ANLEC R&D 7-0816-0305). ANLEC R&D is supported by Low Emission Technology Australia (LETA) and the Australian Government through the Department of Industry, Science, Energy and Resource.
Conflict of Interest
The authors declare that the research was conducted in the absence of any commercial or financial relationships that could be construed as a potential conflict of interest.
Publisher’s Note
All claims expressed in this article are solely those of the authors and do not necessarily represent those of their affiliated organizations, or those of the publisher, the editors and the reviewers. Any product that may be evaluated in this article, or claim that may be made by its manufacturer, is not guaranteed or endorsed by the publisher.
Acknowledgments
The authors wish to thank and acknowledge David Kruse, Phil Vandenbossche and Chris Berry for assistance with data acquisition. The authors wish to thank Alex Schimel for constructive discussions and initial implementation of the CoFFee code. The authors are grateful to Tara Martin for providing helpful comments and constructive discussions during the design of the manuscript.
References
Ainslie, M. A., and Leighton, T. G. (2009). Near Resonant Bubble Acoustic Cross-Section Corrections, Including Examples from Oceanography, Volcanology, and Biomedical Ultrasound. J. Acoust. Soc. Am. 126, 2163–2175. doi:10.1121/1.3180130
Blackford, J., Stahl, H., Bull, J. M., Bergès, B. J. P., Cevatoglu, M., Lichtschlag, A., et al. (2014). Detection and Impacts of Leakage from Sub-Seafloor Deep Geological Carbon Dioxide Storage. Nat. Clim. Change 4, 1011–1016. doi:10.1038/nclimate2381
Blackford, J., Bull, J. M., Cevatoglu, M., Connelly, D., Hauton, C., James, R. H., et al. (2015). Marine Baseline and Monitoring Strategies for Carbon Dioxide Capture and Storage (CCS). Int. J. Greenh. Gas Control 38, 221–229. doi:10.1016/j.ijggc.2014.10.004
Bussmann, I., and Suess, E. (1998). Groundwater Seepage in Eckernforde Bay (Western Baltic Sea): Effect on Methane and Salinity Distribution of the Water Column. Cont. Shelf Res. 18, 1795–1806. doi:10.1016/s0278-4343(98)00058-2
Cathles, L. M., Su, Z., and Chen, D. (2010). The Physics of Gas Chimney and Pockmark Formation, with Implications for Assessment of Seafloor Hazards and Gas Sequestration. Mar. Pet. Geol. 27 (1), 82–91. doi:10.1016/j.marpetgeo.2009.09.010
Chadwick, W. W., Merle, S. G., Buck, N. J., Lavelle, J. W., Resing, J. A., and Ferrini, V. (2014). Imaging of CO2 Bubble Plumes above an Erupting Submarine Volcano, NW Rota-1, Mariana Arc. Geochem. Geophys. Geosyst. 15, 4325–4342. doi:10.1002/2014GC005543
Clarke, J. E. H. (2006). Applications of Multibeam Water Column Imaging for Hydrographic Survey. Hydrogr. J. 120, 3–15.
Clay, C. S., and Medwin, H. (1977). Acoustical Oceanography: Principles and Applications. New York, NY: Wiley.
CoFFee (2020). An Open-Source Matlab Toolbox for Multibeam Sonar Data Processing. Available online: https://github.com/alexschimel/CoFFee (accessed on October 14, 2020).
Colbo, K., Ross, T., Brown, C., and Weber, T. (2014). A Review of Oceanographic Applications of Water Column Data from Multibeam Echosounders. Estuar. Coast. Shelf Sci. 145, 41–56. doi:10.1016/j.ecss.2014.04.002
de Moustier, C., and Kleinrock, M. C. (1986). Bathymetric Artifacts in Sea Beam Data: How to Recognize Them and what Causes Them. J. Geophys. Res. 91 (B3), 3407–3424. doi:10.1029/JB091iB03p03407
de Moustier, C. (2013). “OS-CFAR Detection of Targets in the Water Column and on the Seafloor with a Multibeam Echosounder,” in 2013 OCEANS-San Diego, San Diego, CA, USA, 23-27 Sept. 2013 (IEEE), 1–2.
Dean, M., Blackford, J., Connelly, D., and Hines, R. R. (2020). Insights and Guidance for Offshore CO2 Storage Monitoring Based on the QICS, ETI MMV, and STEMM-CCS Projects. Int. J. Greenh. Gas Control 100, 103120. doi:10.1016/j.ijggc.2020.103120
Dunlop, K. M., Jarvis, T., Benoit-Bird, K. J., Waluk, C. M., Caress, D. W., Thomas, H., et al. (2018). Detection and Characterisation of Deep-Sea Benthopelagic Animals from an Autonomous Underwater Vehicle with a Multibeam Echosounder: A Proof of Concept and Description of Data-Processing Methods. Deep Sea Res. Part I Oceanogr. Res. Pap. 134, 64–79. doi:10.1016/j.dsr.2018.01.006
Dupré, S., Berger, L., Le Bouffant, N., Scalabrin, C., and Bourillet, J.-F. (2014). Fluid Emissions at the Aquitaine Shelf (Bay of Biscay, France): A Biogenic Origin or the Expression of Hydrocarbon Leakage? Cont. Shelf Res. 88, 24–33. doi:10.1016/j.csr.2014.07.004
Dupré, S., Scalabrin, C., Grall, C., Augustin, J. M., Henry, P., Şngör, A. C., et al. (2015). Tectonic And Sedimentary Controls On Widespread Gas Emissions In The Sea Of Marmara: Results From Systematic, Shipborne Multibeam Echo Sounder Water Column Imaging J. Geophys. Res. Solid Earth 120 (5), 2891–2912. doi:10.1002/2014JB011617
Greinert, J., and Nützel, B. (2004). Hydroacoustic Experiments to Establish a Method for the Determination of Methane Bubble Fluxes at Cold Seeps. Geo-Marine Lett. 24, 75–85. doi:10.1007/s00367-003-0165-7
Greinert, J., McGinnis, D. F., Naudts, L., Linke, P., and De Batist, M. (2010). Atmospheric Methane Flux from Bubbling Seeps: Spatially Extrapolated Quantification from a Black Sea Shelf Area. J. Geophys. Res. 115, C01002. doi:10.1029/2009JC005381
Greinert, J. (2008). Monitoring Temporal Variability of Bubble Release at Seeps: The Hydroacoustic Swath System GasQuant. J. Geophys. Res. Oceans. 113, C07048. doi:10.1029/2007jc004704
Gurshin, C. W. D., Jech, J. M., Howell, W. H., Weber, T. C., and Mayer, L. A. (2009). Measurements of Acoustic Backscatter and Density of Captive Atlantic Cod with Synchronized 300-kHz Multibeam and 120-kHz Split-Beam Echosounders. ICES J. Mar. Sci. 66, 1303–1309. doi:10.1093/icesjms/fsp052
Harkin, T., Filby, I., Sick, H., Manderson, D., and Ashton, R. (2017). Development of a CO2 Specification for a CCS Hub Network. Energy Procedia 114, 6708–6720. doi:10.1016/j.egypro.2017.03.1801
Innangi, S., Bonanno, A., Tonielli, R., Gerlotto, F., Innangi, M., and Mazzola, S. (2016). High Resolution 3-D Shapes of Fish Schools: A New Method to Use the Water Column Backscatter from Hydrographic MultiBeam Echo Sounders. Appl. Acoust. 111, 148–160. doi:10.1016/j.apacoust.2016.04.017
Judd, A., Davies, G., Wilson, J., Holmes, R., Baron, G., and Bryden, I. (1997). Contributions to Atmospheric Methane by Natural Seepages on the UK Continental Shelf. Mar. Geol. 137, 165–189. doi:10.1016/S0025-3227(96)00087-4
Kongsberg (2018). Kongsberg EM Series Multibeam Echo Sounders Datagram Formats 850-160692/W. Kongsberg, Norway: Kongsberg, 183.
Kruss, A., Fantina, M., Marco, S., Ferrarin, C., and Giacomo, M. G. (2015). “Assessment of Submerged Aquatic Vegetation Abundance Using Multibeam Sonar in Very Shallow and Dynamic Environment. The Lagoon of Venice (Italy) Case Study,” in 2015 IEEE/OES Acoustics in Underwater Geosciences Symposium (RIO Acoustics), Rio de Janeiro, Brazil, 1–7. doi:10.1109/RIOAcoustics.2015.7473596
Liu, H., Yang, F., Zheng, S., Li, Q., Li, D., and Zhu, H. (2019). A Method of Sidelobe Effect Suppression for Multibeam Water Column Images Based on an Adaptive Soft Threshold. Appl. Acoust. 148, 467–475. doi:10.1016/j.apacoust.2019.01.006
Lønmo, T. I. B., Austeng, A., and Hansen, R. E. (2020). Improving Swath Sonar Water Column Imagery and Bathymetry with Adaptive Beamforming. IEEE J. Ocean. Eng. 45, 1552–1563. doi:10.1109/JOE.2019.2926863
Lurton, X. (2016). Modelling of the Sound Field Radiated by Multibeam Echosounders for Acoustical Impact Assessment. Appl. Acoust. 101, 201–221. doi:10.1016/j.apacoust.2015.07.012
Marques, C. R. V. (2012). Automatic Mid-Water Target Detection Using Multibeam Water Column. Fredericton, NB: Univ. of New Brunswick. M.Sc.E. thesis.
Mayer, L., Li, Y., and Melvin, G. (2002). 3D Visualization for Pelagic Fisheries Research and Assessment. ICES J. Mar. Sci. 59, 216–225. doi:10.1006/jmsc.2001.1125
McCartney, B. S., and Bary, B. M. (1965). Echo-sounding on Probable Gas Bubbles from the Bottom of Saanich Inlet, British Columbia. Deep Sea Res. Oceanogr. Abstr. 12, 285–294. doi:10.1016/0011-7471(65)90002-1
McGonigle, C., Grabowski, J. H., Brown, C. J., Weber, T. C., and Quinn, R. (2011). Detection of Deep Water Benthic Macroalgae Using Image-Based Classification Techniques on Multibeam Backscatter at Cashes Ledge, Gulf of Maine, USA. Estuar. Coast. Shelf Sci. 91, 87–101. doi:10.1016/j.ecss.2010.10.016
Michaud, F., Proust, J.-N., Dano, A., Collot, J.-Y., Guiyeligou, G. D., Hernández Salazar, M. J., et al. (2016). Flare-Shaped Acoustic Anomalies in the Water Column along the Ecuadorian Margin: Relationship with Active Tectonics and Gas Hydrates. Pure Appl. Geophys. 173, 3291–3303. doi:10.1007/s00024-015-1230-7
Nakamura, K., Kawagucci, S., Kitada, K., Kumagai, H., Takai, K., and Okino, K. (2015). Water Column Imaging with Multibeam Echo-Sounding in the Mid-Okinawa Trough: Implications for Distribution of Deep-Sea Hydrothermal Vent Sites and the Cause of Acoustic Water Column Anomaly. Geochem. J. 49, 579–596. doi:10.2343/geochemj.2.0387
Nau, A. W., Lucieer, V., and Schimel, A. C. G. (2018). “Modeling the Along-Track Sidelobe Interference Artifact in Multibeam Sonar Water-Column Data,” in Proceedings of the OCEANS 2018 Charleston, Charleston, SC, USA, 22–25 October 2018. doi:10.1109/OCEANS.2018.8604866
Ona, E., and Mitson, R. B. (1996). Acoustic Sampling and Signal Processing Near the Seabed: The Deadzone Revisited. ICES J. Mar. Sci. 53, 677–690. doi:10.1006/jmsc.1996.0087
Ostrovsky, I. (2009). Hydroacoustic Assessment of Fish Abundance in the Presence of Gas Bubbles. Limnol. Oceanogr. Methods 7, 309–318. doi:10.4319/lom.2009.7.309
Philip, B. T., Denny, A. R., Solomon, E. A., and Kelley, D. S. (2016). Time-series Measurements of Bubble Plume Variability and Water Column Methane Distribution above Southern Hydrate Ridge, Oregon. Geochem. Geophys. Geosyst. 17, 1182–1196. doi:10.1002/2016GC006250
Richardson, M. D., and Davis, A. M. (1998). Modeling Methane-Rich Sediments of Eckernforde Bay. Cont. Shelf Res. 18, 1671–1688.
Sahling, H., Römer, M., Pape, T., Bergès, B., dos Santos Fereirra, C., Boelmann, J., et al. (2014). Gas Emissions at the Continental Margin West of Svalbard: Mapping, Sampling, and Quantification. Biogeosciences 11, 6029–6046. doi:10.5194/bg-11-6029-2014
Scandella, B. P., Pillsbury, L., Weber, T., Ruppel, C., Hemond, H. F., and Juanes, R. (2016). Ephemerality of Discrete Methane Vents in Lake Sediments. Geophys. Res. Lett. 43, 4374–4381. doi:10.1002/2016GL068668
Schimel, A. C. G., Brown, C. J., and Ierodiaconou, D. (2020). Automated Filtering of Multibeam Water-Column Data to Detect Relative Abundance of Giant Kelp (Macrocystis Pyrifera). Remote Sens. 12, 1371. doi:10.3390/rs12091371
Schneider von Deimling, J., and Papenberg, C. (2012). Technical Note: Detection of Gas Bubble Leakage via Correlation of Water Column Multibeam Images. Ocean. Sci. 8, 175–181. doi:10.5194/os-8-175-2012
Schneider von Deimling, J., Greinert, J., Chapman, N. R., Rabbel, W., and Linke, P. (2010). Acoustic Imaging of Natural Gas Seepage in the North Sea: Sensing Bubbles Controlled by Variable Currents. Limnol. Oceanogr. Methods 8, 155–171. doi:10.4319/lom.2010.8.155
Scoulding, B., Kloser, R., and Gastauer, S. (2020). Evaluation of Unmanned Surface Vehicle Acoustics for Gas Seep Detection in Shallow Coastal Waters. Int. J. Greenh. Gas Control 102, 103158. doi:10.1016/j.ijggc.2020.103158
Simmonds, J. E., and MacLennan, D. N. (2005). Fisheries Acoustics: Theory and Practice. 2nd ed. Oxford, UK: Blackwell Science.
Skarke, A., Ruppel, C., Kodis, M., Brothers, D., and Lobecker, E. (2014). Widespread Methane Leakage from the Sea Floor on the Northern US Atlantic Margin. Nat. Geosci. 7, 657–661. doi:10.1038/ngeo2232
Spain, E., Lamarche, G., Lucieer, V., Watson, S. J., Ladroit, Y., Heffron, E., et al. (2022). Acoustic Predictors of Active Fluid Expulsion from a Hydrothermal Vent Field, Offshore Taupō Volcanic Zone, New Zealand. Front. Earth Sci. 9, 785396. doi:10.3389/feart.2021.785396
Tang, Q., Liu, X., Ji, X., Li, J., Chen, Y., and Lu, B. (2021). Using Seabed Acoustic Imagery to Characterize and Classify Seabed Sediment Types in the Pockmark Area of the North Yellow Sea, China. Appl. Acoust. 174, 107748. doi:10.1016/j.apacoust.2020.107748
Trenkel, V. M., Mazauric, V., and Berger, L. (2008). The New Fisheries Multibeam Echosounder ME70: Description and Expected Contribution to Fisheries Research. ICES J. Mar. Sci. 65 (4), 645–655. doi:10.1093/icesjms/fsn051
Urban, P., Köser, K., and Greinert, J. (2016). Processing of Multibeam Water Column Image Data for Automated Bubble/seep Detection and Repeated Mapping. Limnol. Oceanogr. Methods 15, 1–21. doi:10.1002/lom3.10138
Wang, J., Li, H., Ma, J., Chen, B., Xing, T., and Zhao, H. (2020). Fast Double Selectivity Index-CFAR Detection Method for the Multi-Beam Echo Sounder. Mar. Geod. 43 (1), 44–62. doi:10.1080/01490419.2019.1692265
Weber, T. C., Mayer, L., Jerram, K., Beaudoin, J., Rzhanov, Y., and Lovalvo, D. (2014). Acoustic Estimates of Methane Gas Flux from the Seabed in a 6000 Km2 Region in the Northern Gulf of Mexico. Geochem. Geophys. Geosyst. 15, 1911–1925. doi:10.1002/2014GC005271
Weber, T. C. (2021). A CFAR Detection Approach for Identifying Gas Bubble Seeps with Multibeam Echo Sounders. IEEE J. Ocean. Eng. 46 (4), 1346–1355. doi:10.1109/JOE.2021.3056910
Wilson, D. S., Leifer, I., and Maillard, E. (2015). Megaplume Bubble Process Visualization by 3D Multibeam Sonar Mapping. Mar. Pet. Geol. 68, 753–765. doi:10.1016/j.marpetgeo.2015.07.007
Zhao, J., Meng, J., Zhang, H., and Wang, S. (2017). Comprehensive Detection of Gas Plumes from Multibeam Water Column Images with Minimisation of Noise Interferences. Sensors 17, 2755. doi:10.3390/s17122755
Keywords: multibeam echosounder, water column data, sidelobe interference, gas seep detection, automated processing
Citation: Nau AW, Scoulding B, Kloser RJ, Ladroit Y and Lucieer V (2022) Extended Detection of Shallow Water Gas Seeps From Multibeam Echosounder Water Column Data. Front. Remote Sens. 3:839417. doi: 10.3389/frsen.2022.839417
Received: 19 December 2021; Accepted: 26 May 2022;
Published: 05 July 2022.
Edited by:
DelWayne Roger Bohnenstiehl, North Carolina State University, United StatesReviewed by:
Simone Cosoli, University of Western Australia, AustraliaIra Leifer, University of California, Santa Barbara, United States
Copyright © 2022 Nau, Scoulding, Kloser, Ladroit and Lucieer. This is an open-access article distributed under the terms of the Creative Commons Attribution License (CC BY). The use, distribution or reproduction in other forums is permitted, provided the original author(s) and the copyright owner(s) are credited and that the original publication in this journal is cited, in accordance with accepted academic practice. No use, distribution or reproduction is permitted which does not comply with these terms.
*Correspondence: Amy W. Nau, YW15Lm5hdUBjc2lyby5hdQ==