
95% of researchers rate our articles as excellent or good
Learn more about the work of our research integrity team to safeguard the quality of each article we publish.
Find out more
ORIGINAL RESEARCH article
Front. Remote Sens. , 13 April 2022
Sec. Atmospheric Remote Sensing
Volume 3 - 2022 | https://doi.org/10.3389/frsen.2022.836262
This article is part of the Research Topic Remote Sensing of Cloud, Aerosols, and Radiation from Satellites View all 10 articles
 Sabrina N. Thompson1
 Bastiaan van Diedenhoven2*
 Peter R. Colarco1
 Patricia Castellanos1
 Eric Lian3
 J. Vanderlei Martins4
Per the 2017–2027 Decadal Survey for Earth Science and Applications from Space, many resources are being dedicated to identifying the most cost-effective and appropriate space-based approaches to aid in answering important questions related to the roles of aerosols, clouds, convection, and precipitation within the climate system. This includes developing advanced space-based multi-angle polarimetric imagers for observing aerosols and clouds. The information content with respect to aerosol and cloud properties of such instruments partly depends on the observed range of scattering angles. Factors influencing the sampled scattering angle range include orbit geometry, solar, and viewing angle geometry and swath width. The focus of this research is to gain better insight into how each of these factors influence the scattering angle range sampled by different polarimeter platforms. Based on calculations of example precessing and sun-synchronous orbits, we conclude that the maximum observed scattering angles vary primarily with local equator crossing time (LCT) and location across the swath, while the minimum observed scattering angles vary primarily with LCT and latitude. The altitude and inclination of a precessing orbit determines the length of cycles occurring in LCT and thus in the scattering angle sampling statistics. For a nominal polarimeter with a 57° swath width in an orbit with 65.5° inclination, scattering angle ranges that are suitable for aerosol and cloud remote sensing are sampled somewhere across the swath at most covered latitudes roughly 54% of days throughout the year. Unfavorable scattering angles are observed on days where the orbit is near the terminator and LCT are early in the morning or late in the evening, when solar zenith angles are generally not suited for remote sensing. Decreasing the instrument’s swath width to 7° primarily decreases the maximum observed scattering angle, and therefore limits the range of crossing times for which a large range of scattering angles are observed. In addition, the fraction of days throughout the year with favorable scattering angles decreases to roughly 37%. These calculations will aid in the development of next-generation observing systems using combinations of instrument platforms in different orbits, as well for other missions such as those using cubesats.
Aerosols play a major role in Earth’s climate. Depending on their type, they can reflect and absorb solar radiation. Furthermore, they provide the basis for cloud formation (Twomey, 1974). Increased aerosol loading may increase cloud brightness, thus reflecting more solar energy away from Earth to cool the planet. In addition, aerosols can suppress precipitation formation and thereby increase cloud lifetime (Albrecht, 1989). On the other hand, aerosols can also prevent cloud formation by absorbing sunlight and heating the surrounding environment (Ackerman et al., 2000). It is because of this complex mix of indirect and direct effects that quantifying aerosol radiative forcing has been deemed one of the most important, yet challenging, tasks in addressing uncertainty in our understanding of how they affect the climate (IPCC, 2021). Aerosol-cloud interactions contribute the largest uncertainties to estimates and interpretations of the global radiation budget.
The 2017–2027 Decadal Survey for Earth Science and Applications from Space (ESAS 2017) (National Academies of Sciences, Engineering, and Medicine, 2018) generated consensus recommendations from the Earth science community and identified several high priority science objectives, one of which is reducing aerosol radiative forcing uncertainty. Addressing such uncertainty requires improving our understanding of the processes associated with aerosol, clouds, and their interactions. Therefore, in response to NASA’s Designated Observables Guidance for Multi-Center Study Plans released in June 2018, six NASA centers partnered with universities, and the private-sector to conduct the Aerosol (A) and Cloud, Convection, and Precipitation (CCP) Pre-formulation Study (A-CCP), which lead to the definition of an Atmosphere Observing System (AOS) to address science objectives related to aerosols, clouds, convection, precipitation and their interactions.
The orbital component of AOS includes instruments in both precessing and sun-synchronous orbits. Precessing orbits (i.e., with a shifting local equator crossing time) offer unique opportunities to observe the diurnal variation in clouds and aerosols at monthly to seasonal temporal scales. Boundary layer height change and convection are examples of processes that change throughout the day and can be captured with such an orbit. However, since such an orbit has a low inclination angle by definition, the latitudinal coverage is limited. The sun-synchronous orbit (also often referred to as “polar orbit”) offers coverage at essentially all latitudes and daily sampling at a fixed local time. Such an orbit offers the possibility of extending the record of polar observations, such as those from the Afternoon Constellation or A-train (Stephens et al., 2002).
In 1996, the French space agency (CNES) launched the imaging Polarization and Directionality of the Earth Reflectances (POLDER) instrument on the Advanced Earth Observing Satellite (ADEOS-1). After the premature end of the ADEOS-1 mission in 1997 due to communication failure, POLDER-2 was launched on-board ADEOS-II in 2002 to continue recording the polarimetric observations, although this mission ended prematurely after 10 months as well. In 2009, a third generation POLDER (Polarization and Anisotropy of Reflectances for Atmospheric Sciences coupled with Observations from a Lidar, PARASOL) was launched into the A-train constellation (Fougnie et al., 2007). In 2013, PARASOL was permanently shut down. Since then, other polarimeters in various orbits have been deployed and are planned in the future. Currently, the Hyperangular Rainbow Polarimeter (HARP) instrument is deployed on a 3U CubeSat. It was released in 2020 from the International Space Station (ISS) and is in a precessing orbit with an inclination of about 51.6°. In the near future, the multi-angular, multi-spectral polarimeter, SPEXone, and the 60-view angle, four spectral band, three degree of polarization, Hyperangular Rainbow Polarimeter-2 (HARP-2) will be deployed on the upcoming NASA Plankton, Aerosol, Cloud, and ocean Ecosystem (PACE) mission. These instruments will be launched into a sun synchronous orbit with a local equator crossing time (LCT) near 1:00 p.m (Werdell et al., 2019). Furthermore, the Multi-Viewing-Channel-Polarisation Imager (3MI) will be deployed on the MetOp-Second Generation series, which will have an orbit with an early morning crossing time (Marbach et al., 2015). Together, these polarimeters will be used to advance our understanding of aerosols, clouds and their interactions. For a comprehensive list of past and planned polarimeters we refer to Dubovik et al. (2019).
Multi-angular imaging polarimetric observations provide the angular distribution of scattered atmospheric radiation as well as its polarization state at multiple wavelengths (Dubovik et al., 2019). Polarimetric remote sensing allows to accurately characterize atmospheric aerosols and retrieve microphysical properties of clouds (Mishchenko and Travis, 1997; Mishchenko et al., 2004; Hasekamp and Landgraf, 2007; Alexandrov et al., 2012a,b; van Diedenhoven et al., 2012; Stamnes et al., 2018; Li et al., 2020, 2022). Information content of multi-angle polarimetric measurements for aerosol and cloud remote sensing depends on the minimum, maximum, and range of scattering angles sampled. For instance, with a multi-angle imaging polarimeter, cloud droplet size distribution is determined by observing a rainbow at cloud top, properly called “cloud bow” (Alexandrov et al., 2012a).
Cloud-bow retrievals can be performed when the minimum scattering angles sampled is less than 135° and maximum scattering angles are greater than 155° (Alexandrov et al., 2012a,b). Furthermore, the angular resolution of the observation within that scattering angle region needs to be about 2° or better (Miller et al., 2018). Additionally, for ice-topped clouds, the ice crystal shape and scattering asymmetry parameter can be inferred from polarimetric observation in the scattering angle range between about 120° and 150° (van Diedenhoven et al., 2012; van Diedenhoven et al., 2020). For aerosol retrievals, a recent study by Fougnie et al. (2020) has shown that the scattering angle range distribution has a major impact on retrieval performance. Their results indicate that sampling minimum scattering angles close to 120° and maximum scattering angles greater than 150° allows effective retrieval of fine and coarse mode aerosol properties. Furthermore, five viewing angles are generally sufficient for aerosol polarimetry (Wu et al., 2015). In summary, sampling scattering angles that at least includes the 120°–155° range is generally favorable for both aerosol and cloud polarimetric retrievals.
Fougnie et al. (2020) also discussed the general sampling of scattering angles with multi-angle instruments across instrument swath and with latitude, which they represent in so-called Scattering Angle Range Distribution (ScARD) plots. Their study is focused on platforms in a sun-synchronous orbit with a morning LCT. However, a better understanding of variability in scattering angle statistics for multi-angle instruments in different orbits is imperative for mission planning and design, as well as development of retrieval algorithms for cloud and aerosol properties. In this paper we will analyze scattering angle statistics as a function of solar and view geometry, as well as season, latitude, swath width, and LCT. The occurrences of favorable viewing geometries to perform aerosol and cloud retrievals from different orbit configurations using multi-angle imaging polarimeters are investigated.
The remainder of the paper is divided into three sections. In Section 2, the calculation methods and geometry definitions are discussed. In Section 3, the scattering angle sampling statistics are presented, followed by the conclusions and considerations for mission design, which are summarized in Section 4.
As part of this study, a HARP-like polarimeter (Martins et al., 2018) was modeled in a precessing and a sun-synchronous orbit (SSO). The precessing orbit (PO) was modeled based on the Global Precipitation Measurement (GPM) mission (Neeck et al., 2014) with an inclination of 65.5°. The inclination of the SSO was set to 98.2° and the LCT was set to match the LCT of Aqua in the A-train constellation at 1:30 p m (Parkinson, 2003). They were modeled using orbital parameters derived from Two-Line Element (TLE) data as shown in Table 1. The TLEs were propagated using an Simplified General Perturbations Theory No.4 (SGP4) orbit propagator during the simulation to model a one-year mission period. The SGP4 orbit propagator is one of five mathematical algorithms used for satellite tracking and orbit prediction. It uses TLE sets produced by North American Aerospace Defense Command (NORAD) and NASA to propagate an orbit over a specified time frame, thus calculating the position and velocity (Vallado et al., 2006; Vallado and Crawford, 2008). It considers effect of perturbations due to Earth oblateness, solar and lunar gravitational effects, and orbital decay using an atmospheric drag model. These orbits are used as examples to study the effects of orbital characteristics such as inclination and LCT on the sampling of scattering angles. These two orbits were considered as they were identified as candidates for meeting A-CCP/AOS science objectives.
The HARP-like multi-angle polarimeter used in this study was modeled with 996 cross-track pixels and 10 along-track viewing angles ranging from 56.5° forward to 56.5° aft. The nominal swath width is 57°, leading to a swath width on the surface of about 500-km for both orbits. In addition, the effect of a decreased swath width of 7° (or about 50-km) was investigated. Although the original HARP-2 design includes 60 viewing angles at one wavelength band and 10 at the other three bands (Werdell et al., 2019), here we consider only ten along-track views per observation. However, the statistics are not substantially affected if more viewing angles are considered. Since we are focused on observations of multi-angle polarimeters, only daytime segments of the orbits are considered. Figure 1 shows the daytime segments of the ground tracks for a single orbit of each orbit-configuration (PO and SSO) on 1 January 2006. On this day, the LCT of both the precessing and sun-synchronous orbit is 1:30 p.m. The year 2006 is modeled in our instrument simulator for compatibility with the output from the high spatial resolution GEOS-5 Nature Run (G5NR) model output, also being used in the A-CCP study to provide synthetic observations of nature to define retrieval algorithms and uncertainties (Castellanos et al., 2018).
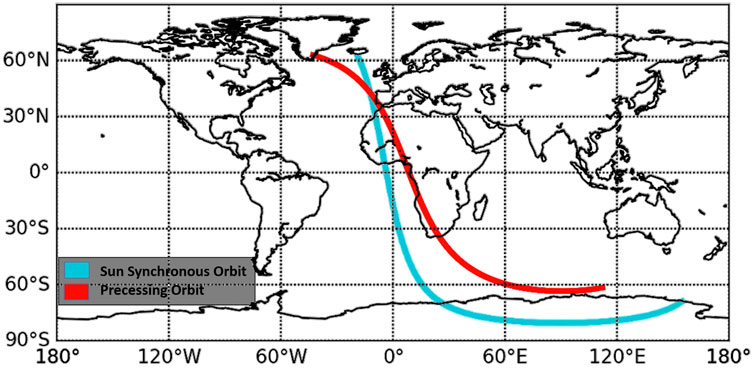
FIGURE 1. The precessing (red) and sun-synchronous (blue) ground track for a single daytime orbit on 1 January 2006. The orbits are based on GPM and Aqua missions, respectively. The daytime segment of the ground tracks are shown here.
The solar and viewing geometry for the ground pixels within the polarimeter swath were determined. Solar calculations are based on equations from Astronomical Algorithms (Meeus, 1991). The view angles of interest from ground-to-instrument locations are view zenith and azimuth angles. The view zenith angle, θv, is defined as the complement of the spacecraft elevation angle β as shown in Figure 2. Using the Law of Sines and basic properties of triangles, θv was determined for each observation ground-pixel. Once the solar and view angles were determined, they were used to compute the scattering angle γ at each observation ground-pixel (target). Figure 3 shows the geometrical relationship between the three angles. The Spherical Law of Cosine was used to determine the scattering angle γ using:
where θs and θv are the solar zenith and view zenith angles, respectively, and ϕ is the relative view azimuth angle.
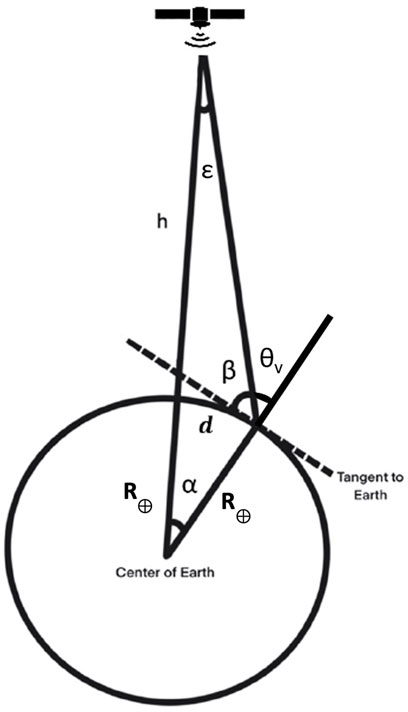
FIGURE 2. Schematic of viewing geometry relative to Earth. The radius of Earth is represented by R⊕, h is the altitude of the spacecraft/sensor, ϵ is the swath half-angle, β is the spacecraft elevation angle, θv is the view zenith angle, α is the angle between the spacecraft position vector and the ground target, and d is the ground coverage of half of the swath [in kilometers].
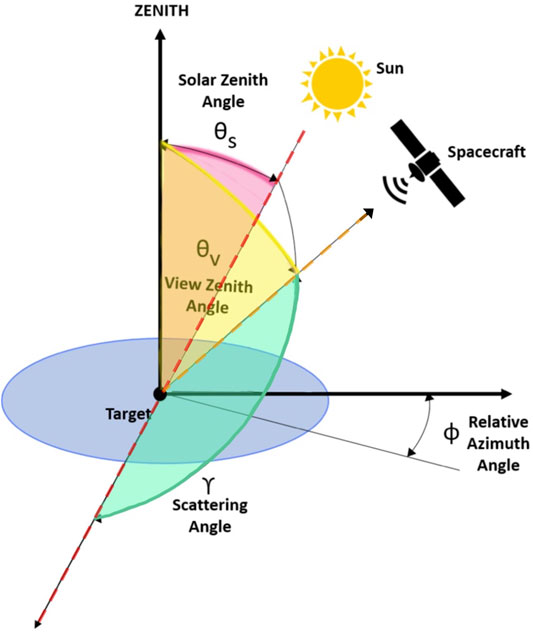
FIGURE 3. Schematic of a given solar and viewing geometry and corresponding scattering angle, defined as the angle between the solar vector, indicated by the red-dashed line and the viewing vector, indicated by the orange dashed line.
The output from the simulation are scattering angles, latitudes, longitudes, and time for the multi-angle polarimeter swath at its’ various viewing angles. These results are then used to investigate scattering angle statistics for each orbit.
The inclination of an orbit plays an important role in remote sensing from space. It determines which parts of the Earth the ground track will cover for a given orbit. For instance, the ground track of the precessing orbit (PO) considered in this study is limited to between 65.5° North and 65.5° South in latitude. The sun-synchronous orbit (SSO), on the other hand, covers higher latitudes owing to its high inclination. This is one of the reasons why SSOs are leveraged for most Earth-observing remote sensing applications. In addition to the ground coverage afforded by choice of orbit inclination, there are other factors that come into play for making Earth-observations from these orbits. For instance, the observing platform on the SSO is confined to a single observing time (mean LCT). Since its orbital inclination is retrograde (greater than 90°), the precession of its orbital plane around Earth’s axis of rotation (nodal precession) is positive and thus, can be designed to match the precession of the Earth’s orbit. This requires specific combinations of the orbital altitude and inclination to reach a desired mean LCT for the SSO. Furthermore, a SSO with a LCT in the afternoon/morning will have its ascending/descending part of the orbit in daytime. In contrast, the PO has an inclination less than 90°, making it a prograde orbit around Earth. The precession is westward and goes against the direction in which the Earth rotates. As a result, the mean LCT of the orbit changes over time. The daylight orbit segment alternates between the descending and ascending parts. This drift in mean LCT may be advantageous for an observing platform on this orbit, as it allows more of the diurnal cycle of atmospheric processes to be captured at seasonal time scales. It is important to note that the rate of precession for an orbit depends not only on inclination, but on the ellipticity of the orbit as well. The two orbits used in this study were circular orbits.
Figure 4 shows LCT and solar zenith angle (SZA) for the PO and SSO for the one-year mission simulation. The data shown in this figure was captured for the day time segment of the orbits. The LCT and SZA for the orbits are depicted in blue and red, respectively. The SSO maintains a constant mean LCT of 1:30 p.m throughout the year, while the SZA varies with season between 20° and 35° when crossing the equator. In contrast to the SSO, both the LCT, and SZA for the PO change in a cyclical pattern throughout the year. For instance, as the orbit moves from south-to-north through the equatorial plane (ascending node) during the day, then shifts to north-to-south (descending node), the LCT changes accordingly. In the beginning of the year, the orbit crosses the descending node during the daytime segment of the orbit. Therefore, on the first day of January, the LCT is roughly 2:00 p.m, then it transitions to an earlier time of roughly 11:00 a.m halfway through the month. By the end of January, the LCT shifts to 6:00 a.m. In the beginning of February, the LCT jumps to 6:00 p.m, as the daytime portion of the orbit switches to the ascending part of the orbit. It then transitions back down to about 6:00 a.m by the end of the month to early March. Then the daytime part of the orbit switches back to descending node and LCT jumps to 6:00 p.m again. This cycle continues throughout the year, with minute-level changes in LCT taking place each day. The SZA changes with the LCT accordingly, while its amplitude varies with season.
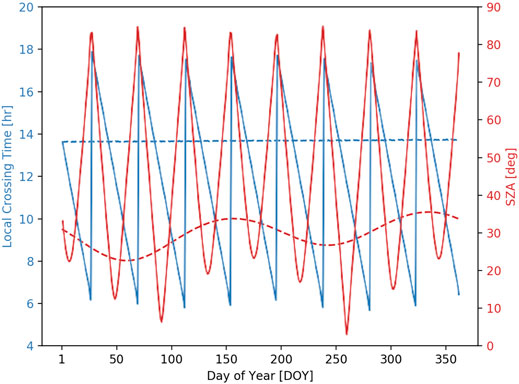
FIGURE 4. The local equator crossing time (blue) and solar zenith angles at the equator (red) as a function of day of year for the precessing (solid) and sun-synchronous orbits (dashed).
The duration of this cycle of LCT (CLCT) for a given orbit around Earth can be approximated based on its orbit characteristics (Capderou, 2014), namely altitude a and inclination i, using:
where R⊕ is the radius of Earth and k is the constant of Sun synchronicity that takes into account the motion of Earth around the Sun, Earth’s mass and so-called J2 perturbations exerted by a non-spherical celestial body on an orbiting spacecraft. For Earth, k is approximately 10.11, meaning at an orbital altitude of 0 km and an inclination of 0°, the nodal precession rate is 10.11 times greater than the angular speed of Earth’s axis in its motion around the Sun. For the PO considered in this study, CLCT is approximately -41.7 days. The negative value of CLCT indicates that the line of nodes moves in the opposite direction in which the Earth rotates. Hence, it takes about 41.7 days to return to the same orbital configuration relative to the Sun (taking into account both the ascending and descending segments). This means that about 8 or 9 of such cycles occur in a given year. Furthermore, the orbital configuration relative to the Sun at the start of a year varies per year, with a repeat cycle of about 4 years. The orbit altitude has a relatively small effect on CLCT. For example, increasing the orbit altitude to 700 km leads to a CLCT of 46.7 days. Decreasing (increasing) the inclination angle reduces (increases) the length of time for the platform to return to the same orbital configuration. For the SSO, CLCT is approximately 1,344 days. It is positive because its orbital inclination is retrograde and, hence, the nodal precession is positive. This large number is a clear indication that the SSO configuration relative to the Sun (and hence, LCT) takes a long time to change. Generally, the slow drift in LCT for polar orbits is compensated via orbital maneuvers so that by design the orbital drift is minimized.
Figures 5A,B show the minimum and maximum scattering angles, respectively, observed by the nominal polarimeter over a single SSO and PO orbit on 1 January 2006. On this day, both orbits have a LCT near 1:30 p.m. Generally, the orbits display very similar patterns of minimum and maximum scattering angles, and therefore, range. The minimum scattering angle strongly varies with SZA, and thus latitude, while its variation across the swath is relatively minor. The minimum scattering angle is generally observed by one of the extreme viewing angles (i.e., ±56.5°). In contrast, Figure 5B shows that the maximum scattering angle observed is mostly determined by the viewing angle across the swath. The maximum scattering angle is generally observed by the viewing angle observing closest to the anti-solar point. That is, for a SZA of 20°, the viewing angle closest to 20° will observe the maximum scattering angle for a given pixel. The location of the maximum scattering angle across the swath is determined by the relative azimuth angle. Consequently, the scattering angle range for any given pixel will be largely determined by both latitude and place across the swath.
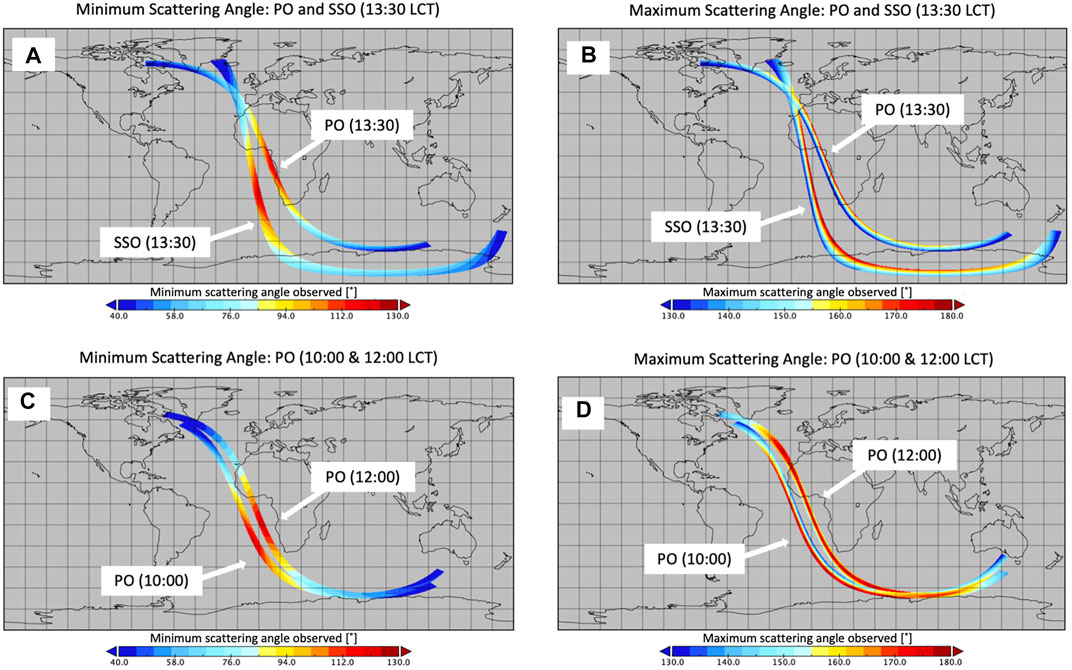
FIGURE 5. Minimum (A,C) and maximum scattering angles (B,D) sampled over orbits of the SSO and PO near 13:30 local crossing time (A,B) and for the PO near 10:00 and 12:00 noon local crossing time (C,D) with the 500-km swath.
Figures 5C,D show the minimum and maximum scattering angles, respectively, sampled by the PO when LCTs are near 10:00 a.m and noon on 15 and 8 January 2006, respectively. It is apparent that the pattern of minimum scattering angle is more to the south for the earlier LCT, as it is mostly determined by SZA. Furthermore, the variation of maximum scattering angle across the swath is seen to be strongly determined by the LCT as the relative azimuth angle changes. For the noon orbit, highest maximum scattering angles are sampled near the middle of the swath, i.e., by the viewing angle closest to nadir. For the morning orbit, the highest maximum scattering angles are sampled at the west side of the swath, while it was seen on the east side of the swath for the afternoon orbit in Figure 5B.
From the results described above, it can be deduced that the minimum scattering angle that can be sampled at a given latitude anywhere within the swath of a multi-angle polarimeter is generally determined by the along-track viewing angle range and not substantially by the swath width. However, the maximum scattering angle that can be sampled anywhere within the swath and is generally determined by the LCT and the swath width. Consequently, the scattering along-track viewing angle range that can be sampled at a given latitude is mostly determined by all three variables, i.e., angular range, LCT and swath width. These results are consistent with the results presented by Fougnie et al. (2020).
For both the PO and SSO, the observing platform sensor and solar angles were simulated for an entire year. Since changes in LCT for the PO and SSO are negligibly small during a single day, one orbit was used to represent all orbits that occurred in a day (see Figure 1). Only daytime segments of the orbits were analyzed since the sun is the light source for making observations with a passive polarimeter.
As shown in Figure 4, for each day of the year, the LCT of the PO changes, while the SSO remains at 1:30 p.m. Scattering angles, γ, at each observation ground-pixel within the instrument swath were computed for each daily-orbit. The maximum and minimum scattering angle observed anywhere within the swath at each latitude was calculated, as well as the scattering angle range.
Figure 6 shows the maximum, minimum, and range of scattering angles, respectively, as a function of latitude and day of year for the SSO. This figure includes the scattering angle statistics for the nominal 57° (500-km) swath width, as well as the narrower, 7° (50-km) swath. There is very little variation in maximum scattering angles throughout the year for the 500-km case. For most latitudes and times, maximum scattering angles greater than 170° are sampled. In the Northern hemisphere during winter, sampled maximum scattering angles are between 160° and 170°.
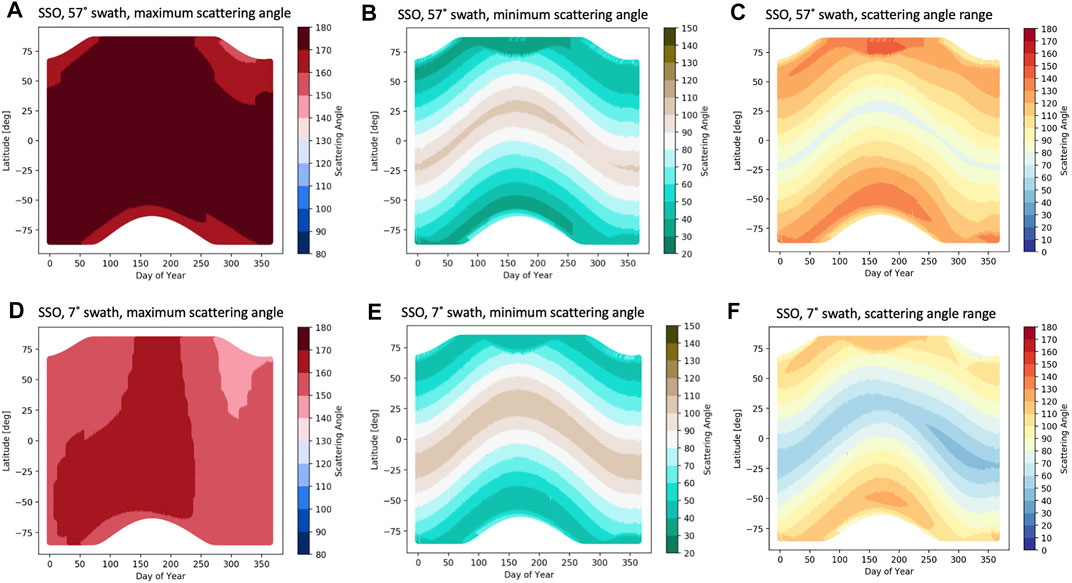
FIGURE 6. Maximum (A,D), minimum (B,E), and range (C,F) of sampled scattering angles for the Sun-Synchronous Orbit (SSO). Results for the 57° (500-km A–C) and 7° (50-km D–F) swath widths are shown on the top and bottom rows, respectively.
As expected from the results discussed in Section 3.1, the minimum scattering angles mostly vary according to solar zenith angle, and thus with latitude. All minimum scattering angles are smaller than 120° and the sampled scattering angle range is mostly determined by the variation of minimum scattering angle. Note that the minimum scattering angles needed for polarimetric cloud remote sensing are 135° and that availability of smaller scattering angles are not beneficial to the retrieval capabilities (Alexandrov et al., 2012a).
For the case with a 7° (50-km) swath width, the sampled maximum scattering angles are generally a bit lower and there is also more variation in maximum scattering angle throughout the year. In the beginning of the year, the larger maximum scattering angles, between 160° and 170°, can be found in the southern hemisphere. Between early May to early September, these larger maximum scattering angles cover all latitudes in daytime. Then for the remainder of the year, the maximum scattering angles decreases by about 10°, with the exception of areas at latitudes above 25° North, which experience about a 20° decrease. The minimum scattering angles for the two swath widths have a similar magnitude and variability throughout the year, as expected. The ranges sampled for the narrow swath are somewhat smaller, mostly caused by the lower maximum scattering angles that are sampled throughout the swath. Note that these temporal patterns are specifically for afternoon sun-synchronous orbits, which an ascending node in daytime, as used here. For morning sun-synchronous orbits, which have cross the descending node in daytime, the patterns are inverted in time, i.e., with lowest maximum scattering angles seen in the Northern hemisphere in the beginning of the year (not shown).
For the PO, Figure 7 shows a very different sampling variation of the maximum, minimum, and range of scattering angles, respectively, as a function of latitude and day of year. As with Figure 6, this figure includes the scattering angle statistics for the 57° and 7° (500-km and 50-km) swath widths. Please note that the y-axis range is different compared to Figure 6, since the PO covers a smaller range of latitudes. Unlike for SSO, in the PO, there is a cyclical variation in minimum and maximum scattering angle and its range throughout the year. This cyclical behavior ties back to the changes in mean LCT and SZAs throughout the year, as shown in Figure 4. As discussed in Section 3, a full cycle takes about 42 days for this particular precessing orbit leading to about 9 similar periods within a year. For the case with a 57° (500-km) swath width, the maximum scattering angles sampled are above 155° for most of the year. However, on days of the year when the LCT is near 6:00 p.m, or 6:00am, the maximum scattering angles drop to below 130°. Note also that solar zenith angles during these periods are generally also not considered suitable for aerosol and cloud remote sensing (Figure 4). Similarly, the minimum scattering angle and the range show a cyclical behavior. Note that the minimum scattering angle is still always smaller than 120°. As a result, favorable viewing conditions for cloud and aerosol remote sensing (with maximum scattering angles greater than or equal to 155° and minimum scattering angles of 120° or lower) occur about 55% of the daytime for the nominal 500-km swath. The frequency of favorable viewing conditions is highest around the equator.
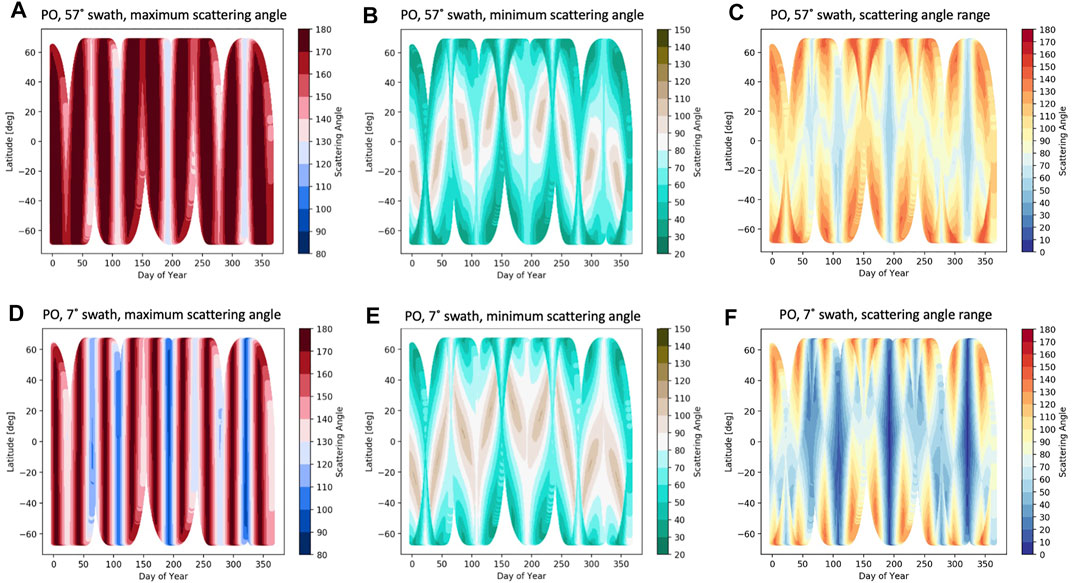
FIGURE 7. Maximum (A,D), minimum (B, E), and range (C, F), of sampled scattering angles for the Precessing Orbit (PO). Results for the 57° (500-km A–C) and 7° (50-km D–F) swath widths are shown on the top and bottom plots, respectively.
For a polarimeter with a narrower swath of 7° (50-km), the periods during which maximum scattering angles above 155° are sampled are substantially shorter, while the periods with low maximum scattering angles (e.g., below 155°) are substantially longer. Furthermore, the minimum scattering angles sampled are slightly increased. Hence, for the narrower 50-km swath, favorable viewing conditions for cloud and aerosol remote sensing occurs less than 40% of the time, thus reducing aerosol and cloud retrieval capabilities compared to the wider-swath instrument.
Results shown in Figure 7 are for a PO with inclination of 65.5°. Lowering the orbit inclination reduces the latitudinal extent of the coverage, while also changing the frequency of the cycles occurring in the scattering angle sampling, according to Eq. 2. Furthermore, to investigate how the frequency of scattering angles suitable for aerosol and cloud polarimetry varies with orbital inclination, Figure 8 shows the frequency of occurrence of observing a maximum scattering angle (X, indicated on the abscissa) as a function of both the instrument swath width and the orbital inclination. This metric is computed as the ratio of, e.g., all points indicated in Figure 7 with maximum scattering angle greater than or equal to X to the total number of observed points shown. It is thus a relative metric of the frequency of observing at scattering angle
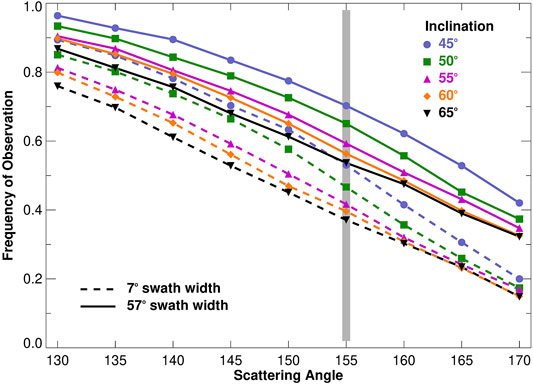
FIGURE 8. Frequency of sampling maximum scattering angles at the equator greater than the values on the abscissa for precessing orbits with various inclinations (indicated by colors and symbols) and for instruments with a 57° (500-km) or 7° (50-km) swath width, indicated by solid and dotted lines, respectively. The 155° scattering angle is indicated with the grey bar for reference.
The beneficial aspects of the wider swath coverage are apparent in Figure 8, where we show at the equator the frequency of days where the maximum scattering angle observed exceeds various thresholds. For the 65° inclination, we find that the instrument observes scattering angles greater 155° for the narrow, 50-km swath, about 37% of the time, increasing to about 54% of the time for the 500 km swath width. The relative frequency of observing higher scattering angles increases as the orbital inclination decreases. For example, at 45° inclination the frequency of observing maximum scattering angle in excess of 155° is about 53% of the time for the 50-km swath and 70% of the time for the 500-km swath. This sensitivity to inclination is because lower inclination orbits are cycling through their precession periods more frequently and so spending a lesser fraction of the time in the unfavorable near-terminator portion of their cycles.
Based on our analysis, it can be seen that scattering angle statistics observed by a multi-angle instrument for a given orbit are largely determined by LCT, latitude and swath width. For a nominal multi-angle instrument with a ±56.5° viewing angle range and a swath width of 57°, we conclude that:
• the maximum scattering angles sampled varies primarily with LCT and location across the swath;
• the minimum scattering angles sampled varies primarily with SZA and thus with LCT, latitude, and day of year;
• scattering angle ranges suitable for aerosol and cloud remote sensing are sampled at least somewhere across the swath at most covered latitudes throughout the year, except for situations of LCT in the early morning or late evening.
Relative to our nominal HARP-like instrument in the two orbits presented in this study, the following instrument and mission design criteria should be taken into consideration:
• decreasing the instrument’s along-track viewing angle range primarily increases the observed minimum scattering angles;
• decreasing the instrument’s swath width primarily decreases the observed maximum scattering angles and therefore the range of equator crossing times for which scattering angle ranges suitable for aerosol and cloud remote sensing are observed;
• changing the inclination of the precessing orbit will change the latitudinal extent of coverage and the frequency of the cycles occurring in the scattering angle sampling, according to Eq. 2. The percentage of viewing conditions favorable for aerosol and cloud polarimetry increases with a decrease of inclination, because of a decreased portion of the overall time spent near the terminator.
In this analysis, we considered the sampling of maximum and minimum scattering angles anywhere in a 57°- or 7°-wide swath. In the case in which the combined observations of a lidar and polarimeter are considered, only a single track within the swath would be taken into account. For example, when considering only the sub-satellite track slightly less favorable results as those seen for the 7°-wide swath are expected. We also note that we assumed the instrument to be pointing straight down. For a sun-synchronous orbit, scattering angle ranges suitable for aerosol and cloud remote sensing are generally sampled in a specific part of the swath depending on LCT. Hence, a narrow-swath instrument could be tilted perpendicular to the flight direction to select the optimal scattering angle sampling. For a precessing orbit, a continuous adjustment of the telescope across-track tilt, e.g., through a gimbal, would be required to select the optimal scattering angle sampling for the varying LCT.
These calculations will aid in decisions for instrument design and choice of orbit for development of next-generation observing systems that include a polarimeter. Furthermore, they may also inform users about the sampling of upcoming multi-angle polarimeters. For example, the SPEXone will be deployed on PACE and, although its swath is relatively narrow at about 8°, it will sample scattering angle ranges suitable for aerosol and cloud remote sensing for most sampled latitudes and days of the year because of PACE’s SSO orbit with a LCT near 1:00 p.m. Furthermore, 3MI will be on the Metop-SG series in a SSO with a LCT near 9:30 a.m, but, as also concluded by Fougnie et al. (2020), will generally sample scattering angle ranges suitable for aerosol and cloud remote sensing because of its relatively wide swath.
The raw data supporting the conclusion of this article will be made available by the authors, without undue reservation.
ST collected the statistical data, performed the comparison and conducted the associated investigations as described in the paper and wrote the initial draft. PC wrote the original code to simulate instrument observations and compute scattering angles for all look angles. EL outfitted the original code to easily manipulate input data and only output data of interest to the study. BvD and PRC provided advisement and contributed to the interpretation of the results in this paper. JVM provided advisement and HARP expertise used for modeling and simulation.
This work was funded through the Internal Research and Development (IRAD) program at NASA Goddard Space Flight Center and by NASA though grant no. 80NSSC20M0224 related to the PACE mission.
The authors declare that the research was conducted in the absence of any commercial or financial relationships that could be construed as a potential conflict of interest.
All claims expressed in this article are solely those of the authors and do not necessarily represent those of their affiliated organizations, or those of the publisher, the editors and the reviewers. Any product that may be evaluated in this article, or claim that may be made by its manufacturer, is not guaranteed or endorsed by the publisher.
The authors would like to thank Dr. Kirk Knobelspiesse, Dr. Robert C. Levy, Dr. Andrew Sayer, Dr. Reed Espinosa, Dr. Edward Nowottnick, Dr. Osku Kemppinen, Dr. Arlindo daSilva, Dr. Xiaoguang Xu, Dr. Lorraine Remer, Dr. Brent McBride, Noah Sienkiewicz, and Dr. Anin Puthukkudy, for insight and constructive feedback throughout the study. Calculations of the orbital viewing geometry were performed at the NASA Center for Climate Science (NCCS) computing center.
Ackerman, A. S., Toon, O. B., Stevens, D. E., Heymsfield, A. J., Ramanathan, V., and Welton, E. J. (2000). Reduction of Tropical Cloudiness by Soot. Science 288, 1042–1047. doi:10.1126/science.288.5468.1042
Albrecht, B. A. (1989). Aerosols, Cloud Microphysics, and Fractional Cloudiness. Science 245, 1227–1230. doi:10.1126/science.245.4923.1227
Alexandrov, M. D., Cairns, B., Emde, C., Ackerman, A. S., and van Diedenhoven, B. (2012a). Accuracy Assessments of Cloud Droplet Size Retrievals from Polarized Reflectance Measurements by the Research Scanning Polarimeter. Remote Sensing Environ. 125, 92–111. doi:10.1016/j.rse.2012.07.012
Alexandrov, M. D., Cairns, B., and Mishchenko, M. I. (2012b). Rainbow Fourier Transform. J. Quantitative Spectrosc. Radiative Transfer 113, 2521–2535. doi:10.1016/j.jqsrt.2012.03.025
Capderou, M. (2014). Orbit Relative to the Sun: Crossing Times and Eclipse. Cham: Springer International Publishing, 433–485. doi:10.1007/978-3-319-03416-4_10
Castellanos, P., da Silva, A., Darmenov, A., Buchard, V., Govindaraju, R., Ciren, P., et al. (2018). A Geostationary Instrument Simulator for Aerosol Observing System Simulation Experiments. Atmosphere 10, 2. doi:10.3390/atmos10010002
Diedenhoven, B., Ackerman, A. S., Fridlind, A. M., Cairns, B., and Riedi, J. (2020). Global Statistics of Ice Microphysical and Optical Properties at Tops of Optically Thick Ice Clouds. J. Geophys. Res. Atmos. 125, e31811. doi:10.1029/2019JD031811
Dubovik, O., Li, Z., Mishchenko, M. I., Tanré, D., Karol, Y., Bojkov, B., et al. (2019). Polarimetric Remote Sensing of Atmospheric Aerosols: Instruments, Methodologies, Results, and Perspectives. J. Quantitative Spectrosc. Radiative Transfer 224, 474–511. doi:10.1016/j.jqsrt.2018.11.024
Fougnie, B., Bracco, G., Lafrance, B., Ruffel, C., Hagolle, O., and Tinel, C. (2007). PARASOL In-Flight Calibration and Performance. Appl. Opt. 46, 5435–5451. doi:10.1364/AO.46.005435
Fougnie, B., Chimot, J., Vázquez-Navarro, M., Marbach, T., and Bojkov, B. (2020). Aerosol Retrieval from Space - How Does Geometry of Acquisition Impact Our Ability to Characterize Aerosol Properties. J. Quantitative Spectrosc. Radiative Transfer 256, 107304. doi:10.1016/j.jqsrt.2020.107304
Hasekamp, O. P., and Landgraf, J. (2007). Retrieval of Aerosol Properties over Land Surfaces: Capabilities of Multiple-Viewing-Angle Intensity and Polarization Measurements. Appl. Opt. 46, 3332–3344. doi:10.1364/AO.46.003332
IPCC (2021). Climate Change 2021: The Physical Science Basis. Contribution of Working Group I to the Sixth Assessment Report of the Intergovernmental Panel on Climate Change. Cambridge: Cambridge University Press.
Li, L., Che, H., Derimian, Y., Dubovik, O., Luan, Q., Li, Q., et al. (2020). Climatology of fine and Coarse Mode Aerosol Optical Thickness over East and South Asia Derived from Polder/parasol Satellite. J. Geophys. Res. Atmospheres 125, e2020JD032665. doi:10.1029/2020JD032665
Li, L., Che, H., Zhang, X., Chen, C., Chen, X., Gui, K., et al. (2022). A Satellite-Measured View of Aerosol Component Content and Optical Property in a Haze-Polluted Case over north china plain. Atmos. Res. 266, 105958. doi:10.1016/j.atmosres.2021.105958
Marbach, T., Riedi, J., Lacan, A., and Schlüssel, P. (2015). “The 3MI mission: Multi-Viewing-Channel-Polarisation Imager of the EUMETSAT Polar System: Second Generation (EPS-SG) Dedicated to Aerosol and Cloud Monitoring,” in Polarization Science and Remote Sensing VII. Vol. 9613 of Society of Photo-Optical Instrumentation Engineers (SPIE) Conference Series. Editors J. A. Shaw, and D. A. LeMaster, 961310. doi:10.1117/12.2186978
Martins, J. V., Fernandez-Borda, R., McBride, B., Remer, L., and Barbosa, H. M. J. (2018). “The Harp Hype Ran Gular Imaging Polarimeter and the Need for Small Satellite Payloads with High Science Payoff for Earth Science Remote Sensing,” in IGARSS 2018 - 2018 IEEE International Geoscience and Remote Sensing Symposium, 6304–6307. doi:10.1109/IGARSS.2018.8518823
Miller, D. J., Zhang, Z., Platnick, S., Ackerman, A. S., Werner, F., Cornet, C., et al. (2018). Comparisons of Bispectral and Polarimetric Retrievals of marine Boundary Layer Cloud Microphysics: Case Studies Using a LES-Satellite Retrieval Simulator. Atmos. Meas. Tech. 11, 3689–3715. doi:10.5194/amt-11-3689-2018
Mishchenko, M. I., Cairns, B., Hansen, J. E., Travis, L. D., Burg, R., Kaufman, Y. J., et al. (2004). Monitoring of Aerosol Forcing of Climate from Space: Analysis of Measurement Requirements. J. Quantitative Spectrosc. Radiative Transfer 88, 149–161. doi:10.1016/j.jqsrt.2004.03.030
Mishchenko, M. I., and Travis, L. D. (1997). Satellite Retrieval of Aerosol Properties over the Ocean Using Polarization as Well as Intensity of Reflected Sunlight. J. Geophys. Res. 102, 16989–17013. doi:10.1029/96JD02425
National Academies of Sciences, Engineering, and Medicine (2018). Thriving on Our Changing Planet: A Decadal Strategy for Earth Observation from Space. Washington, DC: The National Academies Press. doi:10.17226/24938
Neeck, S. P., Kakar, R. K., Azarbarzin, A. A., and Hou, A. Y. (2014). “Global Precipitation Measurement (GPM) Launch, Commissioning, and Early Operations,” in Sensors, Systems, and Next-Generation Satellites XVIII. International Society for Optics and Photonics (SPIE), Vol. 9241. Editors R. Meynart, S. P. Neeck, and H. Shimoda, 31–44. doi:10.1117/12.2069868
Parkinson, C. L. (2003). Aqua: an Earth-Observing Satellite mission to Examine Water and Other Climate Variables. IEEE Trans. Geosci. Remote Sensing 41, 173–183. doi:10.1109/TGRS.2002.808319
Stamnes, S., Hostetler, C., Ferrare, R., Burton, S., Liu, X., Hair, J., et al. (2018). Simultaneous Polarimeter Retrievals of Microphysical Aerosol and Ocean Color Parameters from the "MAPP" Algorithm with Comparison to High-Spectral-Resolution Lidar Aerosol and Ocean Products. Appl. Opt. 57, 2394–2413. doi:10.1364/AO.57.002394
Stephens, G. L., Vane, D. G., Boain, R. J., Mace, G. G., Sassen, K., Wang, Z., et al. (2002). The Cloudsat Mission and the A-Train. Bull. Amer. Meteorol. Soc. 83, 1771–1790. doi:10.1175/BAMS-83-12-1771
Twomey, S. (1974). Pollution and the Planetary Albedo. Atmos. Environ. (1967) 8, 1251–1256. doi:10.1016/0004-6981(74)90004-3
Vallado, D., Crawford, P., Hujsak, R., and Kelso, T. S. (2006). Revisiting Spacetrack Report #3. doi:10.2514/6.2006-6753
van Diedenhoven, B., Cairns, B., Geogdzhayev, I. V., Fridlind, A. M., Ackerman, A. S., Yang, P., et al. (2012). Remote Sensing of Ice crystal Asymmetry Parameter Using Multi-Directional Polarization Measurements - Part 1: Methodology and Evaluation with Simulated Measurements. Atmos. Meas. Tech. 5, 2361–2374. doi:10.5194/amt-5-2361-2012
Werdell, P. J., Behrenfeld, M. J., Bontempi, P. S., Boss, E., Cairns, B., Davis, G. T., et al. (2019). The Plankton, Aerosol, Cloud, Ocean Ecosystem Mission: Status, Science, Advances. Bull. Am. Meteorol. Soc. 100, 1775–1794. doi:10.1175/BAMS-D-18-0056.1
Keywords: clouds, aerosols, satellite, orbits, polarimetry (1278)
Citation: Thompson SN, van Diedenhoven B, Colarco PR, Castellanos P, Lian E and Martins JV (2022) Analysis of Scattering Angle Sampling by Multi-Angle Imaging Polarimeters for Different Orbit Geometries. Front. Remote Sens. 3:836262. doi: 10.3389/frsen.2022.836262
Received: 15 December 2021; Accepted: 14 March 2022;
Published: 13 April 2022.
Edited by:
Jens Redemann, University of Oklahoma, United StatesReviewed by:
Lei Li, Chinese Academy of Meteorological Sciences, ChinaCopyright © 2022 Thompson, van Diedenhoven, Colarco, Castellanos, Lian and Martins. This is an open-access article distributed under the terms of the Creative Commons Attribution License (CC BY). The use, distribution or reproduction in other forums is permitted, provided the original author(s) and the copyright owner(s) are credited and that the original publication in this journal is cited, in accordance with accepted academic practice. No use, distribution or reproduction is permitted which does not comply with these terms.
*Correspondence: Bastiaan van Diedenhoven, Yi52YW4uZGllZGVuaG92ZW5Ac3Jvbi5ubA==
Disclaimer: All claims expressed in this article are solely those of the authors and do not necessarily represent those of their affiliated organizations, or those of the publisher, the editors and the reviewers. Any product that may be evaluated in this article or claim that may be made by its manufacturer is not guaranteed or endorsed by the publisher.
Research integrity at Frontiers

Learn more about the work of our research integrity team to safeguard the quality of each article we publish.