- 1Department of Soil and Crop Sciences, Texas A&M University, College Station, TX, United States
- 2School of Plant and Environmental Sciences, Virginia Tech, Blacksburg, VA, United States
- 3School of Agricultural Sciences, Middle Tennessee State University, Murfreesboro, TN, United States
Quantifying carbon uptake or gross primary production (GPP) from agroecosystems is important for understanding the spatial and temporal dynamics of carbon fixation by crops. The availability of high-resolution remote sensing data can significantly improve GPP estimation of small-scale agricultural fields. Multispectral satellite data with 3-m spatial resolution and frequent global coverage are available from the PlanetScope network of satellites. However, this data remains largely unexplored for studying the carbon dynamics of agroecosystems. The overarching goal of this study was to develop a simple empirical method for quantifying the GPP of dryland maize (Zea mays L.) using remotely sensed vegetation indices along with in-situ measurements of photosynthetically active radiation and leaf area index by linking it with carbon uptake data from an eddy covariance flux tower. Four vegetation indices were investigated: the normalized difference vegetation index (NDVI), the soil adjusted vegetation index (SAVI), the weighted difference vegetation index (WDVI), and the two-band enhanced vegetation index (EVI2). This study was conducted over a three-year period from 2017 to 2019 in East-Central Texas. A total of 12 GPP prediction models were developed using individual yearly data and were used for predicting GPP of the other 2 years. Predicted maize GPP values were then compared against tower-based GPP. The NDVI models were the least successful in predicting GPP and had the highest root mean square error (average: 10.1 3 gC m−2; maximum: 26.3 gC m−2). Models based on SAVI performed especially well with error ranging from 0.05 to 0.94 gC m−2. The slope of the regression between SAVI-based estimated GPP and measured GPP was not different from 1.0 in all combinations of years. The success of the SAVI-based GPP models for predicting dryland maize carbon uptake indicates that it was the least affected vegetation index by changing soil background condition in this row cropping system.
Introduction
Photosynthetic carbon dioxide (CO2) uptake and respiration are important mechanisms that determine the carbon source or sink status of agroecosystems (Mowrer et al., 2020). Developing crop management practices that promote carbon sequestration are pivotal as modern agricultural production methods have contributed substantially to energy consumption and greenhouse gas (GHG) emissions around the globe (Weinheimer et al., 2010; Bai et al., 2019). Gross primary production (GPP), the total CO2 captured by an ecosystem through photosynthesis, is the largest terrestrial carbon sink (Menefee et al., 2020). A portion of GPP is consumed during plant respiration and the remainder is stored as net primary production (NPP) or biomass (Suyker et al., 2004). As GPP is closely associated with photosynthetic activity, monitoring GPP can assist in determining the vulnerability of ecosystems to changes in climate, land use, and human activity.
In agroecosystems, GPP is closely correlated with crop biomass production. A large portion of the crop biomass is usually removed from the field during harvest. The remaining plant biomass in the field is tilled back into the soil or left on the surface. Tillage practices can cause substantial soil disturbances, which in turn increases organic matter decomposition and respiration (Govindasamy et al., 2020; Zapata et al., 2021). Respiratory loses of carbon coupled with the removal of harvestable biomass can lead to steady decline in soil carbon stocks over time in agricultural lands. Because of the contributory effects of both environmental factors and management practices on carbon dynamics, accurately estimating GPP of agricultural systems is essential for understanding how cropping systems interact with atmospheric carbon pools, both as sink and source of CO2 emissions.
Remote sensing using satellite, aerial, and ground-based platforms has improved our ability to study the impact of human activities on ecosystem development and processes, including plant growth analysis and carbon cycling (Padilla et al., 2012; Rajan et al., 2014; Murray et al., 2016; Shafian et al., 2018). Integrating satellite and aerial images with data analytic algorithms has greatly improved over the past few decades and is now commonly used in many agroecological studies. Satellite remote sensing has several benefits compared to ground-based measurements. The main advantage is that satellite data can cover larger areas compared to ground-based sensors and is a reliable and easy-to-access data source for assessing remote locations. Various studies have investigated the capacity of using satellite GPP estimation in determining the fate of carbon across different ecosystems at the regional and global scales (Potter, 1999; Rambal et al., 2014). In agricultural settings, remotely sensed carbon uptake estimation can also improve yield forecasts as GPP is tightly linked to crop biomass production, such as herbage, grain, or fiber biomass (Alganci et al., 2014; He et al., 2018).
Over the past few decades, multiple methods of modeling GPP using remote sensing data have been developed, including the Vegetation Photosynthesis Model (VPM), Greenness and Radiation (GR), and Temperature and Greenness (TG) models (Wu et al., 2014; Jin et al., 2015; Dong et al., 2017; Jiang et al., 2021). Many of these methods use a statistical relationship between a vegetation index (VI) estimated from remotely sensed data and GPP to estimate gross carbon uptake with minimal additional inputs. Other methods, like VPM, use a light-use efficiency (LUE) based approach where GPP is related to the product of the fraction of absorbed photosynthetically active radiation (fAPAR) and LUE of the plant being studied. This type of model was originally proposed by Monteith (1977) and has since been widely used and modified to suit the needs of GPP modeling efforts (He et al., 2018). The most common modification of this approach is to replace fAPAR or the efficiency term with a VI estimated from remote sensing data. Multiple studies have shown that LUE and VIs are well correlated and that VI can replace LUE components in modeling GPP (Wu et al., 2010; Verma et al., 2015).
The advent of high-resolution (both spatial and temporal) imaging satellites offers excellent potential to improve GPP estimation via enhanced precision, however, it has been under-investigated. One such high-resolution imaging satellite network is the PlanetScope network (Planet Labs Inc., San Francisco, CA, United States), which consists of over 130 multispectral imaging satellites providing images with three spectral bands in the visible range and one near-infrared (NIR) band. PlanetScope satellites take daily images with a spatial resolution of 3-m from a 400 km sun-synchronous orbit, offering much greater spatial resolution than other commonly used satellite systems (i.e., MODIS has a 250-m resolution for most bands and daily repeat cycle; LANDSAT has 30-m resolution for most bands and 16-day repeat cycle).
For in-situ GPP estimation, one of the most common and effective methods is the eddy covariance method. Eddy covariance is a micrometeorological method that is extensively used for measuring gas fluxes (Baldocchi, 2020). Using eddy covariance, net ecosystem exchange of CO2 (NEE) between the biosphere and atmosphere is determined as the covariance between vertical wind velocity and CO2 concentration (Rajan et al., 2013). High-speed measurements of wind velocity and CO2 concentration are generally made using fast-response instruments (i.e., 10 Hz or above). During daytime, the measured NEE using this method represents the balance between gross CO2 uptake through photosynthesis (GPP) and CO2 that is released through ecosystem respiration which includes both autotrophic and heterotrophic respirations. Nighttime fluxes are solely ecosystem respiration from both autotrophic and heterotrophic sources.
Combining PlanetScope satellite data with GPP estimated using the eddy covariance method could help to construct high-accuracy GPP prediction models. Such models could be extremely useful for upscaling flux data measurements as well as estimating crop yield and carbon footprint on much larger spatial and temporal scales. However, such studies involving high resolution satellite data and eddy covariance-based measurements of GPP from dryland agricultural systems are scarce. In this study, we developed relatively simple regression-based models of GPP using VIs estimated from PlanetScope satellite data and compared it with eddy covariance-based GPP estimates from a conventional dryland maize (Zea mays L.) field in East-Central Texas. Our goal was to test relatively simpler VI-based GPP regression models as an alternative to complex LUE models. Specifically, the study examined four VIs, the normalized difference vegetation index (NDVI), the soil adjusted vegetation index (SAVI), the weighted difference vegetation index (WDVI), and the two-band enhanced vegetation index (EVI2).
Material and Methods
Site Information
A three-year study was conducted in a 34-ha dryland maize field located at the Texas A&M Research Farm (Figure 1) near College Station, TX (30°32′46.2″ N, 96°25′19.7″ W, elevation 112 m). The region has a humid subtropical (Köppen Cfa) climate with an average annual temperature of 20.6°C. The 30-year average precipitation is 1,018 mm, which has a bimodal pattern with the highest rainfall usually occurring in May, June, and October (Menefee et al., 2021). There were three soil types in the study field, all with predominantly shrink-swell clay minerals. Approximately 90% of the field was covered by Ships clay (Chromic Halpludert) and Weswood silty clay (Udifluventic Haplustepts) and the remaining area was covered by Weswood silt loam (Udifluventic Haplustepts) (Figure 1).
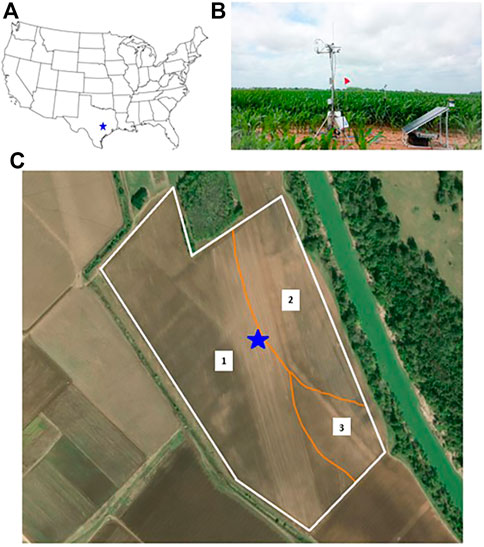
FIGURE 1. (A) Location of the study field near College Station, Texas, United States; (B) Eddy covariance flux tower in the field; (C) High-resolution PlanetScope satellite image of the study field with the white outline indicating the boundary and the yellow star indicating the location of the flux tower. Numbers 1–3 represent soil types present at the site and orange lines indicate the boundary between soil types.
The maize field was managed using practices that were typical for the region. Maize was planted on 10 March [day of year (DOY) 69] in 2017, 6 March (DOY 65) in 2018, and 7 March (DOY 66) in 2019 with a seeding rate of 60,000 seeds ha−1. Disc-tillage was performed before planting in 2017 and 2018. Due to unusually wet soil conditions and a short planting window, pre-plant tillage was not performed in 2019. High-yielding maize hybrids were planted each year (B-H 8845 VTB in 2017, Pioneer P1602 AM in 2018, and DeKalb 67–42 in 2019). Row spacing was 0.76 m. Nitrogen fertilizer was applied after planting at a rate of 125 kg N ha−1 as urea ammonium nitrate (32-0-0) in all 3 years. Maize was harvested on 25 July in 2017 (DOY 206), 19 July in 2018 (DOY 200), and 12 August in 2019 (DOY 224). Plant residues were shredded post-harvest and tilled into the soil using disc tillage.
Satellite Imagery Data
Satellite imagery from cloud-free days with full area coverage was downloaded from Planet Labs Inc., (San Francisco, CA, United States). Twelve images were selected during the 2017 growing season (DOY 79–203), 18 images were selected in 2018 (DOY 66–200), and 14 images (DOY 65–221) were selected in 2019. The spectral bands include red (590–670 nm), green (500–590 nm), blue (455–515 nm), and NIR (780–860 nm). Images have a radiometric resolution of 16 bit with a pixel size of 3 m × 3 m. Downloaded images were analyzed using the ENVI image processing software (Version 5.3; Harris Geospatial, Boulder, CO, United States). The digital number values were converted to top of atmosphere reflectance and subsequently to surface reflectance using coefficients supplied with the Planet Radiance product (PlanetLabs, 2021). The conversion to surface reflectance corrects for the impacts of aerosols, ozone, and water vapor using internal models and additional input data from MODIS (PlanetLabs, 2021). The average band values of the entire study field (approximately 112,000 pixels) were then extracted for calculating VIs as follows:
Soil Adjusted Vegetation Index was calculated with a soil adjustment factor of 0.5 (Huete, 1988). Weighted Difference Vegetation Index was calculated using the slope of the soil line, 1.06 (Clevers, 1991). Enhanced Vegetation Index 2 was calculated as a two-band version, with a gain factor of 2.5, a soil adjustment factor of 1.0 (different from that of SAVI), and an aerosol correction of 2.4 (from the blue band) (Zhang, 2015). As we needed a VI value for each day of the growing season, simple linear regression analysis was used to estimate daily VI values between two acquisition dates.
Eddy Covariance Instrumentation and Flux Processing
The eddy covariance flux tower was established in February 2017 and continuously maintained until December 2019. Data collected during the growing season (from planting until harvest) was used in GPP modeling. The main instrumentation included two fast-response instruments: a gas analyzer for measuring CO2 and water vapor concentration (Model LI-7550; LI-COR Biosciences, Lincoln, NE, United States) and a three-dimensional sonic anemometer (Model CSAT-3, Campbell Scientific, Logan, UT, United States) for measuring wind velocity and sonic temperature. Instruments were attached to a horizontal mast on a tripod facing south-east, the direction of the prevailing winds in the region (Figure 1). The height of the horizontal mast was adjusted routinely to maintain a 2 m instrument height above the plant canopy to maintain an approximate 200 m fetch (measurement radius). The gas analyzer was calibrated annually, and its internal chemicals (CO2 and H2O scrubbers) were replaced as recommended by the manufacturer. Both instruments were connected to LI-COR’s SmartFlux on-site data recording and flux processing system. Data from both instruments were collected at 10 Hz frequency.
Open-source EddyPro (version 6.2.2) software (LI-COR Biosciences, Lincoln, NE, United States) was used for flux processing. EddyPro performed several post-processing corrections before computing the final half-hourly NEE fluxes. These corrections included coordinate rotation, frequency response corrections, corrections for air density fluctuations, and sensor separation delays (Menefee et al., 2020). Following post-processing, EddyPro flagged data quality based on internal turbulence tests. High-quality data was marked with a “0”, moderate quality with a “1”, and low quality with a “2”. Low-quality data mainly occurred during precipitation events and when the friction velocity was less than 0.2. Routine maintenance (i.e., calibration), instrument shutdown during management activities (i.e., planting), and occasional power failure also created gaps in the data. Gap filling was used to predict missing and poor-quality data points. We used the Max Plank Institute for Biogeochemistry’s R-based gap-filling program (REddyProc version 72 written in R Gui 3.4.1), which fills data gaps based on a marginal distribution algorithm (Reichstein et al., 2005) that uses meteorological variables to calculate the missing flux data. The same program also partitioned NEE into its two component fluxes, GPP (assimilatory fluxes) and Reco (respiratory flux) using a nighttime-based flux partitioning method. In the nighttime-based flux partitioning method, the REddyProc algorithm determines relationship between temperature and nighttime CO2 flux, given that all nighttime flux is Reco. This relationship is then used to calculate daytime Reco as a function of temperature and finally GPP is calculated from NEE and Reco as NEE is the sum of Reco and GPP (Rajan et al., 2013). Finally, all half-hourly GPP values were summed up to estimate daily carbon uptake. Daily GPP values were then used for estimating weekly averages for developing regression models.
Weather
Additional meteorological instruments were installed at the site to collect weather and soil data. Particularly, air temperature and relative humidity were measured using an HMP155A probe (Vaisala, Vantaa, Finland). Photosynthetically active radiation (PAR) was measured using a quantum sensor (LI-190R, Li-COR, Lincoln, NE, United States). A tipping bucket-style rain gauge (TE525, Texas Electronics, Dallas, TX, United States) was used to measure precipitation. All additional meteorological instruments were connected to a CR3000 datalogger (Campbell Scientific, Logan, UT, United States). Readings from the instruments were collected every 2 s, which was later used for computing half-hourly averages. Precipitation was estimated as the cumulative sum over the half-hourly period.
Leaf Area Index
Plant samples were collected every other week from six selected areas within the field. At each location, 15 plants were randomly selected and destructively sampled for leaf area. Leaf area was measured by passing sampled leaves through an LI-3100 leaf area meter (LI-COR, Lincoln, NE, United States). Leaf area index (LAI) was calculated using measured leaf area and plant population data.
Gross Primary Production Model Development and Validation
Considering that the amount of CO2 that is fixed during photosynthesis is generally proportional to the amount of PAR absorbed by the plant canopy, a common method for estimating GPP could be formalized as follows:
where LUE is light use efficiency (g C MJ−1), PAR is incoming photosynthetically active radiation (micromoles m2 s−1), and fAPAR is the fraction of PAR absorbed by the plant canopy. The measurements of LUE and fAPAR usually require significant field data collection. To extend the application of this model, a few changes have been proposed by multiple authors. For example, GPP has been shown to be proportional to VI * PAR in a similar manner compared to LUE * PAR, for a wide variety of crops, including maize (Gitelson et al., 2012; Peng et al., 2013; He et al., 2018). Additionally, LAI has been shown to correlate well with fAPAR in grasslands dominated by plants with horizontally oriented leaves and croplands with plenty of between-plant spaces (e.g., row spacing), where LAI is typically less than 4 (Arnó et al., 2013).
In this study, we hypothesized that the eddy covariance based GPP would be proportional to the product of VI, LAI, and PAR as shown in Eq. 6.
To test this hypothesis, we developed GPP regression models using single-year remotely sensed VIs, LAI, PAR, and eddy covariance GPP data. Simple linear regression models were developed using the product of VI * LAI * PAR as independent variable and eddy covariance-based GPP as dependent variable. Using data from each year, we developed four models using NDVI, SAVI, WDVI and EVI2. In total, twelve GPP prediction models were developed using data from 3 years. These single-year data based linear regression models were then used to predict GPP for the other 2 years. For example, linear regression models developed using 2017 data were used to predict GPP in 2018 and 2019. Simulated GPP was then compared to in-situ GPP to determine model accuracy.
Statistical Analysis
Statistical analysis was performed using SigmaPlot (Version 14.0) and R (Version 3.4.1). The index of agreement (d-index) was calculated using the following equation Eq. 7:
where x is the modeled value and y is the observed value. The d-index shows the degree of agreement between the modeled data and the measured data. D-index values range between 0 and 1, with better fits being closer to 1.0. Root mean square error (RMSE) was calculated as follows Eq. 8:
Agreement between modeled and in situ GPP was also investigated using simple linear regression. Linear regression analysis was performed using SigmaPlot and the slope of the model was compared to 1.0 using the t-test function within SigmaPlot. The coefficient of determination (R2) was also used to compare the agreement between predicted and measured GPP.
Results
Seasonal Progression of Vegetation Indices and Gross Primary Production
There were differences in maize growth during the three growing seasons which was reflected in the seasonal VI curves and eddy covariance GPP (Figures 2, 3, respectively). All four vegetation indices followed a similar pattern which peaked around DOY 150 in all 3 years. This seasonal variation in growth was primarily driven by changes in weather, predominately precipitation (Figure 4). This was evident in the strong agreement between cumulative precipitation and cumulative GPP (R2 = 0.97).
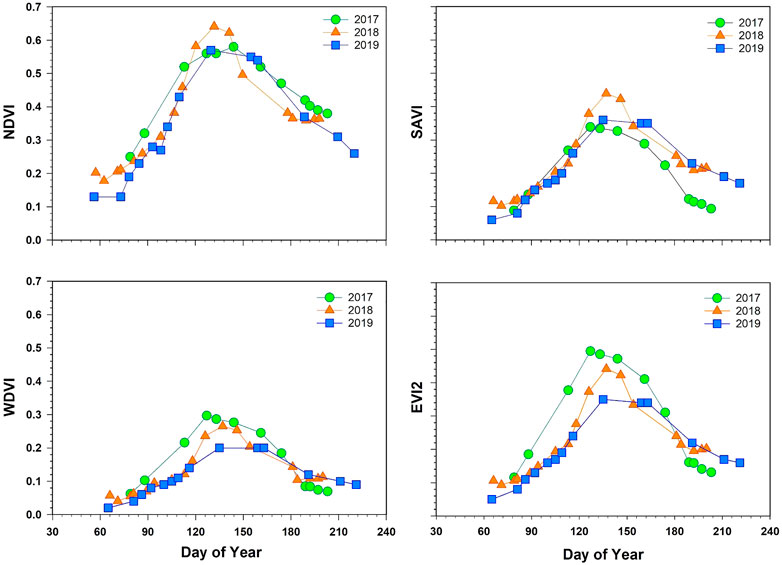
FIGURE 2. Seasonal progression of vegetation indices over the growing seasons in 2017, 2018, and 2019 for a dryland maize field located near College Station, Texas, United States. Vegetation indices include the normalized difference vegetation index (NDVI), the soil adjusted vegetation index (SAVI), the weighted difference vegetation index (WDI), and the enhanced vegetation index 2 (EVI2).
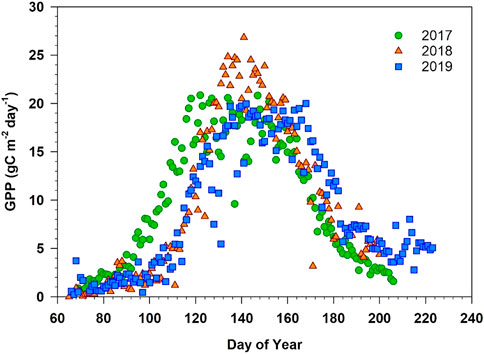
FIGURE 3. Daily gross primary production (GPP) of maize during the 2017, 2018, and 2019 growing seasons.
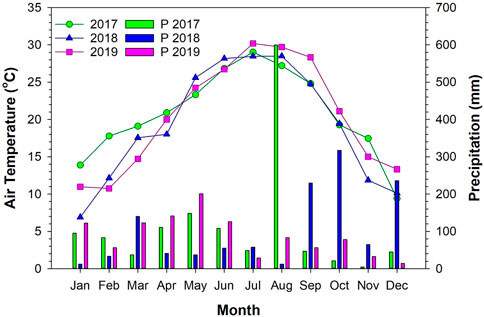
FIGURE 4. Monthly average air temperature and cumulative precipitation across the 3 years (2017–2019) near College Station, TX, United States. The high precipitation in August 2017 was due to Hurricane Harvey.
In all 3 years, maize was planted in early March. However, March of 2017 had warmer average air temperature than that of 2018 and 2019 (19.1°C compared to 17.5°C and 14.7°C, respectively) and high soil moisture, likely leading to faster crop establishment that year. Daily GPP was the highest in 2018 (26.8 g Cm−2) compared to 2017 (20.9 g Cm−2) and 2019 (20.0 g Cm−2). This maximum daily GPP period coincided with reproductive growth phases in May and June, where 2018 was warmer than 2017 or 2019 (26.9°C compared to 25.1 and 25.5°C). During the senescence phase of the 2019 growing season, daily GPP was higher compared to that of 2017 and 2018, which was reflected in all four vegetation indices. This late-season GPP and visible plant growth was largely influenced by the growth of warm-season weeds, particularly Bermudagrass (Cynodon dactylon) and Palmer amaranth (Amaranthus palmeri) during the latter portion of the growing season, driven by high precipitation received at the site during the post-maturity period of maize. There were considerable differences in precipitation between the 3 years. Growing season precipitation (March–July) in 2019 was considerably higher (618 mm) than the other 2 years. The least amount of growing season precipitation was received in 2018 (330 mm). Precipitation in 2017 was 452 mm. Annual precipitation was 1,346 mm for 2017 (including rain from Hurricane Harvey), 1,234 mm for 2018, and 1,060 mm for 2019. Despite some differences in the seasonal pattern of GPP and precipitation, total carbon uptake between the 3 years was similar. Cumulative growing season GPP was 1,361 g Cm−2 in 2017, 1,408 g Cm−2 in 2018, and 1,374 g Cm−2 in 2019.
Gross Primary Production Models
Prediction models for GPP were developed for each year using weekly average values of VI*PAR*LAI and eddy covariance-based GPP (p < 0.0001). All twelve models were linear in nature with R2 between 0.92 and 0.96 (Table 1). Figure 5 shows the relationship between weekly averages of VI*PAR*LAI and in-situ GPP for all 3 years combined. Similar to single-year models, there was a strong linear relationship between VI*PAR*LAI and in-situ GPP when the data were combined. The SAVI-based model had the highest R2 value of 0.95. When data were combined, a first-order polynomial model provided the highest R2 for EVI and WDVI.
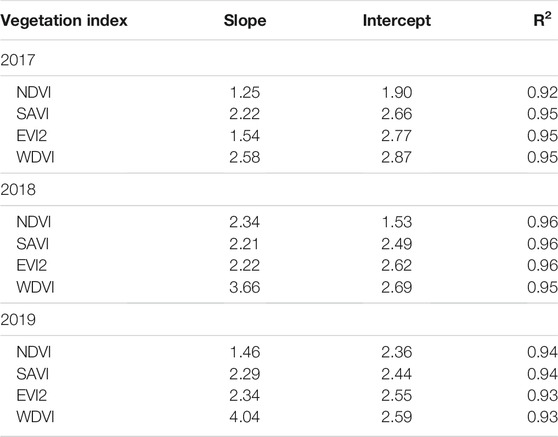
TABLE 1. Slope and intercept of linear regression models developed using eddy covariance-based gross primary production and the product of vegetation index, leaf area index, photosynthetically active radiation. Vegetation indices that were studied include the normalized difference vegetation index (NDVI), the soil adjusted vegetation index (SAVI), the enhanced vegetation index 2 (EVI2), and the weighted difference vegetation index (WDVI). R2 is the coefficient of determination.
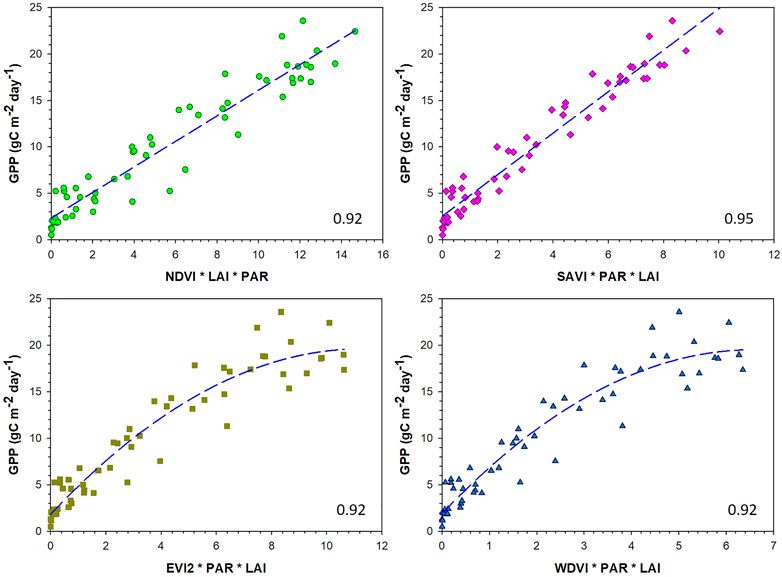
FIGURE 5. Measured gross primary production (GPP) plotted against the product of vegetation index (VI), photosynthetically active radiation (PAR), and leaf area index (LAI). Vegetation indices include the normalized difference vegetation index (NDVI), the soil adjusted vegetation index (SAVI), the enhanced vegetation index 2 (EVI2), and the weighted difference vegetation index (WDVI).
Testing of Gross Primary Production Models
We used GPP prediction models developed using single-year data to predict GPP for the other 2 years and compared the results with in-situ GPP from those years. Figure 6 presents in-situ GPP in 2017 plotted against predicted GPP. In this case, models developed using 2018 and 2019 data were tested for its accuracy for predicting 2017 GPP. Among the four VI models, GPP models using SAVI estimated in-situ GPP with greater accuracy (lowest RMSE). Analysis for the slope using t-test showed a 1:1 relationship between in-situ GPP and predicted GPP using SAVI models developed using 2018 and 2019 data. A weekly time series of 2017 in situ GPP and SAVI-based predictions are shown in Figure 9A for easy comparison. Other VI-based GPP models significantly overestimated 2017 GPP (slope <1).
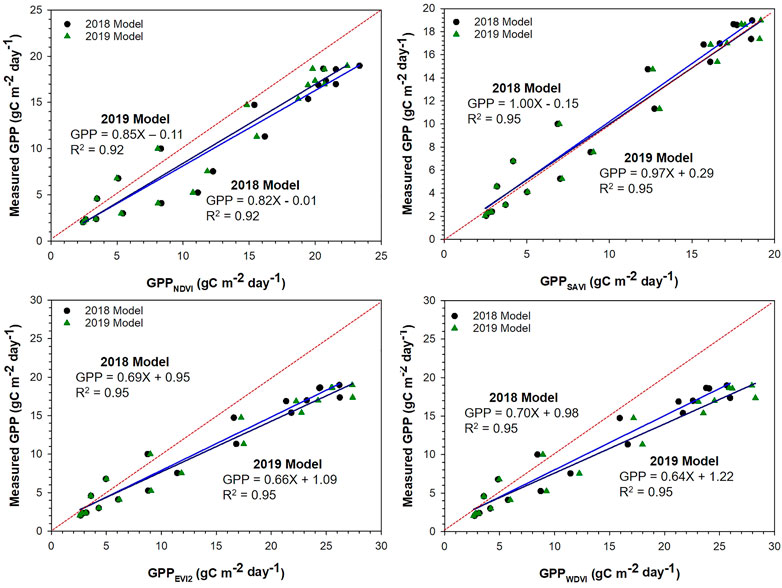
FIGURE 6. Measured 2017 gross primary production (GPP) against predicted GPP using the 2018 and 2019 GPP models. Straight lines are regression lines and the dotted red line is the 1:1 line.
Figure 7 presents in-situ GPP in 2018 plotted against predicted GPP. In this case, models developed using 2017 and 2019 data were tested for its accuracy for predicting 2018 GPP. Similar to the previous year, SAVI-based GPP models predicted in-situ GPP in 2018 with greater accuracy (lowest RMSE). A time series graph is provided in Figure 9B. Analysis for the slope using t-test showed that the slope of the regression line was not significantly different from 1 (p > 0.05) in both years. Among other VIs, EVI and WDVI-based GPP models based on 2019 data predicted in-situ GPP with accuracy similar to that of SAVI. However, the RMSE of these model predictions were higher than that of SAVI (Table 2). Among the VIs, NDVI prediction model using 2019 training data had a particularly high RMSE (26.3) and greatly overestimated actual GPP in 2018.
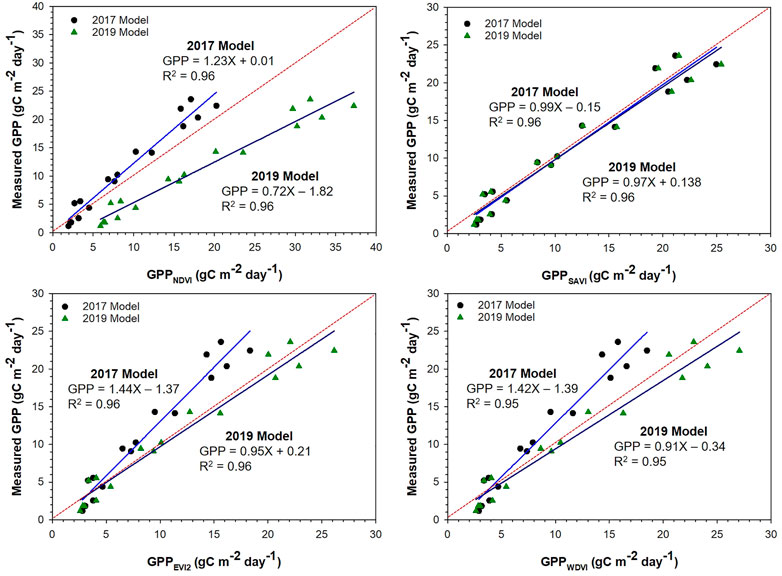
FIGURE 7. Measured 2018 gross primary production (GPP) against predicted GPP using the 2017 and 2019 GPP models. Straight lines are regression lines and the dotted red line is the 1:1 line.
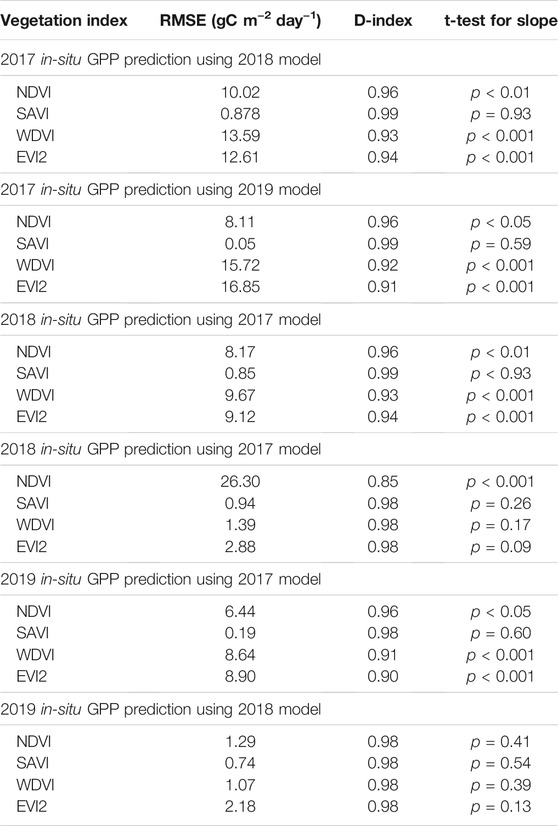
TABLE 2. Summary of the statistical analysis (RMSE, d-index, and results of t-test) of the performance of gross primary production (GPP) models comparing predicted versus eddy covariance-based in-situ GPP (gC m−2 day−1). The t-test compared the slope of the regression line to 1.0, with p values less than 0.05 indicating a slope significantly different from 1.0. Vegetation indices used for developing GPP prediction models include normalized difference vegetation index (NDVI), soil adjusted vegetation index (SAVI), two-band enhanced vegetation index (EVI2), and weighted difference vegetation index (WDVI).
Figure 8 presents in-situ GPP in 2019 plotted against predicted GPP. In this case, models developed using 2017 and 2018 as training data were tested for its accuracy for predicting 2019 GPP. As with the previous years, SAVI-based prediction models were the most successful with the lowest RMSE and 1:1 agreement. A time series graph showing weekly in situ GPP and SAVI-based predictions are provided in Figure 9C. Unlike other years, 2018 GPP prediction models developed using NDVI, EVI2 and WDVI also estimated in-situ GPP accurately (slope = 1). However, 2017 GPP prediction models using NDVI, EVI2 and WDVI overestimated 2019 in-situ GPP.
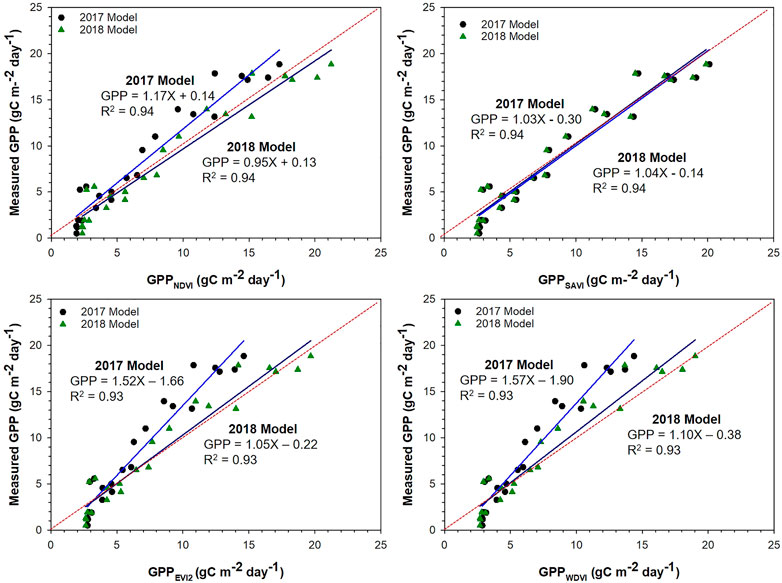
FIGURE 8. Measured 2019 gross primary production (GPP) against predicted GPP using the 2017 and 2018 GPP models. Straight lines are regression lines and the dotted red line is the 1:1 line.

FIGURE 9. Weekly averages of eddy covariance tower-based gross primary production (GPP) plotted against predicted GPP using SAVI-based GPP models for 2017 (A), 2018 (B), and 2019 (C).
Discussion
Globally, croplands contribute to more than 10% of terrestrial GPP (Ai et al., 2020). Primary production of crops is an indicator of the physiological, climatic, and management constraints affecting plant growth and development. As a C4 crop, maize has one of the highest GPP among cultivated crops under ideal growing conditions (Suyker and Verma, 2012). The magnitude of daily GPP that was measured at our study site using the eddy covariance method was similar to GPP of maize measured in the U.S. Great Plains under rainfed conditions (Suyker and Verma, 2012; Dold et al., 2019). As GPP is an important metric for understanding CO2 fixation through photosynthesis at the field, regional, and/or global scales, remote sensing-based methods are commonly employed for estimating GPP (Turner et al., 2006; Chen et al., 2021).
On a global scale, data from the Moderate Resolution Imaging Radiometer (MODIS) sensor aboard NASA’s Terra satellite is commonly used to assess terrestrial ecosystem function and GPP (Turner et al., 2006). In a recent study (Huang et al., 2018), MODIS GPP was compared with in-situ measurements from seven maize eddy covariance flux sites in different areas around the world. Their results showed that the GPP of maize was underestimated by 6–58% across these sites. This underestimation was primarily due to inaccuracies in LUE and fAPAR estimates that were used to generate the MODIS GPP product. Several previous studies reported similar issues with GPP estimated based on the LUE approach (Yuan et al., 2014; Zhu et al., 2018). One potential flaw leading to GPP underestimation in most LUE methods is the treatment of plant canopy as a monolith and an inability to capture sudden temporal changes in carbon uptake (Mercado et al., 2009; Oliphant et al., 2011). There has been some effort to develop two-leaf methods that differentiate between sunlit and shaded leaves in GPP estimation. (Guan et al., 2022) was able to improve on the two-leaf model even further with the addition of radiation scalars.
In our study, we tested a simplified method for estimating GPP using VIs estimated from the high resolution PlanetScope satellite along with in-situ LAI, PAR, and eddy covariance-based carbon flux measurements. Our results showed consistent prediction accuracy of maize GPP with SAVI-based models compared to other indices. Although several studies have found reasonable predictions of maize GPP with NDVI and EVI (Kalfas et al., 2011; Zhang et al., 2015; Wagle et al., 2016), the performance of these indices was not consistent in our study. When crops are planted in wider rows, such as the case of maize in our study, the bare soil between plant rows remains exposed for a prolonged period during the growing season. As a result, the soil becomes the dominant factor influencing scene reflectance in satellite remotely sensed measurements. During the early growing season, varying soil background brightness due to moisture conditions as well as spectral interactions between soil and developing canopy can strongly influence the magnitude of remotely sensed VIs (Maas and Rajan, 2010). Additionally in croplands, pre-plant tillage, within-season cultivation practices, and irrigation can bring changes to soil reflectance (Gowda et al., 2001). Because of the effect of these transient management events on soil reflectance, remotely sensed indices that include terms to correct for soil background conditions are more likely to successfully model GPP of agricultural systems.
The index SAVI was specifically developed to counteract the influence of soil background brightness on NDVI (Huete, 1988). In many agricultural systems studies, SAVI-based models predicted yield with better accuracy than NDVI (Guo et al., 2019; Nagy et al., 2021). In our study, regardless of the year, SAVI-based models estimated carbon uptake with RMSE less than 1 g Cm−2 day−1. This was lower than the RMSE reported in a global study that compared modeled GPP against in-situ GPP obtained from 133 eddy covariance flux towers (2.08 g C m−2 day−1). While EVI and WDVI also include soil-related factors for correcting variable background reflectance, these indices performed poorly compared to SAVI (RMSE between 1–17 g Cm−2 day−1). Both EVI and WDVI have been shown to perform more optimally when vegetation is dense, possibly reducing its efficacy in correlating with GPP in the early stages of crop growth of corn (Qi et al., 1994; Zhou et al., 2014). Dark-colored soils and periods with very low LAI are dominant in rainfed croplands, suggesting that SAVI likely has much utility for GPP estimation in the rainfed crop-growing regions. While NDVI remains one of the most popular indices, here it was the least effective in predicting GPP. Unlike the other three indices, NDVI does not include a soil-related factor and thus is likely impacted by the bare soil between rows, especially in the early growing season.
An advantage of the model (VI × LAI × PAR) that was tested in this study is that it can be calculated using easily obtainable data, especially when compared to both direct measurements of GPP and the original LUE-based GPP models. While we used manually collected LAI in our study, LAI can be successfully estimated using remote sensing data (Gitelson et al., 2003; Liu et al., 2012). More recently, remote sensing based on unmanned aerial systems is also becoming popular in estimating the LAI of crops (Shafian et al., 2018). The use of light detection and ranging (LiDAR) sensors to characterize the plant canopy and LAI estimation has also been successful (Richardson et al., 2009; Tang et al., 2014). Additionally, a ceptometer can also be used to measure LAI, which is far less invasive and time-consuming compared to destructive sampling.
The second variable that we used in our model is PAR, which we obtained using a quantum sensor at our eddy covariance flux tower site. Quantum sensors for measuring PAR are inexpensive and reasonably simple to install and operate. Although most flux tower sites around the world have quantum sensors, those sensors are not generally available in local weather stations. However, the majority of local weather stations have sensors for measuring irradiance (incoming solar radiation). The proportion of irradiance that is available for photosynthesis is fairly consistent, allowing for estimation of PAR from irradiance. At our site, approximately 45–50% of incoming solar radiation was PAR, with some variability due to solar angle and atmospheric conditions. This irradiance-based estimation of PAR has a maximum error of about 10% (Meek et al., 1984). Additionally, many weather databases that are available online have historical weather data which include total irradiance data (Richardson et al., 2009; Bonifacio et al., 2015).
The success of the modeling effort in this study using the SAVI-based method to predict maize GPP also highlights the potential in using high-resolution satellite remote sensing to estimate GPP at field scales. The improved resolution of PlanetScope multispectral data (3 m) compared to the more commonly used MODIS GPP product (1 km) improves the accuracy of applications of remote sensing data by reducing the error caused by mixed pixels. The high spatial resolution of PlanetScope also creates the opportunity to estimate GPP from smaller agricultural fields where the site area is too small to be reliably measured by many of the more commonly available satellites such as MODIS, Landsat, or Sentinel.
One possible route of model improvement and further the study would be to incorporate additional factors that affect crop growth and development or to apply other modeling methods. For example, a large-scale GPP modeling study using a similar method indicated that adding scalars for temperature and water stress could improve the model performance and was particularly effective in modeling cropland GPP (Zheng et al., 2018). This was an expected outcome as variations of plant water content can impact reflectance patterns across all wavelengths (Asrar et al., 1984). Another potential use of the incorporation of scalars is to model all fluxes (NEE, Reco, and GPP) using satellite data to provide a more complete picture (Mahadevan et al., 2008). However, these methods should be applied with caution, because short-term changes in soil moisture and plant water stress can cause abrupt changes in GPP within a short duration, which can be accurately captured by eddy covariance measurements but can impose a challenge for satellite-based image-based methods operated at a much lower spatial and temporal resolution than eddy covariance methods (Gitelson et al., 2012). Another method of improving GPP estimates in a study like this would be to incorporate cloud correction mechanisms to extract VIs from images with cloud cover (Chen et al., 2004; Chu et al., 2021) allowing for more images to be used in the development and validation of models.
Conclusion
In this study, we showed that GPP prediction models developed using SAVI estimated from remote sensing imagery and in-situ PAR, LAI, and eddy covariance-based carbon flux measurements predicted gross carbon uptake of dryland maize with reasonable accuracy compared to other remotely sensed indices. Superior performance of SAVI in our study indicated that, in dryland row cropping systems, an index that reduces the effect of soil background conditions might capture the crop growth and development with higher accuracy compared to indices that are vulnerable to soil background changes. The high spatial resolution of PlanetScope satellite data creates opportunities to estimate GPP of smaller agricultural fields that are too small to be reliably measured by other commonly available satellite data with high spatial resolution. Future work is needed to test the accuracy of remotely sensed LAI and PAR estimated using regional weather data in the GPP models that we proposed in our study. This will contribute to wide-scale applications of this model in estimating GPP of dryland croplands especially those that are small-scale fields using a relatively simpler approach.
Data Availability Statement
The raw data supporting the conclusion of this article will be made available by the authors, without undue reservation.
Author Contributions
DM: Writing, Data Collection and Analysis, Editing, NR: Supervision, Writing, Editing, SC: Methodology, Editing, SS: Methodology, Editing.
Funding
This work was supported by USDA-NIFA, grant number 2016-70001-24636/project accession no. 1008730. This work was supported by Planet’s “Education and Research Program”, which provided free access to PlanetScope imagery data. This work was conducted within the Texas A&M University system and supported by Texas A&M AgriLife.
Conflict of Interest
The authors declare that the research was conducted in the absence of any commercial or financial relationships that could be construed as a potential conflict of interest.
Publisher’s Note
All claims expressed in this article are solely those of the authors and do not necessarily represent those of their affiliated organizations, or those of the publisher, the editors and the reviewers. Any product that may be evaluated in this article, or claim that may be made by its manufacturer, is not guaranteed or endorsed by the publisher.
Acknowledgments
The authors would also like to thank Texas A&M AgriLife and the staff at the research farm, particularly Alfred Nelson (Farm Manager) for managing the maizefield (planting, harvesting, fertilizing, tillage, and weed control). The authors would like to thank Don T. Conlee (Department of Atmospheric Sciences, Texas A&M University) for providing missing meteorological data. The USDA is an equal opportunity employer and provider.
Supplementary Material
The Supplementary Material for this article can be found online at: https://www.frontiersin.org/articles/10.3389/frsen.2022.810030/full#supplementary-material
References
Ai, Z., Wang, Q., Yang, Y., Manevski, K., Yi, S., and Zhao, X. (2020). Variation of Gross Primary Production, Evapotranspiration and Water Use Efficiency for Global Croplands. Agric. For. Meteorol. 287, 107935. doi:10.1016/j.agrformet.2020.107935
Alganci, U., Ozdogan, M., Sertel, E., and Ormeci, C. (2014). Estimating maize and Cotton Yield in southeastern Turkey with Integrated Use of Satellite Images, Meteorological Data and Digital Photographs. Field Crops Res. 157, 8–19. doi:10.1016/j.fcr.2013.12.006
Arnó, J., Escolà, A., Vallès, J. M., Llorens, J., Sanz, R., Masip, J., et al. (2013). Leaf Area index Estimation in Vineyards Using a Ground-Based LiDAR Scanner. Precision Agric. 14 (3), 290–306. doi:10.1007/s11119-012-9295-0
Asrar, G., Fuchs, M., Kanemasu, E. T., and Hatfield, J. L. (1984). Estimating Absorbed Photosynthetic Radiation and Leaf Area index from Spectral Reflectance in Wheat 1. Agron.j. 76 (2), 300–306. doi:10.2134/agronj1984.00021962007600020029x
Bai, X., Huang, Y., Ren, W., Coyne, M., Jacinthe, P. A., Tao, B., et al. (2019). Responses of Soil Carbon Sequestration to Climate‐smart Agriculture Practices: A Meta‐analysis. Glob. Change Biol. 25 (8), 2591–2606. doi:10.1111/gcb.14658
Baldocchi, D. D. (2020). How Eddy Covariance Flux Measurements Have Contributed to Our Understanding of Global Change Biology. Glob. Change Biol. 26 (1), 242–260. doi:10.1111/gcb.14807
Bonifacio, C., Barchyn, T. E., Hugenholtz, C. H., and Kienzle, S. W. (2015). CCDST: A Free Canadian Climate Data Scraping Tool. Comput. Geosci. 75, 13–16. doi:10.1016/j.cageo.2014.10.010
Chen, J., Jönsson, P., Tamura, M., Gu, Z., Matsushita, B., and Eklundh, L. (2004). A Simple Method for Reconstructing a High-Quality NDVI Time-Series Data Set Based on the Savitzky–Golay Filter. Remote Sens. Environ. 91 (3-4), 332–344. doi:10.1016/j.rse.2004.03.014
Chen, A., Mao, J., Ricciuto, D., Xiao, J., Frankenberg, C., Li, X., et al. (2021). Moisture Availability Mediates the Relationship between Terrestrial Gross Primary Production and Solar‐induced Chlorophyll Fluorescence: Insights from Global‐Scale Variations. Glob. Change Biol. 27 (6), 1144–1156. doi:10.1111/gcb.15373
Chu, D., Shen, H., Guan, X., Chen, J. M., Li, X., Li, J., et al. (2021). Long Time-Series NDVI Reconstruction in Cloud-Prone Regions via Spatio-Temporal Tensor Completion. Remote Sensing Environ. 264, 112632. arXiv preprint arXiv:2102.02603. doi:10.1016/j.rse.2021.112632
Clevers, J. G. P. W. (1991). Application of the WDVI in Estimating LAI at the Generative Stage of Barley. ISPRS J. Photogramm. Remote Sens. 46 (1), 37–47. doi:10.1016/0924-2716(91)90005-g
Dold, C., Hatfield, J. L., Prueger, J. H., Sauer, T. J., Moorman, T. B., and Wacha, K. M. (2019). Impact of Management Practices on Carbon and Water Fluxes in Corn-Soybean Rotations. Agrosyst. Geosci. Environ. 2 (1), 1–8. doi:10.2134/age2018.08.0032
Dong, J., Li, L., Shi, H., Chen, X., Luo, G., and Yu, Q. (2017). Robustness and Uncertainties of the “Temperature and Greenness” Model for Estimating Terrestrial Gross Primary Production. Sci. Rep. 7 (1), 44046–44048. doi:10.1038/srep44046
Gitelson, A. A., Viña, A., Arkebauer, T. J., Rundquist, D. C., Keydan, G., and Leavitt, B. (2003). Remote Estimation of Leaf Area index and green Leaf Biomass in maize Canopies. Geophys. Res. Lett. 30 (5), 52-1–52-4. doi:10.1029/2002gl016450
Gitelson, A. A., Peng, Y., Masek, J. G., Rundquist, D. C., Verma, S., Suyker, A., et al. (2012). Remote Estimation of Crop Gross Primary Production with Landsat Data. Remote Sens. Environ. 121, 404–414. doi:10.1016/j.rse.2012.02.017
Govindasamy, P., Liu, R., Provin, T., Rajan, N., Hons, F., Mowrer, J., et al. (2020). Soil Carbon Improvement under Long-Term (36 Years) No-Till Sorghum Production in a Sub-tropical Environment. Soil Use Manage. 37 (1), 37–48. doi:10.1111/sum.12636
Gowda, P., Dalzell, B., Mulla, D., and Kollman, F. (2001). Mapping Tillage Practices with Landstat Thematic Mapper Based Logistic Regression Models. J. Soil Water Conserv. 56 (2), 91–96.
Guan, X., Chen, J. M., Shen, H., Xie, X., and Tan, J. (2022). Comparison of Big-Leaf and Two-Leaf Light Use Efficiency Models for GPP Simulation after Considering a Radiation Scalar. Agric. For. Meteorol. 313, 108761. doi:10.1016/j.agrformet.2021.108761
Guo, C., Tang, Y., Lu, J., Zhu, Y., Cao, W., Cheng, T., et al. (2019). Predicting Wheat Productivity: Integrating Time Series of Vegetation Indices into Crop Modeling via Sequential Assimilation. Agric. For. Meteorol. 272-273, 69–80. doi:10.1016/j.agrformet.2019.01.023
He, M., Kimball, J., Maneta, M., Maxwell, B., Moreno, A., Beguería, S., et al. (2018). Regional Crop Gross Primary Productivity and Yield Estimation Using Fused Landsat-MODIS Data. Remote Sens. 10 (3), 372. doi:10.3390/rs10030372
Huang, X., Ma, M., Wang, X., Tang, X., and Yang, H. (2018). The Uncertainty Analysis of the MODIS GPP Product in Global maize Croplands. Front. Earth Sci. 12 (4), 739–749. doi:10.1007/s11707-018-0716-x
Huete, A. R. (1988). A Soil-Adjusted Vegetation index (SAVI). Remote Sens. Environ. 25 (3), 295–309. doi:10.1016/0034-4257(88)90106-x
Jiang, S., Zhao, L., Liang, C., Cui, N., Gong, D., Wang, Y., et al. (2021). Comparison of Satellite-Based Models for Estimating Gross Primary Productivity in Agroecosystems. Agric. For. Meteorol. 297, 108253. doi:10.1016/j.agrformet.2020.108253
Jin, C., Xiao, X., Wagle, P., Griffis, T., Dong, J., Wu, C., et al. (2015). Effects of In-Situ and Reanalysis Climate Data on Estimation of Cropland Gross Primary Production Using the Vegetation Photosynthesis Model. Agric. For. Meteorol. 213, 240–250. doi:10.1016/j.agrformet.2015.07.003
Kalfas, J. L., Xiao, X., Vanegas, D. X., Verma, S. B., and Suyker, A. E. (2011). Modeling Gross Primary Production of Irrigated and Rain-Fed maize Using MODIS Imagery and CO2 Flux tower Data. Agric. For. Meteorol. 151 (12), 1514–1528. doi:10.1016/j.agrformet.2011.06.007
Liu, J., Pattey, E., and Jégo, G. (2012). Assessment of Vegetation Indices for Regional Crop green LAI Estimation from Landsat Images over Multiple Growing Seasons. Remote Sens. Environ. 123, 347–358. doi:10.1016/j.rse.2012.04.002
Maas, S. J., and Rajan, N. (2010). Normalizing and Converting Image DC Data Using Scatter Plot Matching. Remote Sens. 2 (7), 1644–1661. doi:10.3390/rs2071644
Mahadevan, P., Wofsy, S. C., Matross, D. M., Xiao, X., Dunn, A. L., Lin, J. C., et al. (2008). A Satellite-Based Biosphere Parameterization for Net Ecosystem CO2 Exchange: Vegetation Photosynthesis and Respiration Model (VPRM). Glob. Biogeochem. Cycles 22 (2), 1–17. doi:10.1029/2006GB002735
Meek, D. W., Hatfield, J. L., Howell, T. A., Idso, S. B., and Reginato, R. J. (1984). A Generalized Relationship between Photosynthetically Active Radiation and Solar Radiation 1. Agron.j. 76 (6), 939–945. doi:10.2134/agronj1984.00021962007600060018x
Menefee, D., Rajan, N., Cui, S., Bagavathiannan, M., Schnell, R., and West, J. (2020). Carbon Exchange of a Dryland Cotton Field and its Relationship with PlanetScope Remote Sensing Data. Agric. For. Meteorol. 294, 108130. doi:10.1016/j.agrformet.2020.108130
Menefee, D., Rajan, N., Cui, S., Bagavathiannan, M., Schnell, R., and West, J. (2021). Simulation of Dryland maize Growth and Evapotranspiration Using DSSAT‐CERES‐Maize Model. Agron.j. 113 (2), 1317–1332. doi:10.1002/agj2.20524
Mercado, L. M., Bellouin, N., Sitch, S., Boucher, O., Huntingford, C., Wild, M., et al. (2009). Impact of Changes in Diffuse Radiation on the Global Land Carbon Sink. Nature 458 (7241), 1014–1017. doi:10.1038/nature07949
Monteith, J. L. (1977). Climate and the Efficiency of Crop Production in Britain. Philos. Trans. R. Soc. Lond. B, Biol. Sci. 281 (980), 277–294.
Mowrer, J., Rajan, N., Sarangi, D., Zapata, D., Govindasamy, P., Maity, A., et al. (2020). “Soil Management Practices of Major Crops in the United States and Their Potential for Carbon Sequestration,” in Carbon Management in Tropical and Sub-tropical Terrestrial Systems (Springer), 71–88.
Murray, S. C., Knox, L., Hartley, B., Méndez-Dorado, M. A., Richardson, G., Thomasson, J. A., et al. (2016). “High Clearance Phenotyping Systems for Season-Long Measurement of Corn, Sorghum and Other Row Crops to Complement Unmanned Aerial Vehicle Systems",,” in Autonomous Air and Ground Sensing Systems for Agricultural Optimization and Phenotyping: International Society for Optics and Photonics, 986607.
Nagy, A., Szabó, A., Adeniyi, O. D., and Tamás, J. (2021). Wheat Yield Forecasting for the Tisza River Catchment Using Landsat 8 NDVI and SAVI Time Series and Reported Crop Statistics. Agronomy 11 (4), 652. doi:10.3390/agronomy11040652
Oliphant, A. J., Dragoni, D., Deng, B., Grimmond, C. S. B., Schmid, H.-P., and Scott, S. L. (2011). The Role of Sky Conditions on Gross Primary Production in a Mixed Deciduous forest. Agric. For. Meteorol. 151 (7), 781–791. doi:10.1016/j.agrformet.2011.01.005
Padilla, F. L. M., Maas, S. J., González-Dugo, M. P., Mansilla, F., Rajan, N., Gavilán, P., et al. (2012). Monitoring Regional Wheat Yield in Southern Spain Using the GRAMI Model and Satellite Imagery. Field Crops Res. 130, 145–154. doi:10.1016/j.fcr.2012.02.025
Peng, Y., Gitelson, A. A., and Sakamoto, T. (2013). Remote Estimation of Gross Primary Productivity in Crops Using MODIS 250m Data. Remote Sens. Environ. 128, 186–196. doi:10.1016/j.rse.2012.10.005
Potter, C. S. (1999). Terrestrial Biomass and the Effects of Deforestation on the Global Carbon Cycle: Results From a Model of Primary Production Using Satellite Observations. BioScience 49 (10), 769–778. doi:10.2307/1313568
Qi, J., Chehbouni, A., Huete, A. R., Kerr, Y. H., and Sorooshian, S. (1994). A Modified Soil Adjusted Vegetation index. Remote Sens. Environ. 48 (2), 119–126. doi:10.1016/0034-4257(94)90134-1
Rajan, N., Maas, S. J., and Cui, S. (2013). Extreme Drought Effects on Carbon Dynamics of a Semiarid Pasture. Agron.j. 105 (6), 1749–1760. doi:10.2134/agronj2013.0112
Rajan, N., Puppala, N., Maas, S., Payton, P., and Nuti, R. (2014). Aerial Remote Sensing of Peanut Ground Cover. Agron.j. 106 (4), 1358–1364. doi:10.2134/agronj13.0532
Rambal, S., Lempereur, M., Limousin, J., Martin-StPaul, N., Ourcival, J., and Rodríguez-Calcerrada, J. (2014). How Drought Severity Constrains GPP and its Partitioning Among Carbon Pools in a Quercus ilex Coppice? Biogeosci. Discuss. 11 (6), 8673–8711. doi:10.5194/bg-11-6855-2014
Reichstein, M., Falge, E., Baldocchi, D., Papale, D., Aubinet, M., Berbigier, P., et al. (2005). On the Separation of Net Ecosystem Exchange into Assimilation and Ecosystem Respiration: Review and Improved Algorithm. Glob. Change Biol. 11 (9), 1424–1439. doi:10.1111/j.1365-2486.2005.001002.x
Richardson, J. J., Moskal, L. M., and Kim, S.-H. (2009). Modeling Approaches to Estimate Effective Leaf Area index from Aerial Discrete-Return LIDAR. Agric. For. Meteorol. 149 (6-7), 1152–1160. doi:10.1016/j.agrformet.2009.02.007
Shafian, S., Rajan, N., Schnell, R., Bagavathiannan, M., Valasek, J., Shi, Y., et al. (2018). Unmanned Aerial Systems-Based Remote Sensing for Monitoring Sorghum Growth and Development. PloS one 13 (5), e0196605. doi:10.1371/journal.pone.0196605
Suyker, A. E., and Verma, S. B. (2012). Gross Primary Production and Ecosystem Respiration of Irrigated and Rainfed maize-soybean Cropping Systems over 8 Years. Agric. For. Meteorol. 165, 12–24. doi:10.1016/j.agrformet.2012.05.021
Suyker, A. E., Verma, S. B., Burba, G. G., Arkebauer, T. J., Walters, D. T., and Hubbard, K. G. (2004). Growing Season Carbon Dioxide Exchange in Irrigated and Rainfed maize. Agric. For. Meteorol. 124 (1-2), 1–13. doi:10.1016/j.agrformet.2004.01.011
Tang, H., Brolly, M., Zhao, F., Strahler, A. H., Schaaf, C. L., Ganguly, S., et al. (2014). Deriving and Validating Leaf Area Index (LAI) at Multiple Spatial Scales through Lidar Remote Sensing: A Case Study in Sierra National Forest, CA. Remote Sens. Environ. 143, 131–141. doi:10.1016/j.rse.2013.12.007
Turner, D. P., Ritts, W. D., Cohen, W. B., Gower, S. T., Running, S. W., Zhao, M., et al. (2006). Evaluation of MODIS NPP and GPP Products across Multiple Biomes. Remote Sens. Environ. 102 (3-4), 282–292. doi:10.1016/j.rse.2006.02.017
Verma, M., Friedl, M. A., Law, B. E., Bonal, D., Kiely, G., Black, T. A., et al. (2015). Improving the Performance of Remote Sensing Models for Capturing Intra- and Inter-annual Variations in Daily GPP: An Analysis Using Global FLUXNET tower Data. Agric. For. Meteorol. 214-215, 416–429. doi:10.1016/j.agrformet.2015.09.005
Wagle, P., Gowda, P. H., Xiao, X., and Kc, A. (2016). Parameterizing Ecosystem Light Use Efficiency and Water Use Efficiency to Estimate maize Gross Primary Production and Evapotranspiration Using MODIS EVI. Agric. For. Meteorol. 222, 87–97. doi:10.1016/j.agrformet.2016.03.009
Weinheimer, J., Rajan, N., Johnson, P. N., and Maas, S. (2010). Carbon Footprint: A New Farm Management Consideration in the Southern High Plains. Denver, CO: AAEA,CAES, & WAEA Joint Annual Meeting.
Wu, C., Niu, Z., and Gao, S. (2010). Gross Primary Production Estimation from MODIS Data with Vegetation index and Photosynthetically Active Radiation in maize. J. Geophys. Res. Atmos. 115 (D12), 69–79. doi:10.1029/2009jd013023
Wu, C., Gonsamo, A., Zhang, F., and Chen, J. M. (2014). The Potential of the Greenness and Radiation (GR) Model to Interpret 8-day Gross Primary Production of Vegetation. ISPRS J. Photogramm. Remote Sens. 88, 69–79. doi:10.1016/j.isprsjprs.2013.10.015
Yuan, W., Cai, W., Xia, J., Chen, J., Liu, S., Dong, W., et al. (2014). Global Comparison of Light Use Efficiency Models for Simulating Terrestrial Vegetation Gross Primary Production Based on the LaThuile Database. Agric. For. Meteorol. 192-193, 108–120. doi:10.1016/j.agrformet.2014.03.007
Zapata, D., Rajan, N., Mowrer, J., Casey, K., Schnell, R., and Hons, F. (2021). Long-term Tillage Effect on With-In Season Variations in Soil Conditions and Respiration from Dryland winter Wheat and Soybean Cropping Systems. Sci. Rep. 11 (1), 2344. doi:10.1038/s41598-021-80979-1
Zhang, Q., Cheng, Y.-B., Lyapustin, A. I., Wang, Y., Zhang, X., Suyker, A., et al. (2015). Estimation of Crop Gross Primary Production (GPP): II. Do Scaled MODIS Vegetation Indices Improve Performance? Agric. For. Meteorol. 200, 1–8. doi:10.1016/j.agrformet.2014.09.003
Zhang, X. (2015). Reconstruction of a Complete Global Time Series of Daily Vegetation index Trajectory from Long-Term AVHRR Data. Remote Sens. Environ. 156, 457–472. doi:10.1016/j.rse.2014.10.012
Zheng, Y., Zhang, L., Xiao, J., Yuan, W., Yan, M., Li, T., et al. (2018). Sources of Uncertainty in Gross Primary Productivity Simulated by Light Use Efficiency Models: Model Structure, Parameters, Input Data, and Spatial Resolution. Agricultural and Forest Meteorology 263, 242–257. doi:10.1016/j.agrformet.2018.08.003
Zhou, Y., Zhang, L., Xiao, J., Chen, S., Kato, T., and Zhou, G. (2014). A Comparison of Satellite-Derived Vegetation Indices for Approximating Gross Primary Productivity of Grasslands. Rangeland Ecol. Manage. 67 (1), 9–18. doi:10.2111/rem-d-13-00059.1
Keywords: GPP, satellite remote sensing, vegetation index, SAVI, agroecosystems
Citation: Menefee D, Rajan N, Shafian S and Cui S (2022) Modeling Carbon Uptake of Dryland Maize Using High Resolution Satellite Imagery. Front. Remote Sens. 3:810030. doi: 10.3389/frsen.2022.810030
Received: 05 November 2021; Accepted: 14 February 2022;
Published: 14 March 2022.
Edited by:
Qiangqiang Yuan, Wuhan University, ChinaReviewed by:
Xiaobin Guan, Wuhan University, ChinaMichael Gomez Selvaraj, Consultative Group on International Agricultural Research (CGIAR), United States
Copyright © 2022 Menefee, Rajan, Shafian and Cui. This is an open-access article distributed under the terms of the Creative Commons Attribution License (CC BY). The use, distribution or reproduction in other forums is permitted, provided the original author(s) and the copyright owner(s) are credited and that the original publication in this journal is cited, in accordance with accepted academic practice. No use, distribution or reproduction is permitted which does not comply with these terms.
*Correspondence: Nithya Rajan, bnJhamFuQHRhbXUuZWR1
†Present address: Dorothy Menefee, Grassland Soil and Water Research Laboratory, USDA-ARS, Temple, Texas, United States
 Dorothy Menefee
 Nithya Rajan
 Sanaz Shafian
 Song Cui