 Samy I. Elmahdy
 Tarig A. Ali
- 1GIS and Mapping Lab (GISML), College of Engineering, American University of Sharjah, Sharjah, United Arab Emirates
- 2Department of Civil and Environmental Engineering, College of Engineering, American University of Sharjah, Sharjah, United Arab Emirates
Mangrove forests are an important indicator of blue carbon storage and biodiversity and provide several benefits to the environment. This study showed the first attempt to apply the canonical correlation forest (CCF) model to classify mangroves and monitor changes in the mangrove forests of the entire region. The CCF model obtained a satisfactory accuracy with an F1 score of more than 0.90. Compared to Sentinel-2, Landsat 8 exhibited good temporal resolution with relatively little mangrove details. The resultant mangrove maps (1990–2020) were used to monitor changes in mangrove forests by applying a threshold value ranging from +1 to −1. The results showed a significant increase in the UAE mangroves over the period from 1990 to 2020. To characterize soil in mangrove forests, a set of interpolated maps for calcium carbonate, salinity concentration, nitrogen, and organic matter content was constructed. The results showed that there is a positive relationship between mangrove distribution and the calcium carbonate, nitrogen, salinity, and organic matter concentrations in the soil of the mangrove forests. Our results are of great importance to the ecological and research community. The new maps presented in this study will be a good reference and a useful source for the coastal management organization.
1 Introduction
Mangrove forests are extensively distributed in the estuary and intertidal zones, and their forests cover thousands of hectares along with the coastal areas (Boto el al., 1984; Sherrod and McMillan, 1985; Field et al., 1998; Feller et al., 2003; Stringer et al. 2016). They form an essential component of the coastal ecosystem consisting of salt-tolerant plants with aerial breathing roots that supply a microenvironment to several marine species (Snedaker, 1982; Upadhyay and Mishra, 2008). Mangrove forests provide several benefits to the environment and the economy as they play a vital role in ecology. They provide a safe breeding ground and suitable environment for fish species and birds nesting (Fry and Cormier, 2011; Giri et al., 2011; Inoue et al., 2011; Barua et al., 2014).
Globally, mangrove forests are in deterioration due to coastal development, oil spill, aquaculture, climate change, and many other anthropogenic impacts (Ellison, 2000; FAO, 2007; Polidoro et al., 2010). In spite of this fact, the mangrove forests of the United Arab Emirates seem to have increased to some extent over the last 2 decades (Loughland et al., 2007; Elmahdy et al., 2020a). This is due to localized planting activities, water flow patterns, and conservation efforts (FAO, 2007). Particularly, terrain characteristics are one of the most significant factors that have a direct impact on the spatial distribution and productivity of the mangrove forests. The most common mangrove species in the UAE is Avicennia marina or gray mangrove, and its protection is consequently an urgent conservation priority (Figure 1).
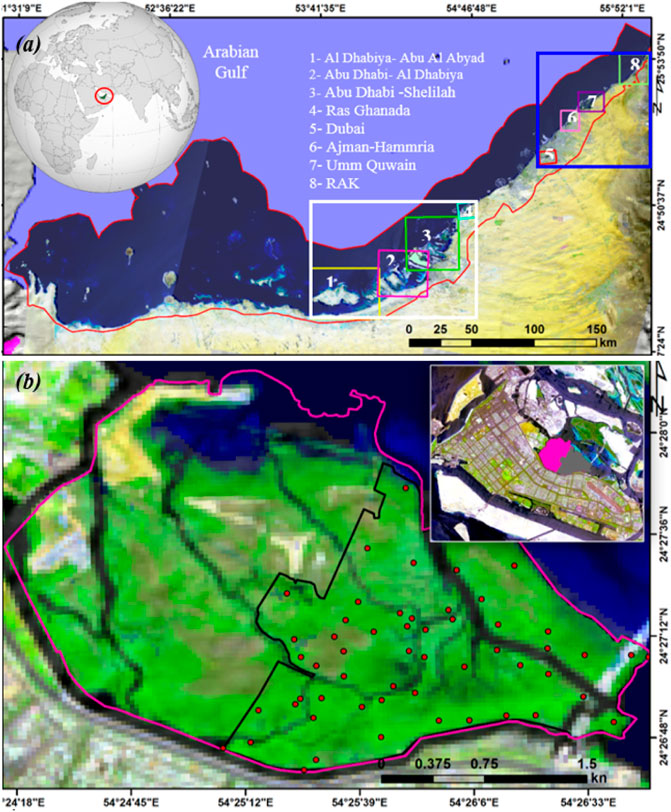
FIGURE 1. RGB 541 band combination of Landsat image of the UAE showing the spatial distribution of the UAE mangroves along the western coast of the UAE. Blue and white squares highlight NUAE and Abu Dhabi mangrove locations, respectively (A), and Abu Dhabi National Park (pink polygon). Red points highlight the spatial distribution of soil sample and validation locations (B).
Several studies reported that the soil texture was clay loam, rich with nitrogen and organic matter content and salinity (Datta and Deb, 2017; Ukpong, 1997). Locally, most of the previous studies have been conducted based on field surveys and measurements over a local scale with manual screen digitizing (Moore et al., 2015; Alsumaiti, 2014). However, the recent development of machine learning and the wide availability of free charge remote sensing data have demonstrated the efficiency of mapping and monitoring mangrove changes over multiple scales (Elmahdy and Mohamed, 2018; Elmahdy et al., 2021a,b). These tools could provide valuable information for natural resources specialists and ecologists (Li et al., 2018).
Mapping and monitoring changes in mangrove forests over a regional scale based on terrestrial measurements are economical and time-consuming and therefore not regularly updated. Cloud-free Landsat images, with a spatial resolution of 30 m and a higher temporal frequency, are particularly suitable for monitoring the mangrove forest changes over a regional scale comparing with Sentinel-2 and the Moderate Resolution Imaging Spectroradiometer (MODIS) images that are not available before 2001 (Holben, 1986; Vogelmann et al., 2016; Elmahdy and Mohamed, 2018; Li et al., 2018; Elmahdy et al., 2020a; Elnabwy et al., 2020a). One possible solution is the use of multitemporal Landsat images with a spatial resolution of 30 m. These images provide an efficient, economical, and consistent way to map and monitor changes in mangrove forests over a regional scale (Running et al., 1994; Cracknell, 1999; Marfai et al., 2008; Elmahdy and Mohamed, 2013; Pham et al., 2018; Elmahdy et al., 2020a).
There is a long history of using Landsat imageries for local and regional scales (Wulder et al., 2008; Kesgin and Nurlu, 2009; Hu et al., 2016; Li et al., 2018). These historical images offer a perspective into the past and assess the spatiotemporal portal pattern of change in the coastal system. Using this type of remote sensing data to map and monitor changes in LULC requires precise classifiers (Elmahdy et al., 2020a). For mapping and monitoring changes in mangrove forests, the common problems of misclassification are usually associated with the influence of seawater and a mixture of mangrove and non-mangrove areas within the study area (Elmahdy and Mohamed, 2013). To overcome the limitations, precise and overfitting of traditional classifiers are required (Gumusay et al., 2019; Pham et al., 2019). Locally, several researchers have studied and estimated the mangrove forests of the UAE from satellite images using manual screen digitizing (Embabi, 1993; Althausen et al., 2003; Saenger et al., 2004; Loughland et al., 2007; Alsumaiti, 2014). However, these techniques introduce bias and errors. Globally, several studies have been applied to map mangroves and seagrass.
Logistic model tree (LMT), weight majority voting (Mohamed et al., 2018), random forest (RF) (Elmahdy et al., 2020b,c), support vector machine (SVM) (Traganos and Reinartz, 2018; Poursanidis et al., 2019), artificial neural network (ANN) (Bonin-Font et al., 2016), AdaBoost rotation forests (RoF), and canonical correlation forests (CCFs) (Ha et al., 2020) are examples used till date for mangrove and seagrass mapping. The later classifiers have the ability to reduce the variance and overfitting and produced maps with an accuracy of over 90%. Among these classifiers, the canonical correlation forest (CCF) model was used to map and classify mangrove forests based on their density using Landsat data. It does not require optimal parameterization, which makes the model easy to use for mapping and classifying mangroves and seagrass (Ha et al., 2020). Thus, this study aims to monitor and classify mangrove forests using the CCF model over a regional scale. This study also aims to investigate the relationship between the spatial distribution of the mangrove forests and the physical and chemical properties and topography of the soil. The results of this study help in planning a suitable action of controlling the perfect ecosystem and future mangrove forest cultivation.
2 Datasets and Methods
2.1 Study Site
The study site, which stretches like a strip in shape, starts from Ras Al Khaimah in the northeast to Al Sal’a near the border with Saudi Arabia. It can be divided into three main parts. The first part is the Northern Emirates, which includes the Emirates of Dubai, Sharjah, Ajman, Umm Al Quwain, and Ras Al Khaimah, and has an area of about 2,622 km2 (Figures 1A, 2).
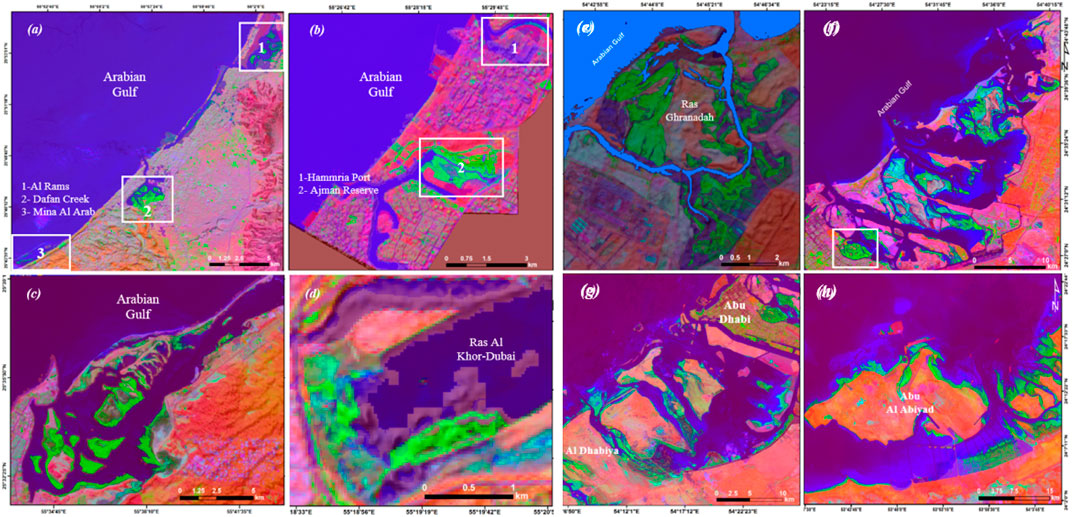
FIGURE 2. RGB 651 band combination of Landsat 8 image zooms enhanced by applying contrast starched showing the spatial distribution of the UAE mangroves in Ras Al Khaimah (A), Ajman–Al Hamriya (B), Umm Al Quwain (C), Ras Al Khor of Dubai (D), Ras Ghanada (E), Abu Dhabi–Al Saadiyat–Shelilah–Hanioura strip (F), Abu Dhabi–Al Dhabiya (G), and Al Dhabiya–Abu Al Abyad (H). White square highlights the location of Abu Dhabi National Park.
The second part includes the Emirate of Abu Dhabi, which comprises three regions: the Abu Dhabi region, which includes the nation’s capital Abu Dhabi; the eastern region, where Al Ain City lies; and the western region, where Liwa village lies. Here, our interest focuses on the coastal area of the capital of Abu Dhabi and the western region (Figures 1A, 2). Geomorphologically, the study site comprises evaporites and salt ponds in the west, alluvial deposits in the middle, and low sand dunes in the east. The mangrove forests are distributed in the intertidal parts of the Sabkha islands, Khor, ports, and tidal channels and assist in the conservation of the blue carbon ecosystem (Moore et al., 2015; Elmahdy et al., 2020d).
According to Alsumaiti (2014), there are three mangrove habitat types reported across the coastal area of the UAE: fringes, overwash, and basins. Fringe habitats are the coastal edge of the land and sea in the back bay that are subject to daily high tides where mangroves are relatively tall, and mature trees form a continuous linear band of mangrove forests. Fringe habitats also included shrubs and immature trees forming the same linear band of forests. Basin habitats occur in the interior of larger mangrove stands and frequently remain flooded for extended periods. These habitats were detected in the Emirates of Ajman and Fujairah, while the basin formation in the Emirate of Dubai is marginal.
These basins are characterized by stand height ranging from 3 to 5 m and percent cover from 68 to 90%. Overwash habitats were reported in the capital of Abu Dhabi, the Emirates of Sharjah (Khor Kalbah), Umm Quwain, and Ras Al Khaimah. These habitats are the shortest and least dense habitats. The latter habitats are the most exposed and regularly flooded, with stands regularly comprising particularly few trees.
2.2 Data and Image Preprocessing
Two remotely sensed data were used in this study. The first dataset was the Landsat Thematic Mapper (TM) acquired on 23 August 1990, the Landsat Enhanced Thematic Mapper (ETM+) acquired on 23 August 2000 and 19 August 2010, and the Operational Landsat Imager (OLI) Landsat 8 acquired on 15 August 2020 (Path 160, rows 42 and 43). We used the Landsat images due to their suitability spectral and spatiotemporal resolutions, free of charge, easy accessibility, and time-series availability (Chander et al., 2009; Irons et al., 2012; Elmahdy and Mohamed, 2018; Milani, 2018; Toosi et al., 2019). Moreover, Landsat images are provided in an orthorectification format at a lower level of cloud cover (Darvishsefat et al., 2011; Elmahdy et al., 2020a).
The second dataset includes the QuickBird images with a spatial resolution of 0.6 m acquired on 22 August 2020 and Sentinel-2 images with a spatial resolution of 10 m acquired on 13 August 2020. These various datasets were downloaded via the USGS Earth Resources Observations and Science (EROS) Center through the Global Visualization Viewer (www.glovis.usgs.gov). We used these various datasets for visual verification of the obtained mangrove maps and compared the textural features, mapped from Landsat images against those mapped from Sentinel-2 images using the CCF model.
Three types of remote sensing data were used in the study. The first type was a tile of cloudless Landsat 8 satellite images dating 23 August 2020 with a spatial resolution of 30 m. The second dataset was a single QuickBird image with a spatial resolution of 0.6 m acquired on 21 August 2020. The third dataset was the Sentinel-2 dating 13 August 2020. We used these various datasets to collect training datasets as input to the classifiers and visual verification of the obtained mangrove maps, and compare the textural features (mangrove and non-mangrove areas) mapped from Landsat images against those mapped from Sentinel-2 using CCF algorithm. These datasets were downloaded via the USGS Earth Resources Observations and Science (EROS) Center through the Global Visualization Viewer (www.glovis.usgs.gov).
As a first step of preprocessing, all bands were stacked, and the images were re-projected to UTM datum WGS zone N 40 and registered as an image to image with an RMSE of less than 0.6, followed by an atmospheric correction (Holben, 1986). The atmospheric correction was performed by Fast Line-of-Sight Atmospheric Analysis of Hypercubes (FLAASH) implemented in Envi v.4.6 software. This process consists of radiometric calibration and dark subtraction. In radiometric calibration and beta nought calibration, all DN values were converted into the top of the atmosphere (TOA). TOA was performed using four parameters, namely, calibration type (reflectance), output interleave (BSQ), output data type (float), and scale factor value of 1. In dark object subtraction, TOA was converted into surface reflectance (SR) using band minimum.
2.3 Methods
2.3.1 Field Data and Training Data Collections
We conduct field data collection by laying elementary sampling 20 × 20 m2 grid to report information on the soil in mangrove forests with geolocation of the center of each elementary unite sampling (Figure 1B). The field observation was conducted in the small portion of the National Park of the Emirate of Abu Dhabi (Figure 1B). The training data collection is a very important step in producing a higher quality of classification, especially when the classifiers are trained using training datasets with higher spatial resolutions (Elmahdy and Mohamed, 2018). To identify the end-members of pure mangrove in the training samples, the hourglass analysis method was performed.
The training datasets were collected from QuickBird images with a spatial resolution of 0.6 m (August 2020) using a straight random sampling or proportional method, which reduces error and bias. This method divides the population into homogenous groups and produces training sample sizes that are directly related to the size of the classes. We used this method due to its ability to reduce bias and errors (Van Niel et al., 2005; Elmahdy and Mohamed, 2018).
Random sampling collection was performed using Envi v.4.5 software. The frequency of collected samples was related to the 30 m pixel size of Landsat images and varied according to the spatial distribution and density of mangroves. The number of collected samples was 5–7 per pixel for meadow of high density of mangrove and decreased to 1–3 per pixel for patches of low density. The mangrove forests were classified into two classes: 1) dense mangroves which cover more than 80% of a meadow and 2) disperse mangroves which cover less than 80% of a meadow. A total of 536 samples were collected, with 420 and 116 for dense and disperse mangroves, respectively. The collected samples were divided into 375 (70%) for training and mangrove mapping and 161 (30%) for validation of this study. The collected training datasets were inspected using visual interpretation and knowledge and background of the authors and where they live.
2.3.2 Mangrove Mapping and Classification
To map mangroves in an accurate way over multiple scales, it is important to employ an ensemble of machine learning (ML) algorithms (Liu et al., 2019; Walsh, 2015; Dietterich, 2000; Elmahdy et al., 2020a; Elmahdy et al., 2021a). The canonical correlation forest (CCF) model, which is used in the literature, was applied. CCF generates a number of canonical correlation trees (CCTs) using canonical correlation analysis (CCA). The CCA (Hotelling, 1936) is a deterministic technique designed for calculating pairs of linear projections that maximize the correlation between the input data and the selected labels.
CCF starts with a root node comprising all the training data and each time a new split is nominated. This produces two new child nodes with each data points passed down to either the left or right child depending on what side of the split the data point falls. The model represents a supervised learning approach and thus requires training using labeled input pairs. During the training process, each tree in a CCF is trained independently by a self-similar and top down procedure using the full dataset. Once the model is trained, prediction can be carried out at arbitrary input points (Rainforth and Wood 2015).
In other talks, a random subset of the features is taken, but CCA with projection bootstrapping is used first to project the features into canonical space, with the set of split candidates corresponding to the unique partitions in the projected space (Figure 3). The selected partition then infers a hyperplane split that can be used directly at test time. The training of CCF has four parameters of node: the number of tree L, the number of features to sub-sample at each node λ, the impurity measure g, and the stopping criteria c. The model can be used for multiple output problems such as multivariate regression and can also deal with categorical inputs and missing data. The CCF overcomes the limitations and problems in random forest and rotation forest models by using carefully selected hyperplane splits instead, leading to a powerful classifier without parameter tuning that integrates correlation between the features. The CCF was chosen due to its high accuracy and does not require optimal parameterization (Ha et al., 2020). It offers similar accuracy with a lower number of trees, and thus can consume less processing time for the training step (Rainforth and Wood, 2015).
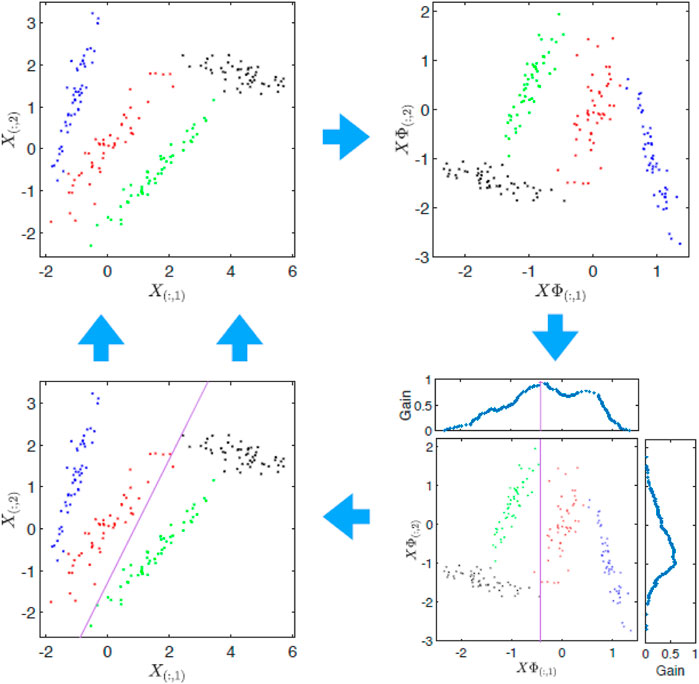
FIGURE 3. High-level demonstration of the CCT training process for a classification task (Rainforth and Wood, 2015).
Here, the CCF model was operated with 50, 100, 200, and 500 trees, and an optimal value was chosen based on the lowest rate of misclassification and the highest value of accuracy. The parametrization and performance of the CCF model were applied and tested in the MATLAB and R packages using the source codes of Rainforth and Wood (2015) and Elmahdy et al. (2020e). The CC outputs were converted to a CSV format for model validation.
2.3.3 Accuracy Assessment and Model Performance Evaluation
To assess and evaluate the model performance, three methods were performed. First, the textural features from the Landsat image (23 August 2020) maps were compared against those from Sentinel-2 images (13th August 2020) with a spatial resolution of 10 m. This method was applied to Umm Al Quwain natural reserve. Second, an accuracy assessment was performed using F1 score by converting the CC outputs (23/08/2020) into a CSV format. After that, all mangrove maps were standardized and compared based on a pixel by pixel producing numerical values for mangrove class commission, class omission, total incorrect pixels, percentage of incorrect pixels, precession, recall, and F1 score (Congalton et al., 1983; Raschka, 2018; Raschka and Mirjalili, 2019; Elmahdy et al., 2020a). These parameters were calculated based on true positive (TP), true negative (TN), false positive (FP), and false negative (FN). Accuracy, precision, recall, and F1 score were calculated via the following equations:
where po is the observed agreement ratio and pe is the expected agreement
where TP is the true positive, FP is the false positive, and FN is the false negative.
Third, each classification map (1990, 2000, 2010, and 2020) was assisted using a confusion matrix implemented in Envi. v.4.5 software. The confusion matrixes were built using regions of interest (ROIs) collected from QuickBird images (23 August 2020). These training datasets were divided into three different training data by subtracting training dataset of 2010 from 2020, 2000 from 2010, and 1990 from 2000, respectively. After that, a kappa, user’s, and producer’s accuracies were then calculated and kappa analysis was analyzed (Congalton et al., 1983; Congalton, 1991; Jensen, 1996; Foody 2002; Altan et al., 2004). These different methods can be considered an alternative method of field observation, especially when the mangrove forests are located in remote and inaccessible areas (Elmahdy and Mohamed, 2013; Elmahdy and Mohamed 2018; Estoque et al., 2018).
2.3.4 Change Detection
Among several change detection techniques, the image difference algorithm (ID) was chosen to monitor mangrove changes. The ID algorithm was chosen due to its ability to locate the changes in mangroves within each class (dense and sparse) (Mishra et al., 2017; Elmahdy and Mohamed, 2018). The threshold values are evenly spaced between (−1) and (+1) for simple difference (the initial state image is subtracted from the final state image). The positive changes (positive value) represent the first (n/2) classes, while the negative changes represent the last (n/2) classes. The no-change class ((n/2) +1) represents the middle class and normalizing the images (raster maps) by subtracting the image minimum. Monitoring the UAE mangrove changes was performed using a change detection tool implemented in the Envi v.4.5 software.
2.3.5 Characterizations of Soil in Mangrove Forests
To characterize mangrove forests, the National Park of Abu Dhabi (NPAD) was chosen (Figure 6). The main objective of terrain characterization is to investigate and understand the spatial relationship between the spatial distribution of mangrove forests and the topography and physical and chemical properties of soil. These characteristics include soil texture, organic matter content, soil salinity, nitrogen content, and calcium carbonate. This information was derived from soil analysis of 60 samples collected between 5 and 25 August 2020 using field measurements across the Mangrove National Park of Abu Dhabi, and provided from different sources such as the Civil and Environmental Department of College of Engineering and Environmental Agency of Abu Dhabi (https://www.ead.gov.ae) and previous studies (Alsumaiti, 2014). These various types of information were then imported into a GIS environment and converted into a raster format using the inverse distance weighted (IDW) algorithm implemented in ArcGIS v.10.5 software. The algorithm is an interpolator that has been widely used in several geological and hydrological studies. It determines the values of points based on a weighted combination of a group of selected points and takes into account the points closer to each other than the other distant points (Shepard, 1968). We employed the IDW interpolator because of its ease of use and containment of its outputs on a few errors (Shepard, 1968). The interpolated maps include soil texture, soil salinity, nitrogen content, organic content, and calcium carbonate content. The interpolated maps were then draped over mangrove maps extracted from 2020 Landsat images and spatial analysis was performed.
3 Results
3.1 Evaluation of the Performance
In the graph of evaluation metrics (Figure 4), the precision, recall, and F1 score for dense mangrove class values of the CCF model were high, more than 0.9, and greater than sparse mangrove class values. This may be appearing due to mixed sparse mangrove and seagrass in some portions near the Abu Dhabi–Al Dhabiya area.
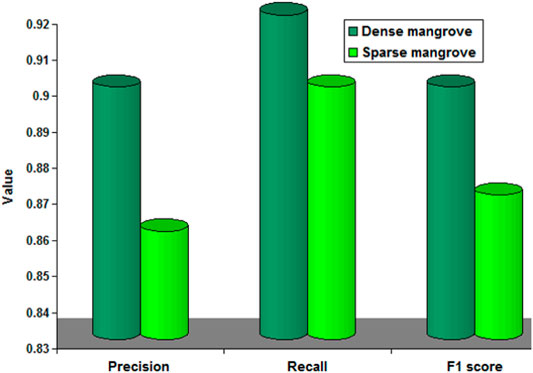
FIGURE 4. Precision, recall, and F1 scores for the Landsat image (23/08/2020) using the CCF model.
The accuracy assessment showed that the 2010 and 2020 mangrove maps yield overall accuracies of 90.12% and 96% and are much more than those of 1990 and 2000 (Table 1). This appears to be due to the greater quantization, enhanced signal-to-noise and sensitivity characteristics, and the lifetime of ETM+ and OLI detectors (Elmahdy and Mohamed 2018).
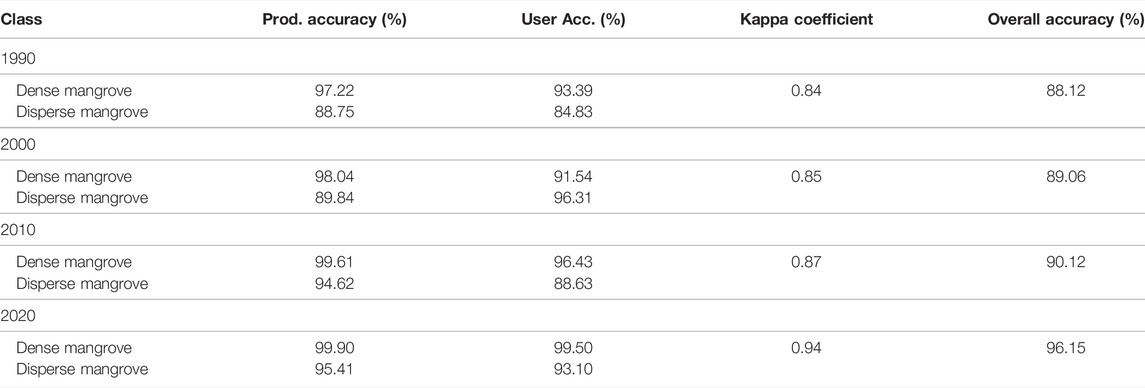
TABLE 1. Confusion matrices of the resulting mangrove maps (1990–2020).
Generally, the mangrove classification maps of 2020 are the best maps, which clearly exhibit the classification for each mangrove class with an overall accuracy of 96% by comparing textural features from Landsat images against those extracted from Sentinel-2 images with a spatial resolution of 10 m (Figure 5).
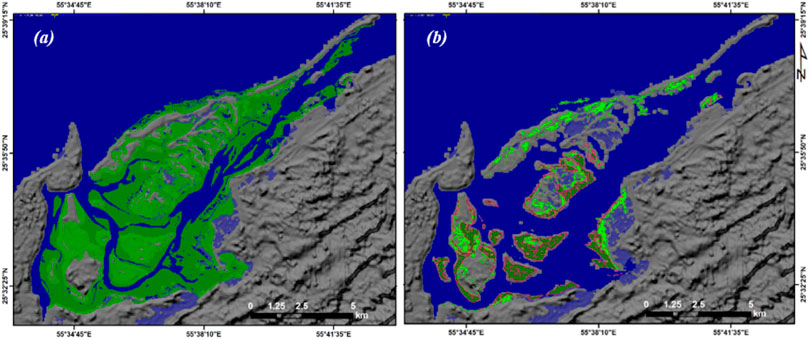
FIGURE 5. Mangroves extracted from the Sentinel-2 image (A) and those extracted from Landsat image (B) for the year 2020.
The results exhibit a strong agreement between textural features in Landsat images and those in Sentinel-2 with more details in Sentinel-2 due to differences in pixel size and characteristics of the two sensors.
3.2 Mapping and Classification of the NUAE Mangroves
Maps of mangrove classification obtained from the Landsat images using the CCF model with 200 trees as an optimal value for the CCF model are shown in Figures 8–12. Each map consists of two color codes to enhance visual interpretation. The maps exhibit that the mangroves are mostly spatially distributed along the edges of creeks, ports, and tidal channels of the western coastal area of the UAE, which represent about 90% of the total area of the UAE mangroves (Elmahdy and Mohamed, 2013; Elmahdy et al., 2020a). The classified mangroves extend successfully detected areas of mangroves that were increased in the map of Elmahdy et al. (2020a).
Over the period from 1990 to 2020, disperse mangroves were much more than dense mangroves. In the NUAE (Figures 6–8), the highest spatial distribution of mangrove forests was observed in Ras Al Khaimah (RAK), covering an area ranging from 40 km2 in 1990 to more than 40 km2 in 2020 (Figures 6A, 8). The smallest spatial distribution of mangroves was observed at Ajman–Al Hamriya and Ras Al Khor of Dubai covering an area ranging from 170 m2 in 2000 to 1.7 km2 in 2020 (Figures 7A, 8). In RAK, there is a gradual increase in dense and disperse mangroves over the period from 1990 to 2020. The estimated dense mangrove increased from 3.94 km2 in 1990 to 11.41 in 2020 (Figures 6A, 8). Similarly, the dispersed mangroves increased from 1.64 km2 in 1990 to 27.55 km2 in 2020. In Umm Al Quwain estuarine, dispersed mangroves occupied an area of 4.20 km2 in 1990, 4.8 km2 in 2000, and 8.28 km2 in 2020 (Figures 6B, 8).
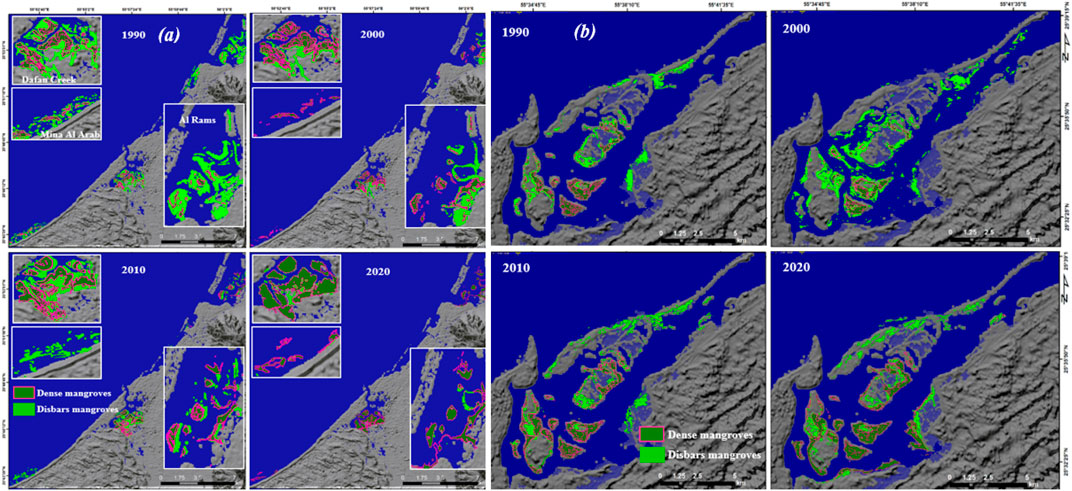
FIGURE 6. Spatiotemporal variation of mangrove forests on the coastal area of RAK (A) and Umm Al Quwain (B) for the years from 1990 to 2020.
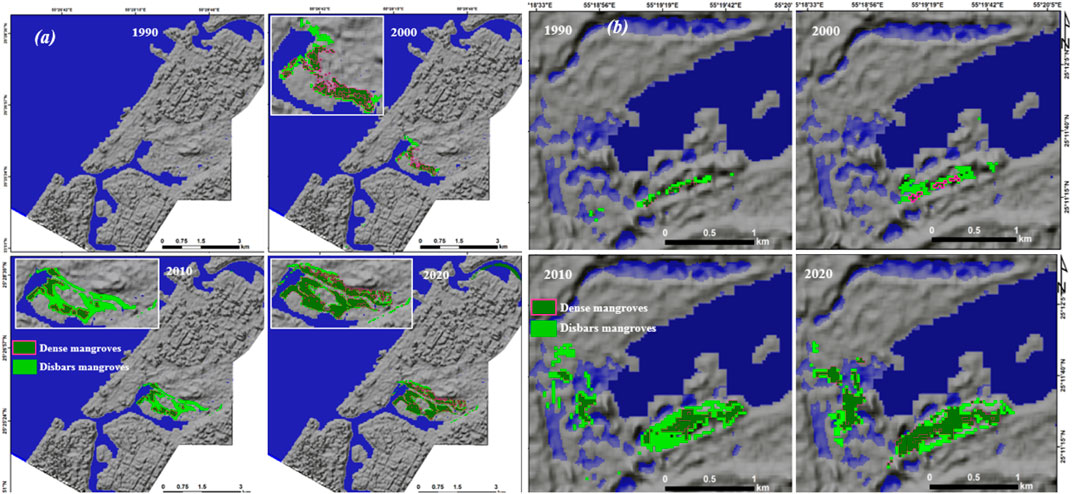
FIGURE 7. Spatiotemporal variation of mangrove forests on the coastal area of Ajman–Al Hamriya creeks (A) and Ras Al Khor of Dubai (B) for the years from 1990 to 2020.
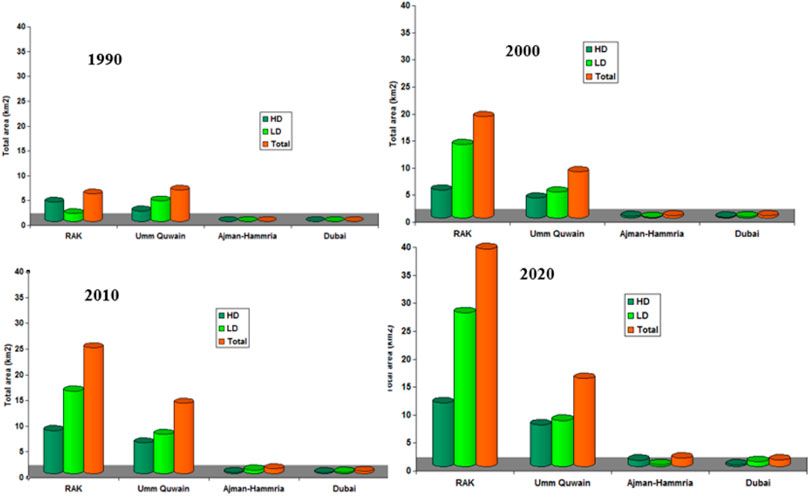
FIGURE 8. Annual rate of the NUAE mangrove growth (classes and total area in km2) during the period from 1990 to 2020.
Similarly, the dense mangrove that occupied an area of 2.14 km2 in 1990 increased to 3.71 km2 in 2000, 6 km2 in 2010, and 7.49 km2 in 2020. In 2020, the total area of mangroves (dense and dispersed) increased, occupying an area of 15.77 km2. In Ajman and Al Hamriya Creeks, there were no mangroves observed in 1990 (Figure 7A). Between 1990 and 2000, the mangroves were observed, occupying an area of 0.43 km2 (Figures 7A, 8). In 2010, dense and dispersed mangroves occupied an area of 0.26 and 0.71 km2, respectively. Similar to the Ajman–Al Hamriya area, no patch of mangroves has been observed in Ras Al Khor of Dubai in 1990 (Figures 7B, 8). Since 2000, mangroves have gradually increased from 0.42 km2 in 1990 to 1.77 km2 in 2020 (Figures 7B, 8).
In the NUAE, the mangrove area was extremely small in Ajman–Al Hamriya in the 4 years, with values of 00,0.42, 0.64, and 1.77 km2 in 1990, 2000, 2010, and 2020, respectively (Figures 6–8). In Abu Dhabi (Figures 9, 10), the largest spatial distribution of mangrove forests was observed in the strip stretches from Ras Ghanadah to the city of Abu Dhabi, covering an area of about 173 km2 (Figures 9A, 11). In Ras Ghanadah, dense mangroves increased from 0.36 km2 in 1990 to 13.77 and 15.49 km2 in 2010 and 2020, respectively (Figures 9A, 11). Similarly, disperse mangroves increased from 1.43 km2 in 1990 to 31.81 and 33.3 km2 in 2010 and 2020, respectively. The smallest spatial distribution of mangroves was observed at the strips of Abu Dhabi–Al Dhabiya and Al Dhabiya–Abu al Abyad in the west, covering an area of 57 km2 (Figures 10A, 11).
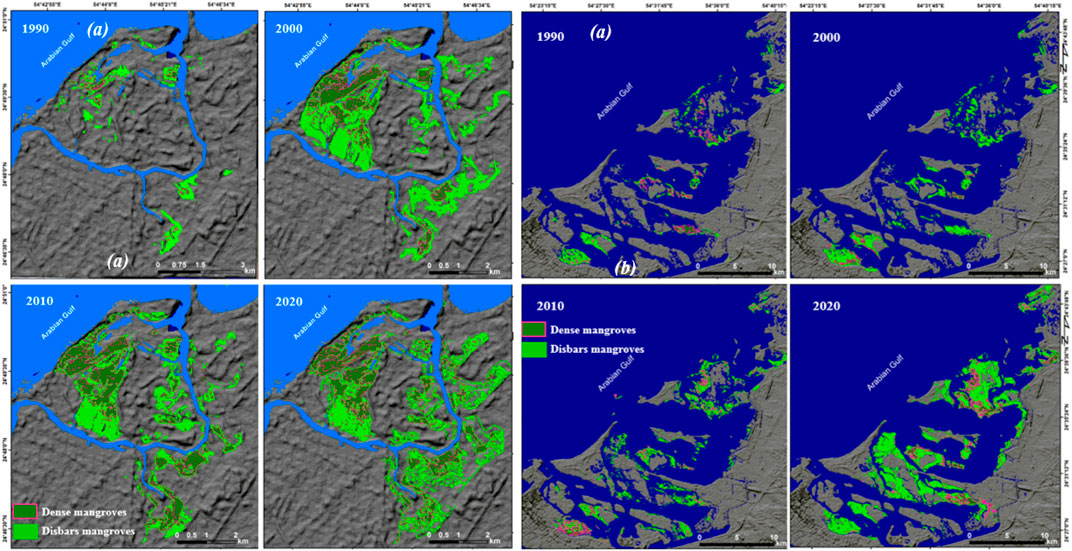
FIGURE 9. Spatiotemporal variation of mangrove forests on the coastal area of Ras Ghanada (left) and Abu Dhabi–Saadiyat–Shlelia strip (right) for the years from 1990 to 2020.
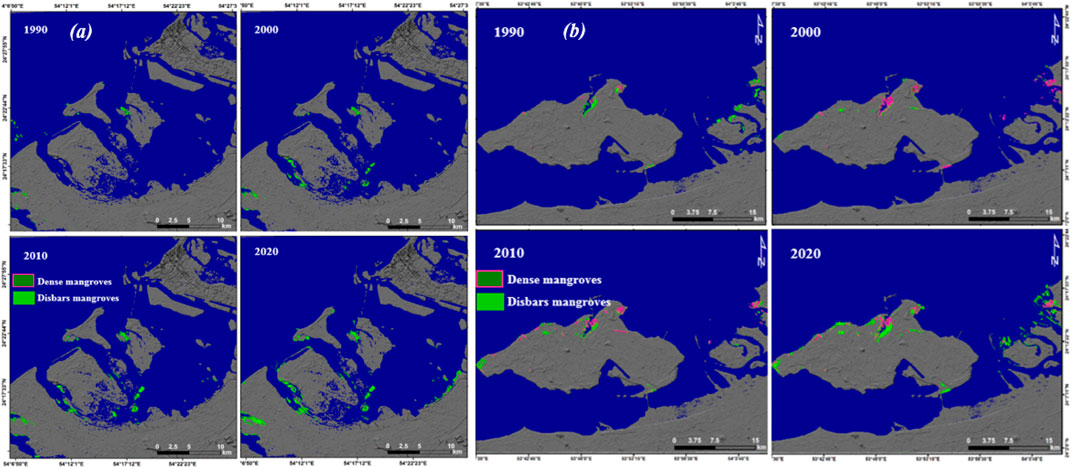
FIGURE 10. Spatiotemporal variation of mangrove forests on the coastal area of Abu Dhabi–Al Dhabiya strip (A) and Al Dhabiya–Abu Al Abyad strip (B) for the years from 1990 to 2020.
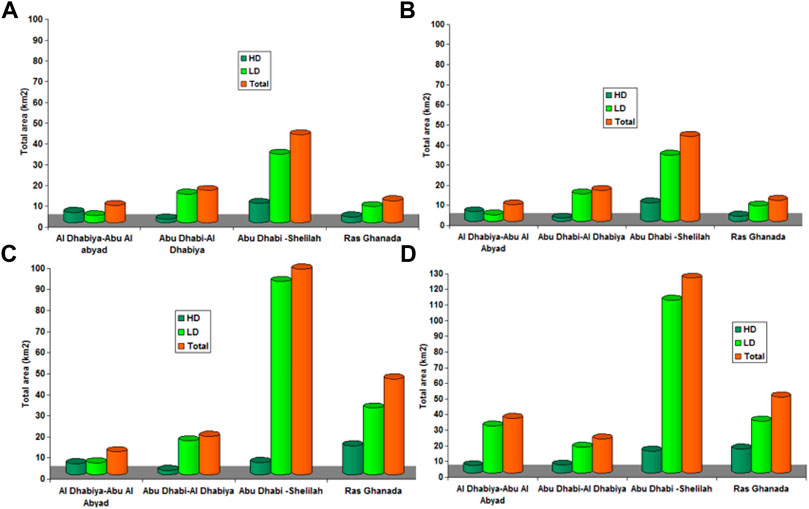
FIGURE 11. Annual rate of Abu Dhabi mangrove growth (classes and total area in km2) during the period from 1990 to 2020.
The estimated total area increased from 1.79 km2 in 1990 to 48.79 km2 in 2020. In the strip of Abu Dhabi–Shelilah, the largest area of mangroves (dense and dispersed) across the UAE was observed (Figures 9A, 11).
Dense mangroves increased from 6.39 km2 in 1990 to 124.69 km2 in 2020. Dispersed mangroves increased from 30 km2 in 1990 to 91.86 and 110.53 km2 in 2010 and 2020, respectively (Figure 8).
In the Abu Dhabi–Al Dhabiya strip, the linear mangroves and the smallest area of mangroves in Abu Dhabi were observed. Dense mangroves increased from 0.4 km2 in 1990 to 16.23 and 16.73 km2 in 2010 and 2020, respectively (Figures 10B, 11). Further to the west, where the cultivation of mangroves increased in Abu al Abyad island, mangroves increased from 4.72 km2 in 1990 to 35 km2 in 2020 (Figures 10B, 11).
3.3 Mangrove Changes Detection
The differences of the four images (1990, 2000, 2010, and 2020) for the NUAE mangroves and their graphical representation can be seen in Figures 12, 13A. Mangrove areas along the coastal strip of the NUAE were estimated to be about 11.92, 28.06, 39.54, and 57.41 km2 in 1990, 2000, 2010, and 2020, respectively (Figures 12A, 13). Particularly, the strip exhibited a gradual increase of about 16.14, 11.48, and 17.87 km2 over the periods 1990–2000, 2000–2010, and 2010–2020, respectively.
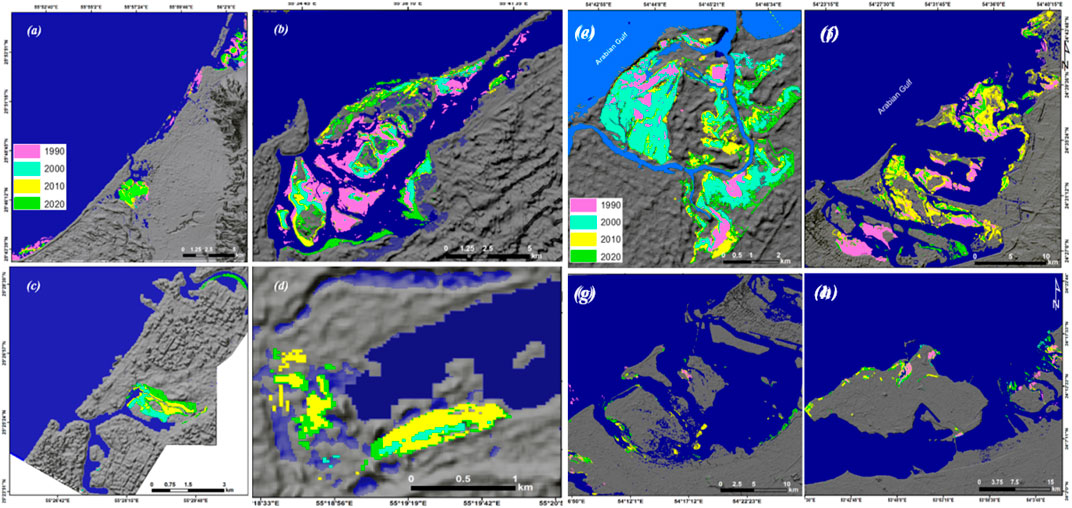
FIGURE 12. Mangrove pattern change between 1990 and 2020 for the natural reserves of RAK (A), Umm Al Quwain (B), Ajman–Al Hamriya (C), Ras Al Khor of Dubai (D), Ras Ghandah (E), Abu Dhabi–Saadiyat–Shlelia strip (F), Abu Dhabi–Al Dhabiya strip (G), and Al Dhabiya–Abu Al Abyad strip (H).
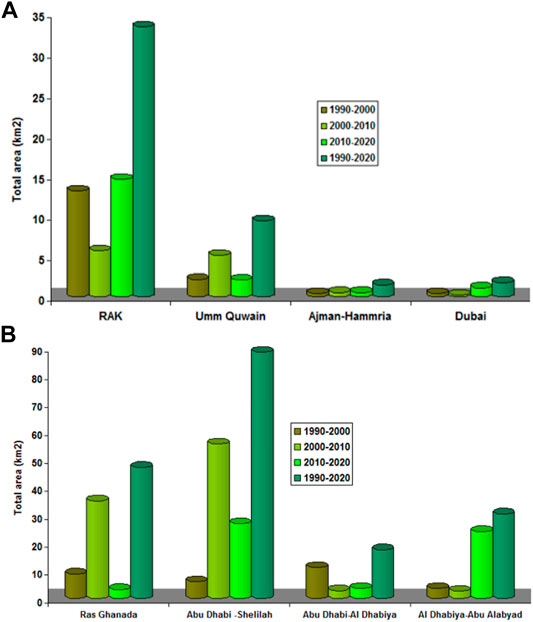
FIGURE 13. Graphical representation of the mangrove forests of the NUAE forests (A) and Abu Dhabi extent from 1990 to 2020 (in km2).
The highest rate of mangrove changes was observed in the RAK and Umm Al Quwain areas (Figures 12A,B, 13). From 1990 to 2020, a net increase of about 33.38 km2 mangroves was observed in RAK (north). In Umm Al Quwain natural reserve, a net increase of about 9.43 km2 mangroves was reported during the period from 1990 to 2020 (Figures 12B, 13).
Moving to the Abu Dhabi mangrove forest, the highest rate of mangrove changes was observed in the Abu Dhabi–Shelilah strip and Ras Ghanadah (Figures 12E,F, 13), while the lowest rate of mangrove changes was observed in the Abu Dhabi–Al Dhabiya strip (Figures 12G, 13). The moderate changes in the mangrove forests were observed in Al Dhabiya–Abu al Abyad (Figures 12H, 13).
In the Abu Dhabi–Shelilah strip, mangroves increased about 5.98, 55.4, and 26.92 km2 during the periods 1990–2000, 2000–2010, and 2010–2020, respectively (Figures 12F, 13). Over the period from 1990 to 2020, the mangrove increased by about 88.3 km2. In Al Dhabiya–Abu al Abyad, where the localized plantation activities are high, the mangrove increased by about 3.65 km2 from 1990 to 2000, 2.66 km2 from 2000 to 2010, and 24.04 km2 from 2010 to 2020 (Figures 12H, 13).
The lowest rate of mangrove changes was observed in Ajman–Al Hamriya and Ras Al Khor of Dubai with a net of 1.51 and 1.77 km2 mangroves, respectively (Figures 12C,D, 13). In the NUAE, the spatial pattern of mangrove forests distribution transformed from fragmented to aggregated.
3.4 Characterization of Soil in Mangrove Forests
The results of soil and terrain analysis indicated that dense mangroves are concentrated at an elevation of about 2 m (a.s.l) of the mudflats, while dispersed mangroves are distributed at an elevation of about 1 m (at the edges of the mudflats) (Figure 14). The results also show that the mangroves are spatially distributed among tidal channels with a slope of about 35° (Figures 15A,B). The spatial patterns of tidal inundation further influence soil characteristics that control the spatial distribution of soil salinity and mangrove forests (Saha and Choudhury, 1995). As the number of tidal channels increases, the spatial distribution of mangroves increases (Figure 15B).

FIGURE 14. Zoom of the QuickBird image for Abu Dhabi mangrove (A), shaded relief generated from the ALOS DEM (B), and topographic profile (C) showing the spatial relationship between topography of mudflat and distribution of mangroves.
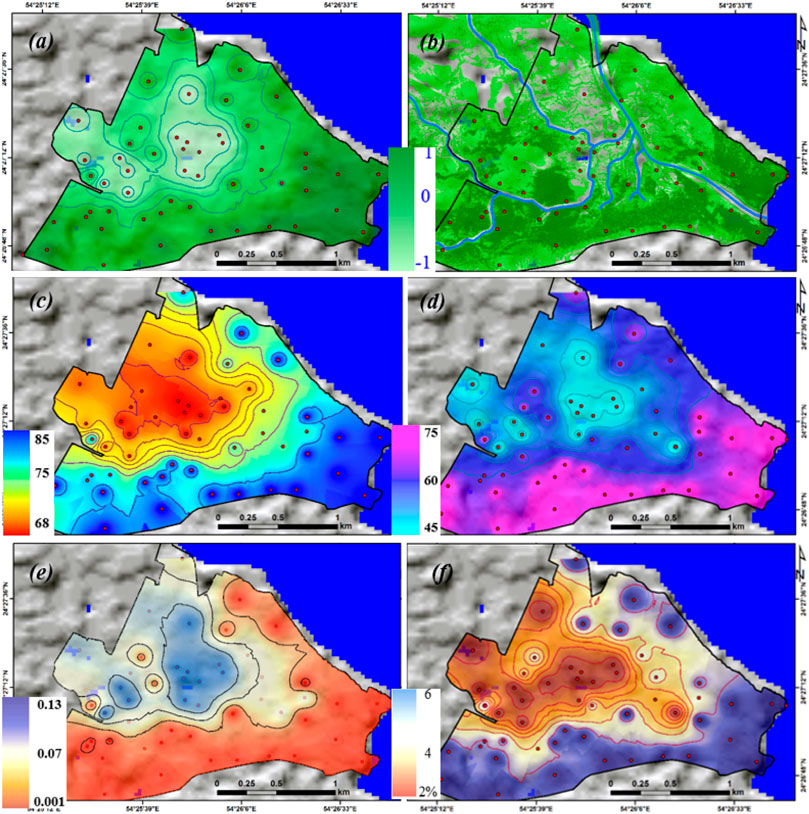
FIGURE 15. Mangrove classes of the study site (A), tidal channels in mangrove forest (B), interpolated maps showing the spatial variation of CaCO3 and salinity concentrations (C,D), and nitrogen and organic matter content (%) in soil mangrove forests (E,F), respectively.
The texture of mudflats, where the mangroves are distributed, is spatially changing from clay loam and light clay at the topsoil to sand at the bottom soil. In other words, the common soil texture ranges from light clay and clay loam at depth of up to 50 cm, while at 50–100 cm depth, loamy sand and sand are the main types of soil texture (Loughland et al., 2007; Alsumaiti, 2014; Shahid et al., 2014; Lacerda et al., 2016). Soils with loamy clay and light clay textures have very high porosity and low permeability.
This low permeability keeps the seawater in soil for a long period of time. Mangrove forests are frequently enclosed and protected environments with low-energy waters, which is favorable for the sedimentation of clay particles (Cintron and Schaerffer-Novelli, 1983).
The results of the chemical analysis of soil indicate that the CaCO3 percentage in mangrove soil is extremely high and ranges from 68 to 88%. This may be due to the high accumulation of seashells and marine organisms’ skeletons. The high concentration of CaCO3 in mangrove soil means that this soil can absorb more acid, which leads to high buffering capacity and stabilizes the pH. Furthermore, the concentration of CaCO3 in mangrove soil leads to losing most of it through volatilization (Jones, 2007). The importance of pH structure of mangroves has been investigated by Wakushima et al. (1994a,b).
By comparing the map of mangrove classes, the result exhibits that there is a positive relationship between mangrove density and CaCO3 concentration in soil (Figure 15C). The soil salinity of mangroves in the study area is extremely saline (>40 dSm−1) and changes slightly at depth, which may restrict the mangrove growth (Figure 15D). There is a positive spatial relationship between dense mangroves and soil salinity. It is observed that tidal inundation influences soil salinity in mangrove forests. Abu Dhabi mangroves have a very high salt tolerance, can absorb higher concentrations of salts, and adapt to harsh environmental conditions (Alsumaiti, 2014).
The total nitrogen content in mangrove soil ranges from 0.004 to 0.13 mg kg−1 (Figure 15E). This nitrogen is very important for mangrove growth and can be spatially associated with organic-rich mud (Galitz et al., 2021). The low nitrogen content was found to be in non-mangroves because the area tends to be sandy soil and it has low nutrient content (Bengen et al., 1995). Total nitrogen content values observed ranged from 0.09 to 0.97% (Rambok et al., 2010). In the same context, organic matter contents of the mangrove soils are spatially varied in Abu Dhabi mangrove forests, with the organic matter content values ranging from 2 to 6%. Areas with the highest mangrove population have the highest organic matter and nitrogen content (Figures 15E,F). Globally, organic matter in soil of some mangrove forests has been found to be more than 10% (Sukardjo 1994; Rambok et al., 2010), indicating the peaty nature of the soil. However, less than 1% of organic matter reflects the poor nutritional condition of the soil in some mangrove forests (Hossain et al., 2012).
4 Discussion
So far, this study is the first attempt to classify and monitor mangrove changes and characterize the soil of the UAE mangroves. The resulting maps yield high precision and recall. High recall means that the CCF classifier is able to find all possible mangroves, while high precision means the classifier is able to discriminate the pixels of mangroves precisely. The final values of recall and precision can be given using the F1 score to evaluate a classifier’s performance. Overall, the accuracy assessment demonstrates that CCF is a good performer with a high F1 score and confirms the robustness of machine learning in comparison to the traditional classifiers. This classifier required full atmospheric correction.
Among several values of trees, the value of 200 trees is an optimal value for mapping and classifying mangroves. This value introduces very low computational time-consuming and testing runs. The overall accuracy using the confusion matrix exhibited that the CCF classifier performs better on Landsat 8 (OLI) much better than those of TM and ETM+. The estimated overall accuracy was more than 95%. In another mangrove study, the estimated overall accuracy was 86% using the support vector machine (SVM) classifier applied to Landsat TM (Elnabwy et al., 2020a).
Ensemble machine learning classifiers involve canonical correlation forests (CCFs) with more traditional classifiers such as maximum likelihood and support vector machine (SVM) (Ha et al., 2020). Comparing to the other machine learning classifiers such as random forest (RF) and boosted regression tree (BRT), the CCF model showed the highest accuracy (Elmahdy et al., 2020a; Ha et al., 2020). The CCF classifier based on several studies achieved to compare the performance of the CCF against other model applications in the groundwater potential mapping, land subsidence, and flash floods (Elmahdy et al., 2020d,e; Elmahdy et al., 2021a,b).
The results revealed a significant increase in mangrove forests of RAK and Umm Al Quwain (in the NUAE) and Abu Dhabi–Saadiyat–Shlelia strip and Ras Ghanadah (in Abu Dhabi). This appears due to localized plantation activities and increased public awareness and conservation efforts during the last decade (FAO, 2007; Loughland et al., 2007; Elmahdy et al., 2020a). Moreover, the physical and chemical properties of soil in mangrove forests play a vital role in these rapid changes over 30 years. The soil in mangrove forests is graded soil that starts with fine grains at the top such as loamy clay and light clay and ends with coarse grains at the bottom such as sand. This finding agrees well with Lacerda (2002), who reported that the soil in mangrove forests is a result of mud development over a long period in different phases under tidal effects and deposition of wind-borne materials. This soil is characterized by a high concentration of the salts resulting from high frequency and duration of tidal inundation, very high temperature, high rate of evaporation, and very low precipitation in the study area (Shahid et al., 2014). In general, there is a spatial variation in texture, soil salinity, nitrogen, and organic content at different depths (Ferreira et al., 2010). Most of the mangrove species had an optimum pH range except Avicennia marina, which occurred in varied pH conditions (Joshi and Ghose 2003).
Despite a lower accuracy of the dispersal than dense mangrove classification, the CCF exhibits a powerful model for mapping and classification of mangroves in an arid region. Our resulting mangrove maps attest to the reliable application of the CCF classifier for precise mapping of the UAE mangroves over a regional scale with low-cost and time-consuming manners. The use of free-of-charge remote sensing data and open source machine learning algorithms in PythonTM and MATLAB environments is reliable in mapping over a regional scale. Our results greatly help ecologists and environmental engineers for a better understanding of the spatial relationship between mangrove distribution and physical and chemical properties of soil in mangrove forests. Future work will be carried out to map and monitor changes in mangroves using deep learning approaches and very high spatial resolution images such as QuickBird (0.6 m) and WorldView (0.3 m) or 1-m resolution DEM derived from ALS LIDAR data (Pham et al., 2019).
5 Conclusion
The current study presents an integrated approach, which uses remote sensing and GIS to classify, monitor changes, and characterize soil in mangrove forests. The CCF classifier was chosen to map and classify mangroves for the first time. The resulting mangrove maps were then used to monitor changes in mangrove forests using image difference algorithm implemented in Envi v.4.5 software. The results revealed that a significant increase in mangrove forests was observed over the period from 1990 to 2020. The largest portions of mangroves were observed in RAK and Umm Al Quwain (in the NUAE) and Abu Dhabi–Shelilah strip and Ras Ghanadah (in Abu Dhabi). These appear to be due to localized plantation activities and increased public awareness and conservation efforts. The topography and physical and chemical properties of soil in mangrove forests have an important impact on the spatial distribution of mangroves. The dense mangroves grow in the area between tidal channels and edges of mudflats. The results revealed that there is a positive relationship between mangrove distribution and N, CaCO3, salinity, and organic matter concentrations in the soil of mangrove forests.
Data Availability Statement
The raw data supporting the conclusion of this article will be made available by the authors, without undue reservation.
Author Contributions
SE: data process and RF development. TA: supervisor of the project and data provider.
Funding
The research has received funding under financial grant SCRI 18 Grant EN0-284.
Conflict of Interest
The authors declare that the research was conducted in the absence of any commercial or financial relationships that could be construed as a potential conflict of interest.
Publisher’s Note
All claims expressed in this article are solely those of the authors and do not necessarily represent those of their affiliated organizations, or those of the publisher, the editors, and the reviewers. Any product that may be evaluated in this article, or claim that may be made by its manufacturer, is not guaranteed or endorsed by the publisher.
References
Alsumaiti, T. S. (2014). An Assessment of Avicennia marina Forest Structure and Aboveground Biomass in Eastern Mangrove Lagoon National Park, Abu Dhabi. The Arab World Geographer 17 (2), 166–185.
Althausen, J. D., Kendall, C. G. S. T. C., Lakshmi, V., Alsharhan, A. S., and Whittle, G. L. (2003). “Using Satellite Imagery and GIS in the Mapping of Coastal Landscapes in an Arid Environment: Khor Al Bazam, Western Abu Dhabi, United Arab Emirates,” in Desertification in the Third Millennium (Rotterdam: AA Balkema/Swets&Zeitlinger).
Barua, S., Karim, E., and Humayun, N. M. (2014). Present Status and Species Composition of Commercially Important Finfish in Landed Trawl Catch from Bangladesh marine Waters. Int. J. Pure Appl. Zoolog. 2 (2), 150–159.
Bengen, D. R., Widodo dan, S., and Haryadi, (1995). Tipologi Fungsional Komunitas Makrozoobeihntos Sebagai Indikator Perairan Pesisir Muara Jaya, Bekasi. Laporan Penelitian. Bogor: Lembaga Penelitian IPB.
Bonin-Font, F., Campos, M. M., and Codina, G. O. (2016). Towards Visual Detection, Mapping and Quantification of Posidonia Oceanica Using a Lightweight AUV**This Work Is Partially Supported by Ministry of Economy and Competitiveness under Contracts TIN2014-58662-R, DPI2014-57746-C3-2-R and FEDER Funds. IFAC-PapersOnLine 49, 500–505. doi:10.1016/j.ifacol.2016.10.485
Boto, K. G., Bunt, J. S., and Wellington, J. T. (1984). Variations in Mangrove forest Productivity in Northern Australia and Papua New Guinea. Estuarine, Coastal Shelf Sci. 19 (3), 321–329. doi:10.1016/0272-7714(84)90028-3
Chander, G., Markham, B. L., and Helder, D. L. (2009). Summary of Current Radiometric Calibration Coefficients for Landsat MSS, TM, ETM+, and EO-1 ALI Sensors. Remote sensing Environ. 113 (5), 893–903. doi:10.1016/j.rse.2009.01.007
Cintron, G., and Schaerffer-Novelli, (1983). Introduction a la Ecologia del Manglar. Rostlac, San JaunPuerto Rico, 109.
Congalton, R. G. (1991). A Review of Assessing the Accuracy of Classifications of Remotely Sensed Data. Remote sensing Environ. 37 (1), 35–46. doi:10.1016/0034-4257(91)90048-b
Congalton, R. G., Oderwald, R. G., and Mead, R. A. (1983). Assessing Landsat Classification Accuracy Using Discrete Multivariate Analysis Statistical Techniques. Photogrammetric Eng. remote sensing 49 (12), 1671–1678.
Cracknell, A. P. (1999). Remote Sensing Techniques in Estuaries and Coastal Zones an Update. Int. J. Remote Sensing 20 (3), 485–496. doi:10.1080/014311699213280
Darvishsefat, A. A., Abbasi, M., and Schaepman, M. E. (2011). Evaluation of Spectral Reflectance of Seven Iranian rice Varieties Canopies. J. Agric. Sci. Technology (Jast) 13, 1091–1104.
Datta, D., and Deb, S. (2017). Forest Structure and Soil Properties of Mangrove Ecosystems under Different Management Scenarios: Experiences from the Intensely Humanized Landscape of Indian Sunderbans. Ocean Coastal Management 140, 22–33. doi:10.1016/j.ocecoaman.2017.02.022
Ellison, A. M. (2000). Mangrove Restoration: Do We Know Enough? Restoration Ecol. 8 (3), 219–229. doi:10.1046/j.1526-100x.2000.80033.x
Elmahdy, S., Ali, T., and Mohamed, M. (2020b0). Flash Flood Susceptibility Modeling and Magnitude Index Using Machine Learning and Geohydrological Models: A Modified Hybrid Approach. Remote Sensing 12 (17), 2695. doi:10.3390/rs12172695
Elmahdy, S., Ali, T., and Mohamed, M. (2021a). Hydrological Modeling of Ar Rub Al Khali, Arabian Peninsula: A Modified Remote Sensing Approach Based on the Weight of Hydrological Evidence. Geocarto Int., 1–21. (just-accepted). doi:10.1080/10106049.2021.1936211
Elmahdy, S., Ali, T., and Mohamed, M. (2021b). Regional Mapping of Groundwater Potential in Ar Rub Al Khali, Arabian Peninsula Using the Classification and Regression Trees Model. Remote Sensing 13 (12), 2300. doi:10.3390/rs13122300
Elmahdy, S. I., Ali, T. A., Mohamed, M. M., Howari, F. M., Abouleish, M., and Simonet, D. (2020a). Spatiotemporal Mapping and Monitoring of Mangrove Forests Changes from 1990 to 2019 in the Northern Emirates, UAE Using Random forest, Kernel Logistic Regression and Naive Bayes Tree Models. Front. Environ. Sci. 8, 102. doi:10.3389/fenvs.2020.00102
Elmahdy, S. I., Ali, T. A., Mohamed, M. M., and Yahia, M. (2020d). Topographically and Hydrologically Signatures Express Subsurface Geological Structures in an Arid Region: a Modified Integrated Approach Using Remote Sensing and GIS. Geocarto Int., 1–21. doi:10.1080/10106049.2020.1801858
Elmahdy, S. I., Mohamed, M. M., Ali, T. A., Abdalla, J. E. D., and Abouleish, M. (2020e). Land Subsidence and Sinkholes Susceptibility Mapping and Analysis Using Random forest and Frequency Ratio Models in Al Ain, UAE. Geocarto Int., 1–17. doi:10.1080/10106049.2020.1716398
Elmahdy, S. I., and Mohamed, M. M. (2013). Change Detection and Mapping of Mangrove Using Multi-Temporal Remote Sensing Data: a Case Study of Abu Dhabi, UAE. J. Geomatics 7 (1), 41–45.
Elmahdy, S. I., and Mohamed, M. M. (2018). Monitoring and Analysing the Emirate of Dubai's Land Use/land Cover Changes: an Integrated, Low-Cost Remote Sensing Approach. Int. J. Digital Earth 11 (11), 1132–1150. doi:10.1080/17538947.2017.1379563
Elmahdy, S., Mohamed, M., and Ali, T. (2020c). Land Use/Land Cover Changes Impact on Groundwater Level and Quality in the Northern Part of the United Arab Emirates. Remote Sensing 12 (11), 1715. doi:10.3390/rs12111715
Elnabwy, M. T., Elbeltagi, E., El Banna, M. M., Elshikh, M. M. Y., Motawa, I., and Kaloop, M. R. (2020a). An Approach Based on Landsat Images for Shoreline Monitoring to Support Integrated Coastal Management-A Case Study, Ezbet Elborg, Nile Delta, Egypt. Ijgi 9 (4), 199. doi:10.3390/ijgi9040199
Embabi, N. S. (1993). “Environmental Aspects of Geographical Distribution of Mangrove in the United Arab Emirates,” in Towards the Rational Use of High Salinity Tolerant Plants, Volume 1. Editors H. Leith, and A. Al Masoom (Dordrecht, The Netherlands: Kluwer Academic Publishers), 45–58. doi:10.1007/978-94-011-1858-3_5
Estoque, R. C., Pontius, R. G., Murayama, Y., Hou, H., Thapa, R. B., Lasco, R. D., et al. (2018). Simultaneous Comparison and Assessment of Eight Remotely Sensed Maps of Philippine Forests. Int. J. Appl. earth observation geoinformation 67, 123–134. doi:10.1016/j.jag.2017.10.008
FAO (2007). The World's Mangroves 1980-2005. FAO Forestry Paper No. 153. Rome. Forest Resources Division, FAO, 77.
Feller, I. C., Whigham, D. F., McKee, K. L., and Lovelock, C. E. (2003). Nitrogen Limitation of Growth and Nutrient Dynamics in a Disturbed Mangrove forest, Indian River Lagoon, Florida. Oecologia 134 (3), 405–414. doi:10.1007/s00442-002-1117-z
Ferreira, T. O., Otero, X. L., de Souza Junior, V. S., Vidal-Torrado, P., Macías, F., and Firme, L. P. (2010). Spatial Patterns of Soil Attributes and Components in a Mangrove System in Southeast Brazil (São Paulo). J. Soils Sediments 10 (6), 995–1006. doi:10.1007/s11368-010-0224-4
Field, C. B., Osborn, J. G., Hoffman, L. L., Polsenberg, J. F., Ackerly, D. D., Berry, J. A., et al. (1998). Mangrove Biodiversity and Ecosystem Function. Glob. Ecol. Biogeogr. Lett. 7 (1), 3–14. doi:10.2307/2997693
Foody, G. M. (2002). Status of Land Cover Classification Accuracy Assessment. Remote sensing Environ. 80 (1), 185–201. doi:10.1016/s0034-4257(01)00295-4
Fry, B., and Cormier, N. (2011). Chemical Ecology of Red Mangroves, Rhizophora Mangle, in the Hawaiian Islands. Pac. Sci. 65 (2), 219–234. doi:10.2984/65.2.219
Galitz, A., Nakao, Y., Schupp, P. J., Wörheide, G., and Erpenbeck, D. (2021). A Soft Spot for Chemistry-Current Taxonomic and Evolutionary Implications of Sponge Secondary Metabolite Distribution. Mar. Drugs 19 (8), 448. doi:10.3390/md19080448
Giri, C., Ochieng, E., Tieszen, L. L., Zhu, Z., Singh, A., Loveland, T., et al. (2011). Status and Distribution of Mangrove Forests of the World Using Earth Observation Satellite Data. Glob. Ecol. Biogeogr. 20 (1), 154–159. doi:10.1111/j.1466-8238.2010.00584.x
Gumusay, M. U., Bakirman, T., Tuney Kizilkaya, I., and Aykut, N. O. (2019). A Review of Seagrass Detection, Mapping and Monitoring Applications Using Acoustic Systems. Eur. J. Remote Sensing 52, 1–29. doi:10.1080/22797254.2018.1544838
Ha, N. T., Manley-Harris, M., Pham, T. D., and Hawes, I. (2020). A Comparative Assessment of Ensemble-Based Machine Learning and Maximum Likelihood Methods for Mapping Seagrass Using Sentinel-2 Imagery in Tauranga Harbor, New Zealand. Remote Sensing 12 (3), 355. doi:10.3390/rs12030355
Holben, B. N. (1986). Characteristics of Maximum-Value Composite Images from Temporal AVHRR Data. Int. J. Remote Sensing 7, 1417–1434. doi:10.1080/01431168608948945
Hossain, M. Z., Aziz, C. B., and Saha, M. L. (2012). Relationships between Soil Physico-Chemical Properties and Total Viable Bacterial Counts in Sunderban Mangrove Forests, Bangladesh. Dhaka Univ. J. Biol. Sci. 21 (2), 169–175. doi:10.3329/dujbs.v21i2.11515
Hu, T., Yang, J., Li, X., and Gong, P. (2016). Mapping Urban Land Use by Using Landsat Images and Open Social Data. Remote Sensing 8, 151. doi:10.3390/rs8020151
Inoue, T., Nohara, S., Matsumoto, K., and Anzai, Y. (2011). What Happens to Soil Chemical Properties after Mangrove Plants Colonize? Plant and soil 346 (1-2), 259. doi:10.1007/s11104-011-0816-9
Irons, J. R., Dwyer, J. L., and Barsi, J. A. (2012). The Next Landsat Satellite: The Landsat Data Continuity mission. Remote Sensing Environ. 122, 11–21. doi:10.1016/j.rse.2011.08.026
Jensen, J. R. (1996). Introductory Digital Image Processing: A Remote Sensing Perspective. Ed. 2. Prentice-Hall.
Jones, H. G. (2007). Monitoring Plant and Soil Water Status: Established and Novel Methods Revisited and Their Relevance to Studies of Drought Tolerance. J. Exp. Bot. 58 (2), 119–130. doi:10.1093/jxb/erl118
Kesgin, B., and Nurlu, E. (2009). Land Cover Changes on the Coastal Zone of Candarli Bay, Turkey Using Remotely Sensed Data. Environ. Monit. Assess. 157, 89–96. doi:10.1007/s10661-008-0517-x
Lacerda, M., Demattê, J., Sato, M., Fongaro, C., Gallo, B., and Souza, A. (2016). Tropical Texture Determination by Proximal Sensing Using a Regional Spectral Library and its Relationship with Soil Classification. Remote Sensing 8 (9), 701. doi:10.3390/rs8090701
Li, D., Lu, D., Wu, M., Shao, X., and Wei, J. (2018). Examining Land Cover and Greenness Dynamics in Hangzhou Bay in 1985–2016 Using Landsat Time-Series Data. Remote Sensing 10 (1), 32.
Loughland, R. A., SaengerLuker, P. G., LukerSaji, G. B., Siddiqui, K., Saji, B., Belt, M., et al. (2007). Changes in the Coastal Zone of Abu Dhabi Determined Using Satellite Imagery (1972-2003). Aquat. Ecosystem Health Management 10 (3), 301–308. doi:10.1080/14634980701512988
Marfai, M. A., Almohammad, H., Dey, S., Susanto, B., and King, L. (2008). Coastal Dynamic and Shoreline Mapping: Multi-Sources Spatial Data Analysis in Semarang Indonesia. Environ. Monit. Assess. 142, 297–308. doi:10.1007/s10661-007-9929-2
Milani, A. S. (2018). “Mangrove Forests of the Persian Gulf and the Gulf of Oman,” in Threats to Mangrove Forests (Cham: Springer), 53–75. doi:10.1007/978-3-319-73016-5_3
Mishra, S., Shrivastava, P., Shrivastava, P., and Dhurvey, P. (2017). Change Detection Techniques in Remote Sensing: A Review. Ijwmcis 4 (1), 1–8. doi:10.21742/ijwmcis.2017.4.1.01
Mohamed, H., Nadaoka, K., and Nakamura, T. (2018). Assessment of Machine Learning Algorithms for Automatic Benthic Cover Monitoring and Mapping Using Towed Underwater Video Camera and High-Resolution Satellite Images. Remote Sensing 10, 773. doi:10.3390/rs10050773
Moore, G. E., Grizzle, R. E., Ward, K. M., and Alshihi, R. M. (2015). Distribution, Pore-Water Chemistry, and Stand Characteristics of the Mangroves of the United Arab Emirates. J. Coastal Res. 314 (4), 957–963. doi:10.2112/jcoastres-d-14-00142.1
Pham, B. T., Prakash, I., and Tien Bui, D. (2018). Spatial Prediction of Landslides Using a Hybrid Machine Learning Approach Based on Random Subspace and Classification and Regression Trees. Geomorphology 303, 256–270. doi:10.1016/j.geomorph.2017.12.008
Pham, T., Yokoya, N., Bui, D., Yoshino, K., and Friess, D. (2019). Remote Sensing Approaches for Monitoring Mangrove Species, Structure, and Biomass: Opportunities and Challenges. Remote Sensing 11, 230. doi:10.3390/rs1102023010.3390/rs11030230
Polidoro, B. A., Carpenter, K. E., Collins, L., Duke, N. C., Ellison, A. M., Ellison, J. C., et al. (2010). The Loss of Species: Mangrove Extinction Risk and Geographic Areas of Global Concern. PLoS ONE 5, e10095–10. doi:10.1371/journal.pone.0010095
Poursanidis, D., Traganos, D., Reinartz, P., and Chrysoulakis, N. (2019). On the Use of Sentinel-2 for Coastal Habitat Mapping and Satellite-Derived Bathymetry Estimation Using Downscaled Coastal Aerosol Band. Int. J. Appl. Earth Observation Geoinformation 80, 58–70. doi:10.1016/j.jag.2019.03.012
Rainforth, T., and Wood, F. (2015). Canonical Correlation Forests. arXiv preprint. arXiv:1507.05444.
Raschka, S., and Mirjalili, V. (2019). Python Machine Learning: Machine Learning and Deep Learning with Python, Scikit-Learn, and TensorFlow 2. Packt Publishing Ltd.
Raschka, S. (2018). Model Evaluation, Model Selection, and Algorithm Selection in Machine Learning. arXiv preprint arXiv:1811.12808.
Running, S. W., Loveland, T. R., and Pierce, L. L. (1994). A Vegetation Classification Logic-Based on Remote-Sensing for Use in Global Biogeochemical Models. Ambio 23 (1), 77–81.
Saenger, P., Blasco, F., Yousseff, A. M. M., and Loughland, R. A. (2004). “Mangroves of the United Arab Emirates with Particular Emphasis on Those of Abu Dhabi Emirate,” in Marine Atlas of Abu Dhabi. Editors R. A. Loughland, F. S. Al Muhairi, S. S. Fadel, A. M. Al Mehdi, and P. Hellyer (Abu Dhabi: Emirates Heritage Club), 58–69.
Saha, S., and Choudhury, A. (1995). Vegetation Ana;ysis of Restored and Natural Mangrove forest in Sagar Island, Sundarbans, East Coast of India. J. Mar. Sci. 24, 133–136.
Shadmehri Toosi, A., Calbimonte, G. H., Nouri, H., and Alaghmand, S. (2019). River basin-scale Flood hazard Assessment Using a Modified Multi-Criteria Decision Analysis Approach: A Case Study. J. Hydrol. 574, 660–671. doi:10.1016/j.jhydrol.2019.04.072
Shahid, S. A., Abdelfattah, M. A., Wilson, M. A., Kelley, J. A., and Chiaretti, J. (2014). United Arab Emirates Keys to Soil Taxonomy. Springer. ISBN 978-94-007-7420-9.
Shepard, D. A. (1968). “Two-Dimensional Interpolation Function for Irregularly-Spaced Data,” in Proc. 1968 ACM Natl. Conf., 27. New York, 517–29524.August
Sherrod, C. L., and McMillan, C. (1985). The Distributional History and Ecology of Mangrove Vegetation along the Northern Gulf of Mexico Coastal Region.
Snedaker, S. C. (1982). “Mangrove Species Zonation: Why?,” in Contributions to the Ecology of Halophytes (Dordrecht: Springer), 111–125. doi:10.1007/978-94-009-8037-2_8
Stringer, C. E., Trettin, C. C., and Zarnoch, S. J. (2016). Soil Properties of Mangroves in Contrasting Geomorphic Settings within the Zambezi River Delta, Mozambique. Wetlands Ecol. Manage 24 (2), 139–152. doi:10.1007/s11273-015-9478-3
Sukardjo, S. (1994). Soils in the Mangrove Forests of the Apar Nature Reserve, Tanah Grogot, East Kalimantan, Indonesia. Southeast Asian Stud. 32, 385–398.
Traganos, D., and Reinartz, P. (2018). Interannual Change Detection of Mediterranean Seagrasses Using RapidEye Image Time Series. Front. Plant Sci. 9, 96. doi:10.3389/fpls.2018.00096
Ukpong, I. E. (1997). Vegetation and its Relation to Soil Nutrient and Salinity in the Calabar Mangrove Swamp, Nigeria. Mangroves and Salt Marshes 1 (4), 211–218. doi:10.1023/a:1009952700317
Upadhyay, V. P., and Mishra, P. K. (2008). Population Status of Mangrove Species in Estuarine Regions of Orissa Coast, India. Trop. Ecol. 49 (2), 183.
Vogelmann, J. E., Gallant, A. L., Shi, H., and Zhu, Z. (2016). Perspectives on Monitoring Gradual Change across the Continuity of Landsat Sensors Using Time-Series Data. Remote Sensing Environ. 185, 258–270. doi:10.1016/j.rse.2016.02.060
Keywords: UAE, mangrove, CCF model, remote sensing, Landsat, change detection, soil characterization
Citation: Elmahdy SI and Ali TA (2022) Monitoring Changes and Soil Characterization in Mangrove Forests of the United Arab Emirates Using the Canonical Correlation Forest Model by Multitemporal of Landsat Data. Front. Remote Sens. 3:782869. doi: 10.3389/frsen.2022.782869
Received: 24 September 2021; Accepted: 08 March 2022;
Published: 30 March 2022.
Edited by:
Hong Tang, Beijing Normal University, ChinaReviewed by:
Mohammed Oludare Idrees, University of Ilorin, NigeriaAlireza Sharifi, Shahid Rajaee Teacher Training University, Iran
Copyright © 2022 Elmahdy and Ali. This is an open-access article distributed under the terms of the Creative Commons Attribution License (CC BY). The use, distribution or reproduction in other forums is permitted, provided the original author(s) and the copyright owner(s) are credited and that the original publication in this journal is cited, in accordance with accepted academic practice. No use, distribution or reproduction is permitted which does not comply with these terms.
*Correspondence: Samy I. Elmahdy, c2VsbWFoZHlAYXVzLmVkdQ==