 Guoyong Wen
 Alexander Marshak
 Jay Herman1,3
95% of researchers rate our articles as excellent or good
Learn more about the work of our research integrity team to safeguard the quality of each article we publish.
Find out more
ORIGINAL RESEARCH article
Front. Remote Sens. , 02 May 2022
Sec. Atmospheric Remote Sensing
Volume 3 - 2022 | https://doi.org/10.3389/frsen.2022.777314
This article is part of the Research Topic DSCOVR EPIC/NISTAR: 5 years of Observing Earth from the first Lagrangian Point View all 24 articles
The annular solar eclipse on 21 June 2020 passed over desert areas (parts of Central and Eastern Africa, the southern Arabian Peninsula), partly cloudy regions (parts of South Asia and the Himalayas), and the mostly cloudy region in East Asia. Moving around the Earth-Sun Lagrange point 1 (L1), the Earth Polychromatic Imaging Camera (EPIC) instrument on the Deep Space Climate Observatory (DSCOVR) spacecraft captured three sets of images of the sunlit Earth during the eclipse, allowing us to study the impact of the solar eclipse on reflected solar radiation when the underlying surface and/or cloudy conditions in the Moon’s shadow are quite different. We analyzed EPIC images acquired during the 21 June 2020 and 21 August 2017 eclipses. We found that (1) EPIC-observed average spectral as well as spectrally averaged reflectance reductions of the entire sunlit Earth during the 21 June 2020 solar eclipse are distinctly different from those during the total solar eclipse of 21 August 2017; (2) the reduction of spectral reflectance depends strongly on underlying reflector properties, including the brightness, the area coverage of each reflector in the penumbra and the average distance to the center of the Moon’s shadow.
A rare but spectacular event in the Sun-Earth-Moon system, a solar eclipse occurs when the Moon moves between the Sun and Earth, casting a shadow on Earth and resulting in the reduction of the incident solar irradiance at the top-of-atmosphere (TOA). The Moon’s shadow consists of two parts: umbra and penumbra. The umbra is the Moon’s dark inner shadow, from where total solar eclipse is visible; the penumbra is the Moon’s faint outer shadow, from where partial solar eclipses are visible. Typically, the umbra is 100–160 km wide, while the penumbra diameter can be greater than 6,400 km. Thus, a solar eclipse has a strong impact on local solar radiation budget, particularly in and near umbra regions, and significant impact on global average solar radiation budget.
Over the past several decades, researchers have studied the impact of an eclipse on surface solar radiation from ground-based radiometer observations and radiative transfer simulations. Several ground-based radiation experiments and modeling activities have been carried out to understand radiation in solar eclipse conditions in the past. Sharp et al. (1971) reported that the sky light may be considered as attenuated sunlight up to at least 99.8% obscuration and the effect of multiple scattering from outside the umbral region dominates the sky brightness close to and during totality (e.g., Mikhalev et al., 1999; Zerefos et al., 2000). Shaw (1978) developed a model to compute sky radiance during a total solar eclipse by including first- and second-order scattering processes that would compute the diffused light scattered into the umbra. Koepke et al. (2001) studied surface spectral variation of the solar radiation during an eclipse, and Emde and Mayer (2007) performed a full 3D radiative transfer simulation of surface spectral solar radiance and irradiance change for cloudless atmosphere during a total eclipse on 29 March 2006, providing a benchmark for studying radiative transfer under solar eclipse conditions.
During the recent total eclipse on 21 August 2017, Bernhard and Petkov (2019) made surface spectral solar irradiance observations and performed 3D radiative transfer simulations; Ockenfuβ et al. (2020) further used 3D radiative transfer simulations for understanding the impact of surface spectral albedo, ozone vertical distribution and surrounding mountains on surface spectral irradiance observed by Bernhard and Petkov (2019); Wen et al. (2020) used ground-based pyranometer observations to estimate the impact of solar eclipse on surface broadband irradiance reduction; Calamas et al. (2018) studied the impact of the eclipse on surface irradiance and ambient temperature; and Eshelman et al. (2020) studied impact of total solar eclipse on all-sky polarization images. Gedzelman (2020) showed that the sunlit tops of cloud layers and arctic sea ice near the umbra appeared salmon-brown when viewed from airplanes or satellite during the 21 August 2017 as well as 2 July 2019 eclipse. Sarid et al. (2021) demonstrated the radiance reduction observed by Terra MODIS for several eclipse events. Madhavan and Venkat Ratnam (2021) studied the impact of a solar eclipse on surface radiation and photovoltaic energy.
One major impact of a solar eclipse is the reduction of the TOA input solar radiation, resulting in global and local reduction in incident and reflected solar radiation. Although the distribution of incoming solar radiation can be calculated with high accuracy, the global reduction of reflected solar radiation remained unknown until the 2015 launch of the Deep Space Climate Observatory (DSCOVR) satellite. For the first time, Herman et al. (2018a) used observations from the Earth Polychromatic Imaging Camera (EPIC) instrument to estimate the average reflectance reduction of the sunlit Earth disk. Flying onboard the DSCOVR satellite located near the Earth-Sun Lagrange point 1 (L1), about 1.5 million kilometers from the Earth and with a spacecraft-Earth-Sun angle varying from 2° to 12° (Marshak et al., 2018; Marshak et al., 2021), the EPIC instrument views the entire sunlit side of the Earth including the shadow of the Moon during a solar eclipse. Herman et al. (2018a) showed that the day-to-day variability of the disk average reflectance from EPIC image at similar UTC times is very small. Thus, the EPIC images taken at a similar UTC time from the day before or after can be used as a reference to estimate the eclipse-induced disk reflectance reduction.
Evidence shows that the brighter the atmosphere-surface under the Moon’s shadow, the larger the solar eclipse impact on the reflected solar radiation. Since the TOA reflectance depends on wavelength and underlying surface type and cloud amount, it is necessary to study the eclipse induced reflectance when the Moon’s shadow is over different atmosphere-surface conditions.
In this study, we use three sets of EPIC images acquired during the 21 June 2020 annular eclipse when the center of the Moon’s shadow was in the Arabian Peninsula, Himalayas, and Southwest China to quantify and understand the impact of the eclipse on the average reflectance reduction over the sunlit disk. We further compare the reflectance reductions during the 2020 eclipse with two sets of EPIC images acquired during the 2017 Great American eclipse over Casper, Wyoming and Columbia, Missouri where the surface reflective properties and cloud fraction differ significantly. In Section 2, we describe the EPIC data and methodology used in this study. The results are presented in Section 3 followed by the summary in Section 4.
We use EPIC observations to estimate the reduction of spectral solar irradiances during solar eclipses. EPIC is a 10-channel spectroradiometer onboard the DSCOVR spacecraft flying in a Lissajous orbit around the L1 point, where the combined gravitational pull of the Sun and Earth equals the centripetal force required for the spacecraft to move with them. The DSCOVR orbit has a period of 6 months, resulting in a spacecraft-Earth-Sun angle varying from 2° to 12°. This allows EPIC to view the Moon’s shadow in the sunlit disk of the Earth under eclipse conditions. EPIC consists of a 30-cm aperture Cassegrain telescope with a 0.62° field of view (FOV) encompassing the Earth that has a nominal size of 0.5° at the L1 point. EPIC provides 10 narrowband spectral images of the entire sunlit side of Earth using a 2048 × 2048 pixel charge-coupled device (CCD) detector every 65 min (in the Northern Hemisphere summer) to 111 min (in the Northern Hemisphere winter). The wavelengths range from ultraviolet (UV), to visible, to near infrared (NIR). The sampling size on the Earth is nominally ∼8 × 8 km2 at the center of the image with an effective spatial resolution of 12 × 12 km2 for the 443 nm channel when EPIC’s point spread function is considered. To reduce the downlink transmission time, the images for all wavelengths, except 443 nm, have been reduced to 1,024 × 1,024 pixels. A more detailed description of EPIC is given in Herman et al. (2018b) and Marshak et al. (2018).
In this study, we use EPIC level 1B (L1B) version 3 data distributed by the Atmospheric Science Data Center of NASA Langley Research Center (https://eosweb.larc.nasa.gov). The L1B digital counts multiplied by the after-launch wavelength dependent calibration coefficient (Geogdzhayev and Marshak, 2018; Herman et al., 2018b; Doelling et al., 2019; Geogdzhaev et al., 2021) yield TOA reflectance. While the EPIC images are geolocation processed (Blank et al., 2021), the L1B algorithm produces images in which all wavelengths are regridded to the same common grid, i.e., every pixel has the same geolocation (latitude and longitude) for all 10 wavelength channels.
Three sets of images were acquired by EPIC on 21 June 2020 when the center of the Moon’s shadow eclipse was in the Arabian Peninsula, Himalayas, and East Asia (Southwest of China). The surface and/or cloudy conditions in the Moon’s shadow are quite different. The Arabian Peninsula is a vast desert wilderness in Western Asia; the Himalayas are a mountain range in South and East Asia; and most of the surface in Southwest China is covered by vegetation. Most of the Arabian Peninsula was cloud free; the Himalayas were mostly; and Southwest China was mostly cloudy. Two sets of images were taken by EPIC during the 2017 eclipse when the totality was in Casper, Wyoming and Columbia, Missouri. The surrounding areas of the Casper site are mostly covered by grasslands; while the surrounding areas of the Columbia site are mostly covered by croplands. EPIC images during the 21 June 2020 and 21 August 2017 solar eclipses are presented in Figure 1. Information about EPIC images acquired during the two eclipses are described in Table 1. In this study, we analyze images at five nonabsorbing wavelengths at 388, 443, 551, 680, and 780 nm.
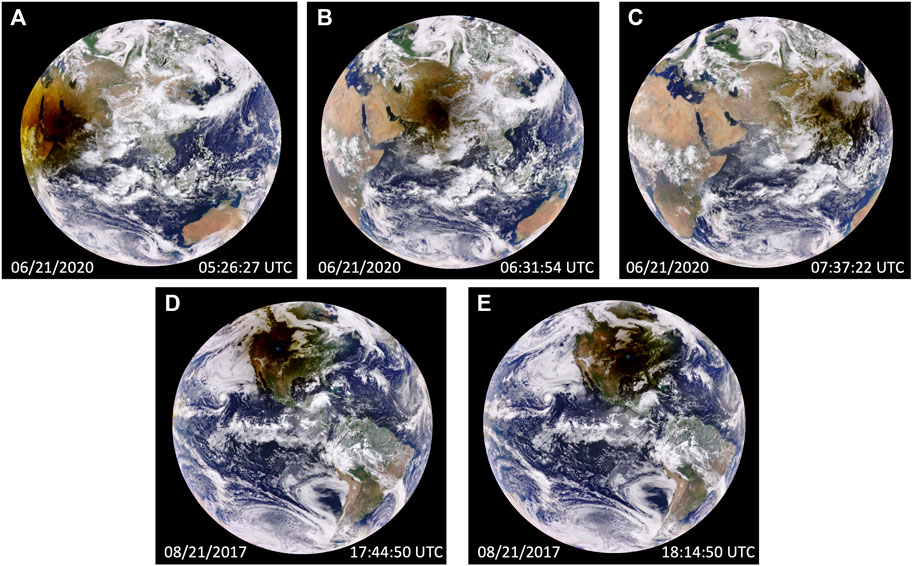
FIGURE 1. Three EPIC images taken during 21 June 2020 solar eclipse when the center of the Moon’s shadow was in (A) Arabian Peninsula, (B) Himalayas, and (C) Southwest China. Two EPIC images taken during 21 August 2017 when the center of the Moon’s shadow was in (D) Casper, Wyoming and (E) Columbia, Missouri.

TABLE 1. Eclipse measurement time and location of the center of the Moon’s shadow of five sets of EPIC images.
To understand the average reflectance reduction over the sunlit disk we need to quantify the contribution of different reflectors to the average reflectance reduction. Thus, we need to recover the image under hypothetical non-eclipse conditions from the image acquired during the eclipse. Initially, one needs to know the true input spectral solar irradiance for each EPIC image pixel when the part of the solar disk is covered by the Moon.
We know the brightness of the Sun’s disk decreases from its center to its edge, i.e., limb darkening. Here, we use the limb darkening function from Neckel (2005) based on McMath Solar Telescope and the large vertical spectrograph observations at the National Solar Observatory on Kitt Peak (Neckel and Labs, 1994) to compute the normalized solar irradiance relative to the irradiance at the center of the solar disk as a function of the radius of the Sun (Figure 2). Then, we follow Koepke et al. (2001) to compute the brightness of the Sun as a function of apparent Moon-Sun distance X, where X = 0 when the centers of the Moon and the Sun coincide,
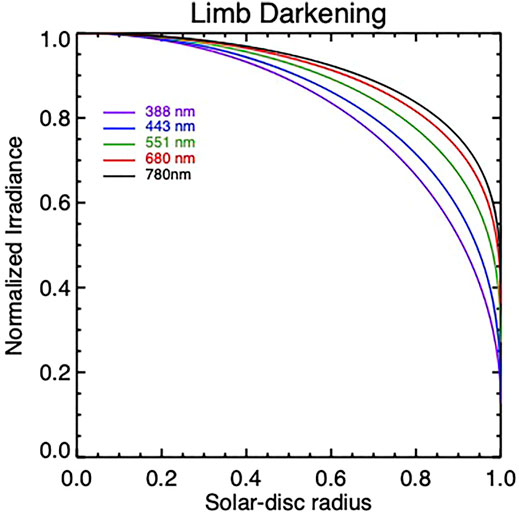
FIGURE 2. Limb darkening function based on Neckel (2005).
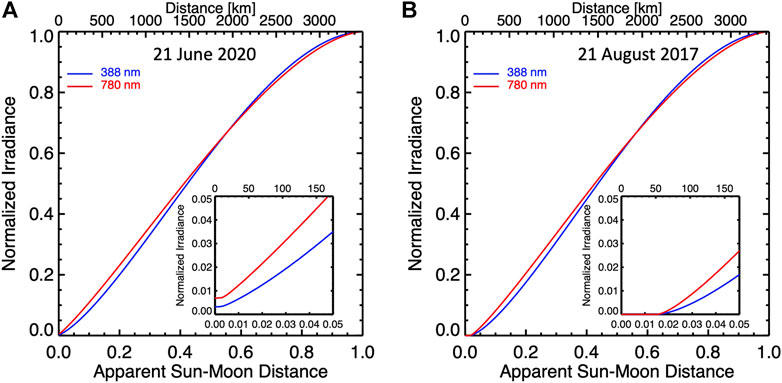
FIGURE 3. (A) Normalized solar irradiance as a function of apparent Sun-Moon distance in lower X-axis and the distance to the center of the Moon’s shadow in upper X-axis on the Earth for the 21 June 2020 eclipse; (B) similar to (A) but for the 21 August 2017 eclipse. The insets show details of the irradiance variation near the center of the eclipse.
Note the difference between the two normalized irradiances in Figure 3, due to different eclipse magnitudes of the two eclipses. Although the apparent sizes of the Sun and Moon as viewed from Earth are both about 0.5°, both vary because the Earth-Moon and Earth-Sun distances vary. The angular diameter of the Moon is about 3.1% larger than that of the Sun during the 21 August 2017 total eclipse, while the angular diameter of the Moon is about 0.6% smaller than that of the Sun during the 21 June 2020 annular eclipse. Thus, the normalized irradiances are greater than zero when the Sun and Moon coincide with apparent Sun-Moon distance of zero for the 2020 eclipse.
The distance between a pixel to the center of the Moon’s shadow can be estimated in an EPIC image. First, we need to estimate the pixel size in EPIC images. These are projections of the sunlit face of the Earth onto the focal plane of the 2048 × 2048 CCD array. With a 20-km altitude of atmosphere at the edge of the Earth, the Earth’s disk diameter in EPIC images is 12,782 km. The pixel size of an EPIC image is estimated by dividing the disk diameter by number of pixels across the diameter in the image. Second, the center of the Moon’s shadow changes a little from one image to another because the images are taken at slightly different times. We use the locations (latitude and longitude) of the center of Moon’s shadow at specific times as the first estimates (Table 1). Then, we search the images around the estimated locations to find the minimum value of reflectance to locate the center of the Moon’s shadow for each image. With both pixel size and the center of the Moon’s shadow available, the distance between a pixel in the penumbra and the center of the Moon’s shadow can be easily calculated. The distance is further multiplied by cosine of Sun-Earth-Vehicle (SEV) angle (Vehicle refers here to the DSCOVR spacecraft) to obtain the corresponding distance in the reference plane from which we calculate the normalized solar irradiance (Figure 3) for estimating the reflectance of the pixel under non-eclipse conditions as explained in the following paragraph. The SEV angle for each EPIC image is available at the DSCOVR/EPIC website (https://epic.gsfc.nasa.gov).
Within the Moon’s shadow, the digital counts multiplied by the calibration coefficient yields apparent reflectance (
where
where
and
where
Examples of the original and recovered images for the 2020 eclipse in the Arabian Peninsula and the 2017 eclipse in Casper, Wyoming are presented in Figures 4, 5, respectively.
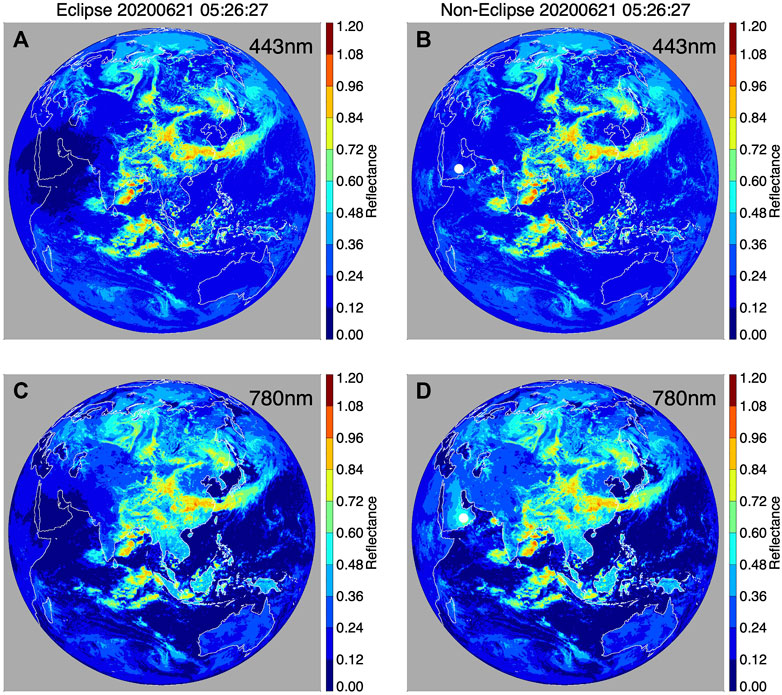
FIGURE 4. (A) EPIC image at 443 nm acquired during the 21 June 2020 eclipse when the center of the Moon’s shadow was in Arabian Peninsula; (B) the recovered image for hypothetical non-eclipse conditions for image in (A); (C) similar to (A) but for 780 nm; (D) similar to (B) but for 780 nm. The white circles in (B) and (D) are the center of the Moon’s shadow with a radius of about 170 km.
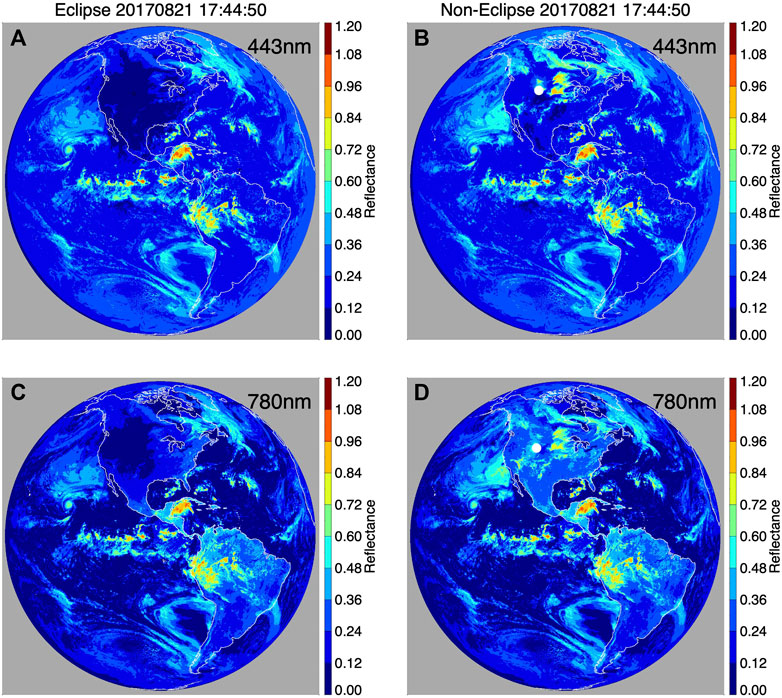
FIGURE 5. Similar to Figure 4 but for the 21 August 2017 solar eclipse when the center of the Moon’s shadow was in Casper, Wyoming.
From its center, the Moon’s shadow can extend large distances (∼3,000 km in radius). For that scale, both surface albedo and cloud cover can vary significantly. Thus, to understand the impact of a solar eclipse on the disk average reflectance, one needs to quantify the reflectance reduction from different reflector types. With the recovered image for non-eclipse conditions, we further apply Earth Reflector Type Index (ERTI) developed by Song et al. (2018) for classifying EPIC pixels into four dominant reflector types: clear ocean, clear land, clear green vegetation, and cloud. This method was used to study the blue and near-IR global spectral reflectance relationship as well as the response of global average reflectance to the change in cloud cover from EPIC observations (Wen et al., 2019). We do not separate clouds over land from clouds over ocean, though there are some differences in spectral reflectance between the two types of cloud. On average, cloud is the brightest of all wavelengths among the four dominant reflectors. Thus, dividing the image into four reflector types is sufficient for this study.
An important point is that the ERTI is sensitive to the presence of green leaves in a pixel and attributes the pixel to vegetation if the leaf area index (LAI) is larger than ∼0.5 (Song et al., 2018). The area of green leaves can exhibit strong seasonal variation from its maximum to a very low value (Samanta et al., 2012); therefore, one should distinguish between vegetated land according to a land cover classification map and actual presence of green leaves in the scene. For example, the ERTI classifies savannas in the southern part of Africa as vegetated land during wet season (mean LAI∼2.4 in March), and it attributes this land cover type as bare land during dry season (LAI can drop to ∼0.4 in August). We emphasize that the clear vegetation refers to cloud-free green vegetation, clear land includes dry vegetation and bare soil. In this study, we do not distinguish clouds over different surface types since the wavelength dependence of reflectance of cloud over ocean is similar to that over land (Figure 6). Though the reflectance from clouds over green vegetation has a very different wavelength-dependent signature, the coverage of green vegetation is quite small, less than 5% coverage of any EPIC images (Wen et al., 2019).
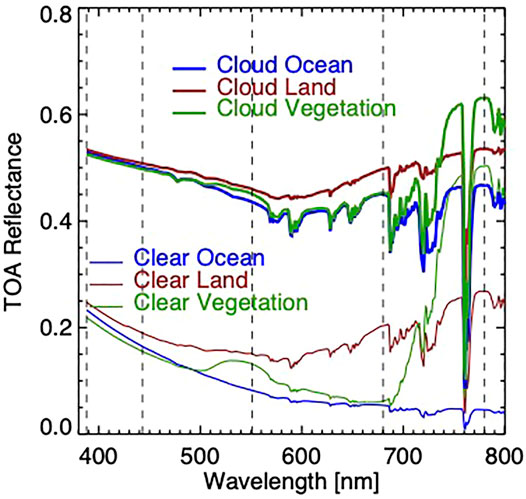
FIGURE 6. TOA spectral reflectance simulated using SBDART (Ricchiazzi et al., 1998) for clear and cloudy atmospheric conditions over ocean, land, and vegetation. The cloud optical depth is 10, and solar zenith angle is 30°. The vertical dashed lines indicate the EPIC wavelengths.
Recovering EPIC images for non-eclipse conditions is critical for understanding the reduction of spectral reflectance during a solar eclipse. Figures 4, 5 present original and recovered images for the blue-band at 443 nm and the near-IR band at 780 nm for the Arabian Peninsula and Casper, Wyoming during the 2020 and 2017 solar eclipses, respectively. Since both land surface and ocean are dark at 443 nm, the blue-band image can be used to examine the recovered cloud structure. For the Arabian Peninsula case, the clouds that were not visible in the eclipse image (Sudanian savanna to the west of the center of the Moon’s shadow) or less bright (to the east and southeast of the center of the Moon’s shadow) (Figure 4A) become visible and evidently brighter after the correction (Figure 4B). Comparing the recovered non-eclipse image with the RGB composite image (Figure 1A), we can see that the non-eclipse image has indeed recovered cloud features and enhanced the cloud visibility.
Since land surfaces are bright at 780 nm, the non-eclipse image can be used to examine the recovery of land surface as well as clouds. Under eclipse conditions, the entire Arabian Peninsula and the Sahara Desert in North Africa and part of West Asia were under the Moon’s shadow, thereby dark or even invisible in 780 nm image (Figure 4C). After the corrections, the Arabian Peninsula is clearly recovered, the Sahara Desert in North Africa and West Asia are recovered, and the coastlines and water bodies next to land (e.g., the Red Sea, the Persian Gulf, the Gulf of Oman, the Arabian Sea, and the Indian Ocean) are clearly visible in the non-eclipse image (Figure 4D). Similar to the blue-band, cloud structure in the near-IR image has been recovered or enhanced. Again, one can compare the non-eclipse image with the RGB composite image (Figure 1A) to see the recovery of land.
The original eclipse and non-eclipse images during the 2017 solar eclipse over Casper, Wyoming show the recovery of clouds and land after the corrections (Figure 5). It is interesting to see the cloud deck off the coast of California and the clouds in North America are much brighter in the non-eclipse images at both 443 and 780 nm bands (Figures 5B,D) compared to the eclipse images (Figures 5A,C). Clouds to the east of Casper that not clearly visible in the eclipse image are evidently recovered after the correction. In addition to clouds, the land of all North America is brighter at 780 nm in the corrected image compared to the original image.
With both eclipse and non-eclipse images, we estimate the eclipse-induced global reflectance reduction. The global average reflectance can be expressed as a sum of reflectance from each reflector component. Assuming there are N pixels and N1, N2, N3, … pixels for type 1, 2, 3, … reflector component (
where
where
or
or
where
The average reflectance (
Figure 7 shows the disk average spectral reflectance reduction and associated contribution from different reflector types when the center of the 21 June 2020 solar eclipse was in the Arabian Peninsula, the Himalayas, and Southwest China, respectively. For the Arabian Peninsula case (Figure 7A), the total disk reflectance reduction decreases from 388 to 551 nm followed by an increase to 780 nm. This feature is explained by the contribution from each reflector type. The land makes the largest contribution to the total reflectance reduction, followed by cloud and then ocean. Green vegetation makes little contribution to the disk average reflectance reduction.
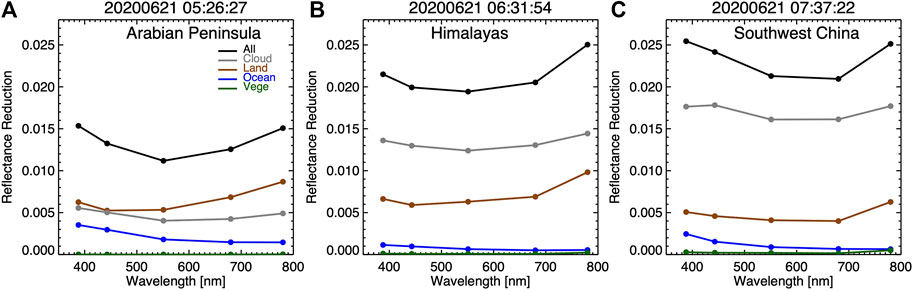
FIGURE 7. Disk average reflectance reduction with contributions from different reflector types for the 2020 solar eclipse when the center of the Moon’s shadow was in (A) Arabian Peninsula, (B) Himalayas, (C) Southwest China.
For the Himalayas case (Figure 7B), there is a small decrease in the average reflectance reduction from 388 to 551 nm followed by a larger increase in the reduction from 551 to 780 nm compared to the Arabian Peninsula case. Here, clouds make the largest contribution, about two thirds, to the disk average reflectance reduction. Land is the second largest contributor, and, though it is small, clear ocean contributes significantly at shorter wavelengths, and the associated reduction decreases rather quickly with wavelength. Again, green vegetation makes a minimal contribution to the average reflectance reduction.
For the Southwest China case (Figure 7C), the total reduction decreases with wavelength from 388 to 551 nm followed by a small decrease from 551 to 680 nm and a large increase from 680 to 780 nm. It is evident that clouds contribute the most, more than 70%, of the total reflectance reduction because a large area near the center of the Moon’s shadow is cloudy. Clear land contribution makes the second largest contribution to the total reflectance reduction since the clear land is less reflective than cloud over land and the clear land pixels being farther from the center of the Moon’s shadow contribute to the reflectance reduction. Clear ocean makes a significant contribution to the reflectance reduction. In all three 2020 eclipse cases, the contributions from green vegetation are small. The contribution from different reflector types explains the global reflectance reduction for three cases of EPIC-observed global reflectance reductions.
To interpret the reduction from each reflector, we present
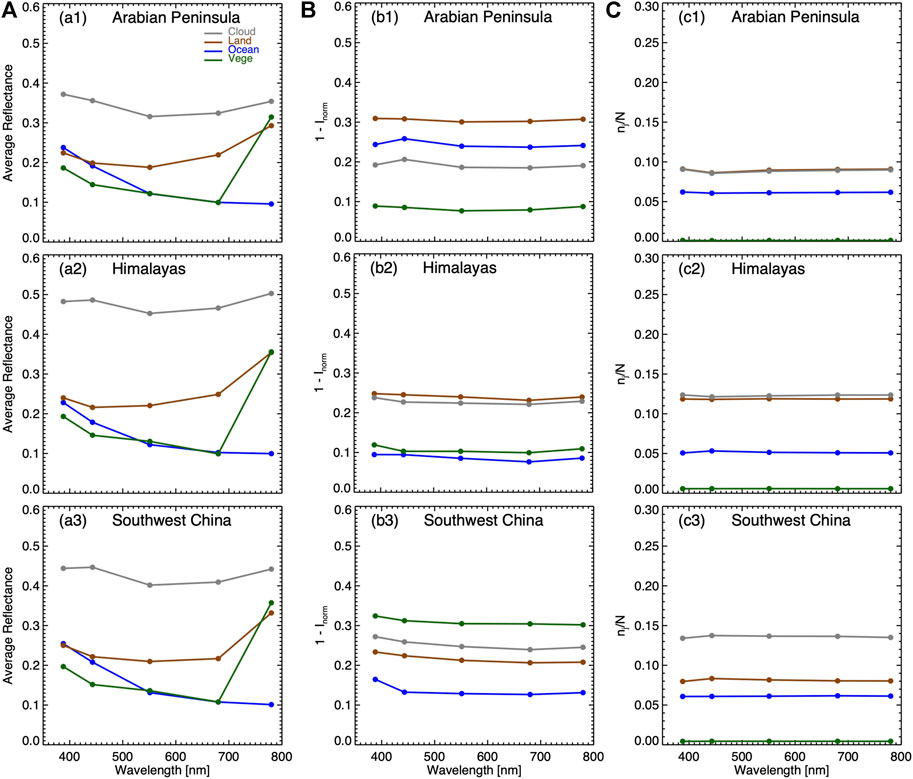
FIGURE 8. (a1–a3) the average reflectance; (b1–b3)
Now, we examine
For the Arabian Peninsula case, the factor of (Figure 8b1) is the largest for land followed by ocean, cloud, and green vegetation, respectively. The average normalized solar irradiance is about 0.69, 0.77, 0.81, and 0.92 for land, ocean, cloud, and green vegetation, respectively. Since the normalized solar irradiance monotonically increases with the distance from the center of the Moon’s shadow (see Figure 4), the smaller normalized solar irradiance corresponds to a closer distance from a reflector to the center of the Moon’s shadow. Thus, on average, land pixels, including desert and bare soil, are closest to the center of the Moon’s shadow followed by ocean, cloud, and green vegetation. In addition to the average solar irradiance, the number of pixels determines the collective contribution from each individual reflector type. Figure 8c1 shows that the ratio (
Indeed, from Figure 1, one could visualize the area size of each reflector and the average distance to the center of the Moon’s shadow for the 21 June 2020 eclipse. For the Arabian Peninsula case, the Arabian Desert in the Arabian Peninsula, the Sahara Desert in Northern Africa, and the Ogaden Desert in Eastern Africa occupy the largest areas close to the center of the Moon’s shadow. The Red Sea, the Persian Gulf, the Gulf of Oman, and the Arabian Sea are close to the center of the Moon’s shadow; however, those areas are much smaller than the deserts. The clear area of the Indian Ocean is large, but farther from the center of the Moon’s shadow. As a result, the average radial distance for land pixels to the center of the Moon’s shadow is smaller (smaller
For the Himalayas case (Figures 8b2,c2), the similar values of the factor
For the Southwest China case (Figures 8b3, c3), the factor
The contribution factor (
It is important to note that the reflectance reduction for Arabian Peninsula case is significantly smaller compared to the Himalayas and Southwest China cases, mainly because part of the Moon’s shadow falls outside of the Earth’s disk. The Moon’s shadow covers about 24% of the whole Earth disk, but a significant portion of the shadow falls outside of the Earth’s disk, compared to ∼28–30% for Himalayas and Southwest China cases (Table 2).
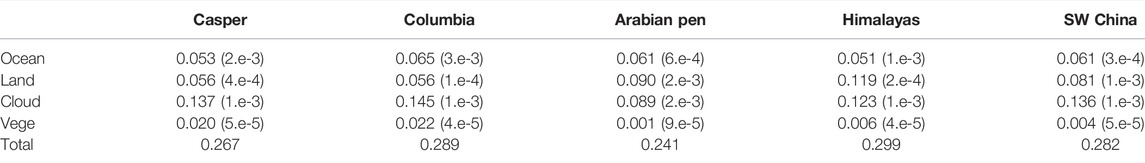
TABLE 2. The average fraction of area covered by different reflectors in the whole EPIC image (nj/N) and associated standard deviation for selected five wavelengths.
For the two cases of the 2017 eclipse (Figure 9), the average reflectance reductions are similar except for a decrease from 551 to 680 nm and a larger increase from 680 to 780 nm in reflectance reduction for the Columbia, Missouri case compared to the Casper, Wyoming case. Clouds contribute about 60 and 50% to the global spectral reflectance reduction, depending on wavelength, for the Casper and Columbia case, respectively. Clear land contributes about 30% to the global spectral reflectance reduction depending on wavelength for both cases. Clear ocean contribution for the Columbia case is larger than that for the Casper case since most clear ocean area is in the Atlantic Ocean to the east of the totality of the two eclipses (Figure 1). With the clear Atlantic Ocean areas are closer to Columbia than Casper, the contribution from clear ocean to the total reflectance reduction for the Columbia case is larger than Casper. Green vegetation makes a similar contribution to the reflectance for the two cases and a significant contribution to the disk reflectance reduction for the 2017 eclipse compared to the 2020 eclipse.
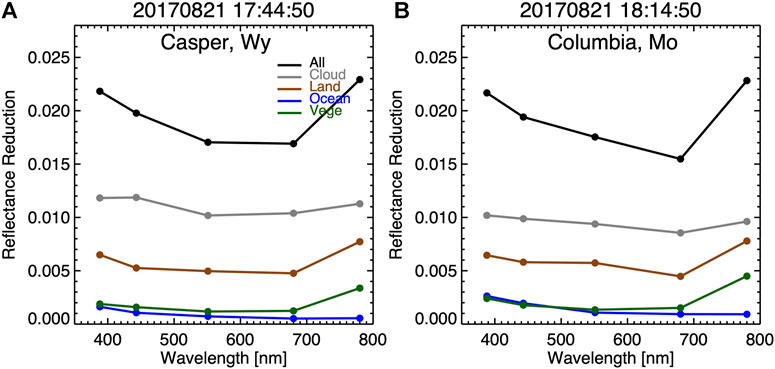
FIGURE 9. Similar to Figure 7 but the two cases during the 2017 solar eclipse.
As demonstrated in the 2020 eclipse, the reduction of spectral reflectance of each reflector for the 2017 eclipse is proportional to the average spectral reflectance in the Moon’s shadow (Figures 10a1,a2). The proportionality factor, or the contribution factor, is the product of
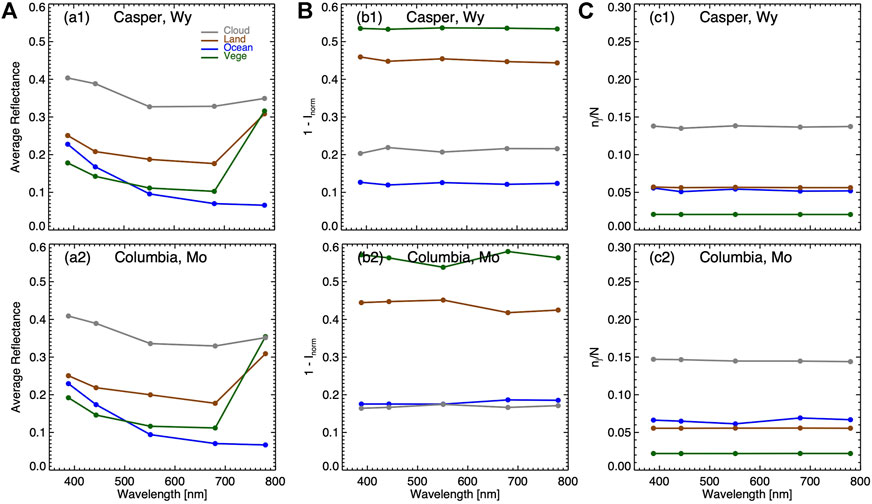
FIGURE 10. Similar to Figure 8 but for the two cases during the 2017 solar eclipse.
The relative spectral reflectance reductions (defined as the difference between non-eclipse and eclipse reflectance divided by the eclipse reflectance) and associated components from different reflectors are presented in Figure 11 and Figure 12 for the 2020 and 2017 eclipse cases, respectively. For the Arabian Peninsula case, the average percent reflectance reduction increases with wavelength with an average of ∼5.5%. The wavelength dependence of the percent reduction is mainly due to the increase of the reflectance from land compensated to some extent by the decrease of the reduction from clear ocean. For the Himalayas case, the average percent global reflectance reduction increases with wavelength with an average of ∼9%. The wavelength dependence of the percent reduction is due to the increase of the reduction with wavelength from cloud and clear land. Green vegetation contributes little to the average relative reflectance reduction for both the Arabian Peninsula and Himalayas cases. For the Southwest China case, the reflectance reduction increases from 388 to 551 nm followed by a slight decrease from 551 to 680 nm and small increase to 780 nm. The wavelength dependence of the relative reduction can be explained by the contribution from each individual reflector. The total average reduction of ∼9.5%, where cloud contributes over 7%, clear land contributes about 2%, and clear ocean contributes significantly at shorter wavelengths (∼1% at 388 nm) and decreases toward longer wavelengths. The contribution from green vegetation is visible particularly at 780 nm wavelength.
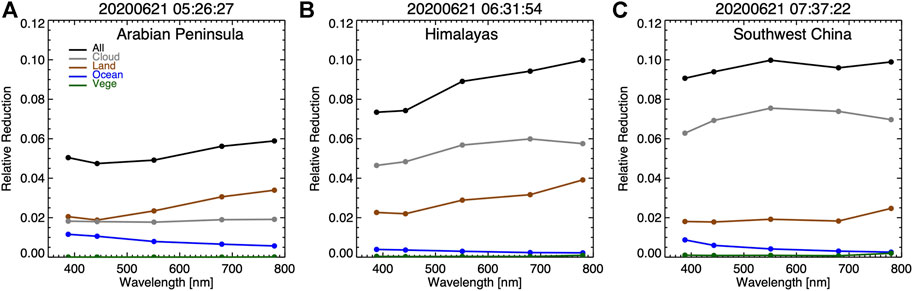
FIGURE 11. Relative global average reflectance reduction with contributions from different reflector types for 2020 eclipse when the center of the Moon’s shadow was in (A) Arabian Peninsula, (B) Himalayas, (C) Southwest China.
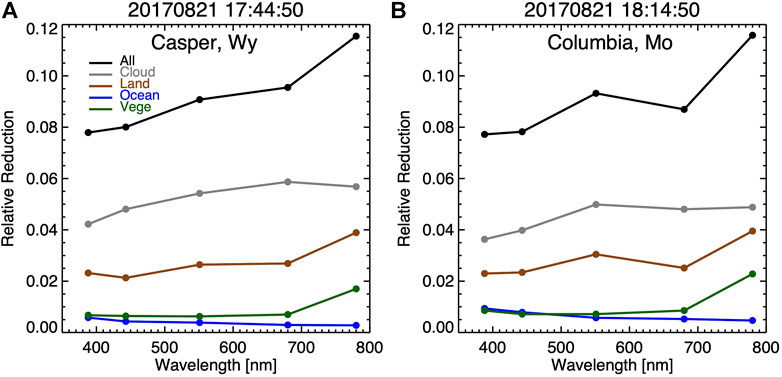
FIGURE 12. Relative disk average reflectance reduction with contributions from different reflector types for 2017 eclipse when the center of the Moon’s shadow was in (A) Casper, Wyoming, (B) Columbia, Missouri.
For the 2017 eclipse, the wavelength dependence of the average reflectance reduction for the Casper case is similar to that for the Columbia case and can be explained by the contribution from each reflector (Figure 12). Similar to the absolute reductions, for the Casper case, cloud makes the larger contributions compared to the Columbia case; land makes similar percent reduction for the two cases; ocean and green vegetation contributes slightly more percentage reductions for the Columbia case compared to the Casper case. The total average reduction is ∼9% for both cases.
The contribution from each reflector type to the disk and spectrally averaged percent reflectance reduction is summarized in Figure 13. For 2020 solar eclipse over Arabian Peninsula, clear land (mostly desert) makes the largest contribution to the reduction, followed by clouds and clear ocean. For both the Himalayas and Southwest China cases, clouds contribute the most to the reduction, followed by clear land and clear ocean. Green vegetation makes little contribution to the reflectance reduction. For 2017 solar eclipse, clouds make the largest contribution to the total reduction, followed by clear land, clear ocean, and green vegetation.
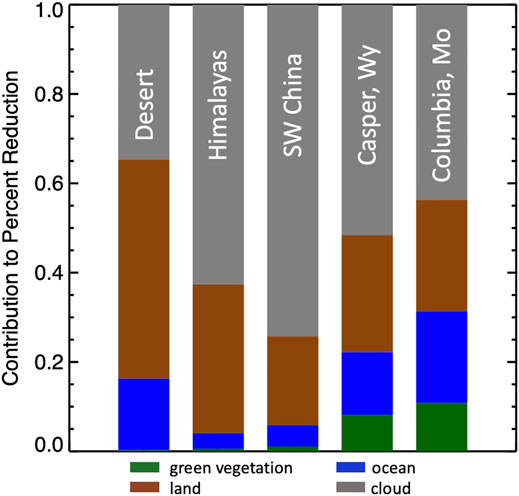
FIGURE 13. Summary of percentage contribution from different reflectors for the three cases during 2020 solar eclipse and two cases during 2017 solar eclipse.
We have analysed EPIC images to quantify and understand eclipse-induced disk spectral reflectance reduction. Radiative transfer calculations showed that different reflector types of the Earth have different spectral reflectance that affects the amount of eclipse radiances at TOA. The global reflectance reduction is the sum of the contribution from different reflectors. We showed that the reduction from each reflector is proportional to the average reflectance, the area coverage in the penumbra, and the average distance from the center of the Moon’s shadow.
Using calculated reduced brightness during eclipses, we recovered the EPIC images under hypothetical non-eclipse conditions from eclipse images. We further classified dominant reflector types based on the recovered non-eclipse images. We found that the average spectral reflectance reductions for the three cases during the 2020 eclipse differ significantly from each other and two cases during 2017 eclipse. The differences were explained by the difference in the brightness of underlying reflectors, the associated radial distances to the center of the Moon’s shadow as well as the area coverages in the Moon’s shadow.
We also quantified the percentage reductions. For the 2020 eclipse, the spectrally averaged relative reflectance reduction is ∼5.5%, ∼9%, and ∼9.5% for the Arabian Desert, Himalayas, Southwest China case, respectively, compared to ∼9% for the two cases for 2017 eclipse. The reflectance reductions from different reflectors were used to interpret the disk average spectral reflectance reduction.
Note that the global reflectance reduction for the Arabian Peninsula case is about 5%, significantly smaller than the other cases. This difference is mainly due to a large portion of the Moon’s shadow being outside of the Earth. Another factor is that desert is almost cloud-free and bright clouds farther away from the center of the Moon’s shadow do not contribute effectively to the average reflectance reduction compared to the other cases.
Publicly available datasets were analyzed in this study. This data can be found here: https://search.earthdata.nasa.gov/.
GW composed the majority of this manuscript with assistance from AM, JH, and DW. GW performed most of the analyses with the help from AM. This is a follow-up paper of our earlier work led by JH (Herman et al., 2018a).
The DSCOVR EPIC project is funded by NASA Earth Science Division. GW and JH research was supported by the DSCOVR Science Management Project.
The authors declare that the research was conducted in the absence of any commercial or financial relationships that could be construed as a potential conflict of interest.
All claims expressed in this article are solely those of the authors and do not necessarily represent those of their affiliated organizations, or those of the publisher, the editors and the reviewers. Any product that may be evaluated in this article, or claim that may be made by its manufacturer, is not guaranteed or endorsed by the publisher.
AM acknowledges support from the NASA’s DSCOVR Project. DW acknowledges support from the NASA’s TSIS Project.
Bernhard, G., and Petkov, B. (2019). Measurements of Spectral Irradiance during the Solar Eclipse of 21 August 2017: Reassessment of the Effect of Solar Limb Darkening and of Changes in Total Ozone. Atmos. Chem. Phys. 19, 4703–4719. doi:10.5194/acp-19-4703-2019
Blank, K., Huang, L.-K., Herman, J., and Marshak, A. A. (2021). Earth Polychromatic Imaging Camera Geolocation; Strategies to Reduce Uncertainty. Front. Remote Sens. 2, 715296. doi:10.3389/frsen.2021.715296
Calamas, D. M., Nutter, C., and Guajardo, D. N. (2018). Effect of 21 August 2017 Solar Eclipse on Surface-Level Irradiance and Ambient Temperature. Int. J. Energ. Environ. Eng. 10, 147–165. doi:10.1007/s40095-018-0290-8
Doelling, D., Haney, C., Bhatt, R., Scarino, B., and Gopalan, A. (2019). The Inter-calibration of the DSCOVR EPIC Imager with Aqua-MODIS and NPP-VIIRS. Remote Sens. 11, 1609. doi:10.3390/rs11131609
Emde, C., and Mayer, B. (2007). Simulation of Solar Radiation during a Total Eclipse: a challenge for Radiative Transfer. Atmos. Chem. Phys. 7, 2259–2270. doi:10.5194/acp-7-2259-2007
Eshelman, L. M., Tauc, M. J., Hashimoto, T., Gillis, K., Weiss, W., Stanley, B., et al. (2020). Digital All-Sky Polarization Imaging of the Total Solar Eclipse on 21 August 2017 in Rexburg, Idaho, USA. Appl. Opt. 59 (No. 21), F41–F52. doi:10.1364/AO/391736
Gedzelman, S. D. (2020). Solar Eclipse Skies and Limb Reddening. Appl. Opt. 59 (No. 21), F78–F84. doi:10.1364/AO.396964
Geogdzhaev, I. V., Marshak, A., and Alexandrov, M. (2021). Calibration of the DSCOVR EPIC Visible and NIR Channels Using Multiple LEO Radiometers. Front. Remote Sens 2. doi:10.3389/frsen.2021.671933
Geogdzhayev, I. V., and Marshak, A. (2018). Calibration of the DSCOVR EPIC Visible and NIR Channels Using MODIS Terra and Aqua Data and EPIC Lunar Observations. Atmos. Meas. Tech. 11, 359–368. doi:10.5194/amt-11-359-2018
Herman, J., Huang, L., McPeters, R., Ziemke, J., Cede, A., and Blank, K. (2018b). Synoptic Ozone, Cloud Reflectivity, and Erythemal Irradiance from Sunrise to sunset for the Whole Earth as Viewed by the DSCOVR Spacecraft from the Earth-Sun Lagrange 1 Orbit. Atmos. Meas. Tech. 11, 177–194. doi:10.5194/amt-11-177-2018
Herman, J., Wen, G., Marshak, A., Blank, K., Huang, L., Cede, A., et al. (2018a). Reduction in Earth Reflected Radiance during the Eclipse of 21 August 2017. Atmos. Meas. Tech. 11, 4373–4388. doi:10.5194/amt-11-4373-2018
King, M. D., Platnick, S., Menzel, W. P., Ackerman, S. A., and Hubanks, P. A. (2013). Spatial and Temporal Distribution of Clouds Observed by MODIS Onboard the Terra and Aqua Satellites. IEEE Trans. Geosci. Remote Sens. 51, 3826–3852. doi:10.1109/TGRS.2012.2227333
Koepke, P., Reuder, J., and Schween, J. (2001). Spectral Variation of the Solar Radiation during an Eclipse. metz 10, 179–186. doi:10.1127/0941-2948/2001/0010-0179
Madhavan, B. L., and Venkat Ratnam, M. (2021). Impact of a Solar Eclipse on Surface Radiation and Photovoltaic Energy. Solar Energy 223 (2021), 351–366. doi:10.1016/j.solener.2021.05.062
Marshak, A., Delgado-Bonal, A., and Knyazikhin, Y. (2021). The Effect of Scattering Angle on Earth Reflectance. Front. Remote Sens. 2. doi:10.3389/frsen.2021719610
Marshak, A., Herman, J., Adam, S., Karin, B., Carn, S., Cede, A., et al. (2018). Earth Observations from DSCOVR EPIC Instrument. Bull. Amer. Meteorol. Soc. (Bams) 99, 1829–1850. doi:10.1175/bams-d-17-0223.1
Mikhalev, A. V., Chernigovskaya, M. A., Beletsky, A. B., Kazimirovsky, E. S., and Pirog, O. M. (1999). Variations of the Ground-Measured Solar Ultraviolet Radiation during the Solar Eclipse on March 9, 1997. Adv. Space Res. 24 (5), 657–660. doi:10.1016/s0273-1177(99)00209-4
Neckel, H. (2005). Analytical Reference Functions F(λ) for the Sun’s Limb Darkening and its Absolute Continuum Intensities (λ 300 to 1100 Nm). Sol. Phys. 229, 13–33. doi:10.1007/s11207-005-4081-z
Neckel, H., and Labs, D. (1994). Solar Limb Darkening 1986–1990 (Lambda 303–1099 nm) 153, 1–2, 91–114. doi:10.1007/BF00712494
Ockenfuß, P., Emde, C., Mayer, B., and Bernhard, G. (2020). Accurate 3D Radiative Transfer Simulation of Spectral Solar Irradiance during the Total Solar Eclipse of August 21, 2017. Atmos. Chem. Phys. 20, 1961–1976. doi:10.5194/acp-20-1961-2020
Ricchiazzi, P., Yang, S., Gautier, C., and Sowle, D. (1998). SBDART: A Research and Teaching Software Tool for Plane-Parallel Radiative Transfer in the Earth's Atmosphere. Bull. Amer. Meteorol. Soc. 79 (10), 2101–2114. doi:10.1175/1520-0477(1998)079<2101:sarats>2.0.co;2
Samanta, A., Knyazikhin, Y., Xu, L., Dickinson, R. E., Fu, R., Costa, M. H., et al. (2012). Seasonal Changes in Leaf Area of Amazon Forests from Leaf flushing and Abscission. J. Geophys. Res. Biogeosciences 117 (G1). doi:10.1029/2011jg001818
Sarid, G., Twedt, K. A., and Xiong, X. (2021). “Terra MODIS Sees Solar Eclipses: Analysis of Reflective Solar Band Response at Multiple Radiance Levels,” in Proceedings of the SPIE 11727, Algorithms, Technologies, and Applications for Multispectral and Hyperspectral imaging XXVII, online only, United States, April 12–16, 2021, 1172701. doi:10.1117/12.2586219
Sharp, W. E., Silverman, S. M., and Lloyd, J. W. (1971). Summary of Sky Brightness Measurements during Eclipses of the Sun. Appl. Opt. 10, 1207–1210. doi:10.1364/AO.10.001207
Shaw, G. E. (1978). Sky Radiance during a Total Solar Eclipse: a Theoretical Model. Appl. Opt. 17, 272–278. doi:10.1364/ao.17.000272
Song, W., Knyazikhin, Y., Wen, G., Marshak, A., Mõttus, M., Yan, G., et al. (2018). Implications of Whole-Disc DSCOVR EPIC Spectral Observations for Estimating Earth’s Spectral Reflectivity Based on Low-Earth-Orbiting and Geostationary Observations. Remote Sens. 10, 1594. doi:10.3390/rs10101594
Trees, V., Wang, P., and Stammes, P. (2021). Restoring the Top-Of-Atmosphere Reflectance during Solar Eclipses: a Proof of Concept with the UV Absorbing Aerosol index Measured by TROPOMI. Atmos. Chem. Phys. 21, 8593–8614. doi:10.5194/acp-21-8593-2021
Wen, G., Marshak, A., Song, W., Knyazikhin, Y., Mõttus, M., and Wu, D. (2019). A Relationship between Blue and Near‐IR Global Spectral Reflectance and the Response of Global Average Reflectance to Change in Cloud Cover Observed from EPIC. Earth Space Sci. 6, 1416–1429. doi:10.1029/2019ea000664
Wen, G., Marshak, A., Tsay, S.-C., Herman, J., Jeong, U., Abuhassan, N., et al. (2020). Changes in the Surface Broadband Shortwave Radiation Budget during the 2017 Eclipse. Atmos. Chem. Phys. 20, 10477–10491. doi:10.5194/acp-20-10477-2020
Keywords: eclipse, DSCOVR/EPIC, solar radiation, cloud, surface
Citation: Wen G, Marshak A, Herman J and Wu D (2022) Reduction of Spectral Radiance Reflectance During the Annular Solar Eclipse of 21 June 2020 Observed by EPIC. Front. Remote Sens. 3:777314. doi: 10.3389/frsen.2022.777314
Received: 15 September 2021; Accepted: 08 April 2022;
Published: 02 May 2022.
Edited by:
Hartmut Boesch, University of Leicester, United KingdomReviewed by:
Yolanda Shea, Langley Research Center, United StatesCopyright © 2022 Wen, Marshak, Herman and Wu. This is an open-access article distributed under the terms of the Creative Commons Attribution License (CC BY). The use, distribution or reproduction in other forums is permitted, provided the original author(s) and the copyright owner(s) are credited and that the original publication in this journal is cited, in accordance with accepted academic practice. No use, distribution or reproduction is permitted which does not comply with these terms.
*Correspondence: Guoyong Wen, R3VveW9uZy5XZW5AbmFzYS5nb3Y=
Disclaimer: All claims expressed in this article are solely those of the authors and do not necessarily represent those of their affiliated organizations, or those of the publisher, the editors and the reviewers. Any product that may be evaluated in this article or claim that may be made by its manufacturer is not guaranteed or endorsed by the publisher.
Research integrity at Frontiers
Learn more about the work of our research integrity team to safeguard the quality of each article we publish.